A surface proton antenna in carbonic anhydrase II supports lactate transport in cancer cells
- University of Kaiserslautern, Germany
- University of Veterinary Medicine Hannover, Germany
Figures
Figure 1 with 3 supplements
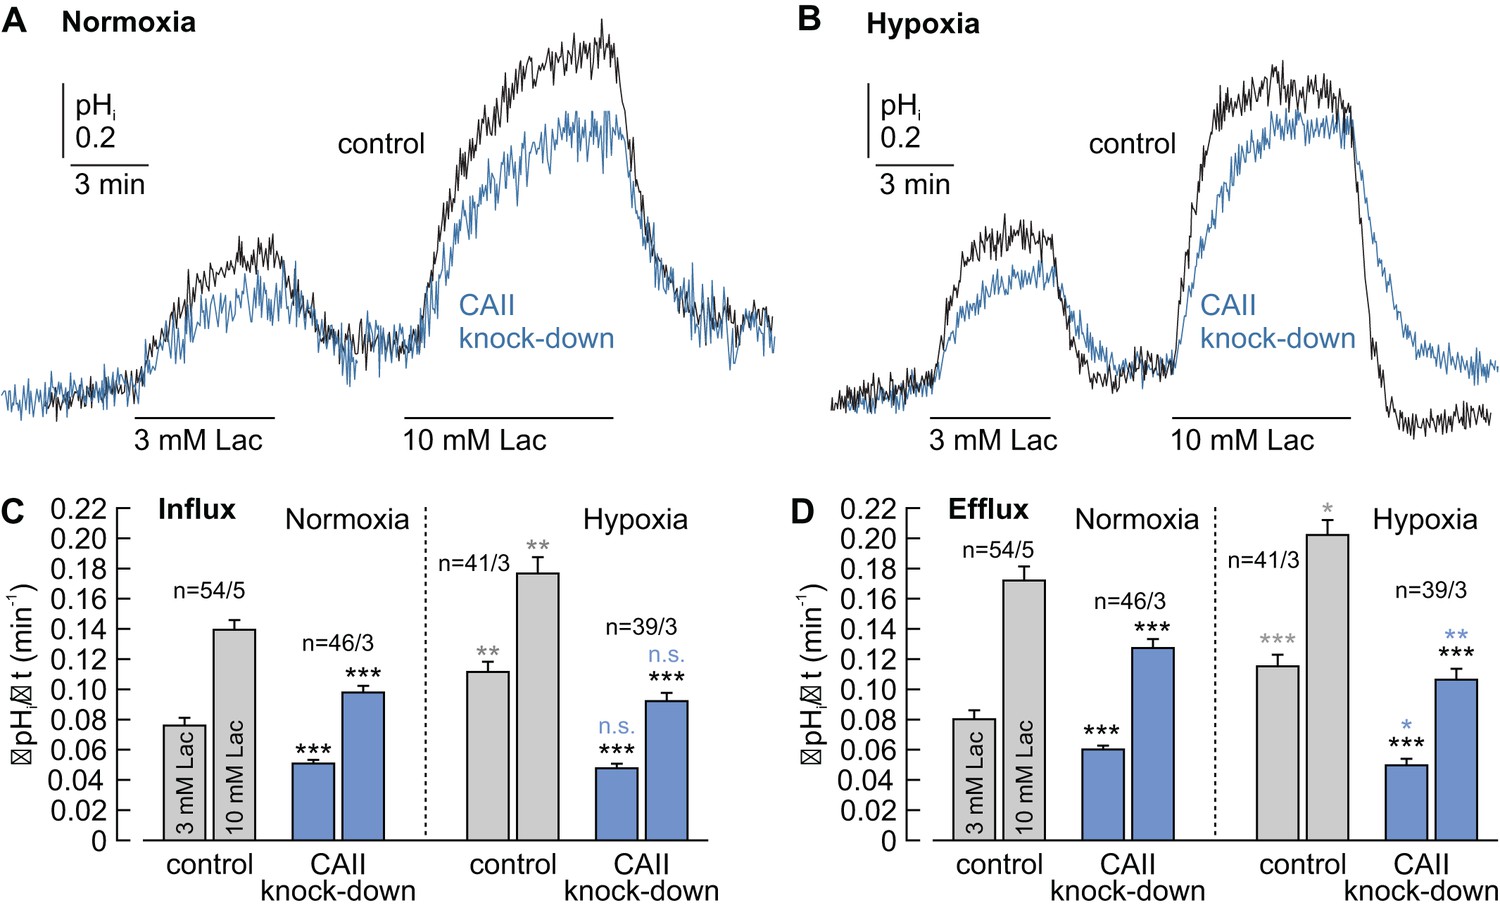
CAII facilitates lactate-induced proton flux in MCF-7 breast cancer cells.
(A, B) Original recordings of lactate-induced changes in intracellular pH (pHi) in normoxic (A) and hypoxic (B) MCF-7 breast cancer cells treated with either negative control siRNA (control, black traces) or CAII-siRNA (CAII knockdown, blue traces). (C, D) Rate of change in intracellular pH (ΔpHi/Δt) during the application (C) and withdrawal (D) of lactate in normoxic and hypoxic MCF-7 breast cancer cells treated with either negative control siRNA or CAII-siRNA (mean +SEM). Knockdown of CAII results in a significant reduction of lactate-induced pH change under both normoxic and hypoxic conditions. The black asterisks above the bars for CAII knockdown cells refer to the corresponding bars of the control cells. The blue and gray significance indicators above the bars for hypoxic cells refer to the corresponding bars of normoxic cells. *p≤0.05, **p≤0.01, ***p≤0.001, n.s. no significance; Student’s t-test.
-
Figure 1—source data 1
Original dataset for Figure 1.
- https://doi.org/10.7554/eLife.35176.006
Figure 1—figure supplement 1
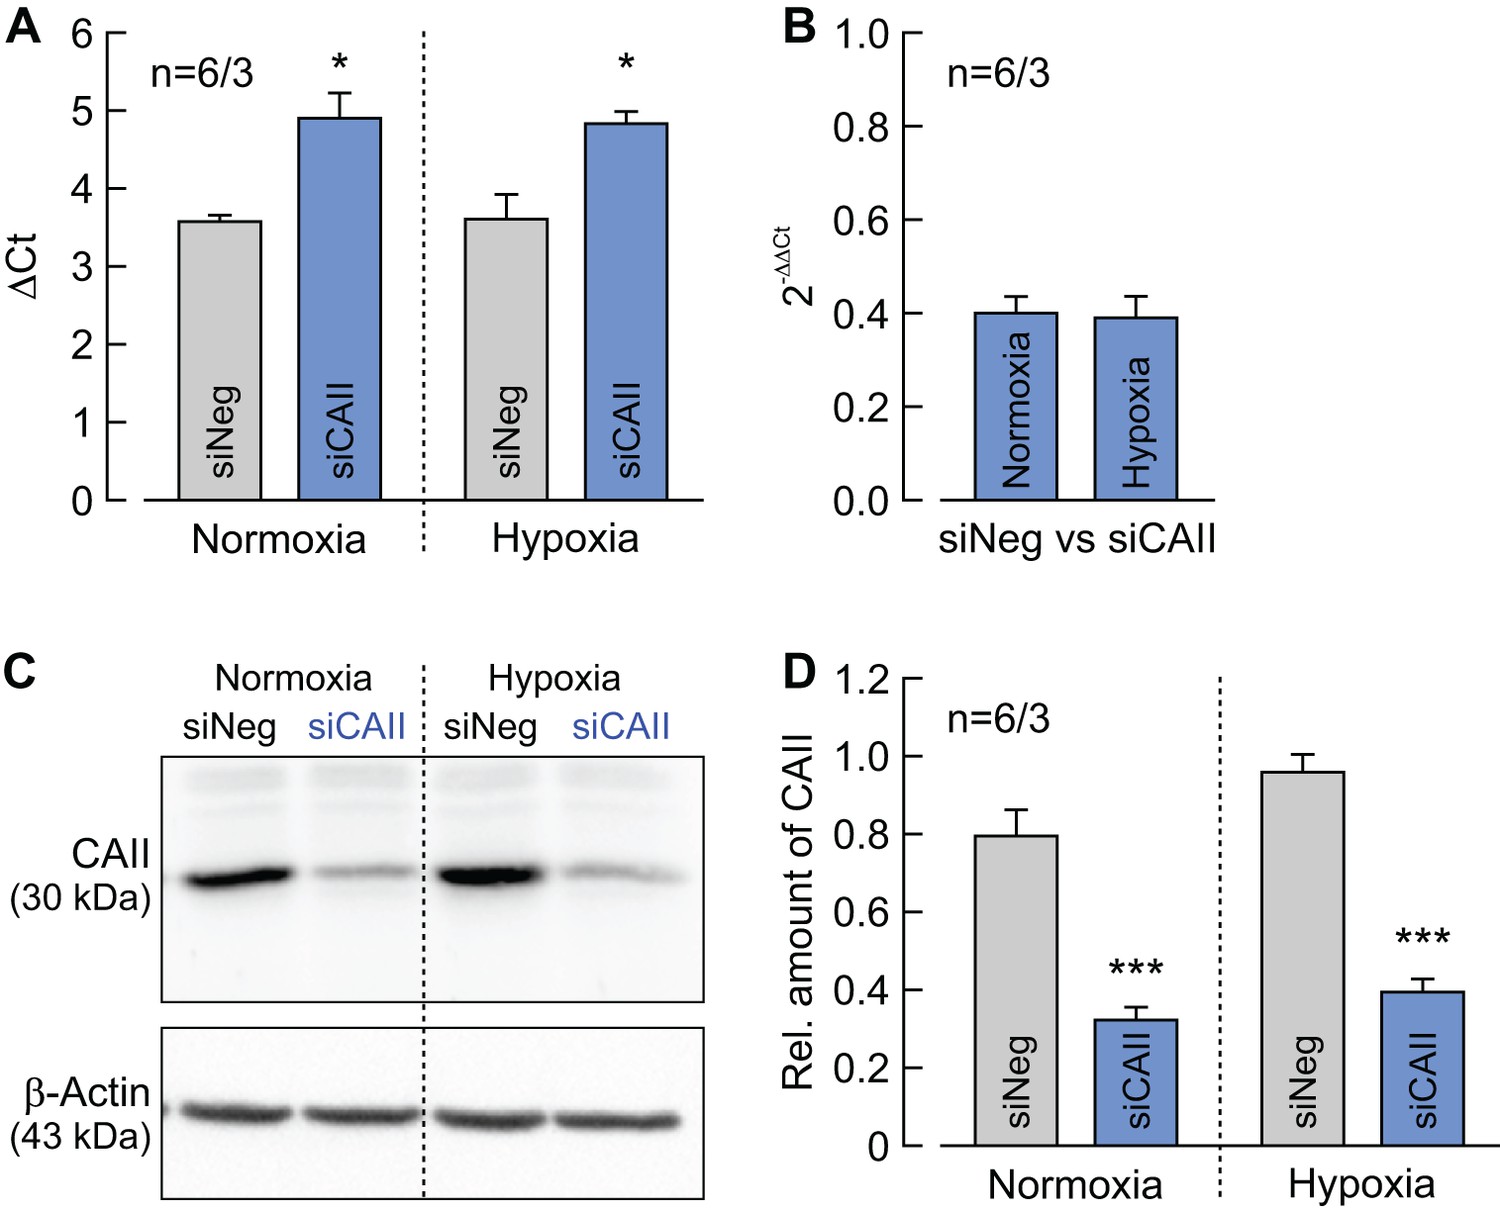
Determination of CAII knockdown efficiency in MCF-7 cells.
(A) ΔCt values for CAII minus RPL27 of normoxic and hypoxic MCF-7 cells, treated with siRNA against CAII (blue bars) or non-targeting negative control siRNA (gray bars) (mean +SEM). *p≤0.05; Student’s t-test. (B) Relative change in the RNA level of CAII as given by the 2–ΔΔCt values for CAII in normoxic and hypoxic MCF-7 cells treated with siRNA against CAII compared to cells treated with non-targeting negative control siRNA (mean +SEM). (C) Representative western blot for CAII (upper panel) and β-actin (lower panel) from normoxic and hypoxic MCF-7 cells, treated with siRNA against CAII or non-targeting negative control siRNA. (D) Relative intensity of the fluorescent signal for CAII, normalized to the signal intensity of β-actin in the same probe (mean +SEM). The significance indicators above the bars for siCAII refer to the values of siNeg. ***p≤0.001; Student’s t-test.
Figure 1—figure supplement 2
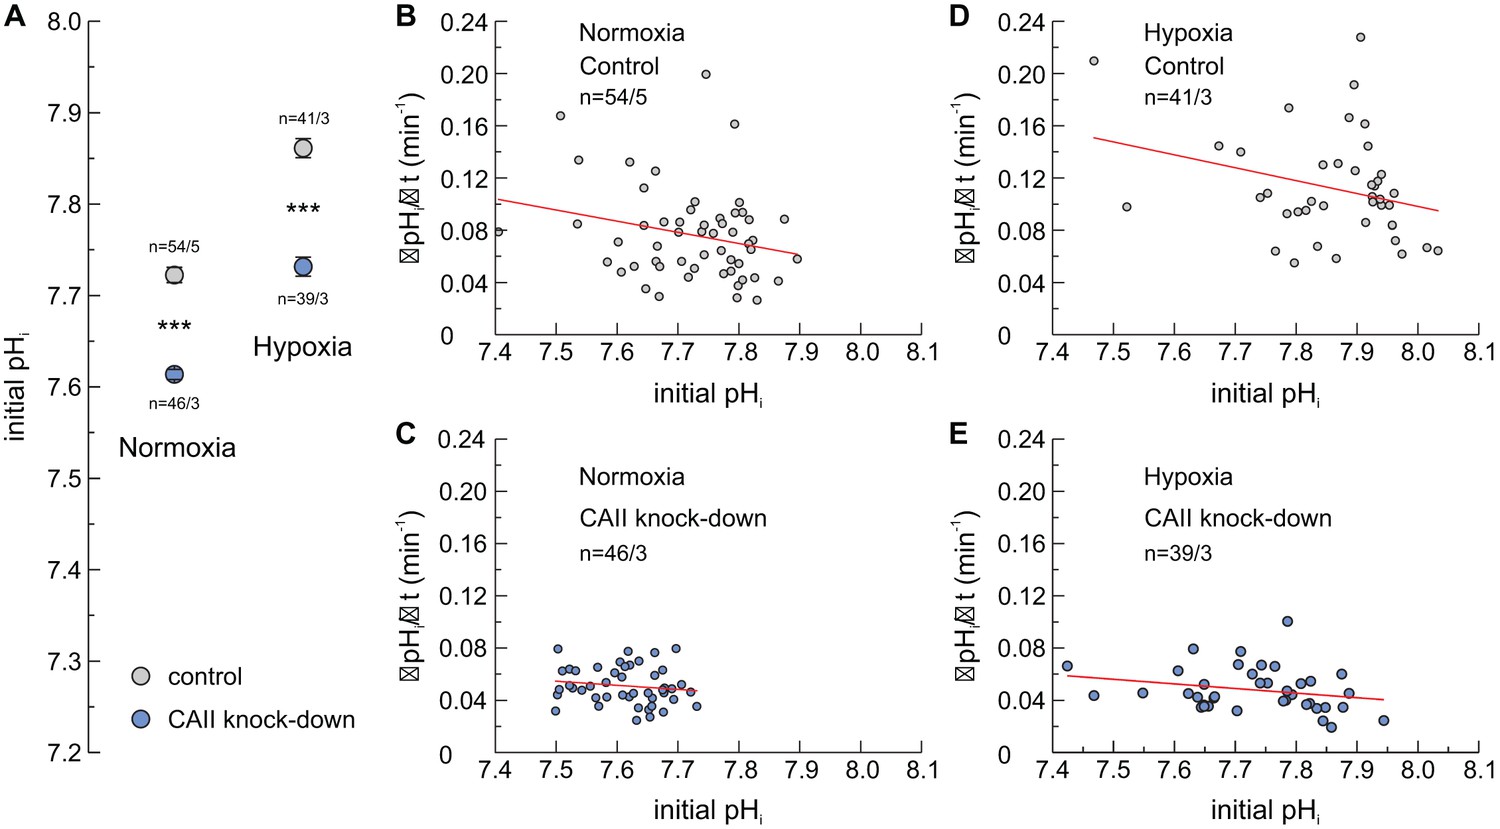
Influence of pHi on lactate transport.
(A) Initial intracellular pH (pHi), as measured at the beginning of the experiment, of normoxic (left column) and hypoxic (right column) MCF-7 cells, treated with siRNA against CAII (blue) or non-targeting negative control siRNA (gray) (mean ± SEM). ***p≤0.001; Student’s t-test. (B–E) ΔpHi/Δt during application of 3 mM lactate to normoxic (B, C) and hypoxic (D, E) MCF-7 cells, treated with either negative control siRNA (B, D) or CAII-siRNA (C, E), as shown in Figure 1B, plotted against the cells initial pHi. Every dot represents one individual cell. The red lines represent linear regression fits.
Figure 1—figure supplement 3
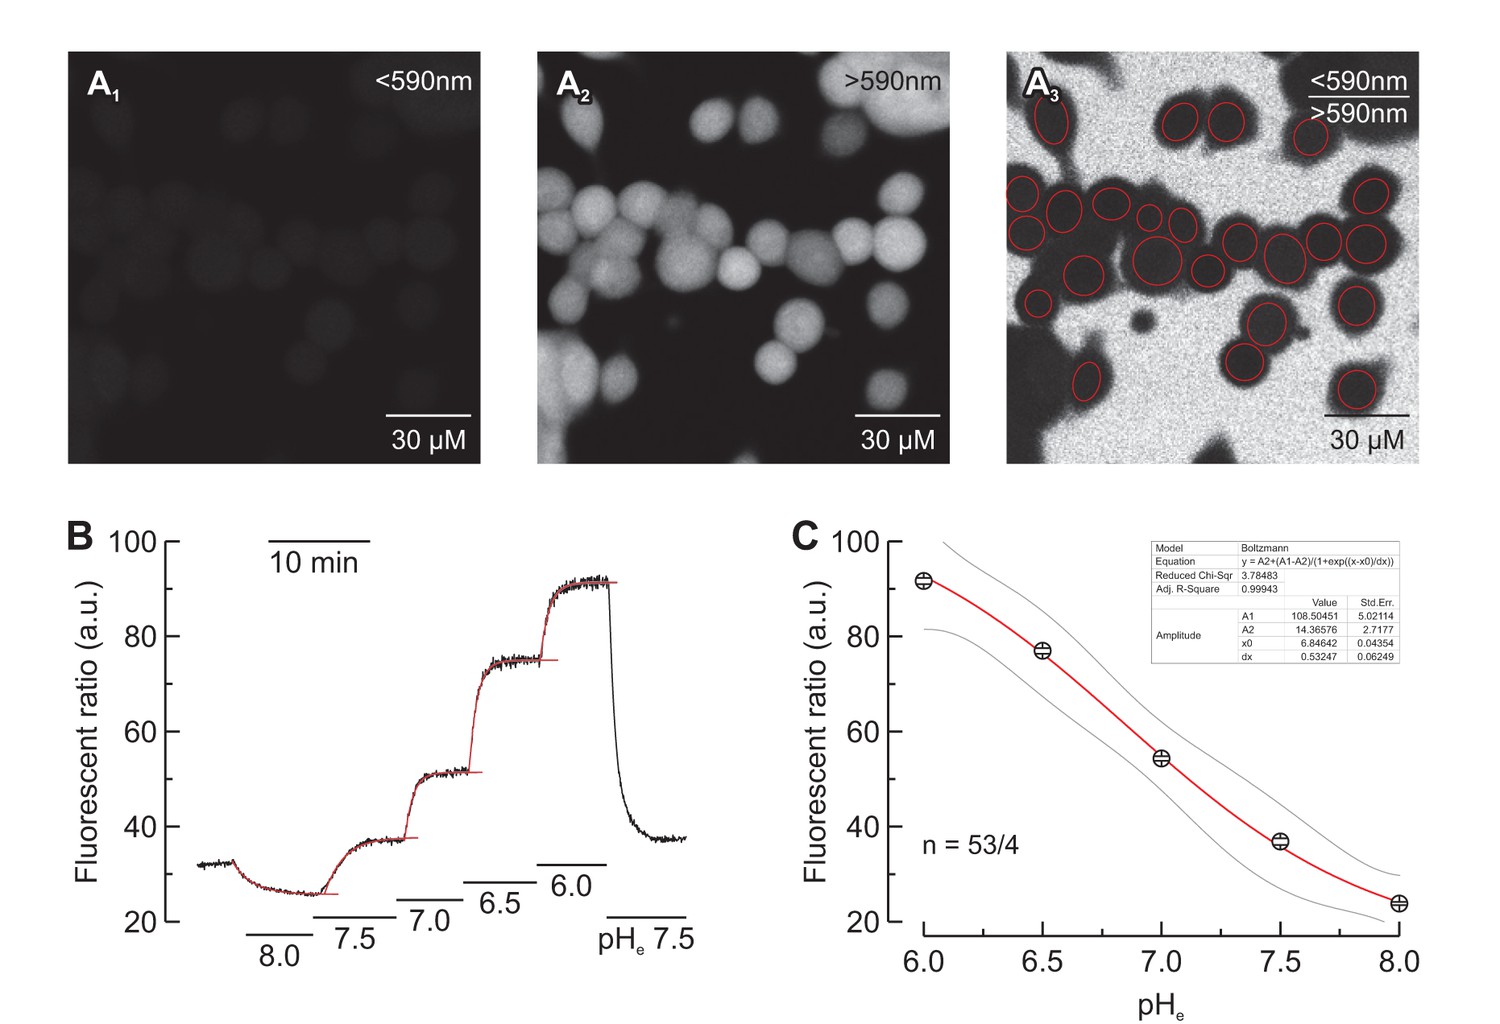
Calibration of SNARF-5 in MCF-7 cells.
(A) Confocal images of MCF-7 cells, loaded with SNARF-5. (A1) Signal of the emission fraction below 590 nm. (A2) Signal of the emission fraction above 590 nm. (A3) Signal of the emission fraction below 590 nm divided by the signal of the emission fraction above 590 nm. (B) Calibration of the fluorescence ratio in the presence of nigericin and 130 mM K+, at pH 8.0, 7.5, 7.0, 6.5 and 6.0. An exponential equation was used to calculate the maximum steady state for each pH application, as indicated by the red traces. Gray traces indicate the confidence bands (at the 95% confidence level). (C) Fluorescent ratio plotted against the extracellular pH (mean ± SEM). A Boltzmann fit (red) was used to calculate the parameters of conversion (inset). Gray traces indicate the confidence bands (at the 95% confidence level). pH values are calculated as .
Figure 2
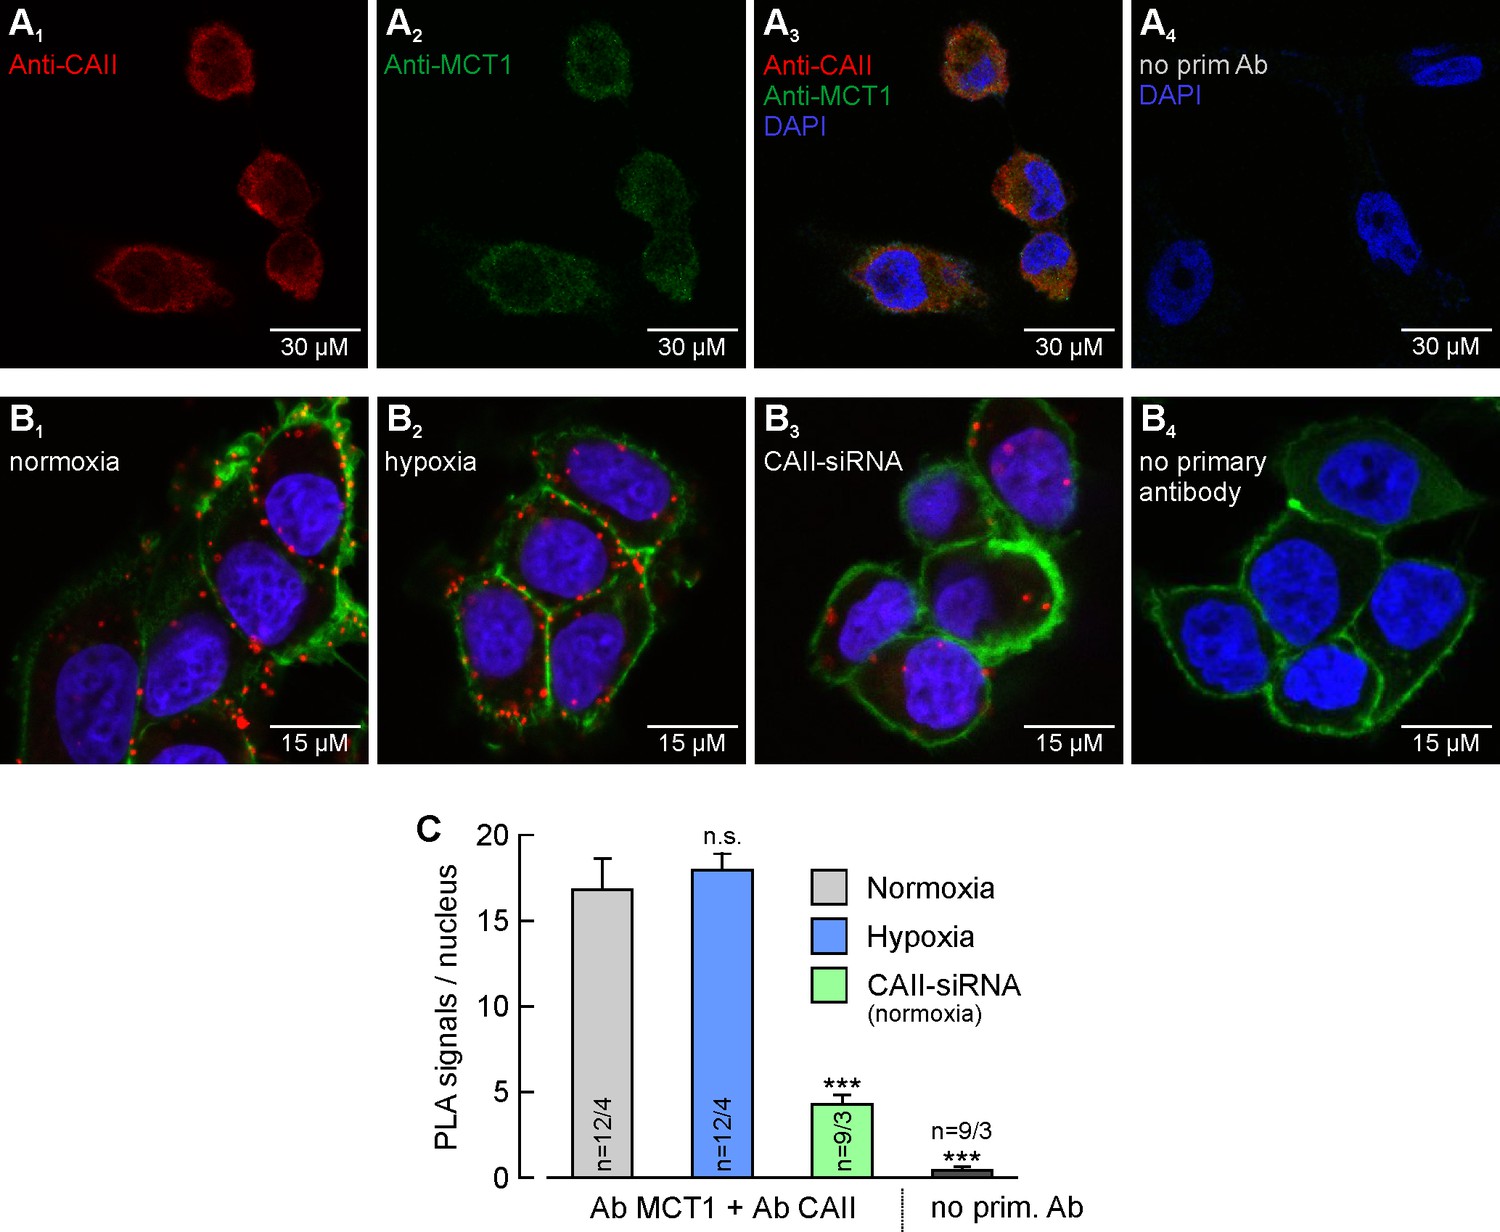
MCT1 and CAII are co-localized in MCF-7 breast cancer cells.
(A) Antibody staining of CAII (A1) and MCT1 (A2) in MCF-7 cells. (A3) Overlay of the fluorescence signals for MCT1 (red), CAII (green) and the nuclei marker DAPI (blue). The specificity of the primary antibodies was tested by incubating MCF-7 cells only with secondary antibodies (A4). (B) In situ proximity ligation assay (PLA) of MCT1 and CAII in MCF-7 breast cancer cells, incubated under normoxia (B1) and hypoxia (B2), respectively, and normoxic MCF-7 cells in which CAII was knocked down using siRNA (B3). The red dots indicate co-localization of MCT1 and CAII with a maximum distance of <40 nm. (B4) Negative control of an in situ PLA without primary antibodies. For better visualization of the cells, F-actin was stained with fluorescence-labelled phalloidin (green). (C) Quantification of the PLA signals, shown as signals per nucleus (mean +SEM). The significance indicators above the bars refer to the values of the PLA for normoxic cells. ***p≤0.001, n.s. no significance; Student’s t-test.
-
Figure 2—source data 1
Original dataset for Figure 2.
- https://doi.org/10.7554/eLife.35176.008
Figure 3
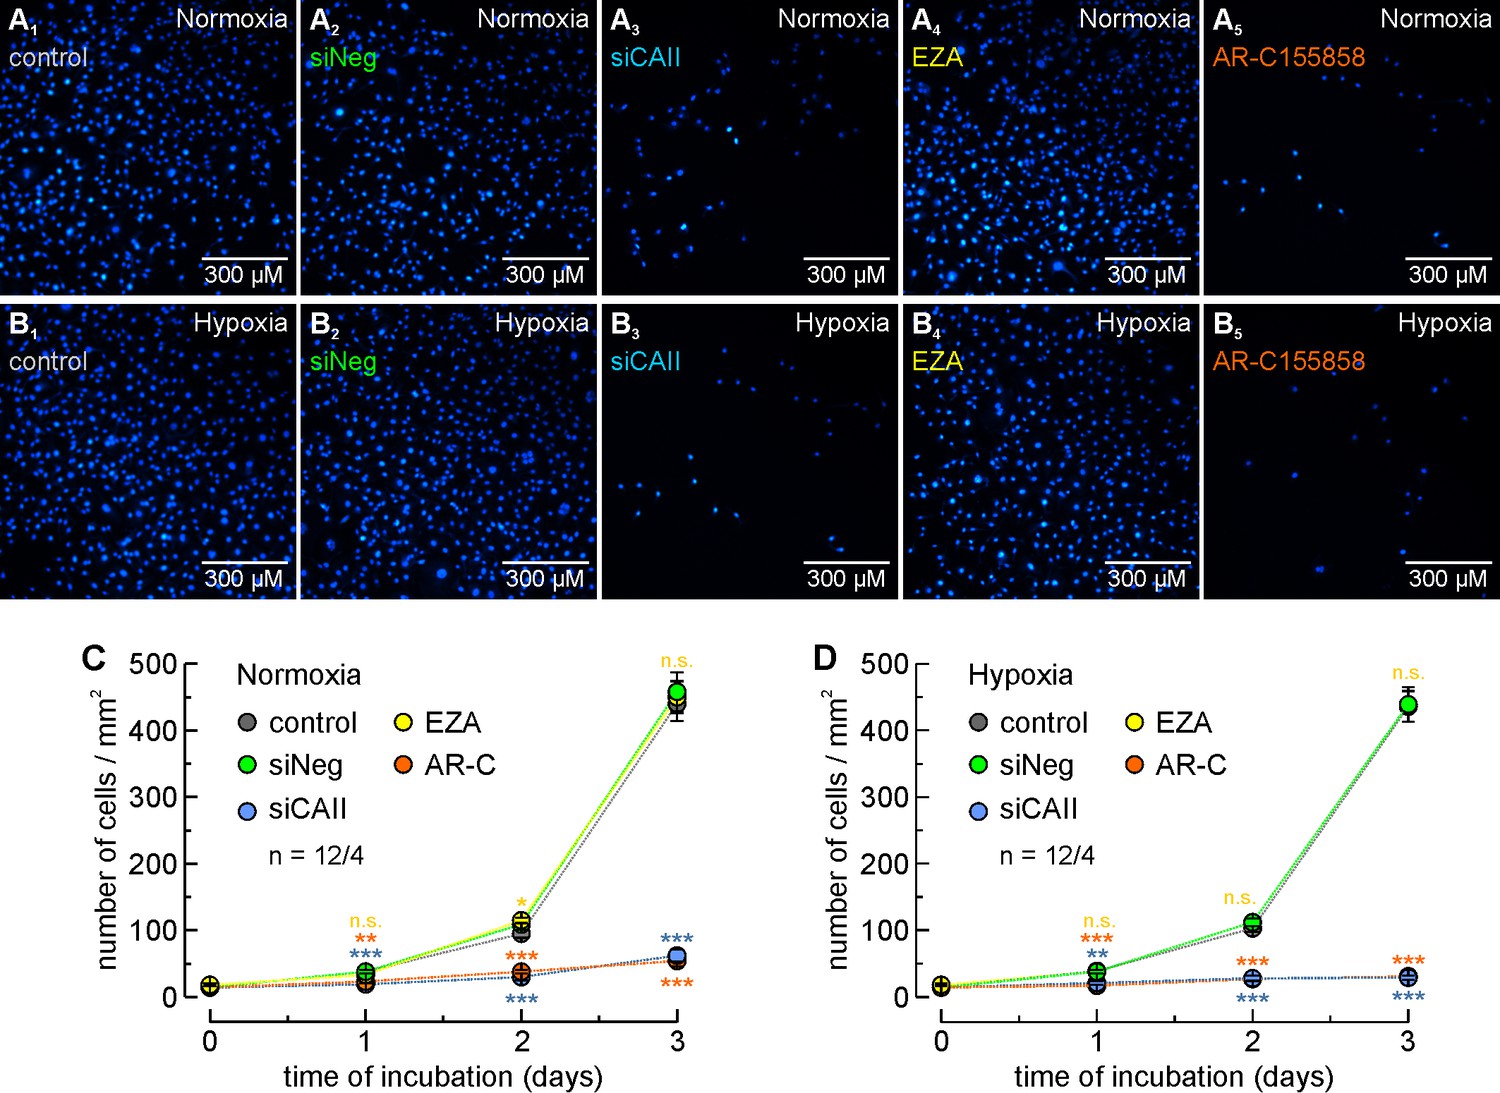
CAII supports proliferation of MCF-7 breast cancer cells.
(A, B) Staining of nuclei with Hoechst 33342 (blue) in MCF-7 cells after 3 days in culture under normoxic (A) or hypoxic (B) conditions. Cells were untreated (control; A1, B1), mock-transfected with non-targeting negative control siRNA (siNeg; A2, B2), transfected with siRNA against CAII (siCAII; A3, B3), incubated with 30 µM of the CA inhibitor EZA (A4, B4), or incubated with 300 nM of the MCT1 inhibitor AR-C155858 (A5, B5). (C, D) Total number of nuclei/mm2 in normoxic (C) and hypoxic (D) MCF-7 cell cultures, kept for 0–3 days under the conditions described for (A) and (B). For every data point, four dishes of cells were used and three pictures were taken from each dish at random locations, yielding 12 pictures/data points (n = 12/4). The blue asterisks indicate significance in differences between siCAII and siNeg, the orange asterisks between control and AR-C155858, and the yellow significance indicators between control and EZA. *p≤0.05, **p≤0.01, ***p≤0.001, n.s. no significance; Student’s t-test.
-
Figure 3—source data 1
Original dataset for Figure 3.
- https://doi.org/10.7554/eLife.35176.010
Figure 4 with 2 supplements
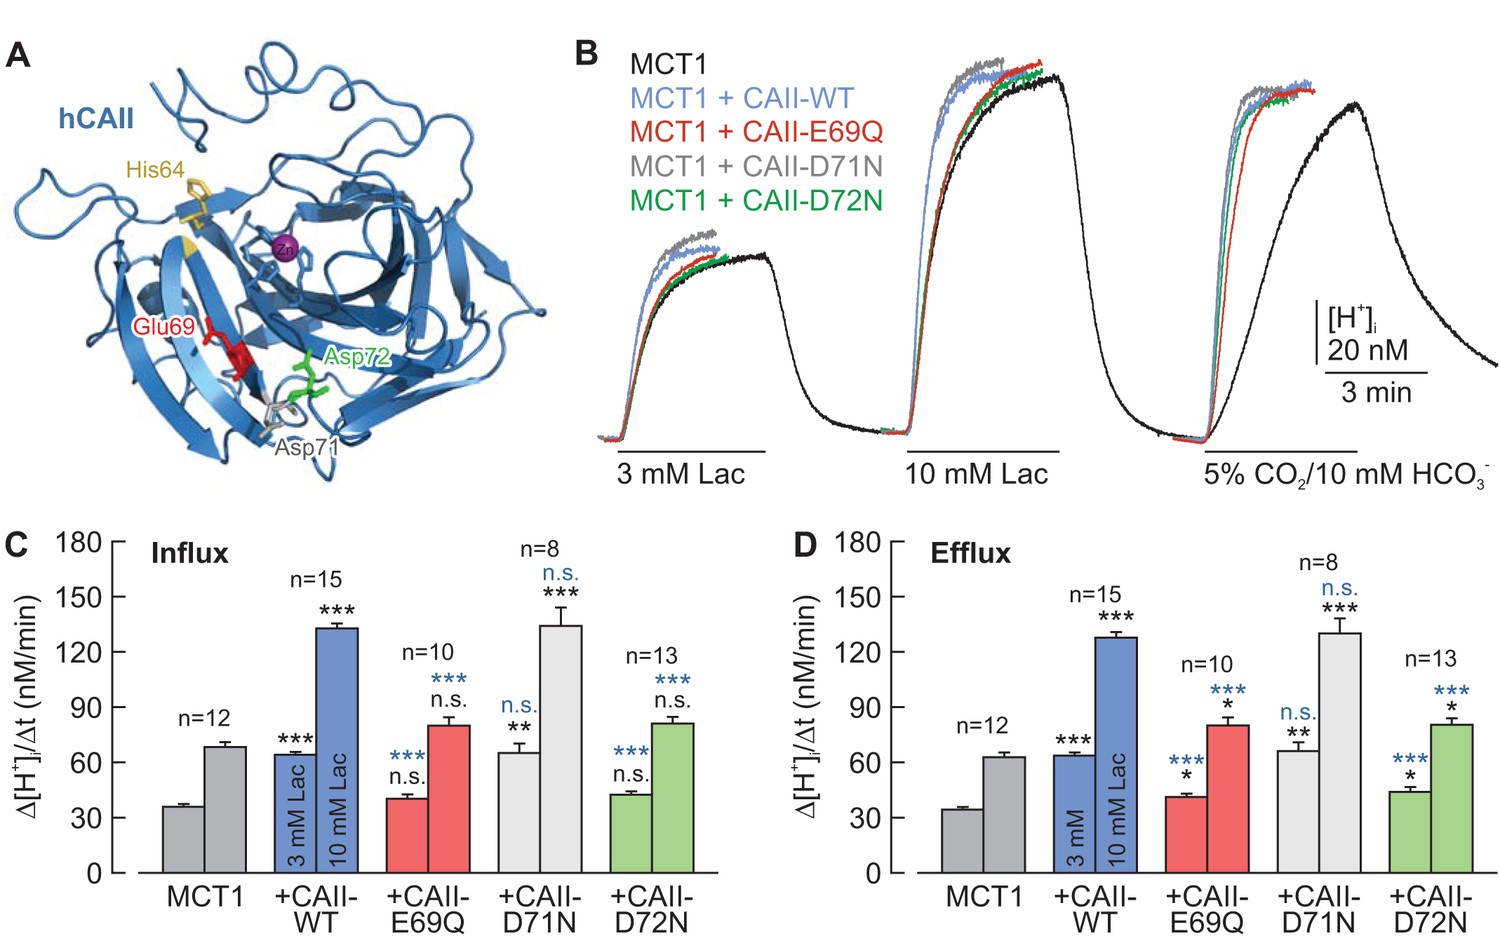
CAII-Glu69 and Asp72 are crucial for the facilitation of MCT1 transport activity.
(A) Structural model of human CAII (PDB-ID: 2CBA; Håkansson et al., 1992). Glu69 and Asp72, which have been suggested to form a proton-collecting antenna, are labelled in red and green, respectively. The adjacent Asp71 is labelled in gray. His64, the central residue of the intramolecular proton shuttle, is labelled in yellow. (B) Original recordings of the change in intracellular H+ concentration in oocytes expressing MCT1 (black trace), MCT1 +CAII-WT (blue trace), MCT1 +CAII-E69Q (red trace), MCT1 +CAII-D71N (gray trace), and MCT1 +CAII-D72N (green trace), during the application of 3 and 10 mM of lactate and of 5% CO2 and 10 mM HCO3–. (C, D) Rate of change in intracellular H+ concentration (Δ[H+]/Δt) as induced by the application (C) and removal (D) of 3 and 10 mM lactate, respectively, in oocytes expressing MCT1 (dark gray), MCT1 +CAII-WT (blue), MCT1 +CAII-E69Q (red), MCT1 +CAII-D71N (light gray), and MCT1 +CAII-D72N (green) (mean +SEM). The black significance indicators refer to MCT1, the blue significant indicators refer to MCT1 +CAII-WT. *p≤0.05, **p≤0.01, ***p≤0.001, n.s. no significance; Student’s t-test.
-
Figure 4—source data 1
Original dataset for Figure 4.
- https://doi.org/10.7554/eLife.35176.014
Figure 4—figure supplement 1
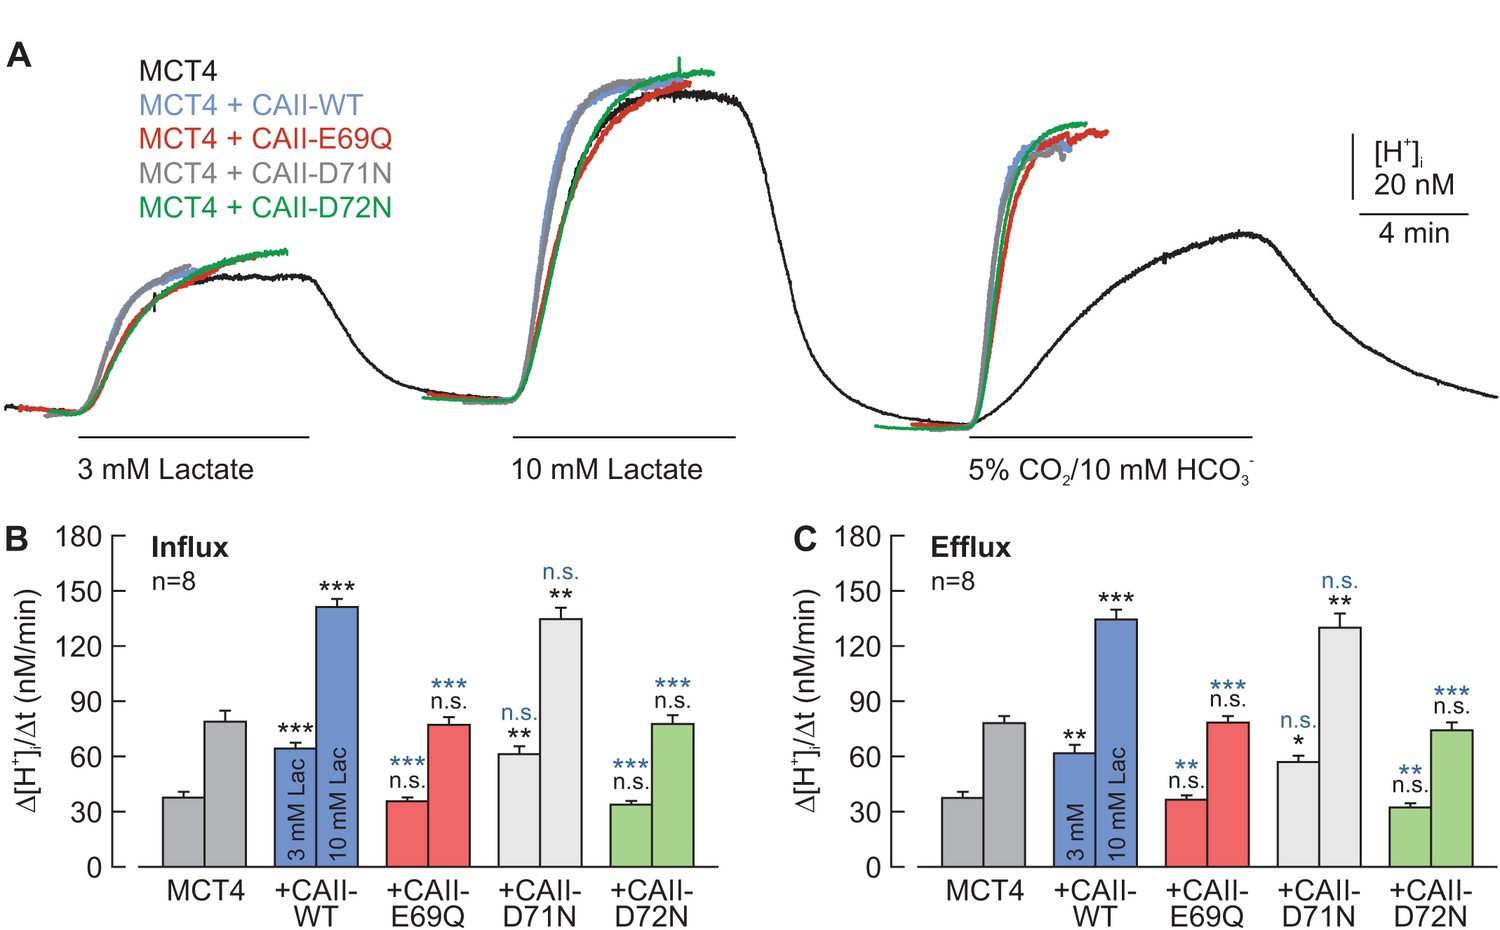
CAII-Glu69 and Asp72 are crucial for the facilitation of MCT4 transport activity.
(A) Original recordings of the change in intracellular H+ concentration in oocytes expressing MCT4 (black trace), MCT4 + CAII-WT (blue trace), MCT4 + CAII-E69Q (red trace), MCT4 + CAII-D71N (gray trace), and MCT4 + CAII-D72N (green trace), during the application of 3 and 10 mM lactate and of 5% CO2 and10 mM HCO3–. (B, C) Rate of change in intracellular H+ concentration (Δ[H+]/Δt) as induced by the application (B) and the removal (C) of 3 and 10 mM lactate, respectively, in oocytes expressing MCT4 (dark gray), MCT4 + CAII-WT (blue), MCT4 + CAII-E69Q (red), MCT4 + CAII-D71N (light gray), and MCT4 + CAII-D72N (green) (mean + SEM). The black significance indicators refer to MCT4, the blue significant indicators refer to MCT4 + CAII-WT. *p≤0.05, p≤0.01, ***p≤0.001. n.s. no significance; Student’s t-test.
Figure 4—figure supplement 2
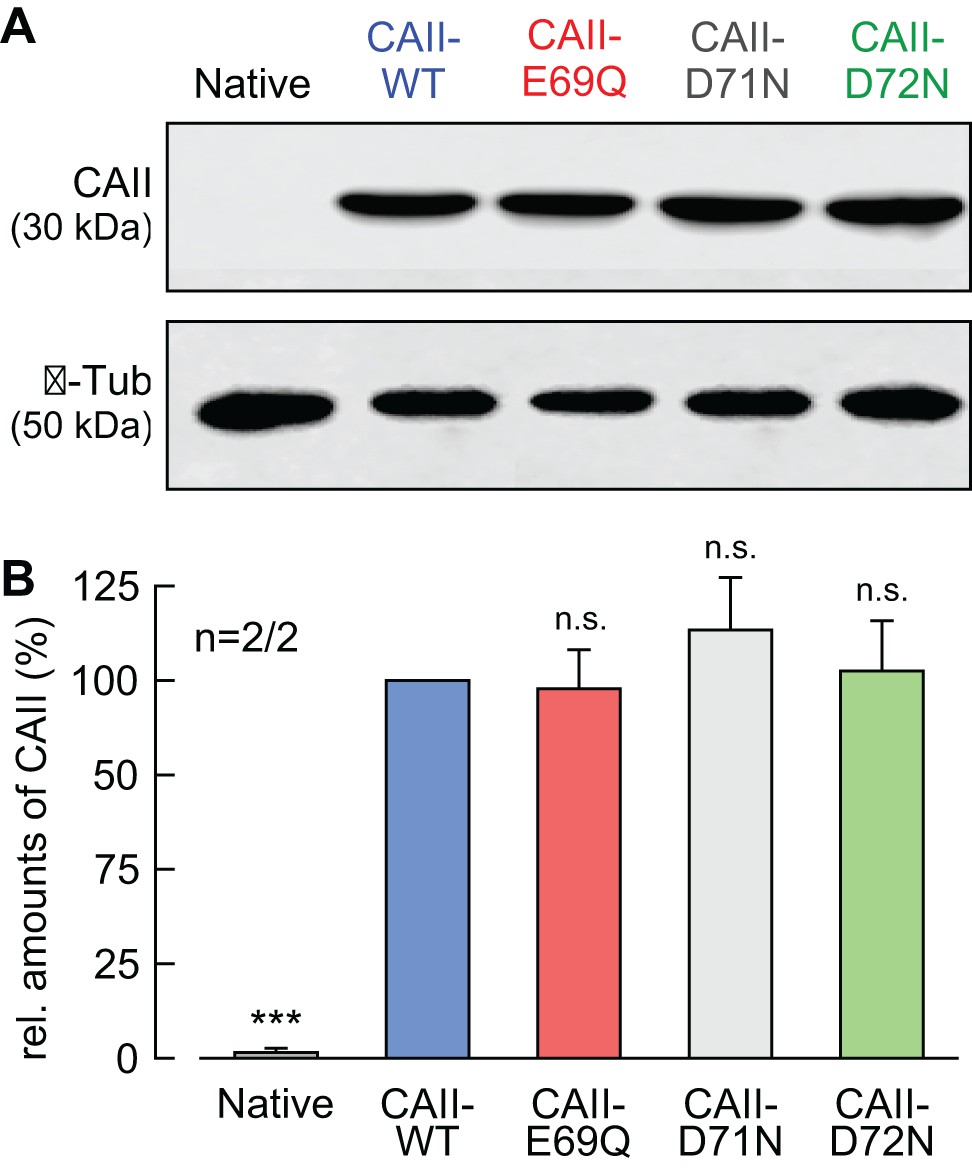
Expression levels of CAII are not altered by single-site mutation.
(A) Representative western blots for CAII (upper panel) and β-tubulin (lower panel) from native oocytes and from oocytes expressing CAII-WT, CAII-E69Q, CAII-D71N, and CAII-D72N. (B) Relative intensity of the fluorescent signal for CAII (mean + SEM). The signal intensity of CAII-WT was set to 100%. The significance indicators refer to the original values of CAII-WT. ***p≤0.001, n.s. no significance; Student’s t-test.
Figure 5 with 2 supplements
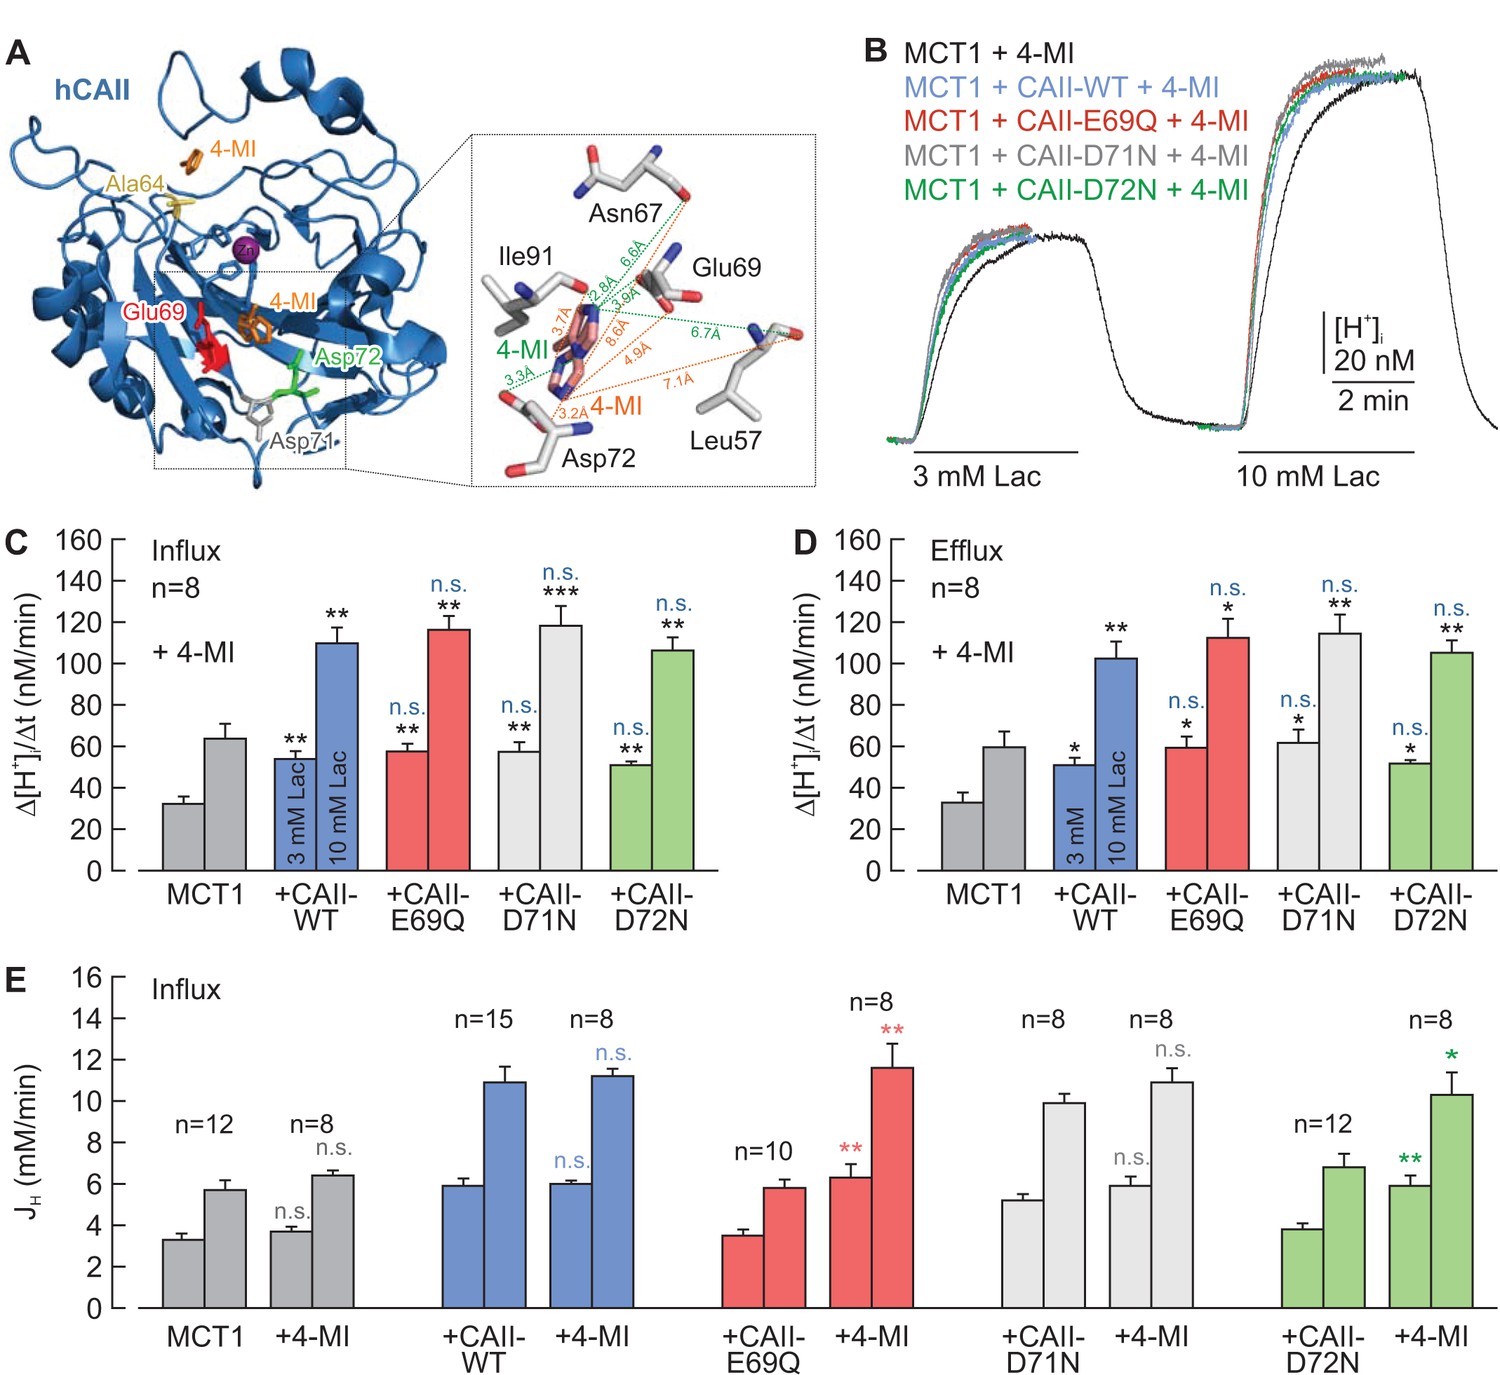
Chemical rescue of the interaction between MCT1 and CAII-E69Q/D72N by 4-methylimidazole.
(A) Structural model of human CAII, complexed with 4-methylimidazole (4-MI) (PDB-ID: 1MOO; Duda et al., 2003). 4-MI binds near His64 or in a moiety between Glu69 and Asp 72. Inset: Close-up of the binding moiety. 4-MI can bind in two alternative confirmations (orange and green) between Leu57, Asn67, Glu69, Asp72, and Ile91. (B) Original recordings of the change in intracellular H+ concentration in oocytes expressing MCT1 (black trace), MCT1 +CAII-WT (blue trace), MCT1 +CAII-E69Q (red trace), MCT1 +CAII-D71N (gray trace), and MCT1 +CAII-D72N (green trace), during the application of 3 and 10 mM lactate. All oocytes were injected with 4-MI (30 mM) on the day that the measurements were carried out. (C, D) Rate of change in intracellular H+ concentration (Δ[H+]/Δt) as induced by the application (C) and the removal (D) of 3 and 10 mM lactate, respectively, in oocytes expressing MCT1 (dark gray), MCT1 +CAII-WT (blue), MCT1 +CAII-E69Q (red), MCT1 +CAII-D71N (light gray), and MCT1 +CAII-D72N (green) (mean +SEM). The black significance indicators refer to MCT1, the blue significance indicators refer to MCT1 +CAII. All oocytes were injected with 4-MI (30 mM) on the day that the measurements were carried out. (E) Lactate-induced proton flux (JH), as calculated from the rate of change in pHi and the cells intrinsic buffer capacity (βi; Figure 5—figure supplement 1), in oocytes expressing MCT1 (dark gray), MCT1 +CAII-WT (blue), MCT1 +CAII-E69Q (red), MCT1 +CAII-D71N (light gray), and MCT1 +CAII-D72N (green), either injected with 4-MI or not (mean +SEM). The significance of difference indicators above the bars from 4-MI-injected oocytes refer to comparisons with cells expressing the same proteins without 4-MI. *p≤0.05, **p≤0.01, ***p≤0.001, n.s. no significance; Student’s t-test.
-
Figure 5—source data 1
Original dataset for Figure 5.
- https://doi.org/10.7554/eLife.35176.018
Figure 5—figure supplement 1
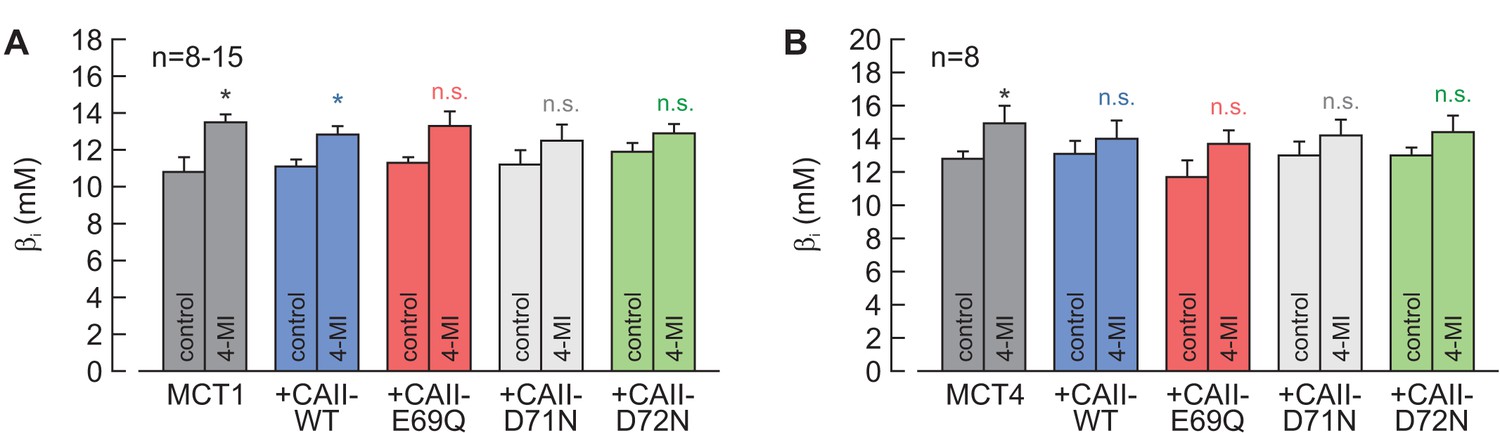
Intrinsic buffer capacity of oocytes.
(A, B) Intrinsic buffer capacity (βi), as measured by the application of 5% CO2 and 10 mM HCO3–, in oocytes expressing MCT1 (A) or MCT4 (B), either alone or together with CAII-WT, CAII-E69Q, CAII-D71N, and CAII-D72N, in the absence or presence of 4-MI in the cytosol (mean + SEM). *p≤0.05, n.s. no significance; Student’s t-test.
Figure 5—figure supplement 2
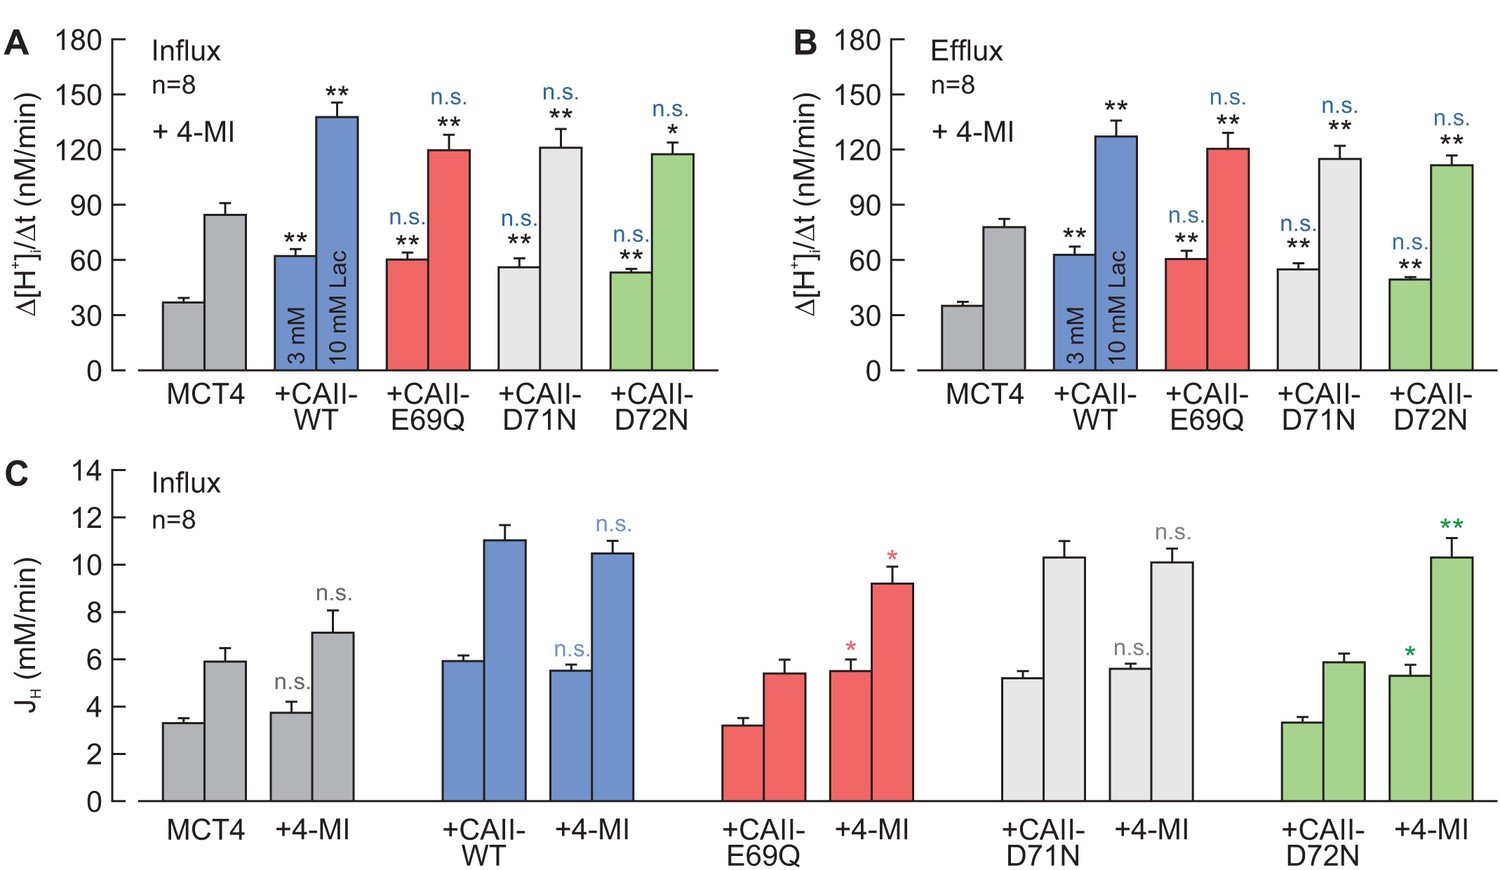
Chemical rescue of the interaction between MCT4 and CAII-E69Q/D72N by 4-methylimidazole.
(A, B) Rate of change in intracellular H+ concentration (Δ[H+]/Δt) as induced by the application (A) and removal (B) of 3 and 10 mM lactate, respectively, in oocytes expressing MCT4 (dark gray), MCT1 + CAII-WT (blue), MCT4 + CAII-E69Q (red), MCT4 + CAII-D71N (light gray), and MCT4 + CAII-D72N (green), in the presence of 4-MI in the cytosol (mean + SEM). The black significance indicators refer to MCT4, the blue significant indicators refer to MCT4 + CAII-WT. (C) Lactate-induced proton flux (JH), as calculated from the rate of change in pHi and the cells' intrinsic buffer capacity (βi; Figure 4—figure supplement 1). The significance of difference indicators above the bars from 4-MI-injected oocytes refer to comparisons with the cells expressing the same proteins without 4-MI. *p≤0.05, **p≤0.01, ***p≤0.001. n.s. no significance; Student’s t-test.
Figure 6
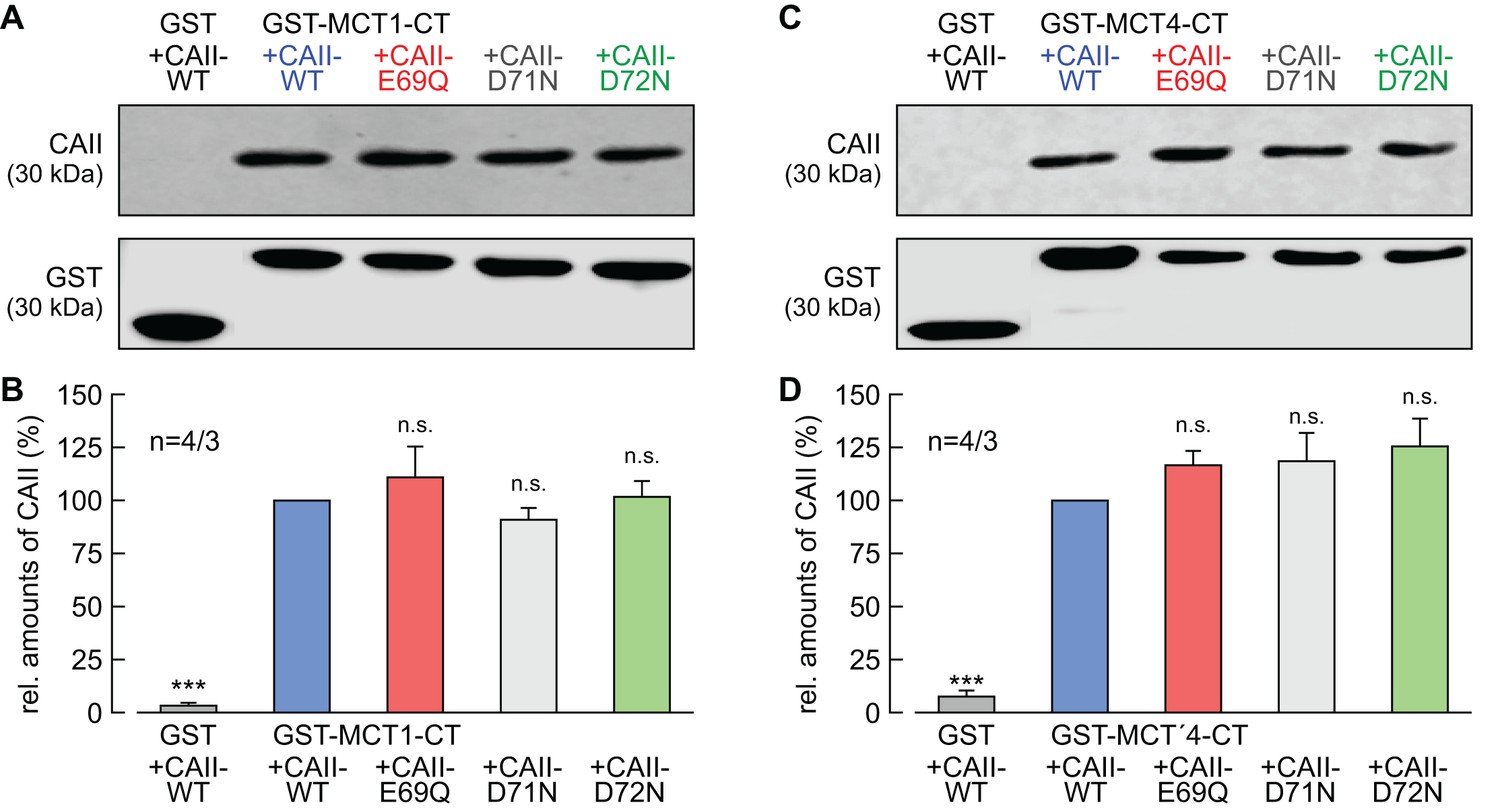
CAII-Glu69 and Asp72 do not mediate binding between MCT1/4 and CAII.
(A, C) Representative western blots for CAII (upper panel) and GST (lower panel). CAII-WT, CAII-E69Q, CAII-D71N and CAII-D72N were pulled down with a GST fusion protein of the C-terminal of (A) MCT1 (GST-MCT1-CT) or (C) MCT4 (GST-MCT4-CT). As a negative control, CAII-WT was pulled down with GST alone. (B, D) Relative intensity of the fluorescent signal for CAII (mean +SEM). The signal intensity of CAII, pulled down with GST-MCT1/4-CT was set to 100%. The significance indicators refer to the original values of CAII-WT. ***p≤0.001, n.s. no significance; Student’s t-test.
-
Figure 6—source data 1
Original dataset for Figure 6.
- https://doi.org/10.7554/eLife.35176.020
Figure 7
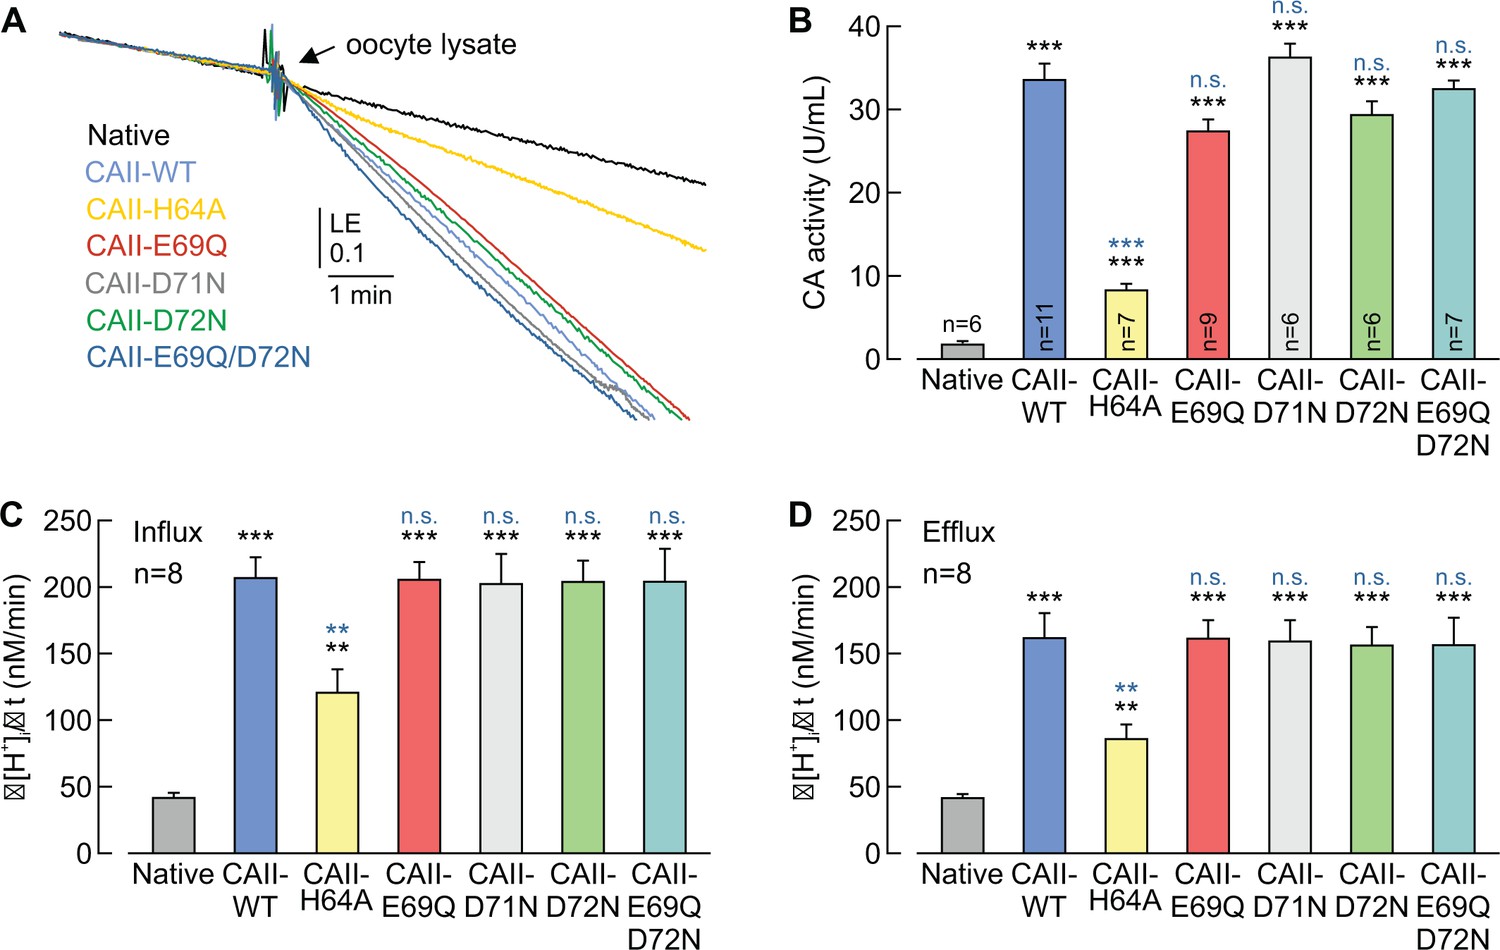
CAII-Glu69 and Asp72 do not support CAII catalytic activity.
(A) Original recording of the log enrichment (LE) of either a lysate of 20 native oocytes (black trace) or a lysate of 20 oocytes expressing CAII-WT (blue), CAII-H64A (yellow), CAII-E69Q (red), CAII-D71N (gray), CAII-D72N (green), or the double mutant CAII-E69Q/D72N (turquoise). The beginning of the traces shows the rate of degradation of the 18O-labelled substrate in the non-catalyzed reaction; the black arrow indicates the addition of oocyte lysate. (B) Enzymatic activity of CA in units/ml (mean +SEM). The black asterisks refer to the values from native oocytes, the blue significance indicators refer to the values of oocytes expressing CAII-WT. (C, D) Rate of change in intracellular H+ concentration (Δ[H+]/Δt) as induced by the application (C) and removal (D) of 5% CO2/10 mM HCO3– to/from native oocytes and oocytes expressing CAII-WT, CAII-H64A, CAII-E69Q, CAII-D71N, CAII-D72N or the double mutant CAII-E69Q/D72N (mean +SEM). **p≤0.01, ***p≤0.001, n.s. no significance; Student’s t-test.
-
Figure 7—source data 1
Original dataset for Figure 7.
- https://doi.org/10.7554/eLife.35176.022
Figure 8 with 2 supplements

CAII-His64 mediates binding, but no proton transfer, between MCT1 and CAII.
(A) Structural model of the binding between the C-terminal tail of MCT1 (purple) and CAII (blue). Binding is mediated by Glu489 (red) and Glu491 (orange) in the MCT1 C-terminal tail and His64 (yellow) in CAII. (B) Original recordings of the change in intracellular H+ concentration in oocytes expressing MCT1 (black trace), MCT1 +CAII-WT (blue trace), MCT1 +CAII-H64A (yellow trace), or MCT1 +CAII-H64K (green trace) during application of 3 and 10 mM of lactate and of 5% CO2 and 10 mM HCO3–. (C, D) Rate of change in intracellular H+ concentration (Δ[H+]/Δt) as induced by the application (C) and removal (D) of 3 or 10 mM lactate to oocytes expressing MCT1 (gray), MCT1 +CAII-WT (blue), MCT1 +CAII-H64A (yellow), or MCT1 +CAII-H64K (green) (mean +SEM). The black significance indicators refer to MCT1, the blue significance indicators refer to MCT1 +CAII-WT. (E) Representative western blots for CAII (upper panel) and GST (lower panel). CAII-WT, CAII-H64A, and CAII-H64K were pulled down with a GST fusion protein of the C-terminal of MCT1 (GST-MCT1-CT). As a negative control, CAII-WT was pulled down with GST alone. (F) Relative intensity of the fluorescent signal for CAII (mean +SEM). The signal intensity of CAII pulled down with GST-MCT1-CT was set to 100%. The significance indicators refer to the original values of CAII-WT. ***p≤0.001, n.s. no significance, Student’s t-test.
-
Figure 8—source data 1
Original dataset for Figure 8.
- https://doi.org/10.7554/eLife.35176.026
Figure 8—figure supplement 1
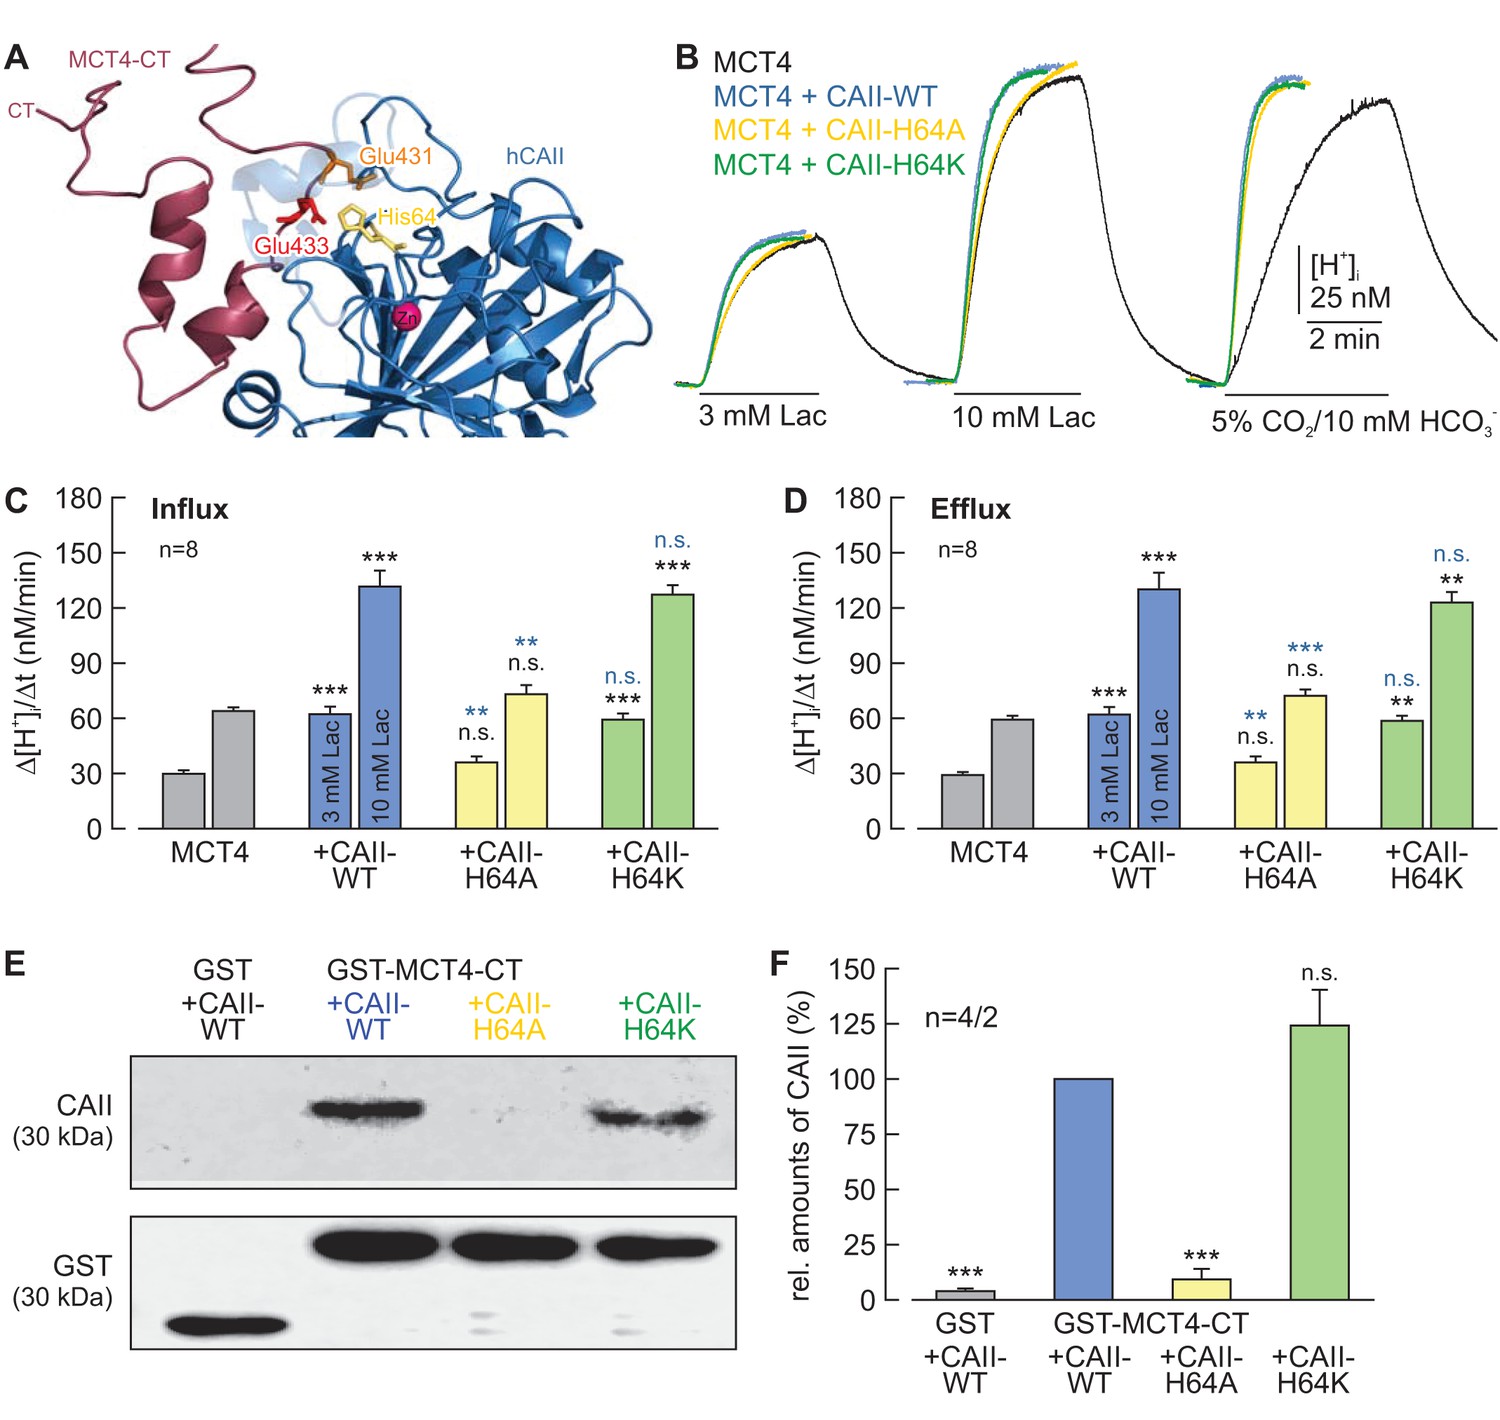
CAII-His64 mediates binding, but no proton transfer, between MCT4 and CAII.
(A) Structural model of the binding between the C-terminal tail of MCT4 (purple) and CAII (blue). Binding is mediated by Glu431 (orange) and Glu433 (red) in the MCT4 C-terminal tail and His64 (yellow) in CAII. (B) Original recordings of the change in intracellular H+ concentration in oocytes expressing MCT4 (black trace), MCT4 + CAII-WT (blue trace), MCT4 + CAII-H64A (yellow trace), and MCT4 + CAII-H64K (green trace) during application of 3 or 10 mM of lactate and of 5% CO2/10 mM HCO3–. (C, D) Rate of change in intracellular H+ concentration (Δ[H+]/Δt) as induced by the application (C) and removal (D) of 3 or 10 mM lactate in oocytes expressing MCT4 (gray), MCT4 + CAII-WT (blue), MCT4 + CAII-H64A (yellow) or MCT4 + CAII-H64K (green). The black significance indicators refer to MCT4, the blue significant indicators refer to MCT4 + CAII-WT (mean + SEM). (E) Representative western blots for CAII (upper panel) and GST (lower panel). CAII-WT, CAII-H64A, and CAII-H64K were pulled down with a GST fusion protein of the C-terminal of MCT4 (GST-MCT4-CT). As negative control, CAII-WT was pulled down with GST alone. (F) Relative intensity of the fluorescent signal for CAII (mean + SEM). The signal intensity of CAII pulled down with GST-MCT4-CT was set to 100%. The significance indicators refer to the original values of CAII-WT. ***p≤0.001, n.s. no significance; Student’s t-test.
Figure 8—figure supplement 2
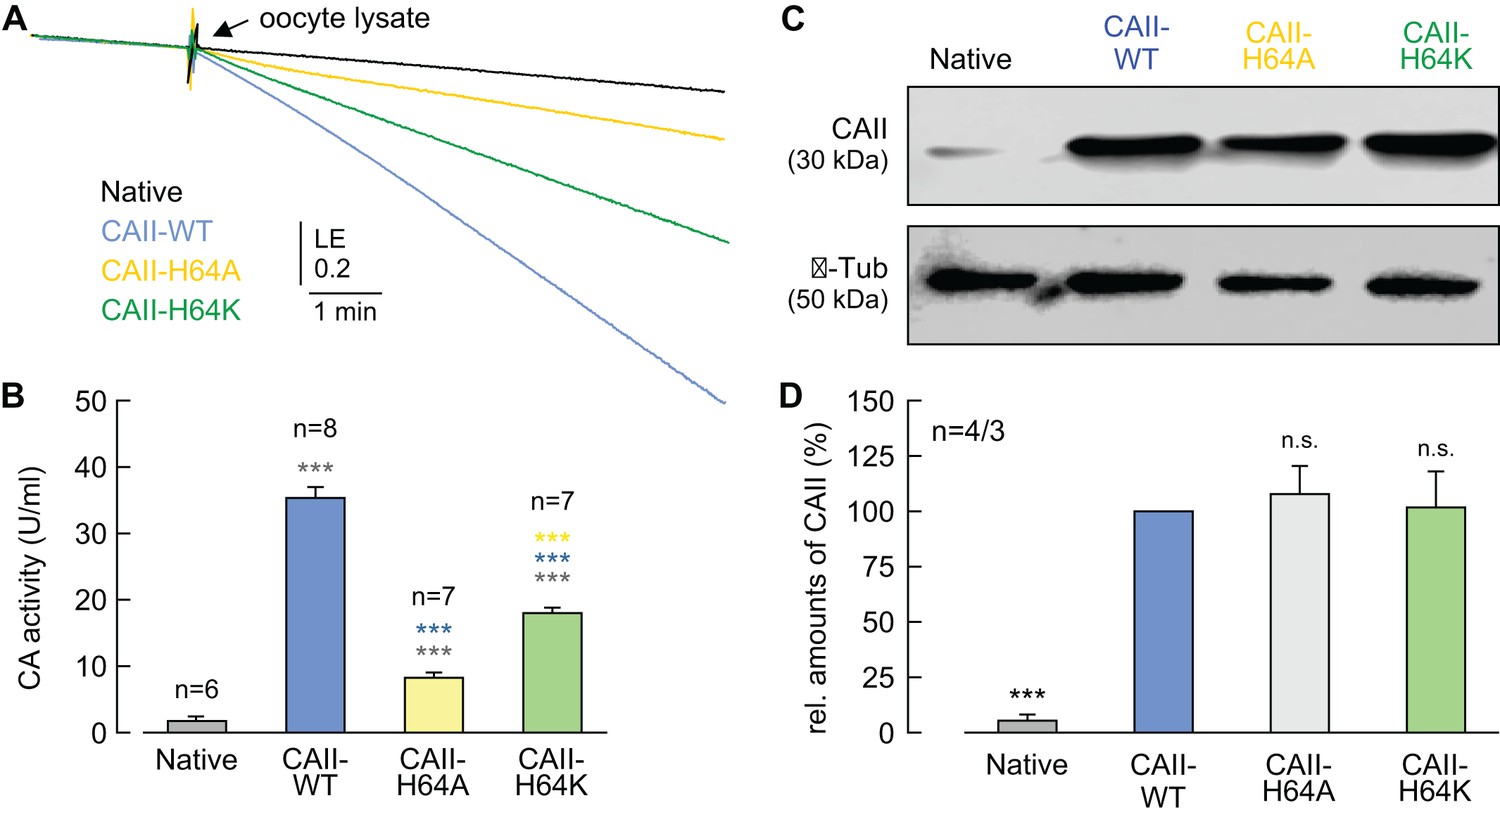
Catalytic activity and expression levels of CAII His64 mutants.
(A) Original recording of the log enrichment (LE) of either a lysate of 20 native oocytes (black trace) or a lysate of 20 oocytes expressing CAII-WT (blue), CAII-H64A (yellow), or CAII-H64K (green). The beginning of the traces shows the rate of degradation of the 18O-labelled substrate in the non-catalyzed reaction; the black arrow indicates the addition of the oocyte lysate. (B) Enzymatic activity of CA in units/ml (mean + SEM). The black asterisks refer to the values obtained from native oocytes, the blue significance indicators refer to the values for oocytes expressing CAII-WT, the yellow significance indicators refer to the values for oocytes expressing CAII-H64A. (C) Representative western blot for CAII (upper panel) and β-tubulin (lower panel) from native oocytes and oocytes expressing CAII-WT, CAII-H64A, or CAII-H64K,. (D) Relative intensity of the fluorescent signal for CAII (mean + SEM). The signal intensity of CAII-WT was set to 100%. The significance indicators refer to the original values of CAII-WT. ***p≤0.001, n.s. no significance; Student’s t-test.
Figure 9
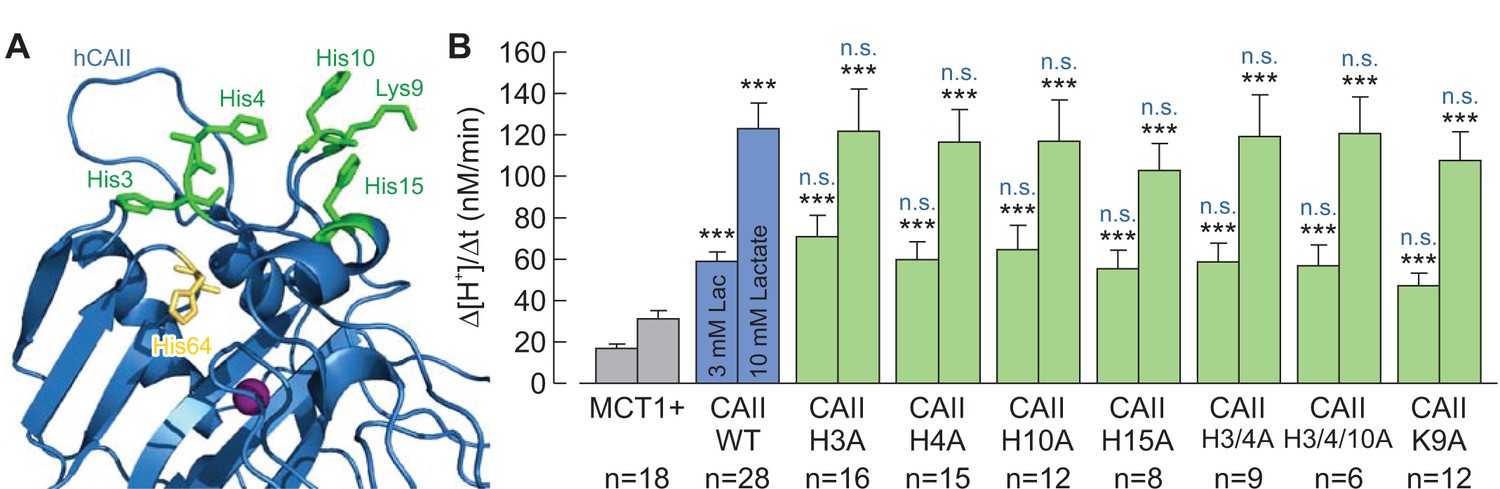
The histidine residues in the N-terminus of CAII are not involved in the interaction between CAII and MCT1.
(A) Structural model of human CAII (PDB-ID: 1XEV). His3, His4, His10, Lys9, and His15, which have been suggested to mediate the binding of CAII to various acid/base transporters, are labelled in green. His64, the binding site for MCT1 and MCT4, is labelled in yellow. (B) Rate of change in intracellular H+ concentration (Δ[H+]/Δt), as induced by application of 3 or 10 mM lactate, in oocytes expressing MCT1 (dark gray), MCT1 +CAII-WT (blue), or MCT1 +one of the CAII mutants (green) (mean + SEM). The black significance indicators refer to MCT1, the blue significant indicators refer to MCT1 +CAII-WT. ***p≤0.001, n.s. no significance; Student’s t-test.
-
Figure 9—source data 1
Original dataset for Figure 9.
- https://doi.org/10.7554/eLife.35176.028
Figure 10
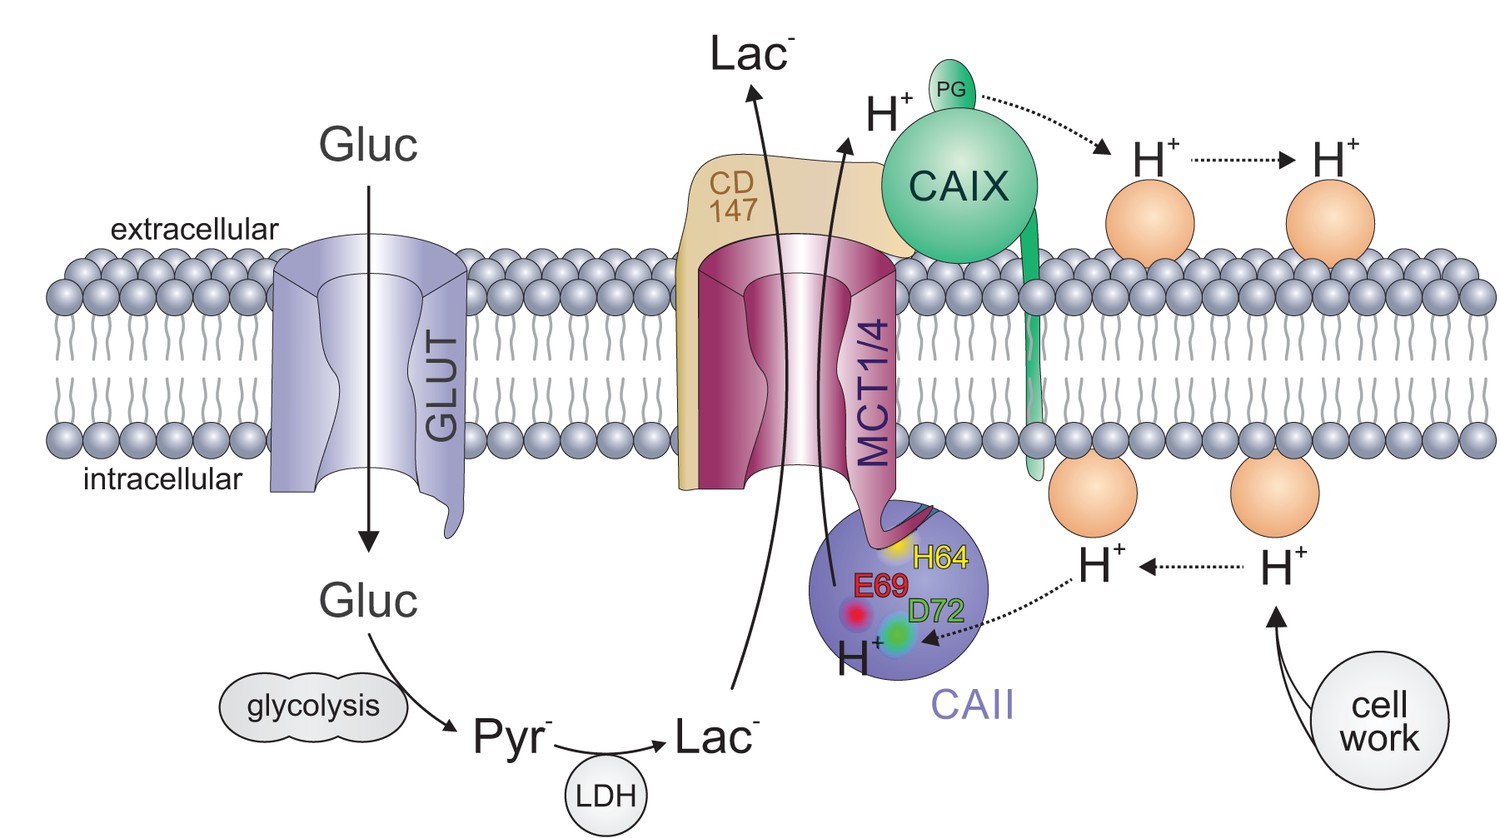
Carbonic anhydrases function as proton antennae for MCTs in glycolytic cancer cells.
Intracellular CAII (blue circle) is anchored to the C-terminal tail of MCT1/4 (purple structure) via CAII-His64 (yellow spot). This binding brings CAII close enough to the transporter pore to allow the shuttling of protons between the transporter and the surrounding protonatable residues (orange circles). Proton shuttling is mediated by CAII-Glu69 and CAII-Asp72 (red and green dots). Under hypoxic conditions, CAIX (green circle) binds to MCT1 and MCT4 via their chaperon CD147 (ochre structure) to facilitate the exchange of protons between transporter and extracellular protonatable residues (orange circles) via its proteoglycan-like (PG) domain in a fashion similar to that involving Glu69 and Asp72 in CAII. The necessity for this proton antenna derives from the slow diffusion of H+ within the highly buffered cytosol. Lactate, which is produced from glucose (entering the cell by facilitated diffusion via glucose transporters (light blue structure)) by glycolysis and subsequent conversion of pyruvate, quickly reaches the MCT by simple diffusion. Protons, which are produced during the hydrolysis of ATP, by contrast, diffuse very slowly within the cell. To allow fast extrusion of protons and lactate from the cell, the MCT does not extract H+ directly from the bulk cytosol but rather from an intermediate harvesting compartment made up of protonatable residues in the cell membrane and CAII. As in the cytoplasm, the diffusion of ions in the extracellular space is restricted. Therefore protons have to be removed from the extracellular side of the transporter by CAIX and shuttled to protonatable residues on the extracellular face of the cell membrane, from where they can be released to the extracellular space. By this non-catalytic mechanism, intracellular and extracellular carbonic anhydrases could cooperate non-enzymatically to facilitate proton-driven lactate flux across the cell membrane of cancer cells.
Tables
Key resources table
| Reagent type (species) or resource | Designation | Source or reference | Identifiers | Additional information |
|---|---|---|---|---|
| Cell line (Homo sapiens) | MCF-7 | German Collection of Microorganisms and Cell Cultures (DSMZ) | ACC-115 | |
| Recombinant DNA reagent | pGHJ-CAII | Becker et al., 2005 PMID: 16174776 | ||
| Recombinant DNA reagent | pGHJ-MCT1 | Bröer et al., 1998 PMID: 9639576 | ||
| Recombinant DNA reagent | pGHJ-MCT4 | Dimmer et al., 2000 PMID: 10926847 | ||
| Recombinant DNA reagent | pGEX-MCT1-CT | Stridh et al., 2012 PMID: 22451434 | ||
| Recombinant DNA reagent | pGEX-MCT4-CT | Noor et al. (2015) PMID: 25561737 | ||
| Antibody | Rabbit anti-carbonic anhydrase II polyclonal antibody | Millipore | AB1828 | 1:500 |
| Antibody | Goat anti-MCT1 polyclonal antibody | Santa Cruz Biotechnology | sc-14917 | 1:300 |
| Antibody | Mouse anti-β-Actin monoclonal antibody | Santa Cruz Biotechnology | sc-47778 | 1:2500 |
| Antibody | Mouse anti-GST Tag monoclonal antibody | Millipore | 05–782 | 1:400 |
| Antibody | Goat anti-rabbit IgG horseradish peroxidase-conjugated secondary antibody | Santa Cruz Biotechnology | sc2004 | 1:2000 |
| Antibody | Goat anti-mouse IgG horseradish peroxidase-conjugated secondary antibody | Santa Cruz Biotechnology | sc-2031 | 1:2000 |
| Antibody | Alexa Fluor 546 donkey anti-rabbit IgG | Invitrogen | A10040 | 1:1000 |
| Antibody | Alexa Fluor 488 donkey anti-goat IgG | Invitrogen | A-11055 | 1:1000 |
| Marker | Alexa Fluor 488 Phalloidin | Life Technologies | A12379 | 1:500 |
Table 1
Characteristics of primers used for qRT-PCR
https://doi.org/10.7554/eLife.35176.030| Gene | Primer | Seq 5’→ 3’ | Tm (°C) | Amplicon size (bp) | Location |
|---|---|---|---|---|---|
| CA II | Forward | AAACAAAGGGCAAGAGTGCTGACT | 57.2 | 173 | 680–703 |
| Reverse | TTTCAACACCTGCTCGCTGCTG | 58.3 | 831–852 | ||
| RPL27 | Forward | GGTGGTTGCTGCCGAAATGGG | 58.9 | 101 | 30–50 |
| Reverse | TGTTCTTCACGATGACAGCTTTGCG | 58.6 | 106–130 |
Table 2
Characteristics of primers used for single-site mutation of CAII
List of the sense primers for single-site mutation CAII. Nucleotides that differ from the wild-type sequence are labelled bold. The antisense primers had the inverse complement sequence of the sense primers. Multiple mutations of CAII were created from single-site mutants using the primers listed in the table. CAII-H64A, which was also used in this study, was kindly provided by Dr. Robert McKenna, University of Florida, Gainesville, U.S.A.
| Mutation | Seq 5’→ 3’ | Tm (°C) |
|---|---|---|
| CAII-H3A | CCGAGGATGTCCGCTCACTGGGGGTACGGC | 76.3 |
| CAII-H4A | CCGAGGATGTCCCATGCCTGGGGGTACGGC | 76.3 |
| CAII-H3A/H4A | CCGAGGATGTCCGCTGCCTGGGGGTACGGC | 77.7 |
| CAII-K9A | GGGTACGGCGCACACAACGGACCTGAG | 72.6 |
| CAII-H10A | GGGTACGGCAAAGCCAACGGACCTGAG | 71.0 |
| CAII-H15A | GGACCTGAGGCCTGGCATAAGGACTTCC | 71.0 |
| CAII-H64K | CAACAATGGTAAAGCTTTCAACG | 57.1 |
| CAII-E69Q | CATGCTTTCAACGTGCAGTTTGAT | 59.3 |
| CAII-D71N | GGAGTTTAATGACTCTCAGG | 55.2 |
| CAII-D72N | TTTGATAACTCTCAGGACAAAGCA | 57.6 |
Additional files
-
Transparent reporting form
- https://doi.org/10.7554/eLife.35176.032
Download links
A two-part list of links to download the article, or parts of the article, in various formats.
Downloads (link to download the article as PDF)
Open citations (links to open the citations from this article in various online reference manager services)
Cite this article (links to download the citations from this article in formats compatible with various reference manager tools)
A surface proton antenna in carbonic anhydrase II supports lactate transport in cancer cells
eLife 7:e35176.
https://doi.org/10.7554/eLife.35176


