Arid1a restrains Kras-dependent changes in acinar cell identity
- Memorial Sloan Kettering Cancer Center, United States
- Hannover Medical School, Germany
- University of Michigan School of Medicine, United States
- Howard Hughes Medical Institute, United States
Figures
Figure 1 with 1 supplement
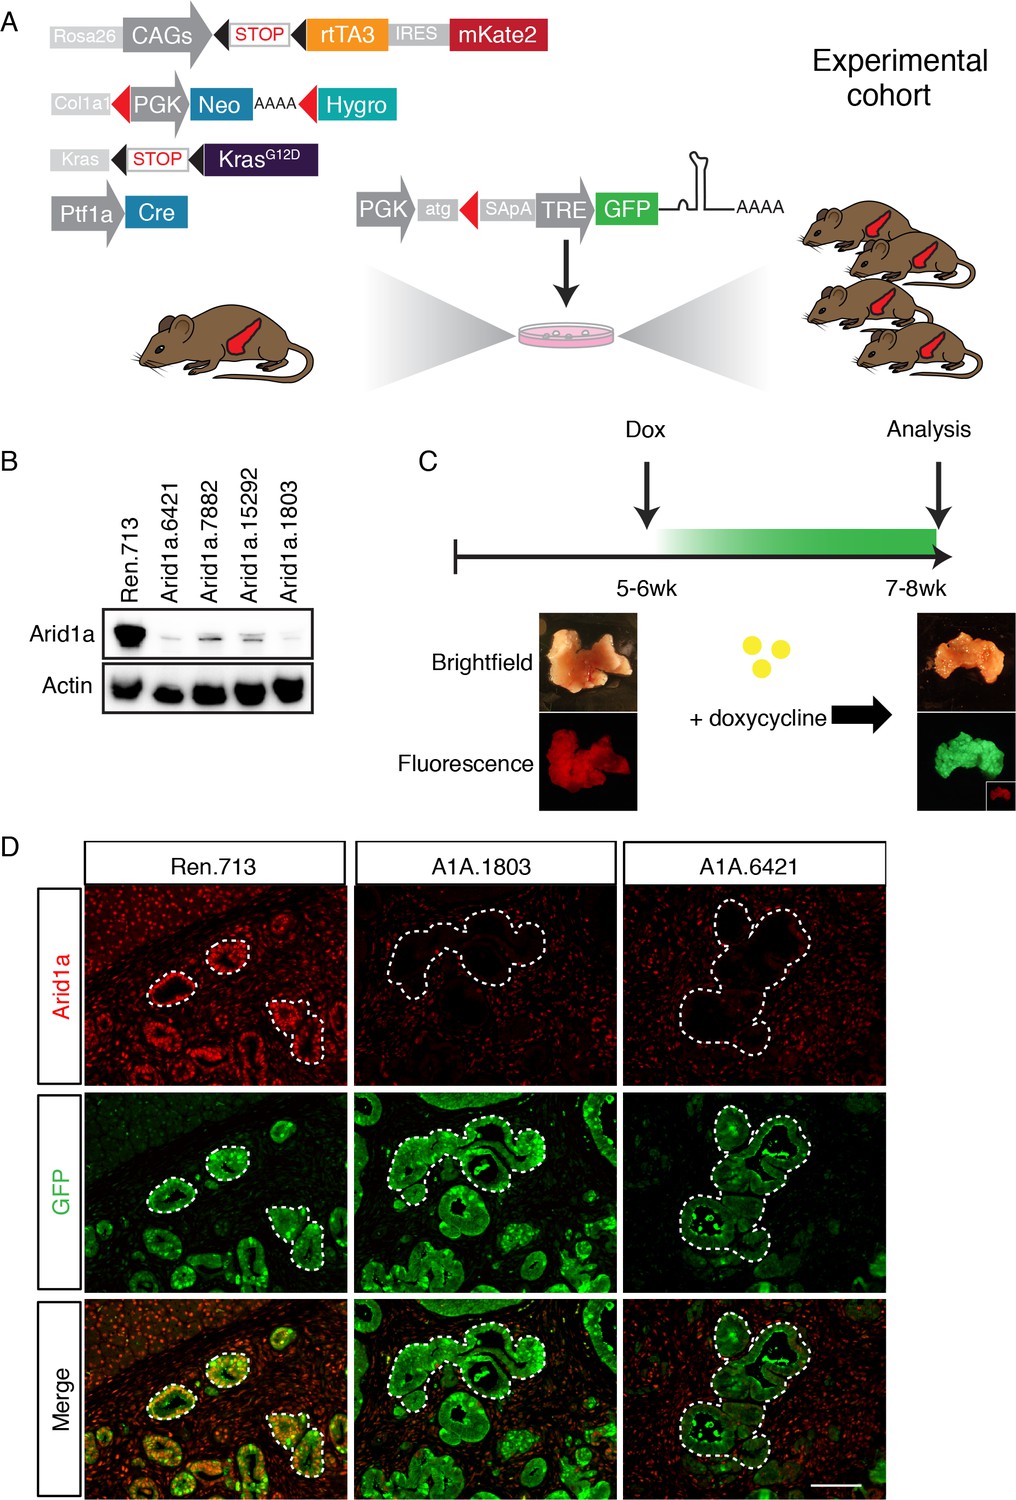
A mouse model for inducible and reversible Arid1a depletion in vivo.
(A) Schematic of KC-RIK model. shRNAs against Arid1a and Renilla are targeted into ES cells derived from KC-RIK mice. Experimental cohorts are generated via blastocyst injection of positive clones. (B) Arid1a knockdown in 3T3 cells at MOI of <1. shArid1a.6421 and shArid1a.1803 were used for ES cell targeting. (C) Experiment schematic for acute Arid1a silencing. (D) GFP staining in the pancreas of KC-RIK-shRen and KC-RIK-shArid1a mice. GFP staining corresponds with shRNA expression and marks the epithelial compartment where p48-Cre (Ptf1a-Cre) has been expressed. Arid1a protein is detectable in GFP +regions in animals expressing the Renilla control but not Arid1a specific shRNAs. Scalebar 50 μm.
Figure 1—figure supplement 1
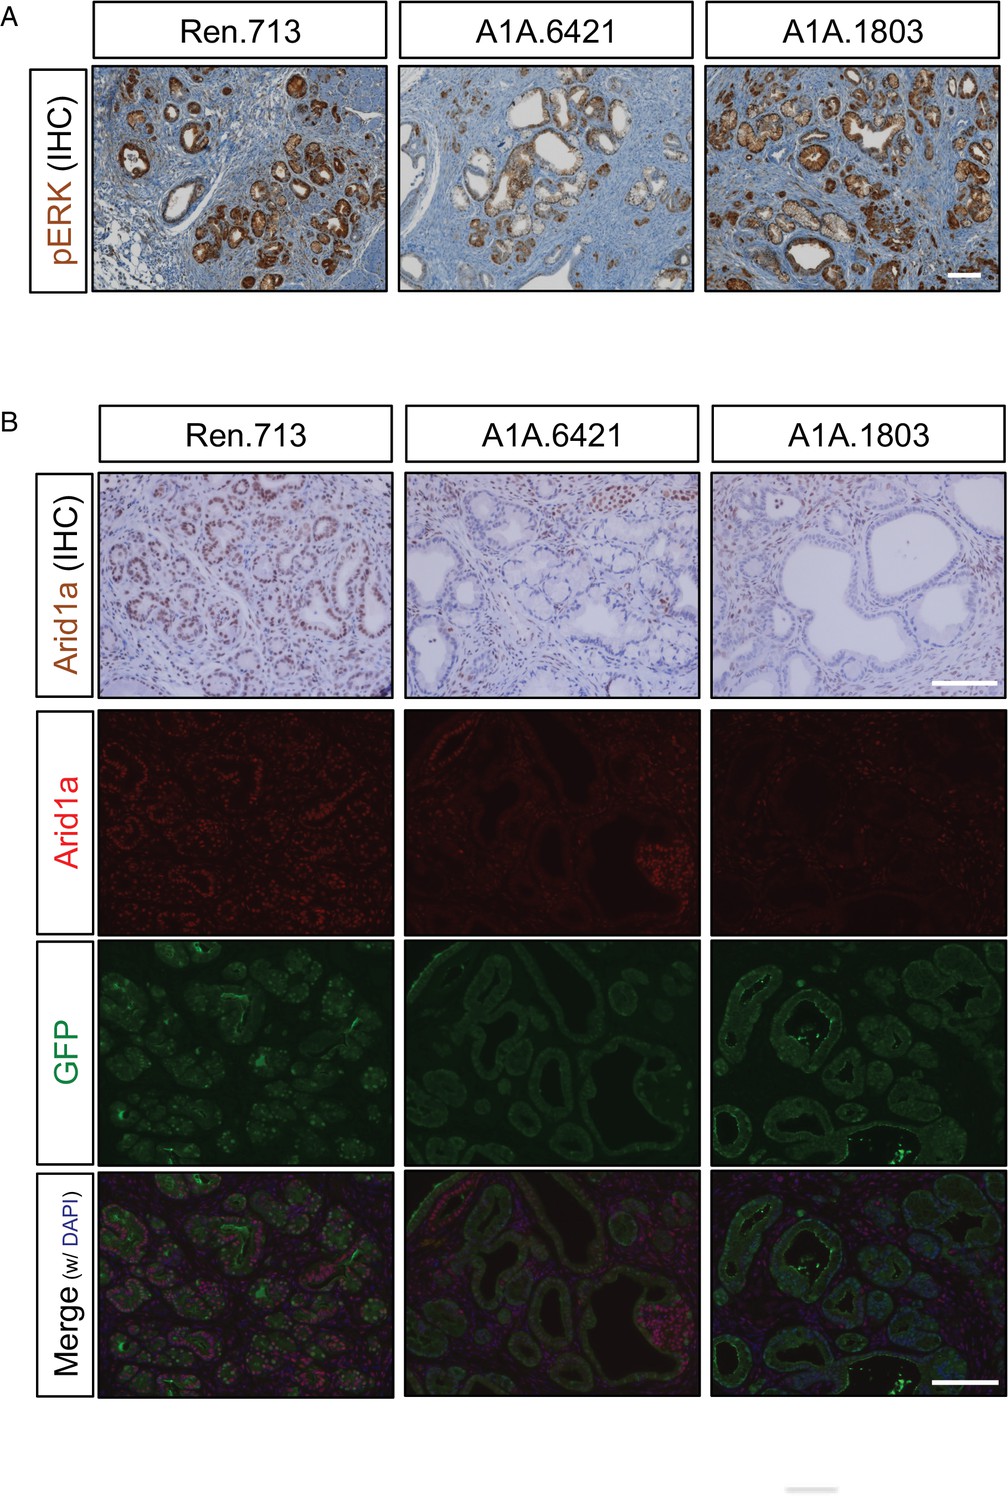
MAPK pathway activation and Arid1a depletion in KC-RIK-shArid1a mice.
(A) Immunohistochemistry staining for phospho-Erk as an indicator of LSL-KrasG12D activation in KC-RIK-shRen and shArid1a.6421 animals after 2 weeks of dox treatment. Scalebar 100 μm. (B) Representative immunohistochemistry and immunofluorescence staining for Arid1a and GFP. Nuclei are counterstained with DAPI. N = 3 mice per genotype. Scalebar 100 μm.
Figure 2 with 2 supplements
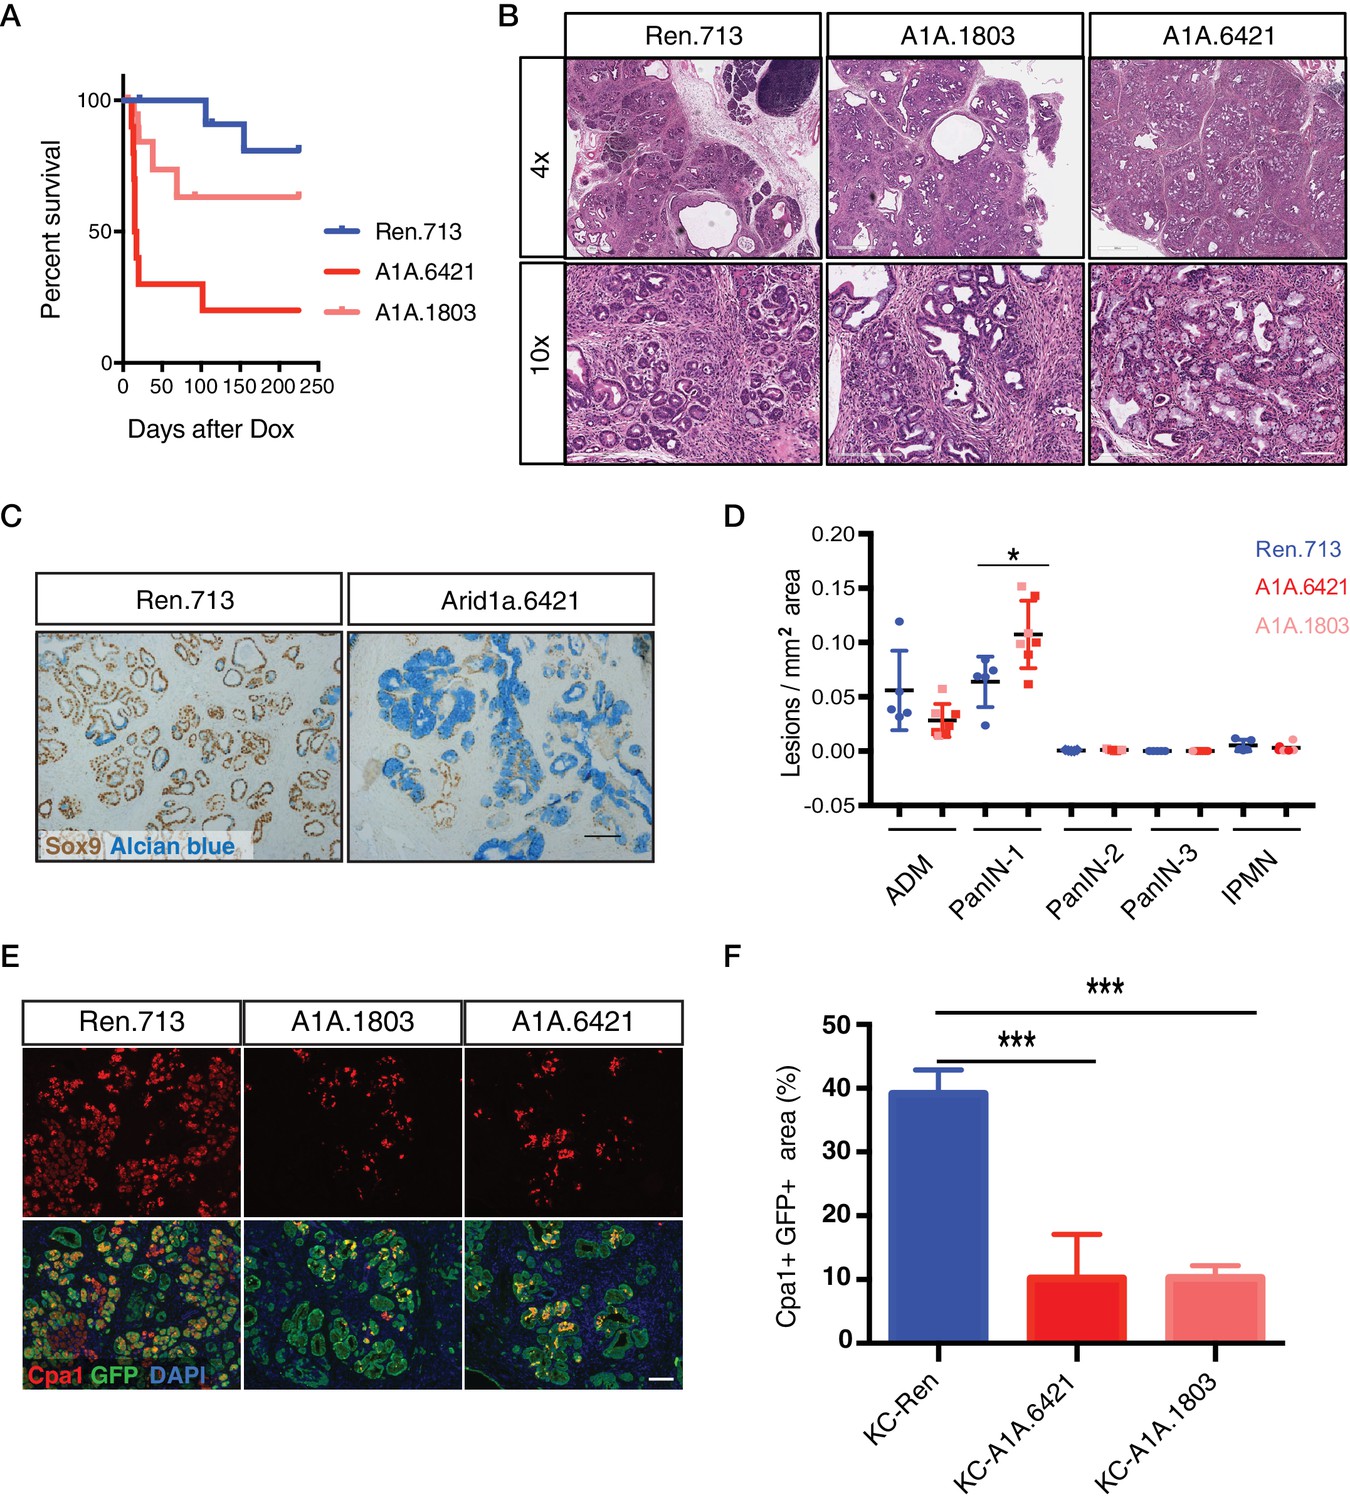
Acute Arid1a knockdown induces rapid changes in acinar cell fate in the setting of KrasG12D.
(A) Kaplan-Meier curve of KC-RIK-shRen and –shArid1a cohort after dox administration. (B) H and E staining of KC-RIK-shRen and –shArid1a mice after 2 weeks on dox. Top panels, scalebar 600 μm; bottom panels, scalebar 200 μm. (C) Immunohistochemistry staining for the ductal marker Sox9 in KC-RIK-shRen and –shArid1a pancreas. Alcian blue counterstain stains acidic mucins in mucinous lesions. Scalebar 100 μm. (D) Quantification of ADM, PanIN, and IPMN lesions per mm2 of tissue area measured by a veterinary pathologist blinded to genotype, comparing the shRen animals with the 2 Arid1a shRNA groups in the Arid1a KD genotype. p<0.05. Each dot represents one animal. (E) Immunofluorescence staining KC-RIK-shRen and –shArid1a tissue for the acinar marker Carboxypeptidase 1 (Cpa1) and GFP. Nuclei are labeled with DAPI. Scalebar 100 μm.Quantification of Cpa1 staining within GFP +area in panel (F). p<0.0001. At least three animals per condition were used for histological quantification experiments.
-
Figure 2—source data 1
Quantification of pancreatic lesions upon acute Arid1a knockdown.
- https://doi.org/10.7554/eLife.35216.008
Figure 2—figure supplement 1

Acute Arid1a knockdown impacts animal health and pancreas function in the setting of oncogenic Kras.
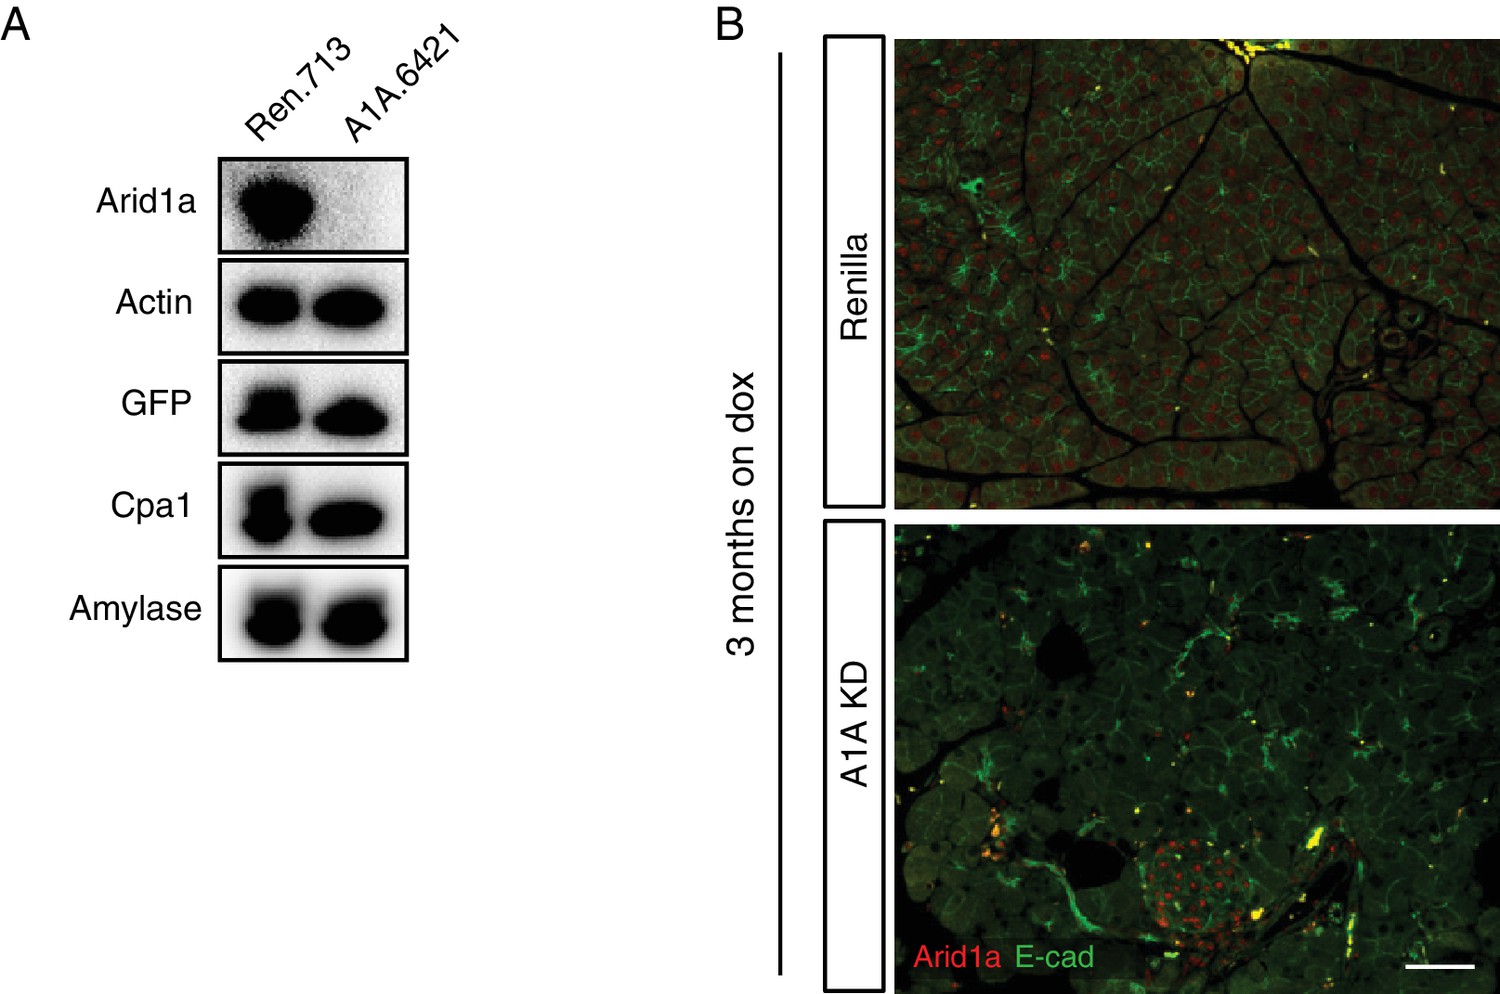
(A) Plot of survival versus percent chimerism of KC-RIK -shRen and -shArid1a mice placed on dox at five weeks of age. (B) Representative image of fecal samples from KC-RIK shRen and shArid1a mice. (C) Representative gross histology of KC-RIK –shRen and shArid1a pancreata with 100% chimerism. Scalebar 10 mm. (D) Quantification of pancreas weight by genotype. Each dot represents one animal. (E) Immunofluorescence staining KC-RIK-shRen and -shArid1a tissue for the Ki67 (top) and cleaved caspase 3 (c-Casp3, bottom) and GFP. Nuclei are labeled with DAPI. Scalebar 100 μm. (F) Immunofluorescence staining KC-RIK-shRen and –shArid1a tissue for the ductal marker Cytokeratin 19 (CK19) and GFP. Nuclei are labeled with DAPI. Scalebar 100 μm. (G) Representative histological examples used for scoring criteria of ADM, PanIN and IPMN lesions.
Figure 2—figure supplement 2

Histological changes induced upon acute Arid1a knockdown are maintained after 1 year on dox.
(A) H and E staining of pancreas tissue from KC-RIK-shRen and KC-RIK-shArid1a.6421 animals after one year on dox. (B) Co-immunofluorescence of Arid1a and GFP in shRen and shArid1a animals after one year on dox to assess durability of Arid1a knockdown. (C) Representative immunohistochemistry co-staining of Arid1a with Alcian blue to assess sustained suppression of Arid1a in mucinous lesions in mice after 1 year of dox treatment. Representative images of n = 3 mice per genotype are shown for all panels. Scalebars = 100 μm.
Figure 3 with 3 supplements

Arid1a is not required for maintenance of acinar cells in the setting of wild-type Kras.
(A) Representative gross image of pancreas from C-RIK-shRen and C-RIK-shArid1a.6421 animals on dox for 2 weeks. (B) H and E staining of pancreas tissue from C-RIK-shRen and C-RIK-shArid1a.6421 animals. Scalebar 100 μm. (C) Immunofluorescence staining of C-RIK-shRen and –shArid1a tissue for Arid1a and GFP. Arid1a-positive cells in lower panel are GFP-negative unrecombined ducts Scalebar 100 μm. (D) Quantification of Arid1a + GFP + cells in panel (C). p<0.001. (E) Immunofluorescence staining of C-RIK-shRen and –shArid1a tissue. Left panel, Cpa1 and CK19. Absence of double positive cells indicates lack of ADM in shArid1a tissue. Right panel, costaining of stressed acinar cell marker Clusterin and E-cadherin. Scalebar 100 μm. (F) Quantification of Cpa1 +GFP + cells in panel (E). No significant difference. (G) Immunofluorescence staining of C-RIK-shRen and –shArid1a tissue for Ki67 and CK19. Nuclei are labeled with DAPI. Scalebar 100 μm. (H) Quantification of Ki67 +GFP + cells in panel (E). No significant difference. (I) H and E staining of pancreas tissue from C-RIK-shRen and C-RIK-shArid1a.6421 animals after 3 months on dox. Scalebar 50 μm. (J) H and E staining of pancreas tissue from C-RIK-shRen and C-RIK-shArid1a.6421 animals upon treatment with Caerulein or PBS control at indicated timepoints. Scalebar 100 μm. At least three animals per condition were used for histological quantification experiments.
Figure 3—figure supplement 1
Arid1a depletion in the setting of wild-type Kras.
(A) Western blot of pancreas lysate from C-RIK -shRen and -shArid1a mice placed on dox at five weeks of age. (B) Immunofluorescence staining of C-RIK-shRen and -shArid1a tissue for Arid1a and E-cadherin after 3 months on dox. Scalebar 100 μm.
Figure 3—figure supplement 2

Arid1a is not required for acinar regeneration after caerulein-induced pancreatitis.
(A) Quantification of inflammation (assessing edema and immune infiltration) upon caerulein treatment in C-RIK -shRen and -shArid1a mice (N = 3 mice per genotype). (B) Representative images of C-RIK-shRen and -shArid1a pancreata at 2 and 9 days post induction of pancreatitis with caerulein treatment. Immunohistochemistry shows staining CD45 as indicator of immune infiltration. Scalebar 100 μm. (C) Immunofluorescence staining of C-RIK-shRen and -shArid1a pancreata at 2 and 9 days post induction of pancreatitis for Clusterin to indicate stressed acinar cells and GFP with DAPI to mark nuclei. Scalebar 50 μm.
-
Figure 3—figure supplement 2—source data 1
Quantification of inflammation scores in C-RIK-shRen and C-RIK-shArid1a animals upon caerulein-induced pancreatitis.
- https://doi.org/10.7554/eLife.35216.012
Figure 3—figure supplement 3
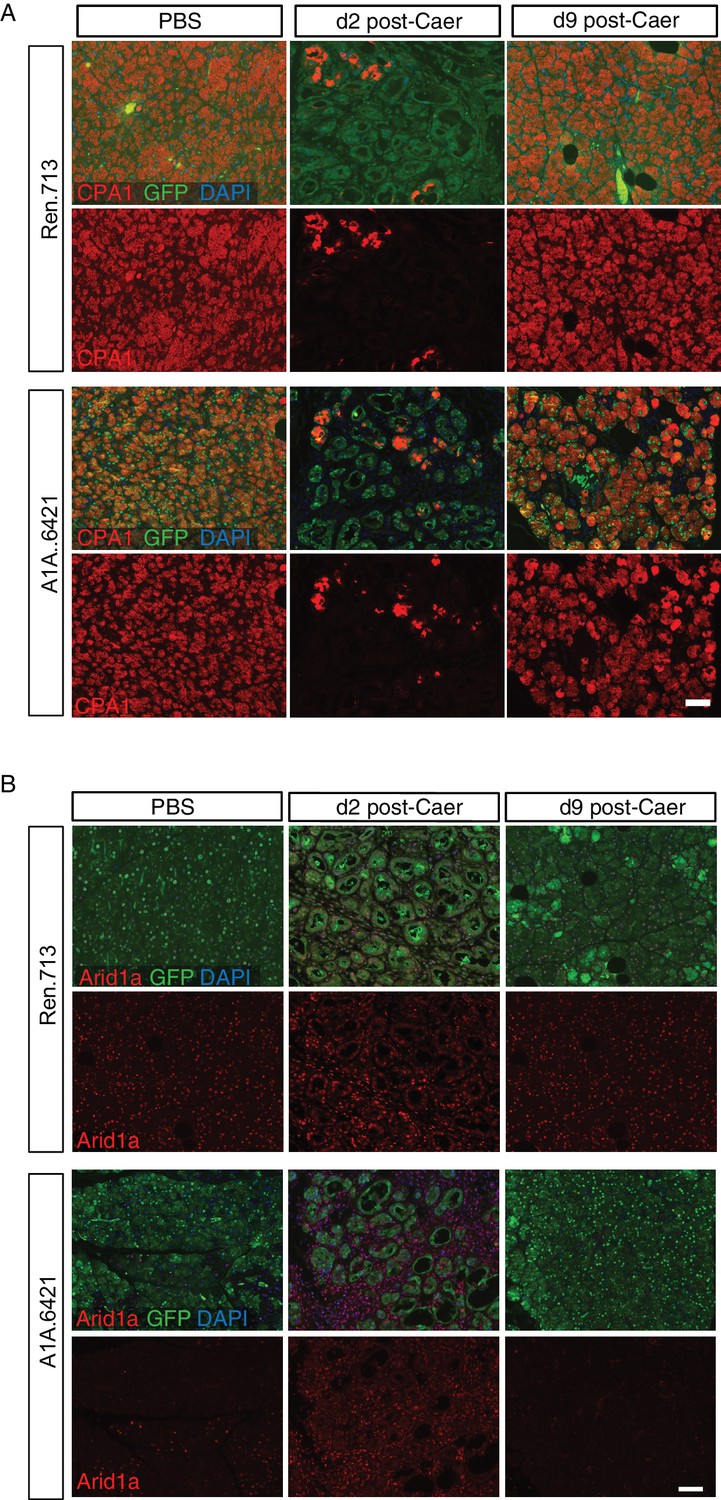
Regeneration acinar cells in C-RIK-shArid1a mice re-express acinar markers and retain Arid1a silencing.
(A) Immunofluorescence staining of C-RIK-shRen and -shArid1a pancreata at 2 and 9 days post induction of pancreatitis for acinar marker Cpa1 and GFP with DAPI to mark nuclei. Scalebar 50 μm. (B) Representative immunofluorescence images of C-RIK-shRen and -shArid1a pancreata at 2 and 9 days post caerulein treatment, stained for Arid1a and GFP. Scalebar 50 μm.
Figure 4 with 1 supplement
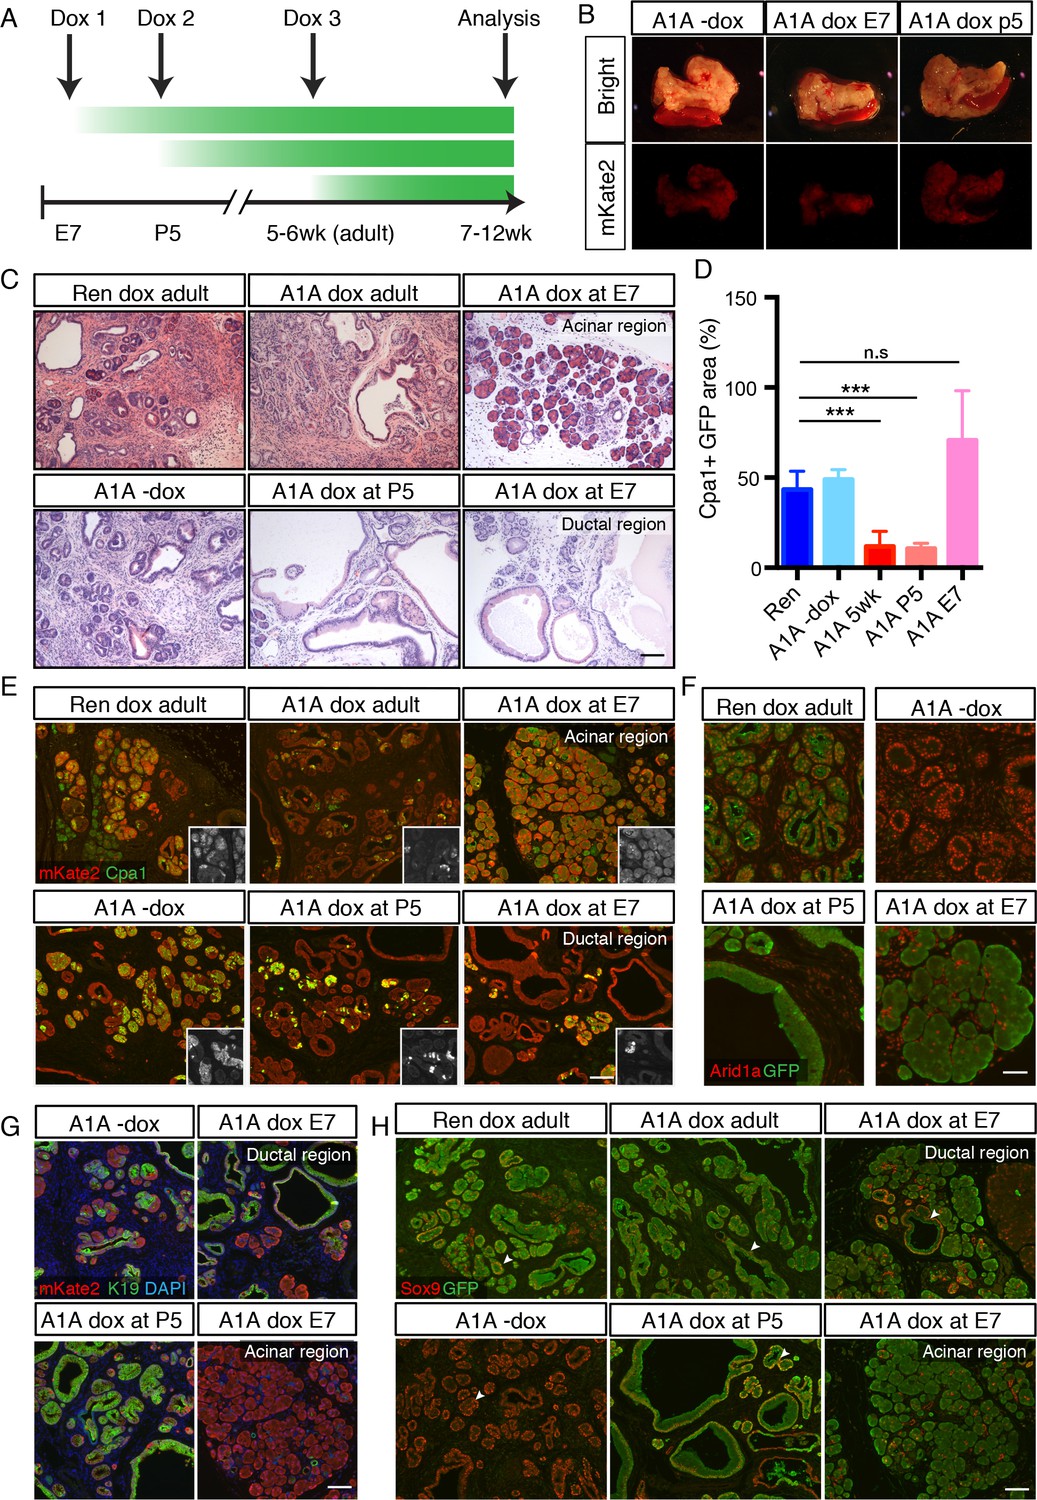
Temporal context impacts the outcome of Arid1a depletion in the pancreas.
(A) Schematic of dox administration timepoints for Arid1a silencing cohorts. (B) Gross morphology and mKate2 fluorescence of KC-RIK-shRen and KC-RIK-shArid1a pancreata from indicated dox cohorts at 7 weeks of age. (C) H and E staining of KC-RIK-shRen and –shArid1a mice from indicated dox cohorts. Note the E7 dox cohort contains large mucinous lesions as well as regions of increased acinar morphology. Scalebar 100 μm. (D) Quantification of Cpa1 +GFP + cells in panel (E). ***, p<0.0001. At least three animals per condition were used for image quantification. (E) Immunofluorescence staining KC-RIK-shRen and –shArid1a tissue for the acinar marker Carboxypeptidase 1 (Cpa1) and mKate2. Insets show Cpa1 staining in grey-scale. Scalebar 100 μm. (F) Immunofluorescence staining of C-RIK-shRen and –shArid1a tissue for Arid1a and GFP. Arid1a-positive cells in lower panel are GFP-negative unrecombined ducts. Scalebar 50 μm. (G) Immunofluorescence staining KC-RIK-shRen and –shArid1a tissue for the acinar marker Carboxypeptidase 1 (Cpa1) and mKate2. Insets show Cpa1 staining in grey-scale. Scalebar 100 μm. (H) Immunofluorescence staining KC-RIK-shRen and –shArid1a tissue for CK19 and mKate2. Nuclei labeled with DAPI. Scalebar 100 μm. (I) Immunofluorescence staining KC-RIK-shRen and –shArid1a tissue for Sox9 and GFP. Arrowheads highlight GFP-positive regions with Sox9 staining in all but E7 dox areas that retain acinar morphology. Nuclei labeled with DAPI. Scalebar 100 μm.
Figure 4—figure supplement 1
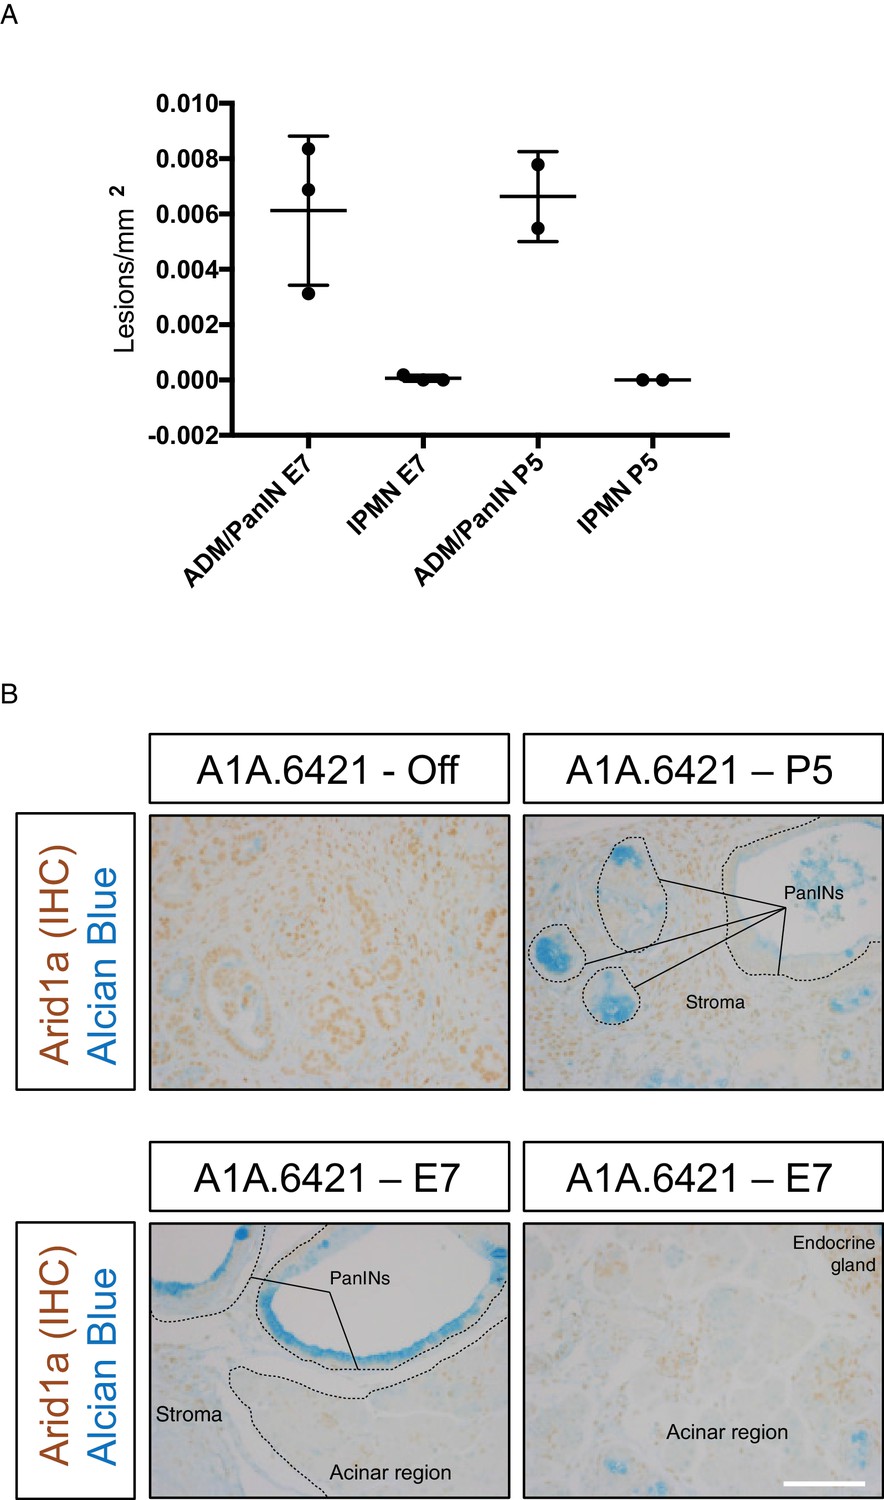
Mucinous lesions in KC-RIK-shArid1a mice placed on dox during embryonic development.
(A) Quantification of IPMN lesions vs ADM/PanIN lesions per mm2 tissue area in KC-RIK-shArid1a.6421 animals placed on dox at embryonic day 7 (E7) and after post-natal day 5 (P5). Arid1a suppression regulates acinar to ADM/PanIN transition, producing negligible numbers of IPMNs in both the E7 and P5 cohorts. Each dot represents one animal. (B) Representative immunohistochemistry co-staining of Arid1a with Alcian blue to assess sustained suppression of Arid1a in pancreata of same KC-RIK-shArid1a.6421 animals quantified in (A). KC-RIK-shArid1a.6421 animals from the same cohort without dox are shown as controls, Note sustained suppression of Arid1a in Alcian blue-stained PanINs arising in P5 or E7 cohorts, as well as in pancreatic regions retaining acinar-morphology in the E7 cohort. Dashed lines denote epithelial regions with Arid1a knockdown, while stromal regions or endocrine glands retain Arid1a expression.
-
Figure 4—figure supplement 1—source data 1
Quantification of lesions in KC-RIK-shArid1a and control animals placed on dox during pancreatic development.
- https://doi.org/10.7554/eLife.35216.016
Figure 5

Perturbation of acinar cell fate is not reversed upon Arid1a restoration.
(A) Schematic of dox administration timepoints for Arid1a restoration. (B) Gross morphology and mKate2 fluorescence of KC-RIK-shRen and KC-RIK-shArid1a pancreata on dox and after 4 weeks of dox withdrawal. (C) Immunofluorescence staining of C-RIK-shRen and –shArid1a tissue for Arid1a and the ductal marker Keratin 8. (D) H and E staining of KC-RIK-shRen and –shArid1a mice on dox and after 4 weeks of dox withdrawal. (E) Quantification of PanIN lesions per field in (D) measured by veterinary pathologist. No significant difference between KC-RIK-shArid1a (6421) mice on dox and upon dox withdrawal. (F) Representative immunohistochemistry staining for the ductal marker Sox9 in pancreata from KC-RIK-shRen and –shArid1a.6421 mice from same cohort quantified in (E) Alcian blue counterstain stains acidic mucins in mucinous lesions. Scalebars 100 μm.
Figure 6 with 1 supplement
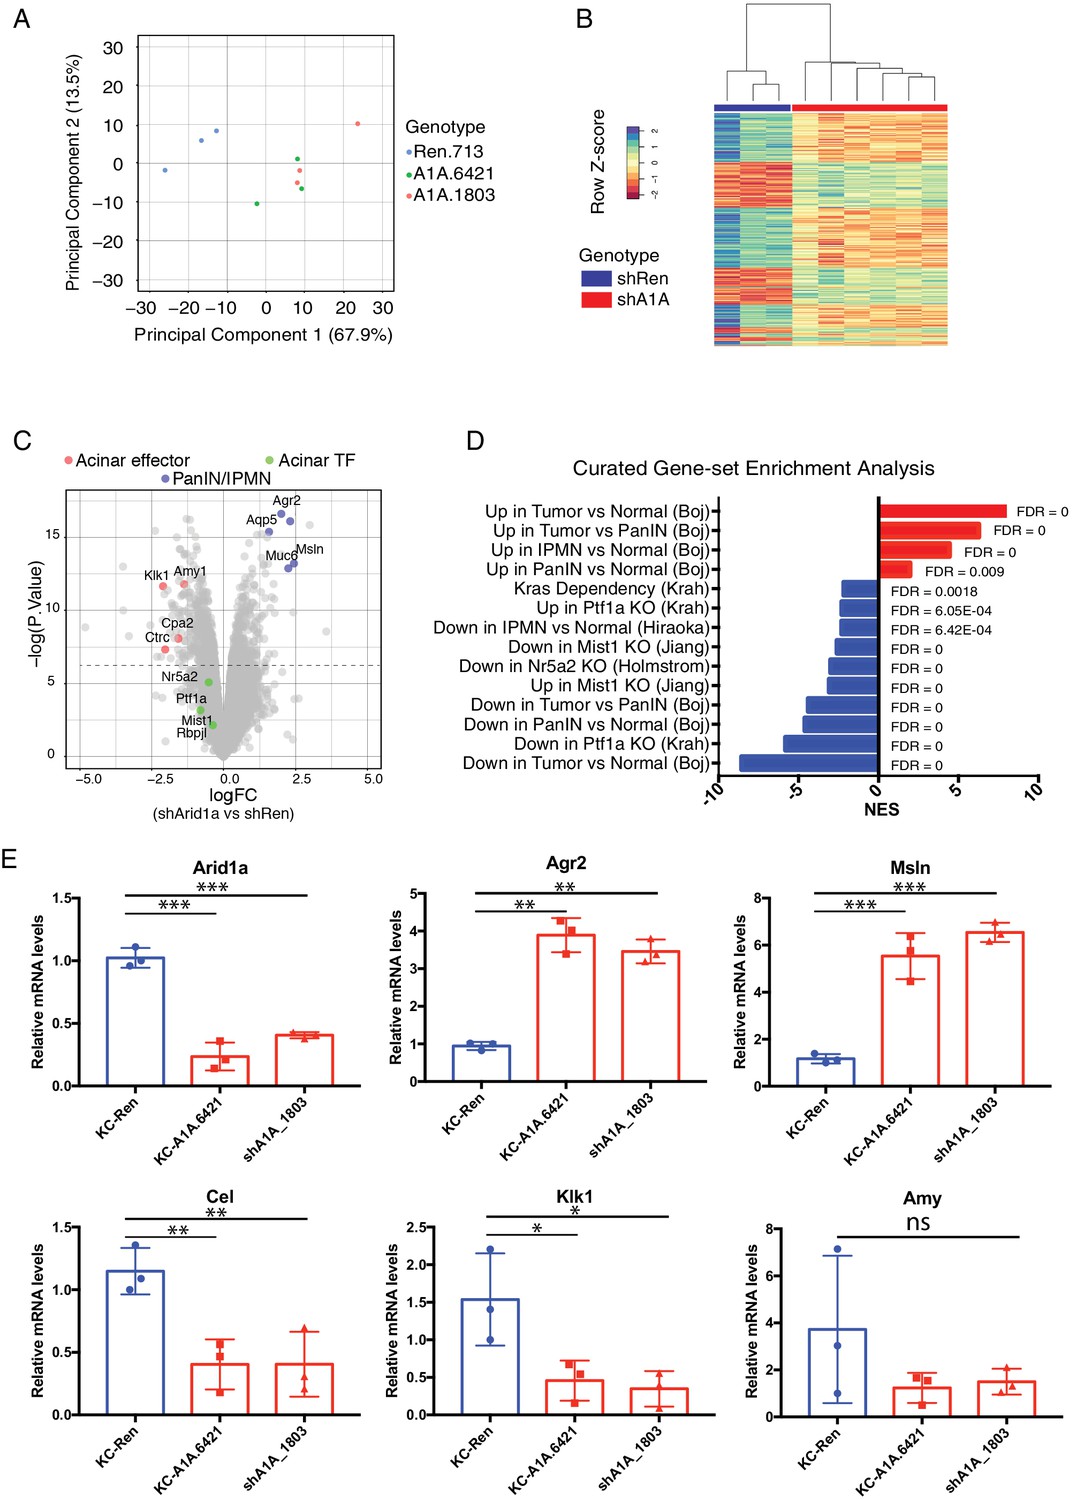
Acute Arid1a loss results in rapid transcriptional shifts in cell identity.
(A) Principal component analysis of RNAseq data for KC-RIK-shRen, -shArid1a.6421 and –shArid1a.1803 animals after 5 days on dox. three animals per group. (B) Unsupervised clustering of samples by genes differentially expressed between shRen and shArid1a groups clusters the two Arid1a shRNAs together. (C) Volcano plot of significant differentially expressed genes upon Arid1a knockdown (FDR threshold <0.05 and log2FC cutoff of 1). (D) Literature-curated gene sets altered upon Arid1a knockdown; Sources listed in parentheses. (E) qPCR assessment of acinar effectors and genes associated with mucinous pancreatic lesions after 5 days of dox treatment (same timepoint as RNAseq) in shRen and shArid1a animals (n = 3 per genotype). * Shown are mean values ± standard deviation from three biological replicates (independent animals). *p<0.05, **p<0.01, ***, p<0.0001.
-
Figure 6—source data 1
QPCR validation of transcriptional changes observed by RNAseq.
- https://doi.org/10.7554/eLife.35216.020
Figure 6—figure supplement 1

Transcriptional changes induced upon Arid1a loss are reflected by histological expression changes.
(A) Immunofluorescence staining KC-RIK-shRen and -shArid1a tissue for the Arid1a and GFP at RNAseq collection timepoint (5 days dox). Nuclei are labeled with DAPI. (B) Representative immunohistochemistry and immunofluorescence of selected genes up- or down-regulated by RNAseq, analysed after 2 weeks of dox treatment. Scalebar 100 μm.
Figure 7 with 1 supplement
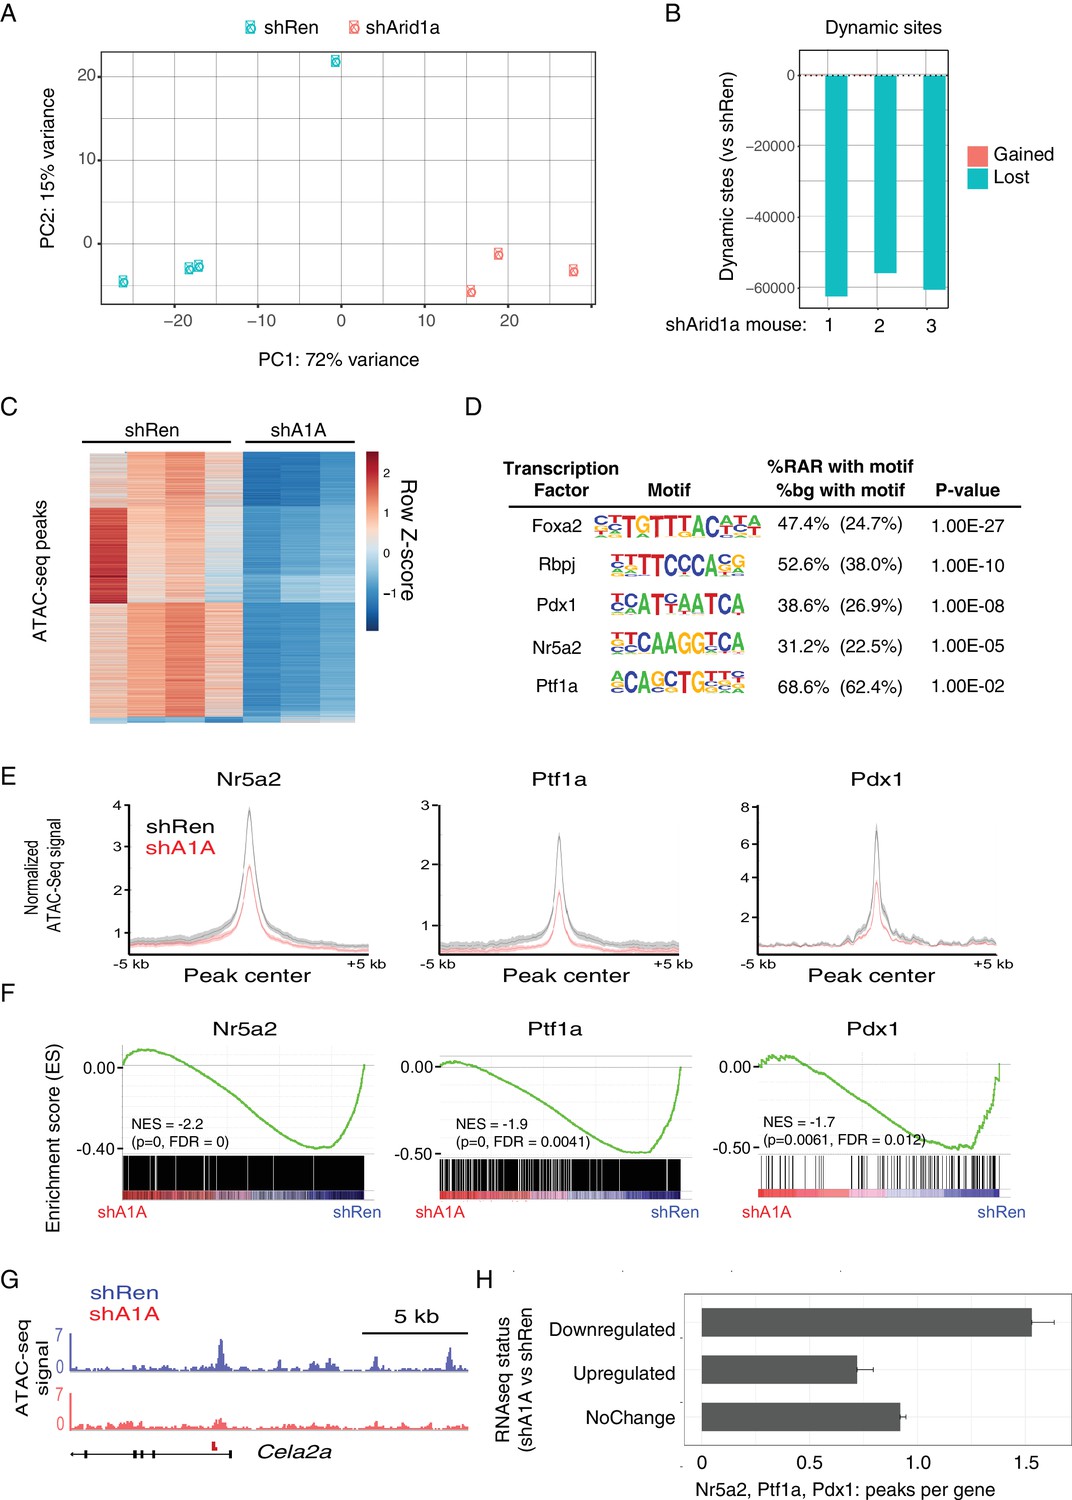
Acute Arid1a silencing decreases chromatin accessibility.
(A) Principal component analysis of ATACseq data for KC-RIK-shRen and shArid1a.6421 animals after acute silencing. (B) Relative comparison of dynamic ATACseq peaks in acute KC-RIK-shArid1a.6421 animals vs one shRen control animal. Shown are the number of peaks that are gained (red) or lost (blue) in three independent shArid1a animals plotted in comparison to a representative shRen animal. Virtually all dynamic peaks are reduced in shArid1a pancreas. (C) Heatmap illustrating accessibility levels of dynamic peaks across KC-RIK-shRen and shArid1a.6421 animals. (D) Pancreatic transcription factor motifs (HOMER) enriched in regions of reduced accessibility in shArid1a. (E) ATAC-seq metaprofile of chromatin accessibility in shRen vs shArid1a cells across a 5 Kb window centered on previously defined binding sites for the indicated TFs. GSE accession numbers of ChIP-Seq datasets used are indicated in Figure 7—figure supplement 1D. (F) GSEA showing reduced expression of genes associated with peaks bound by the indicated TFs and losing accessibility in shArid1a.6421 vs shRen mice. (G) Example gene with reduced accessibility peak away from TSS in shArid1a pancreas. (H) Bar plot of TF density indicating the number of Ptf1a, Nr5a2, or Pdx1 peaks per gene with reduced chromatin accessibility upon Arid1a suppression. Genes were grouped by expression status in shA1A vs shRen RNA-seq as upregulated, downregulated, or stable. Error bars represent standard error of the mean.
Figure 7—figure supplement 1
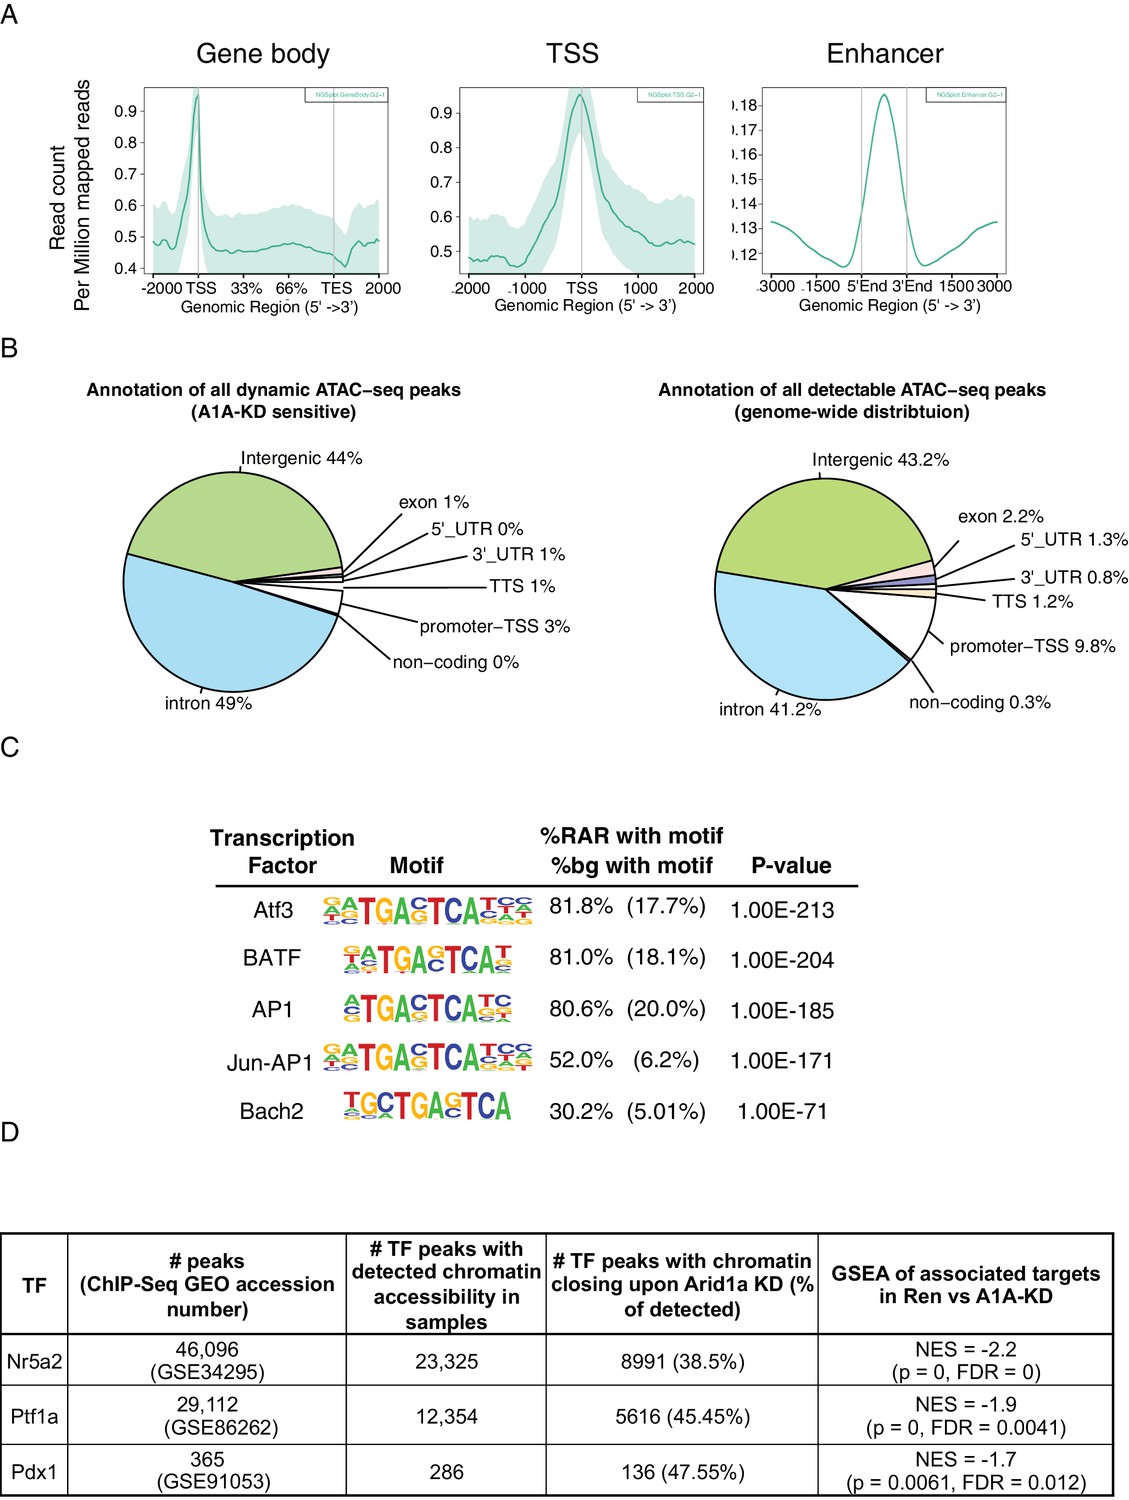
Peaks with decreased accessibility upon Arid1a depletion are enriched for intronic/intergenic regions and acinar TF binding sites.
(A) Read count per million mapped reads for gene body, transcription factor start site and putative enhancer regions of genes. (B) Genomic annotation of dynamic peaks upon Arid1a suppression vs all ATAC-seq peaks regardless of dynamic. (C) Transcription factor motifs (HOMER) enriched in regions of reduced accessibility in shArid1a. (D) Table summarizing the generation of gene sets comprising TF targets losing chromatin accessibility in shArid1a vs shRen, and used for Figure 7F GSEAs.
Tables
Key resources table
| Reagent type (species) or resource | Designation | Source or reference | Identifiers | Additional information |
|---|---|---|---|---|
| Strain, strain background (M. musculus) | KC-RIK-shArid1a.6421 | This paper | ||
| Strain, strain background (M. musculus) | KC-RIK-shArid1a.1803 | This paper | ||
| Strain, strain background (M. musculus) | KC-RIK-shRen.713 | This paper | ||
| Antibody | GFP antibody (chicken polyclonal) | Abcam | Abcam Cat# ab13970, RRID:AB_300798 | |
| Antibody | GFP antibody (rabbit monoclonal) | Cell Signaling Technology | Cell Signaling Technology Cat# 2956P, RRID:AB_10828931 | |
| Antibody | mKate2 (rabbit polyclonal) | Evrogen | Evrogen Cat# AB233, RRID:AB_2571743 | |
| Antibody | Arid1a (rabbit polyclonal) | Cell Signaling Technology | Cell Signaling Technology Cat# 12354, RRID:AB_2637010 | |
| Antibody | Arid1a (mouse monoclonal) | Santa Cruz | Santa Cruz Biotechnology Cat# sc-32761, RRID:AB_673396 | |
| Antibody | Ki67 (mouse) | BD Biosciences | BD55609 | |
| Antibody | Cpa1 (goat polyclonal) | R and D | R and D Systems Cat# AF2765, RRID:AB_2085841 | |
| Antibody | Clusterin (goat polyclonal) | Santa Cruz | Santa Cruz Biotechnology Cat# sc-6419, RRID:AB_673567 | |
| Antibody | Sox9 (rabbit polyclonal) | Millipore | Millipore Cat# AB5535, RRID:AB_2239761 | |
| Antibody | CD19 Troma III (rat monoclonal) | Developmental Studies Hybridoma Bank | DSHB Cat# TROMA-III, RRID:AB_2133570 | |
| Antibody | Cleaved casp3 (rabbit monoclonal) | Cell Signaling Technology | Cell Signaling Technology Cat# 9664, RRID:AB_2070042 | |
| Antibody | CK8 (mouse monoclonal) | Biolegend | BioLegend Cat# 904801, RRID:AB_2565043 | |
| Antibody | CD45 (rat monoclonal) | Abcam | Abcam Cat# ab25386, RRID:AB_470499 | |
| Antibody | E cadherin (monoclonal) | BD Biosciences | BD Biosciences Cat# 610181, RRID:AB_397580 | |
| Antibody | donkey- anti-chicken CF488 | Sigma | Sigma-Aldrich Cat# SAB4600031, RRID:AB_2721061 | |
| Antibody | goat-anti-chicken AF488 | Life Technologies | Molecular Probes Cat# A-11039, RRID:AB_142924 | |
| Antibody | goat anti-rabbit AF594 | ThermoFisher | Thermo Fisher Scientific Cat# A-11037, RRID:AB_2534095 | |
| Nextera Tn5 transposase | Illumina | FC-121–1030 | ||
| Commercial assay or kit | Taqman copy number assay for GFP | Life Technologies/Thermo Fisher | 4400291 | |
| NEBNext High-Fidelity 2x PCR Master Mix | New England Biolabs | NEB M0541 | ||
| Software, algorithm | MSigDB database | http://software.broadinstitute. org/gsea/msigdb | ||
| Software, algorithm | BEDTools suite | http://bedtools.readthedocs.io | ||
| Software, algorithm | Homer v4.5 | http://homer.ucsd.edu/ | ||
| Other | ImmPress HRP | Vector | Vector Laboratories Cat# MP-7451, RRID:AB_2631198 | |
| Other | SuperSignal West Femto substrate | ThermoFisher | ||
| Other | Doxycycline diet (625 mg/kg) | Harlan | ||
| Other | M15 + LIF media | PMID: 24395249 | ||
| Other | DNase I | Sigma | DN25-100MG | |
| Other | Soybean Trypsin Inhibitor | Sigma | T9003-250mg | |
| Other | Dispase | Roche |
Additional files
-
Transparent reporting form
- https://doi.org/10.7554/eLife.35216.023
Download links
A two-part list of links to download the article, or parts of the article, in various formats.
Downloads (link to download the article as PDF)
Open citations (links to open the citations from this article in various online reference manager services)
Cite this article (links to download the citations from this article in formats compatible with various reference manager tools)
Arid1a restrains Kras-dependent changes in acinar cell identity
eLife 7:e35216.
https://doi.org/10.7554/eLife.35216


