Dendritic spikes in hippocampal granule cells are necessary for long-term potentiation at the perforant path synapse
- Seoul National University College of Medicine, Korea
Figures
Figure 1
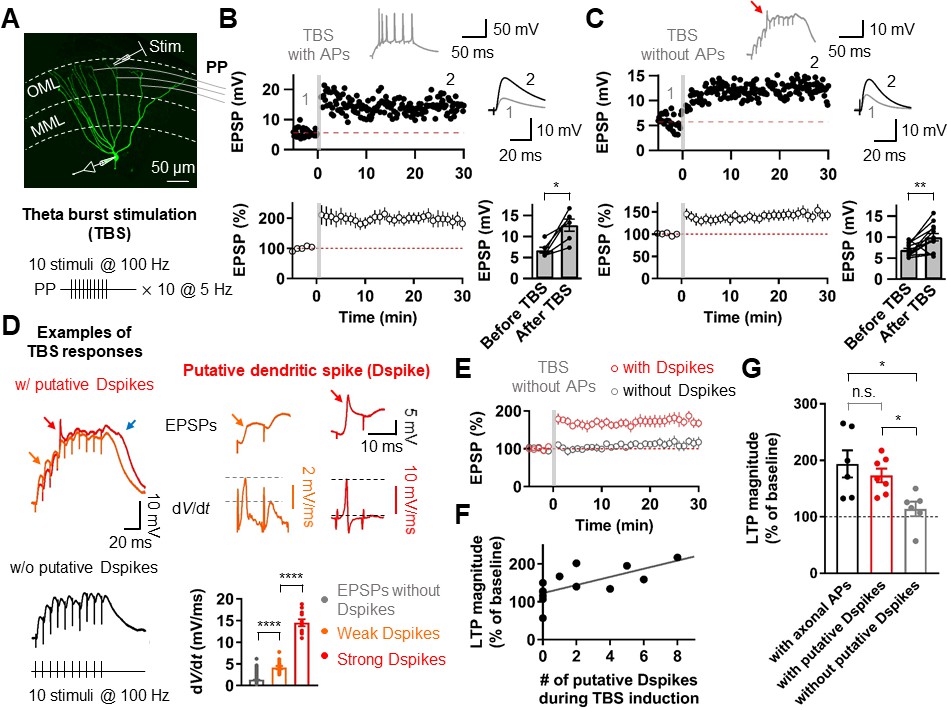
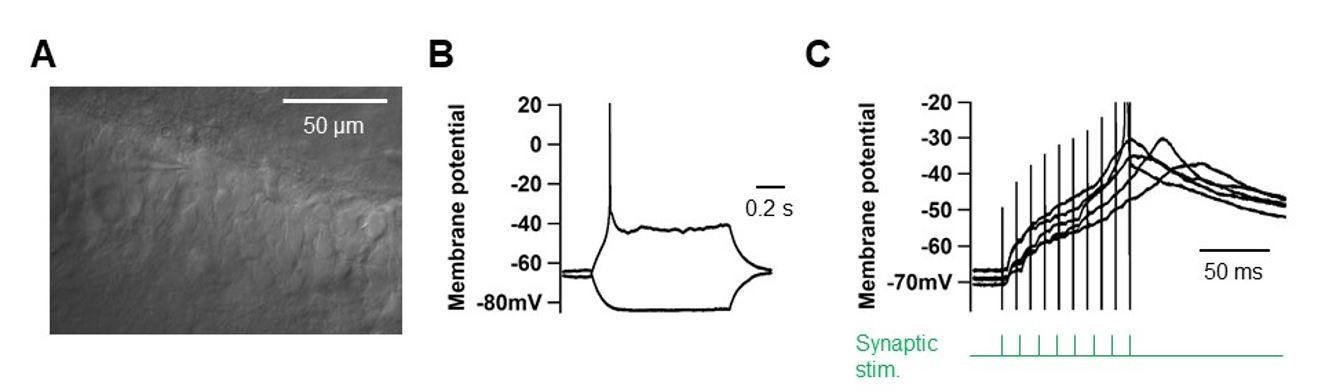
Putative dendritic spikes during theta-burst stimulation (TBS) induction are required for long-term potentiation (LTP) at the perforant-path (PP) to granule cell (GC) synapse.
(A) Maximum intensity projection of confocal stack fluorescence images of a GC (top) indicating the medial molecular layer (MML) and the outer molecular layer (OML). Synaptic responses of the PP were evoked by electrical stimulation in the OML. Scale bar is 50 µm. (bottom) Theta-burst LTP induction protocol. (B) Representative time course of EPSPs (top) and summary plot (bottom) before and after TBS of the PP synapses. Red line denotes average EPSP baseline value. Increment in EPSP amplitude denotes LTP. Representative traces, which correspond to the numbers in the time course plot, show the average of 30 EPSP traces before and 25–30 min after TBS (for all subsequent figures). Inset: example of the first burst of TBS responses showing initiation of multiple axosomatic APs during TBS induction upon increasing the stimulus intensity. (bottom, right) Summary bar plot of average EPSP amplitude before and after TBS indicating a significant increment in synaptic responses 25–30 min after TBS stimulation (n = 6, *p<0.05). (C) Same as (B) but no axosomatic AP initiation occurs during TBS. Inset: representative example of TBS responses. Arrow indicates a putative dendritic spike. (bottom right) Summary plot showing that a significant potentiation in EPSP amplitude was induced after TBS stimulation even in the absence of axosomatic APs (n = 13, **p<0.01). (D) (left) Representative somatic voltage traces when TBS stimulation evokes putative dendritic spikes (top) or not (bottom). The arrows indicate weak (orange) and strong (red) putative dendritic spikes and accompanying plateau potentials (blue arrow). (right) Somatic voltages (top row) and corresponding dV/dt (bottom row) of weak (orange) and strong (red) putative dendritic spikes in the burst responses (left) on an expaned time scale. Note that dV/dt values of the putative dendritic spikes increase sharply in a non-linear manner. (bottom, right) Summary bar graphs of dV/dt peak values of somatically recorded EPSPs with or without dendritic spikes (grey: EPSPs without putative Dspikes; orange: with weak putative Dspikes; red: with strong putative Dspikes). (E) Average time course of EPSPs when TBS stimulation evokes putative dendritic spikes and in the absence of putative dendritic spikes during TBS (black). LTP is induced only if putative dendritic spikes are present during TBS stimulation. (F) The number of putative dendritic spikes are significantly correlated with the magnitude of LTP. Black lines represent linear regressions (n = 13). (G) Bar summary graph and individual experiments (circles) indicating that experiments showing the occurrence of putative dendritic spikes (with putative Dspikes, red) during TBS induction induced a significant increment of LTP. Note that there are no significant differences in the magnitude of LTP when TBS stimulation evokes axosomatic APs (black) or putative dendritic spikes (red). Bars indicate mean ± SEM; circles represent data from individual cells. Lines connect data points from the same experiment. *0.01 ≤ P < 0.05. **p<0.01. ****p<0.0001. Single-cell data (top panel in B and C) and mean data (bottom panels in B and C, and E; mean ± SEM). Vertical gray bars in B, C, and E indicate the time point of the induction protocol.
-
Figure 1—source data 1
Source data for Figure 1.
- https://doi.org/10.7554/eLife.35269.003
Figure 2 with 1 supplement
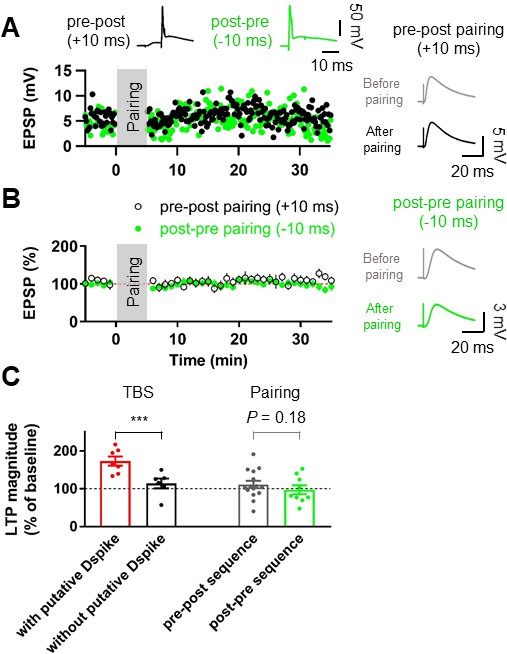
Pairing protocols did not induce LTP at the lateral PP-GC synapses.
(A) Representative time courses of EPSP amplitudes before and after pairing presynaptic stimulation of the PP synapses and postsynaptic action potentials with short time intervals (+10 ms, Pre–post sequence, black, top left inset; –10 ms, Post–pre sequence, green, top right inset). Both pairing protocols induce no significant changes in EPSP, suggesting that action potential (AP) backpropagation is not necessary for LTP induction. Right inset shows that LTP was not induced after pairing of EPSPs and APs in both pre-post (top) and post-pre sequences (bottom). (B) The average EPSP time courses of pre-post (black) and post-pre (green) induction protocols of pairings between synaptic responses and postsynaptic APs, showing that low-frequency pairing protocols failed to induce LTP. (C) Summary data indicating that experiments showing the occurrence of putative dendritic spikes during TBS protocol induced a significant increment of LTP, whereas pairings of synaptic stimulation with postsynaptic APs did not show a statistically significant LTP induction, independent of temporal order. Bars indicate mean ± SEM; circles represent data from individual cells. Lines connect data points from the same experiment. ***p<0.005. Single-cell data (A) and mean data (B); mean ± SEM). Vertical gray bars in (A) and (B) indicate the time point of the induction protocol.
-
Figure 2—source data 1
Source data for Figure 2.
- https://doi.org/10.7554/eLife.35269.006
Figure 2—figure supplement 1
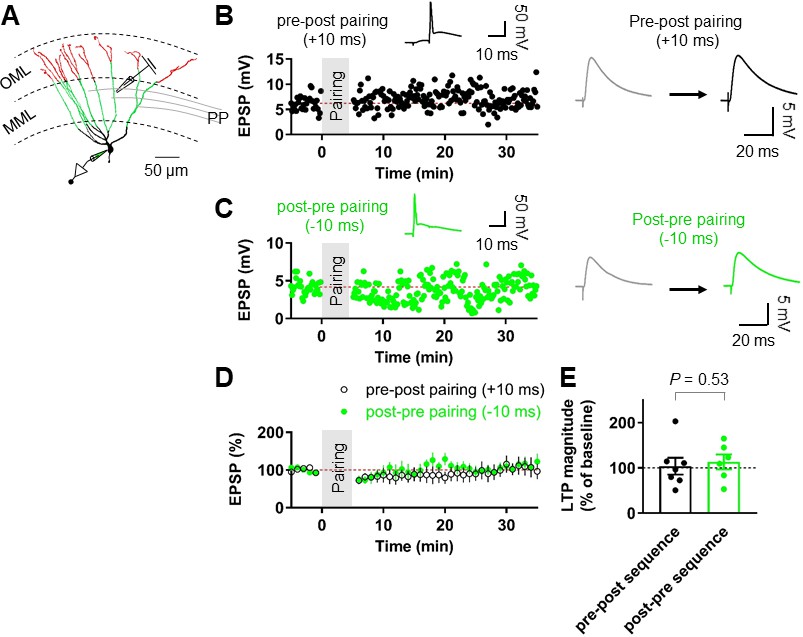
Pairing protocols did not induce LTP at the medial perforant path (MPP)-GC synapses.
(A) An example of reconstructed granule cells and diagram illustrating the experimental configuration. Note that a stimulating electrode was placed in the middle third of the molecular layer. Scale bar is 50 µm. (B) Representative time course of EPSP amplitude, showing that repeated pairing of EPSPs and following postsynaptic APs (pre-post sequence; Δt =+10 ms, inset) induced no significant LTP at MPP-GC synapses. (Right) EPSPs before (gray) and 25–30 min after induction (black). (C) Representative time course of EPSP amplitude, showing that post-presynaptic pairing (Δt = –10 ms, inset) induces no LTP at MPP-GC synapses. (Right) EPSPs before (gray) and 25–30 min after induction (green). (D) Summary graph of pairing-induced LTP experiments at the MPP-GC synapses demonstrating the absence of LTP. (E) Summary graph and scatter (individual cells) plot of the change in EPSP amplitude before and after the pairing protocols. Bars indicate mean ± SEM; circles represent data from individual cells. Single-cell data (B,C) and mean data (D; mean ± SEM). Vertical gray bars in (B, C and D) indicate the time point of the induction protocol.
-
Figure 2—figure supplement 1—source data 1
Source data for Figure 2—figure supplement 1.
- https://doi.org/10.7554/eLife.35269.007
Figure 3
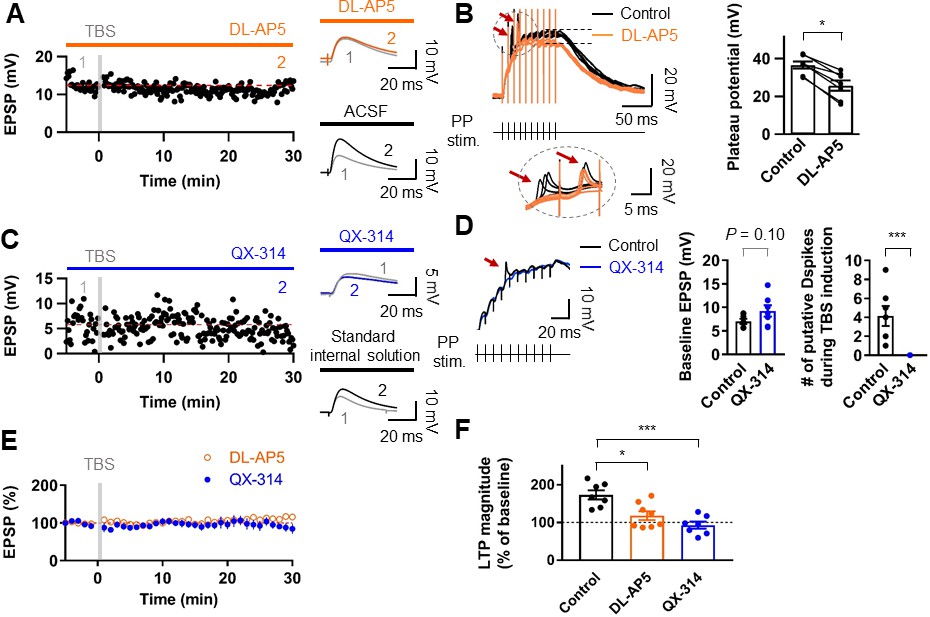
Induction of LTP at PP–GC synapses requires activation of NMDARs and the involvement of Na+ channels.
(A) An example of the time course of EPSP amplitude when TBS protocols was applied in the presence of the NMDAR antagonist, DL-AP5 (50 µM). Red line indicates the average EPSP amplitude. Insets show that EPSP did not increase in the presence of DL-AP5 (orange) after TBS, but a robust LTP was induced when TBS was applied in standard saline (ACSF, black). (B) (left) Long-duration plateau potentials are mediated by NMDA receptor channels. Somatically recorded voltages in response to high-frequency burst sitmulation (green, 10 shocks, 100 Hz) under control (black) and in the presence of DL-AP5 (50 µM; orange). The inset shows putative dendritic spikes (indicated by the red arrow) before and after the addition of DL-AP5; Note that putative dendritic spikes are resistant to the NMDAR blockers. (right) Summary of the effects of DL-AP5 on plateau potentials. Peak amplitdue of plateau potentials were measured after the stimulus (indicated by dashed lines; Control: 36.6 ± 2.2 mV; DL-AP5: 25.6 ± 3.2 mV; n = 6, *p<0.05). (C) A representative time course of EPSP amplitude before and after TBS when the cells were dialyzed with a sodium-channel blocker, QX-314 (5 mM). Inset shows that the averaged EPSP amplitude did not change when blocking sodium channels with QX-314 (blue) despite TBS induction. In contrast, when cells were dialyzed with the standard intracellular solution, the amplitude of EPSP increased after TBS (i.e. LTP). (D) The effects of intracellular QX-314 on dendritic spike initiation in response to high-frequency PP sitmulation. (left) Representative traces of EPSPs in response to PP stimulation with (blue) and without (black, control) QX-314. Putative dendritic spikes (arrow) were observed only under control condition. (right) Bar graphs indicate the baseline EPSP amplitude (EPSPcontrol: 7.05 ± 0.54 mV, n = 7; EPSPQX-314: 9.24 ± 1.21 mV, n = 7; p=0.10) and the number of putative dendritic spikes during TBS induction (control: 4.14 ± 1.06, n = 7; QX-314: 0, n = 7; ***p<0.005) in two groups. (E) Summary plot of TBS-induced LTP experiments in the presence of DL-AP5 (orange) and with dialysis of QX-314 in the recording pipette (blue). Both treatments prevented the induction of LTP at the PP to GC synapse. (F) Summary bar graph and individual average EPSP amplitudes after TBS in control (standard saline, black), bath application of DL-AP5 (orange) and dialysis of QX-314 (blue). Treatments with DL-AP5 and QX-314 showed a significant difference compared to the standard LTP induction (DL-AP5, *p<0.05; QX-314, ***p<0.005; compared to control in Figure 1I). Representative traces in A and C correspond to the numbers (1 and 2) n the time-course plot. Bars indicate mean ± SEM; circles represent data from individual cells. Lines connect data points from the same experiment. Single-cell data (A,C) and mean data (E; mean ± SEM). Vertical gray bars in (A, C,) and (E) indicate the time point of the induction protocol.
-
Figure 3—source data 1
Source data for Figure 3.
- https://doi.org/10.7554/eLife.35269.009
Figure 4

Properties of backpropagating APs in the dendrites of GCs.
(A) Morphological reconstruction of a GC with representative double somatic and dendritic whole-cell recording configuration used to analyze the AP backpropagation. Scale bar is 50 µm. (B) A train of APs elicited by a 1 s current pulse applied at the soma. Black traces indicate somatic voltage and corresponding current; red traces indicate dendritic voltage and corresponding current. (C) First AP in the train displayed at expanded time scale. Voltage traces (soma in black, dendrite in red) indicate that the AP is initiated first near the soma and propagated back into the dendrites with a lower amplitude. (D) Summary graph to compare somatic (black) and dendritic (red) AP peak amplitude. Bars indicate mean ± SEM; circles represent data from individual cells. Lines connect data points from the same experiment. ***p<0.005. (E) Scatter plot of peak amplitude of the backpropagating AP against the absolute physical distance of the recording site from the soma (56 somatodendritic recordings). The blue curve represents a mono-exponential fit to the data points between 0 and 212 µm. (F) Scatter plot of the bAP amplitude normalized to the corresponding axosomatic AP amplitude plotted against the distance of the recording site scaled to the total dendritic length (278 ± 7.4 μm; n = 11). The blue curve is a mono-exponential fit to the data. (G) Scatter plot of AP latency as a function of the distance from the soma (56 somatodendritic recordings) together with a linear regression (blue line) to compute the average conduction velocity of the AP into the dendrites; dendritic AP propagation velocity was 226 µm/ms. Single-cell data (E–G, red) and mean data (E), black; mean ± SEM).
-
Figure 4—source data 1
Source data for Figure 4.
- https://doi.org/10.7554/eLife.35269.011
Figure 5 with 3 supplements
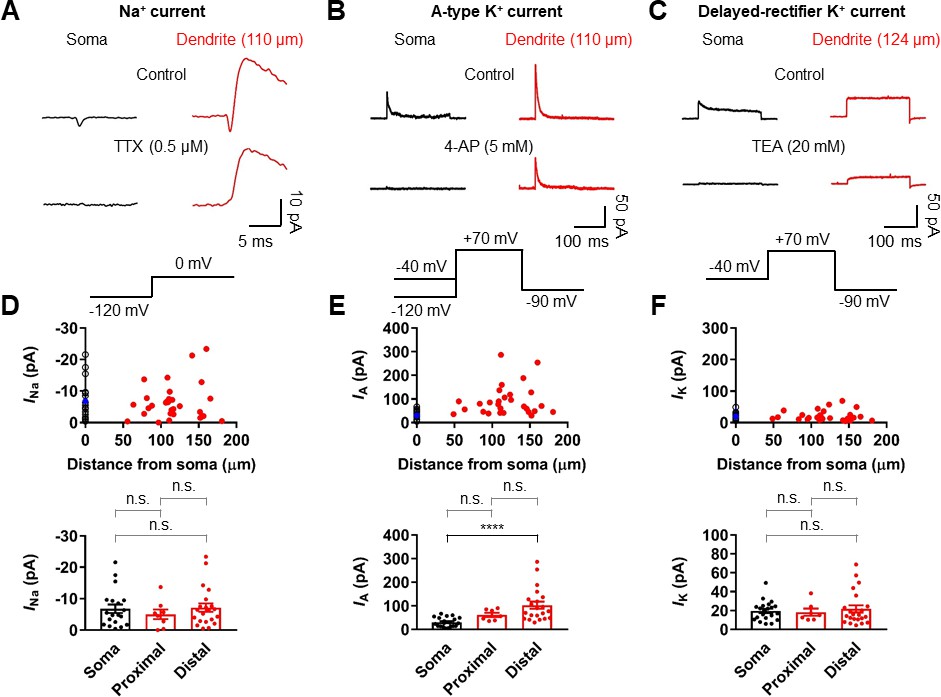
Differential Na+ and K+ channel densities in the dendrites of GCs.
(A) Averages of Na+ current recorded from outside-out patches from soma (black, averages of 25–27 sweeps) and dendrite (red, 110 μm, averages of 20 sweeps) in response to a test pulse potential to 0 mV (bottom). Na+ currents were recorded in the presence of 4-AP (5 mM) and TEA (20 mM). Left, soma; right, dendrite; Top, control; bottom, currents in the presence of 0.5 μM TTX in the bath. Leak and capacitive currents were subtracted by a ‘P over –4’ correction procedure. Note that the remaining outward current is the resistant K+ current component to 5 mM 4-AP (Figure 5—figure supplements 1 and 2; Hoffman et al., 1997). Blockade of outward K+ currents by extracellular 4-AP (5 mM) only had a negligible effects on the peak amplitude of Na+ currents (Figure 5—figure supplement 2). (B) Averages of A-type K+ current evoked in outside-out patches excised from soma (black, averages of 6–8 sweeps) and dendrite (red, 110 μm averages of 15–19 sweeps) in response to a test pulse potential to +70 mV (top). Transient A-current was measured by subtraction of traces with a −40 mV prepulse from those with a −120 mV prepulse. Left column, soma; Right column, dendrite; Top row, control; Bottom row, currents in the presence of 5 mM 4-AP in the bath. (C) Averages of delayed rectifier K+ current evoked in outside-out patches excised from soma (black, averages of 6–8 sweeps) and dendrite (red, 124 μm, averages of 10–18 sweeps) in response to a test pulse potential to +70 mV (top). Delayed rectifier K+ current was measured by a −40 mV prepulse. Left column, soma; Right column, dendrite; Top row, control; Bottom row, currents in the presence of 20 mM TEA in the bath. See also Figure 5—figure supplement 1. (D, E, F) (top) Plot of amplitude of Na+ channel activity (D), A-type K+ channel activity (E), and delayed rectifier K+ channel activity (F) as a function of distance from the soma, demonstrating that various channels are differentially expressed across the length of GC dendrites. Data from 19, 21, and 21 somatic (black circles) and 29, 28, and 29 dendritic patches (red circles). Blue circles represent the average of somatic recordings. (bottom) Summary bar graph showing the peak amplitude of Na+ (D), A-type K+ (E) and delayed rectifier K+ (F) channel activity in the soma, proximal dendrite (<100 μm) and distal dendrite (≥100 μm). Bars indicate mean ± SEM; circles represent data from individual experiments. n.s., not significant; ****p<0.0001 by Kruskal Wallis test with post hoc multiple comparison using Dunn’s test.
-
Figure 5—source data 1
Source data for Figure 5.
- https://doi.org/10.7554/eLife.35269.016
Figure 5—figure supplement 1
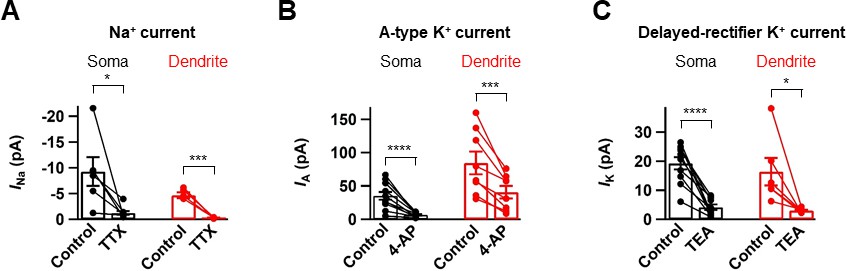
Pharmacological analysis of voltage-dependent Na+ and K+ currents.
(A) Bar graph summarizing the effects of the INa channel blocker TTX (0.5 µM) on the transient Na+ currents excised from the soma (left, black, n = 6) and the dendrite (right, red, n = 6). (B) Bar graph summarizing the effects of the IA channel blocker 4-AP (5 mM) on the transient outward K+ currents excised from the soma (left, black, n = 10) and the dendrite (right, red, n = 8). (C) Bar graph summarizing the effects of the IK channel blocker TEA (20 mM) on the steady-state outward K+ currents excised from the soma (left, black, n = 10) and the dendrite (right, red, n = 6). *0.01 ≤ P < 0.05; ***p<0.005; ****p<0.0001 by paired t-test. Bars indicate mean ± SEM; circles represent data from individual cells. Lines connect data points from the same experiment.
-
Figure 5—figure supplement 1—source data 1
Source data for Figure 5—figure supplement 1.
- https://doi.org/10.7554/eLife.35269.017
Figure 5—figure supplement 2

The dose-dependent effect of 4-AP on transient outward currents and Na+ currents.
(A) Representative traces showing dendritic A-type K+ currents (113 μm from the soma, averages of 10 sweeps) evoked as in Figure 5B in control (black) and subsequently in 5 mM 4-AP (red), followed by 10 mM 4-AP (purple) in the bath. Inset shows an expanded traces corresponding to the dashed box in the left panel. (B) Summary plot indicating that 4-AP reduced the transient K+ current in a dose-dependent manner. Colored circles represent data from individual dendritic recordings at different distances (right). Lines connect data points from the same experiment. Filled circles (blue) represent average data of the normalized peak currents, showing the percentage block of transient outward K+ currents in the presence of 5 and 10 mM 4-AP (right axis; 5 mM 4-AP, n = 8, ***p<0.005 by paired t-test). (C) Representative traces showing averages of Na+ currents (top, 110 μm from the soma, averages of 10 sweeps) evoked as in Figure 5A in control (black) and subsequently in 5 mM 4-AP (red), followed by 0.5 μM TTX and 5 mM 4-AP (blue) in the bath. Inset shows an expanded traces corresponding to the dashed box on the left. (D) Summary graph showing the effects of 5 mM 4-AP and 0.5 μM TTX on Na+ currents. Colors as in B). Filled blue circles show the average of the normalized peak currents demonstrating that 5 mM 4-AP did not significantly affect the peak of transient inward currents (n = 6, p=0.69; n.s., not significant, by paired t-test). These inward currents were blocked by 0.5 μM extracellular TTX (n = 5, ***p<0.005 by paired t-test). Open circles represent data from individual cells and filled circles represent mean data (mean ± SEM).
-
Figure 5—figure supplement 2—source data 1
Source data for Figure 5—figure supplement 2.
- https://doi.org/10.7554/eLife.35269.018
Figure 5—figure supplement 3
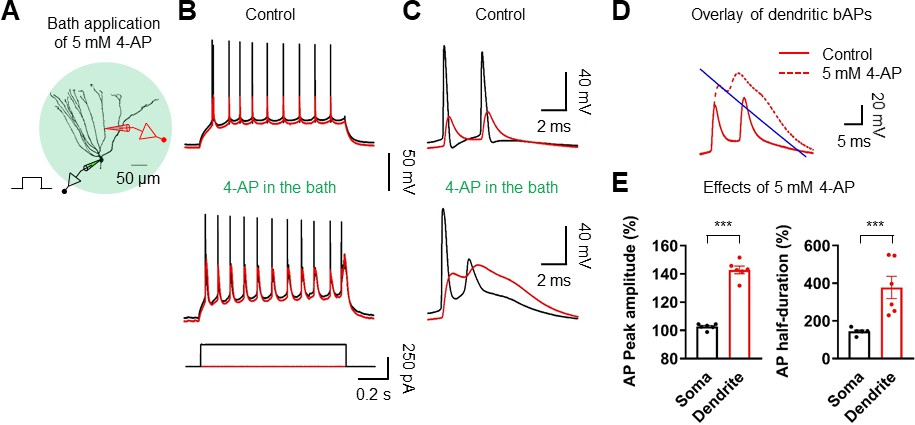
Effect of 4-AP on AP backpropagation.
(A) Diagram of the experimental setup displaying simultaneous recordings from the soma (black) and the dendrite (red) of a GC in the presence of 5 mM 4-AP. Scale bar is 50 µm. (B) Sample traces of somatic (black) and dendritic (red) APs evoked by somatic current injection in the absence (top; control) or the presence of 4-AP (5 mM; bottom) in the bath. (C, D) First and second APs (C) in the train displayed at expanded time scale and overlay of dendritic voltages (D) under control and in the presence of 4-AP (dashed line). The blue line illustrates an exponential fit to the repolarizing phase of the 1 st dendritic AP to calculate the duration at half-maximal amplitude. (E) Summary graph of the effects of 5 mM 4-AP on AP peak amplitude (Left; Soma: 102.6 ± 0.8%; Dendrite: 142.8 ± 2.6%; n = 6, ***p<0.005) and duration at half-maximal amplitude (right; soma: 144.4 ± 7.1%; dendrite: 377.6 ± 59.0%; n = 6, ***p<0.005) in six somatodendritic recordings. Bars indicate mean ± SEM; circles represent data from individual cells.
-
Figure 5—figure supplement 3—source data 1
Source data for Figure 5—figure supplement 3.
- https://doi.org/10.7554/eLife.35269.019
Figure 6 with 2 supplements

Initiation of dendritic spikes in GCs.
(A) Schematic recording configuration of a simultaneous somatic (black) and dendritic (red) patch-clamp recording on a GC. (B) Local dendritic spikes (arrow) in GCs evoked by dendritic current injection pulses of increasing amplitude (black, voltage in the soma; red, voltage in the dendrite). (C) The relationship between voltage amplitude (black, soma; red, dendrite) and dendritic injection resembles a step-function, suggesting the all-or-none nature of the dendritic spike (arrow). Peak values of dendritic spikes were measured after subtraction of scaled subthreshold dendritic responses. (D) A summary plot showing whether a spike was evoked first in the dendrite (right, red) or in the soma (left, black) for an increasing current pulse injection at the dendrite. Red squares indicate the cells showing a dendritic spike followed by an axosomatic spike. Red triangles show the cells showing isolated dendritic spike. Black circles indicate the cells showing only an axosomatic spike. The green shaded area approximately corresponds to the outer molecular layer. The black circle and red lines in the plot indicate the soma and the dendrite, respectively.
Figure 6—figure supplement 1
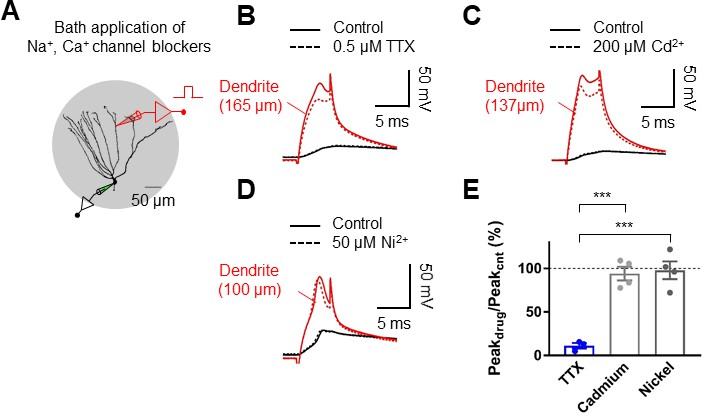
Dendritic spikes are mediated by voltage-gated Na+ channels.
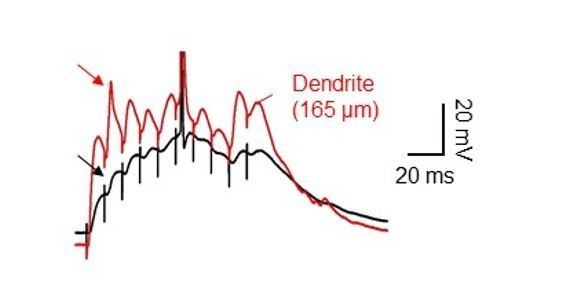
(A) Schematic diagram illustrating the recording configuration of a simultaneous somatic (black amplifier) and dendritic (red amplifier) patch-clamp recording on a GC combined with bath application of blockers of voltage-gated Na+ and Ca2+ channel. Scale bar is 50 µm. (B) Blockade of voltage-gated Na+ channels by a bath application of TTX (0.5 μM) eliminated dendritic spikes elicited by a 5 ms current pulse injected into the dendritic electrode. (C) Application of 200 μM CdCl2 did not abolish dendritic spikes. Bath application of CdCl2 did not affect the late depolarizing phase of the dendritic spikes (S.K., unpublished observations). (D) Application of 50 μM NiCl2 did not abolish dendritic spikes. (E) Summary of the effects of the indicated pharmacological agents on the peak of dendritic spikes. The dendritic recording sites are 165 μm (B), 137 μm (C), and 100 μm (C) from the soma, respectively. Bars indicate mean ± SEM; ***p<0.005 by Student’s t-test; Black traces: somatic voltage; red traces: dendritic voltage.
-
Figure 6—figure supplement 1—source data 1
Source data for Figure 6—figure supplement 1.
- https://doi.org/10.7554/eLife.35269.023
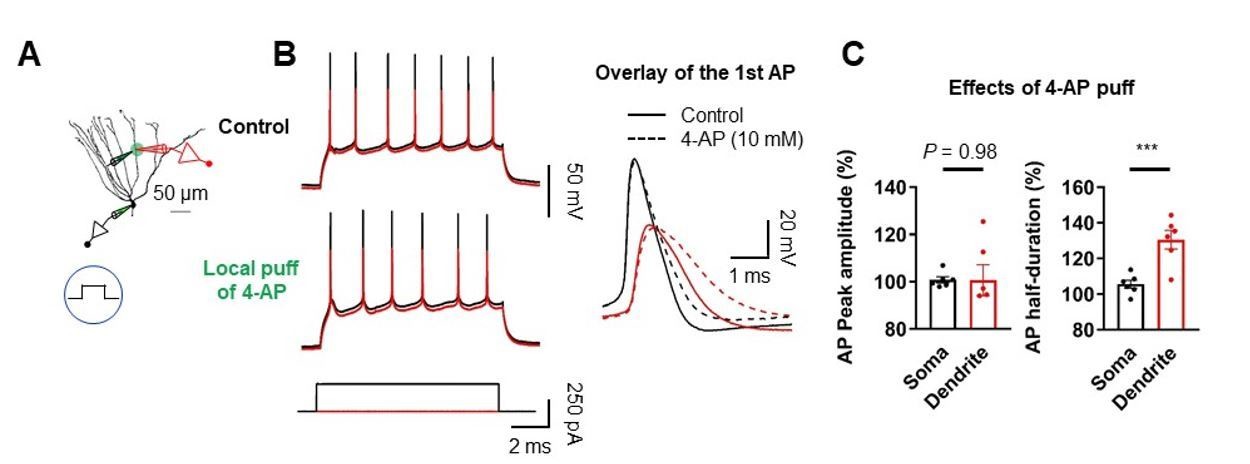
Figure 6—figure supplement 2

Dendritic A-type K+ channels control dendritic spike initiation.
(A) Diagram of the experimental setup illustrating the recording configuration of a simultaneous somatic (black amplifier) and dendritic (red amplifier) patch-clamp recording on a GC combined with focal application of 10 mM 4-AP directly to the dendritic patch. Scale bar is 50 µm. (B) Somatic and dendritic voltage responses to dendritic current injection pulses with increasing amplitude (left: 400 pA; right; 500 pA). Local application of 4-AP to the dendrite near the recording pipette tip decreased the threshold for initiating dendritic spikes (arrows). Black traces represent somatic signal and red traces represent dendritic signal. Dashed line indicates the voltage response after puff application of 4-AP. The dendritic recording site is 102 μm from the soma. (C) Summary of the effects of local application of 4-AP on the threshold required to initiate dendritic spikes (Control, 0.84 ± 0.15 nA; 4-AP, 0.76 ± 0.14 nA; n = 8, ***p<0.005, Paired t-test). Bars indicate mean ± SEM. Lines connect data points from the same experiment.
-
Figure 6—figure supplement 2—source data 1
Source data for Figure 6—figure supplement 2.
- https://doi.org/10.7554/eLife.35269.024
Figure 7
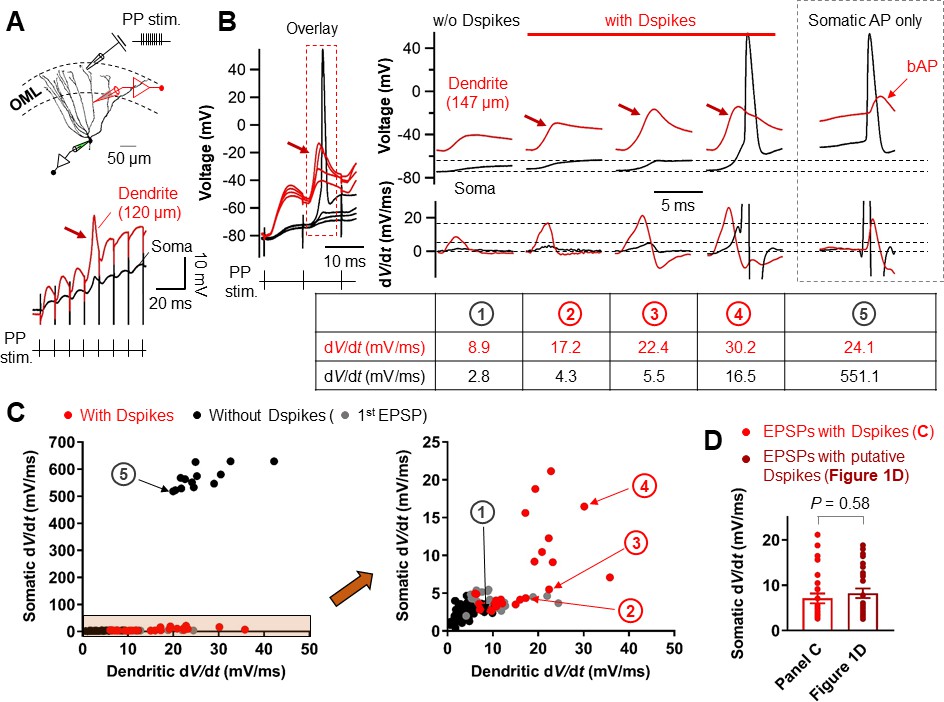
Relationship between the dV/dt of somatically and dendritically recorded voltages during dendritic spikes generation.
(A) (top) Schematic recording configuration of a triple pipette consisting of electrical stimulation of the PP synapses in the OML, dendritic patch-clamp recording (120 µm from the soma, red) and somatic whole-cell recording (black). Scale bar is 50 µm. (bottom) Dendritic spikes can be identified as larger spikes in the dendrite (red arrow) with the corresponding small spike at the soma (black). (B) (left) Somatic and dendritic voltages in response to a high-frequency PP stimulation with a constant stimulus intensity are shown superimposed for comparison. The recording site on the dendrite is 147 μm from the soma. (right) Traces of somatic (black) and dendritic (red) voltage responses (top row) on the left (red box) and corresponding dV/dt (bottom). dV/dt peak amplitudes of each traces were summarized in the table (bottom). The red arrows indicate the dendritic spikes. When dendritic spikes were present, the corresponding somatic voltage changes were used for analysis of dV/dt peaks. For comparison, somatic and dendritic membrane voltages and corresponding dV/dt traces during axosomatic AP generation are also shown on the right (dashed box). Encircled numbers indicate correspondence between traces in B) and data points in C). (C) (left) Summary plot of peaks in somatic dV/dt against corresponding peaks in dendritic dV/dt for four simultaneous somatodendritic recordings in response to high-frequency burst stimulation of the PP synapses (dendritic recording sites are from 136 µm to 175 µm from the soma). (right) An enlarged view of the box (orange) in the left panel. Black circles, in the absence of dendritic spikes; red circles, in the presence of the dendritic spikes; gray circles, data points from the first EPSPs (EPSP1). Note that somatic dV/dt peak amplitudes of subthreshold EPSP1s were comparable to those of the somatic traces when dendritic spikes were present. (D) Summary bar graphs of dV/dt peak amplitudes of somatically recorded dendritic spikes in C) (red) and in Figure 1D. Bars indicate mean ± SEM; circles represent data from individual cells.
-
Figure 7—source data 1
Source data for Figure 7.
- https://doi.org/10.7554/eLife.35269.026
Figure 8 with 1 supplement

Blockade of Na+ channels prevent dendritic spikes and LTP induction by TBS.
(A) Schematic diagram showing the experimental configuration. In these experiments, the sodium channel blocker TTX was applied by bath perfusion. Scale bar is 50 µm. (B) Bath application of TTX (10 nM) prevents the generation of dendritic spikes evoked by synaptic stimulation (black), as seen on the somatic whole-recording trace (blue). Note that decreasing availability of Na+ channels by 10 nM TTX had a negligible effect on the EPSP1 (see also Figure 8—figure supplement 1). (C) Time course of EPSP amplitudes in the presence of TTX (10 nM). The induction of LTP by TBS can be prevented by bath application of TTX, since the average EPSP amplitude does not change. (D) Average EPSP before and after TBS shows no changes in amplitude in the presence of TTX. (E) Summary bar graph and single experiments (circles) indicating that the TTX application does not produce an increment in the EPSP amplitude and therefore no statistically significant LTP induction. Bars indicate mean ± SEM; circles represent data from individual cells. Data points from the same experiment are connected by lines. Single-cell data (C) and mean data (D); mean ± SEM). Vertical gray bars in C) and D) indicate the time point of the induction protocol.
-
Figure 8—source data 1
Source data for Figure 8.
- https://doi.org/10.7554/eLife.35269.029
Figure 8—figure supplement 1
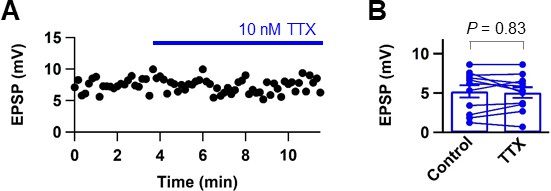
Low concentration of TTX does not affect glutamate release from presynaptic nerve terminals.
(A) Plot of EPSP peak amplitude against time during perfusion of 10 nM TTX (blue horizontal bar). (B) Summary graph of the effect of 10 nM TTX on EPSP peak amplitude (control: 5.21 ± 0.78 mV, TTX: 5.06 ± 0.68, n = 11; p=0.83). Data shown in (A) and example traces in Figure 8B were taken from the same cell. Filled circles represent data from individual experiments. Bars indicate mean ± SEM. Lines connect data points from the same experiment.
-
Figure 8—figure supplement 1—source data 1
Source data for Figure 8—figure supplement 1.
- https://doi.org/10.7554/eLife.35269.030
Author response image 1

Effects of Cd2+ on a late component in the dendritic depolarization.
(A, B) Somatic (black) and dendritic (red) voltage responses to dendritic current injection pulses with increasing amplitude (A: 200 pA; B; 700 pA). Voltage responses in the presence of CdCl2 were recorded 10 minutes after bath application of CdCl2. Note the decrease in the subthreshold depolarizing response of the dendritic trace after bath application of CdCl2 in A. (C) Summary of the effect of CdCl2 on the late depolarizing component in 3 dendritic recordings, indicating that CdCl2 did not affect the magnitude of the late depolarizing phase of the dendritic spikes.
Author response image 2
High-frequency PP stimulation does not elicit dendritic spikes in young GCs (>1GΩ).
(A) DIC-image of young GCs located ate the deep side of the GC layer. Scale bar is 50 µm. (B) Somatic voltage responses to current pulses (–10 and +10 pA pulses). (C) Somatic voltage responses to high-frequency synaptic stimulation of the PP inputs (‘Materials and methods’).
Author response image 3
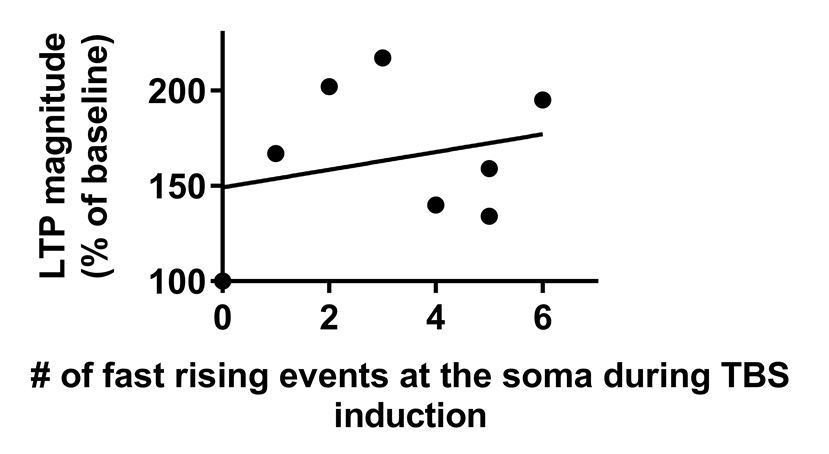
Magnitude of LTP is not correlated with the number of fast rising events at the soma during TBS.
Data that were used in this analysis were taken from Figure 1G.
Author response image 4
Dendritic spikes often appeared completely attenuated at the soma.
Dual soma-dendrite recordings reveal that high-frequency synaptic stimulation of the PP inputs sometimes evoked dendritic spikes without a clear corresponding somatic responses, ‘spikelets’.
Author response image 5

NMDAR-dependent sustained plateau potentials in dendrites.
(A) Diagram illustrating the recording configuration of a simultaneous somatic (black amplifier) and dendritic (red amplifier) patch-clamp recording on a GC combined with bath application of the NMDAR blocker, DL-AP5. Scale bar is 50 µm. (B) Blockade of NMDARs by a bath application of DL-AP5 (50 μM) abolished sustained plateau potentials. The decrease in plateau potentials were more prominent in the dendrites.
Author response image 6
Effect of dendritic A-type K+ channel blockade on AP backpropagation.
(A) Diagram of the experimental setup illustrating the recording configuration of a simultaneous somatic (black amplifier) and dendritic (red amplifier) patch-clamp recording on a GC combined with focal application of 4-AP directly to the dendritic patch. Scale bar is 50 µm. (B) (Left) Sample traces of somatic (black) and dendritic (red) APs evoked by somatic current injection under control (top) and after puff application of 10 mM 4-AP (bottom). (Right) First AP in the train displayed at expanded time scale. Local application of 4-AP to the dendrites selectively affect the duration of APs in the dendrites. (C) Summary of the effects of local dendritic application of 4-AP on peak amplitude and duration of APs. (Left; Soma: 100.8 ± 1.3%; Dendrite: 100.6 ± 6.5% ; n = 6, P = 0.98; Right; Soma: 105.6 ± 2.3%; Dendrite: 130.5 ± 5.2%; n = 6, ***P < 0.005) in 6 somatodendritic recordings. Bars indicate mean ± SEM; circles represent data from individual cells.
Additional files
-
Transparent reporting form
- https://doi.org/10.7554/eLife.35269.031
Download links
A two-part list of links to download the article, or parts of the article, in various formats.
Downloads (link to download the article as PDF)
Open citations (links to open the citations from this article in various online reference manager services)
Cite this article (links to download the citations from this article in formats compatible with various reference manager tools)
Dendritic spikes in hippocampal granule cells are necessary for long-term potentiation at the perforant path synapse
eLife 7:e35269.
https://doi.org/10.7554/eLife.35269


