A novel Cep120-dependent mechanism inhibits centriole maturation in quiescent cells
- Washington University, United States
Figures
Figure 1 with 1 supplement
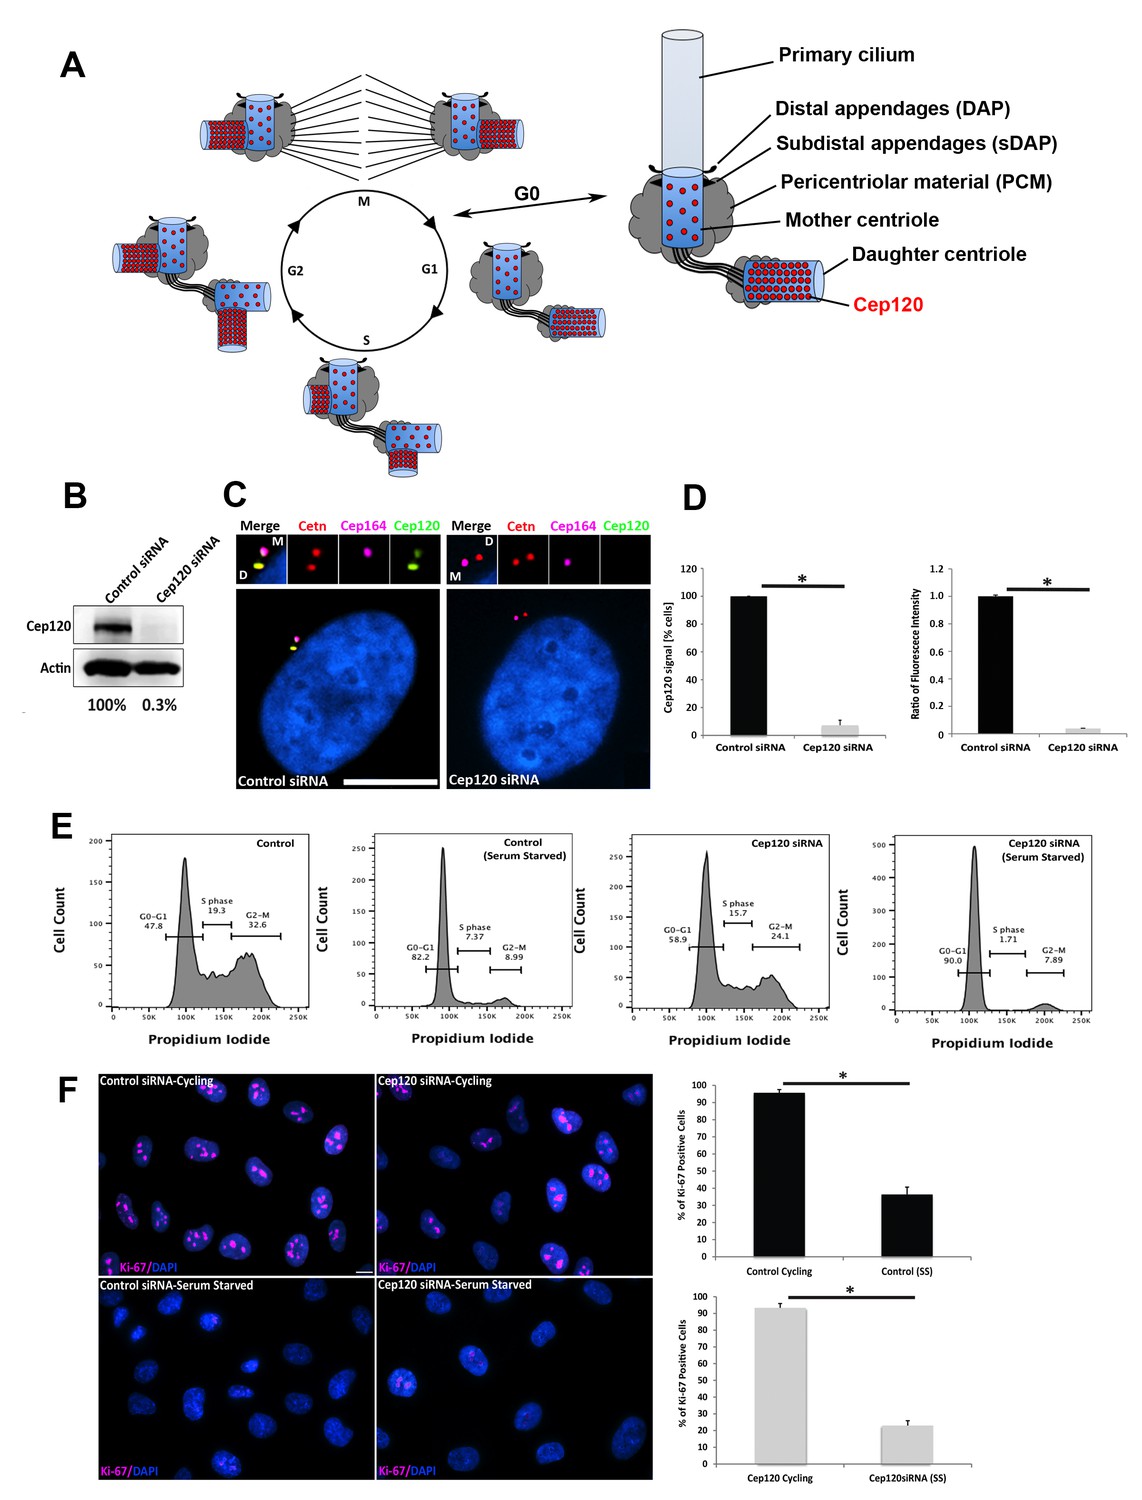
Depletion of Cep120 in quiescent cells.
(A) Schematic of centriole duplication and the cell cycle. Cep120 is enriched on the youngest generation of centrioles at all stages of cell division. Importantly, Cep120 is asymmetrically localized and enriched on the daughter centriole during G0. (B) Cep120 depletion from MEF cells by siRNA transfection. Lysates were probed for Cep120 and actin (loading control). Numbers below indicate relative levels of Cep120, normalized to actin. (C) MEFs were transfected with the indicated siRNA, serum starved for 24 hr, fixed, and stained for Cep120, centrin (centrioles), Cep164 (mother centriole) and DAPI (DNA). (D) (Left) Quantification of the fraction of transfected cells with Cep120 staining at the centrosome. N = 300 (control) and 300 (Cep120) siRNA. (Right) Ratio of fluorescence intensity of centrosomal Cep120, in control versus Cep120-depleted cells. N = 214 (control) and 244 (Cep120) siRNA. (E) FACS analysis performed on MEF cells transfected with control or Cep120 siRNA, incubated in normal growth medium for 24 hr, then in low-serum medium for another 24 hr. The percentage of cells at each cell cycle phase is indicated. (F) siRNA transfected MEF were grown for 24 hr in normal growth medium (cycling), then incubated in low-serum medium (serum-starved) for 24 hr. Cells were fixed and stained with antibodies against Ki-67 to identify proliferating cells. DNA was stained with DAPI. Graphs denote the fraction of Ki-67-positive cells during cycling and serum-starvation (SS) conditions. N = 300 (control cycling), N = 300 (control SS), N = 300 (Cep120 cycling), N = 300 (Cep120 SS). All results are averages of three independent experiments; *p<0.05. Scale bars = 10 μm.
Figure 1—figure supplement 1
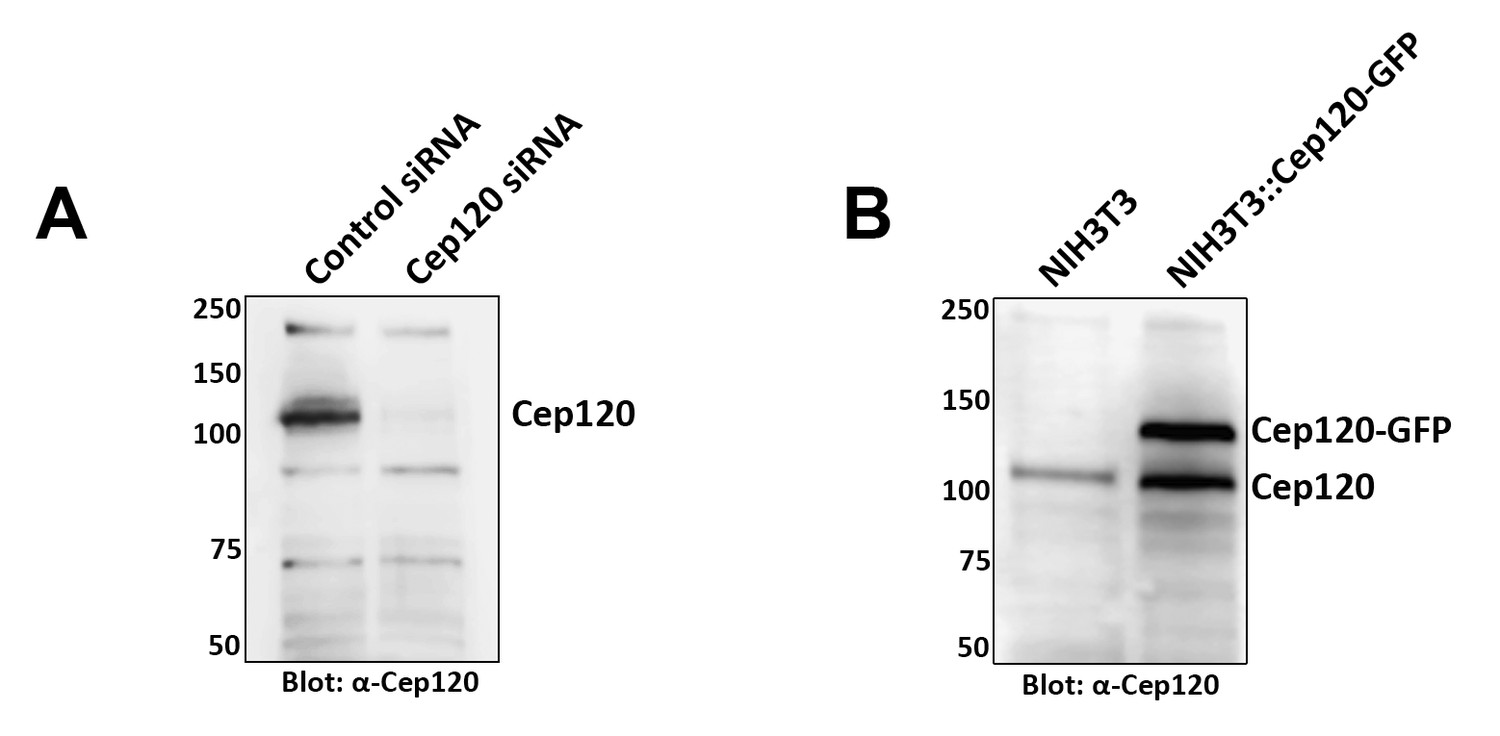
Characterization of Cep120 antibody.
A rat polyclonal antibody directed against the C-terminal half of the protein was generated as described in the Methods section. (A) The antibody recognizes a predominant band of 120 kDa on immunoblots of lysates from mouse embryonic fibroblasts, and this band is lost upon Cep120 depletion by siRNA. (B) Western blot of lysates from NIH3T3 and a Cep120-GFP–expressing NIH3T3 stable cell line (NIH3T3::Cep120-GFP; Mahjoub et al., 2010) probed with anti-Cep120. The antibody also recognizes the GFP-tagged exogenously expressed Cep120. Numbers on the left indicate molecular mass of markers in kilodaltons.
Figure 2 with 2 supplements
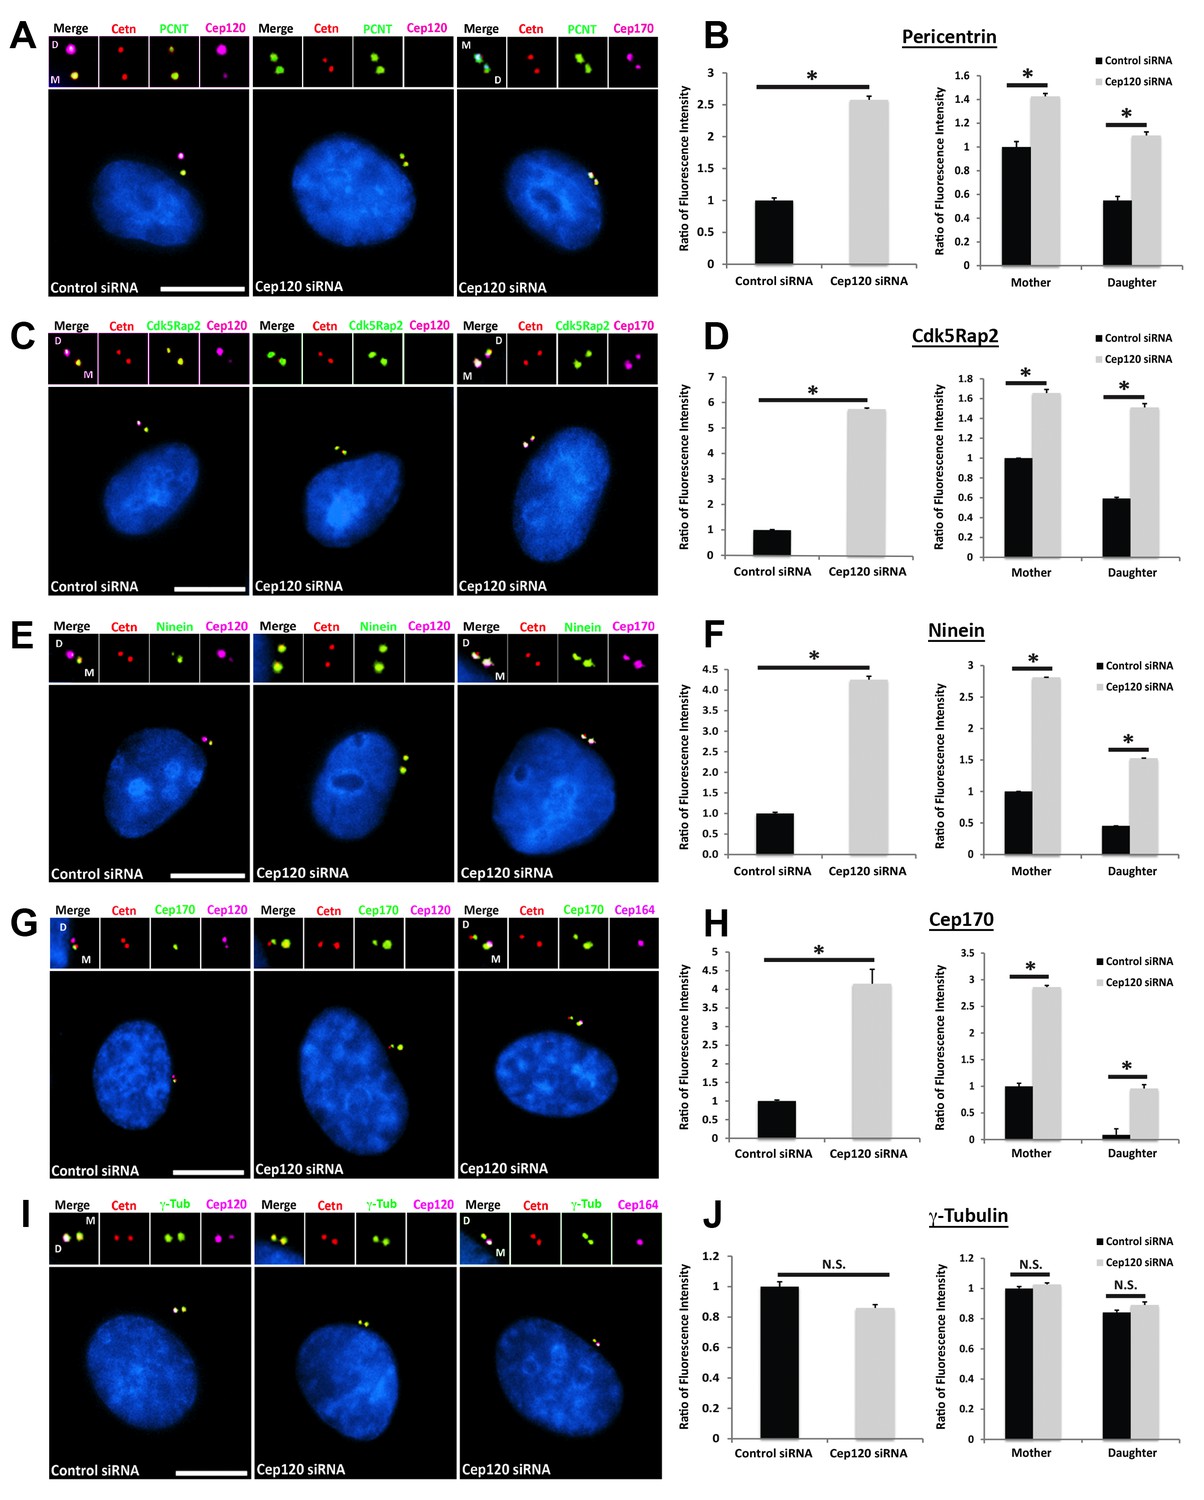
Loss of Cep120 in quiescent cells causes accumulation of PCM components on the daughter centriole.
MEF cells transfected with control or Cep120-targeting siRNA were immunostained for centrin (centrioles), Cep120, Cep164 or Cep170 (to identify the mother centriole), along with the indicated PCM components. Graphs show quantification of the fluorescence intensity for each PCM protein, normalized to control cells. We noted an overall increase in the abundance of PCM proteins at the centrosome in Cep120-depleted cells, with a large increase observed on the daughter centriole. (A–B) Pericentrin: N = 320 (control) and 320 (Cep120) siRNA. (C–D) Cdk5Rap2: N = 400 (control) and 400 (Cep120) siRNA. (E–F) Ninein: N = 430 (control) and 430 (Cep120) siRNA. (G–H) Cep170: N = 480 (control) and 480 (Cep120) siRNA. (I–J) In contrast, there was no significant change in γ-tubulin levels in Cep120-depleted cells. N = 400 (control) and 400 (Cep120) siRNA. Results are averages from three independent experiments; *p<0.05. N.S. = not significant. Scale bars = 10 μm.
Figure 2—figure supplement 1

– Rescue of centriole duplication and PCM levels following Cep120 depletion.
(A) Quantification of centriole number during the cycling stage of cells transfected with control siRNA, Cep120 siRNA, or Cep120-depleted cells transfected with siRNA-resistant GFPCep120 (GFP-Cep120siRt). Cells were transfected with control or Cep120-siRNA, incubated for 24 hr, then transfected with GFPCep120siRt. Centrioles were counted at 48 hr post-transfection. Loss of Cep120 in dividing cells causes defective centriole duplication, resulting in an increase in the fraction of cells with 0 and 1 centriole. Expression of GFP-Cep120siRt rescues centriole number. N = 420 (control siRNA), 553 (Cep120 siRNA) and 124 (Cep120 siRNA +GFP-Cep120siRt). (B–C) Expression of GFP-Cep120siRt in Cep120-depleted cells restores pericentrin levels at the centrosome. Cells were stained for GFP (to visualize exogenous GFP-Cep120siRt), centrin (centrioles), and pericentrin. Graph shows the relative fluorescence intensity of centrosomal pericentrin. N = 102 (control siRNA), 84 (Cep120 siRNA) and 86 (Cep120 siRNA +GFP-Cep120siRt). Results are averages of two independent experiments; *p<0.05. Scale bar = 10 μm.
Figure 2—figure supplement 2
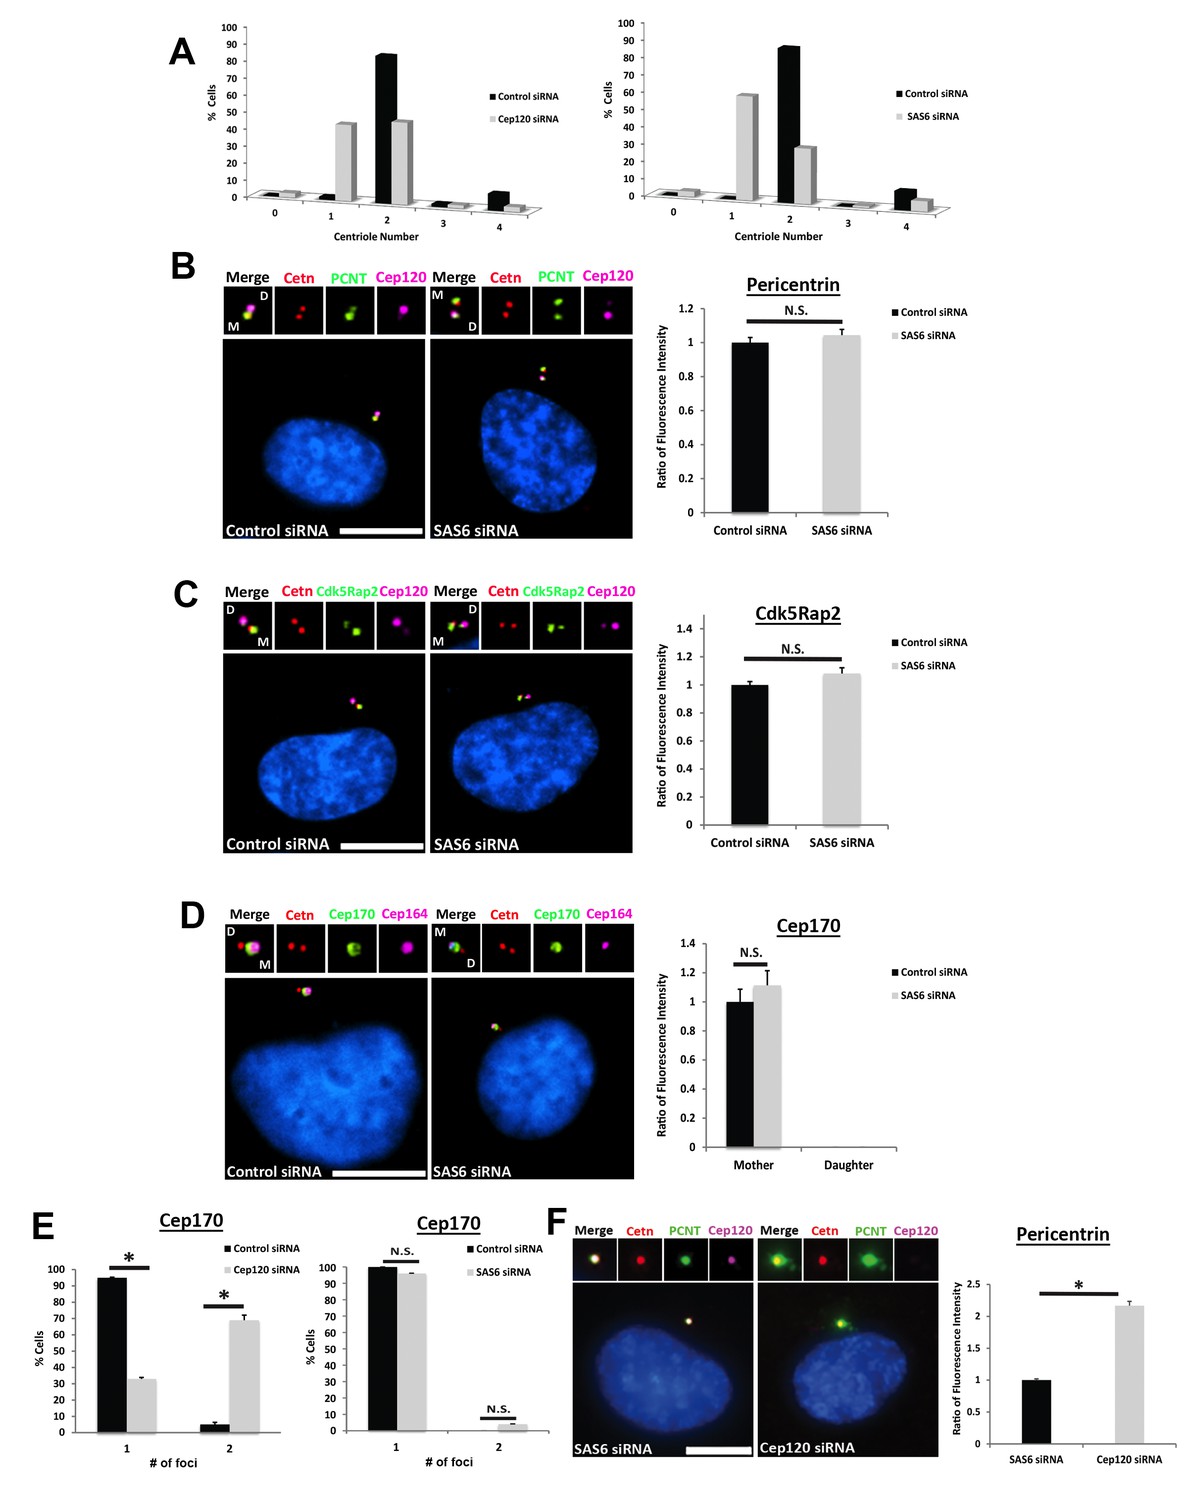
– Depletion of Sas6 does not affect PCM levels at the centrosome.
(A) Quantification of centriole number during the cycling stage of control, Cep120- or Sas6-depleted cells. Centrioles were counted at 48 hr post-transfection. Similar to Cep120, loss of Sas6 in dividing cells causes defective centriole duplication, resulting in an increase in the fraction of cells with one centriole. N = 500 (control), 500 (Cep120) and 500 (Sas6) siRNA. (B–C) In contrast to Cep120, depletion of Sas6 did not result in significant change in Pericentrin (B) or Cdk5Rap2 (C) levels at the centrosome. N = 280 (control) and 280 (Sas6) siRNA. (D) Depletion of Sas6 did not alter Cep170 localization or abundance at the centrosome. N = 210 (control) and 210 (Sas6) siRNA. (E) Loss of Cep120 caused accumulation of Cep170 on the daughter centriole, resulting in an increase in the percentage of cells with 2 foci of Cep170. In contrast, depletion of Sas6 did not alter the number of Cep170 foci at centrioles. N = 300 (control), 300 (Cep120) and 300 (Sas6) siRNA. Results are averages of three independent experiments; *p<0.05. N.S. = not significant. Scale bars = 10 μm. (F) Quantification of pericentrin levels in G1 cells containing a single parental daughter centriole. Cells were transfected with siRNA targeting Sas6 or Cep120, incubated for 24 hr, then fixed and stained with antibodies against Cep120, centrin and pericentrin. Graph shows quantification of pericentrin levels in cells containing the single parental centriole with Cep120 (Sas6 siRNA) versus cells lacking Cep120 (Cep120 siRNA). N = 214 (control) and 244 (Sas6) siRNA. Results are averages of two independent experiments; *p<0.05.
Figure 3
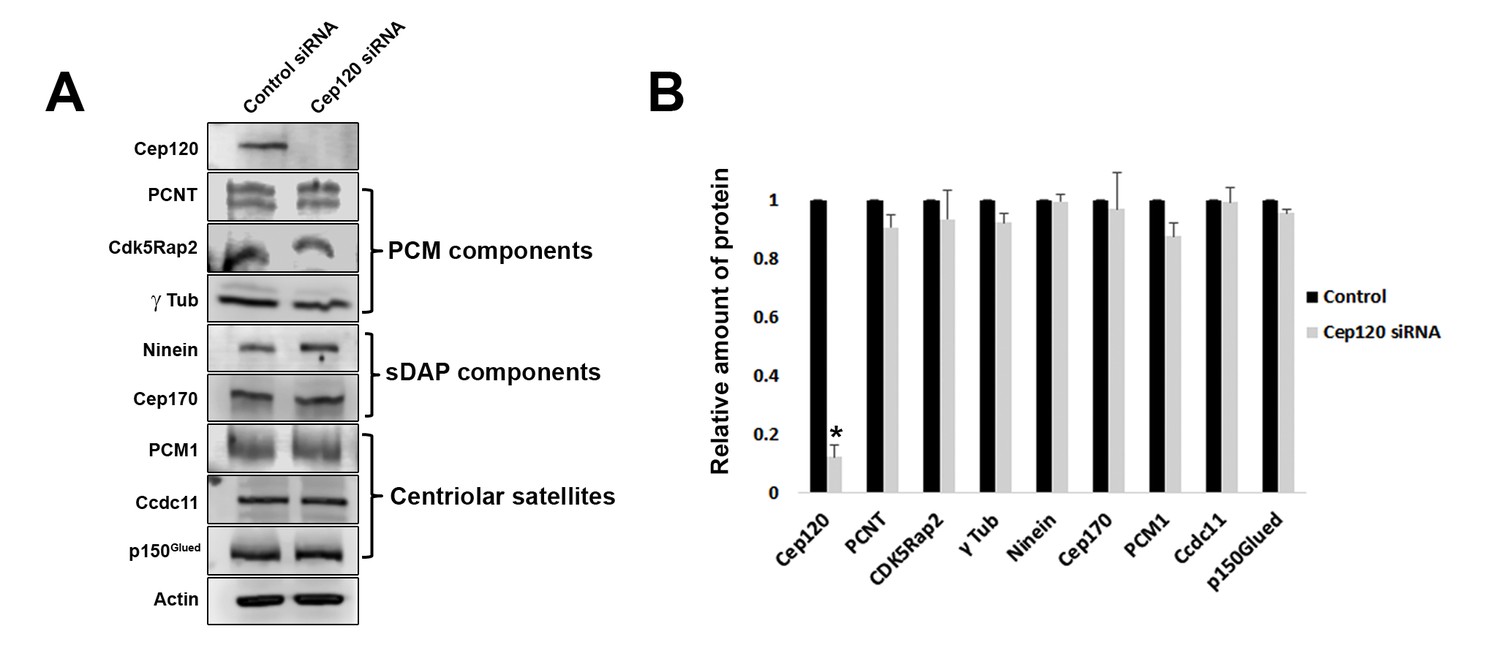
Loss of Cep120 does not alter expression levels of centrosomal proteins.
(A) Immunoblotting of whole-cell lysates from control and Cep120 siRNA-transfected cells, probed with the indicated antibodies. Actin served as loading control. (B) Quantification of the signal intensity for each protein, normalized to actin. Results are averages of three independent experiments; *p<0.05. Only Cep120 levels show a statistically significant difference.
Figure 4

Overexpression of exogenous Cep120 results in decreased centrosomal PCM.
MEF cells were transfected with plasmid expressing Myc-Cep120, serum-starved for 24 hr, fixed and stained for Myc, centrin (centrioles), and the PCM components (A) Pericentrin or (B) Cdk5Rap2. Graphs show quantification of the fluorescence intensity for each PCM protein at the centrosome, in control cells (untransfected), and cells expressing low (1–2 fold compared to endogenous levels) versus high (2–3 fold) levels of centrosomal Myc-Cep120 (based on fluorescence intensity). We noted a dose-dependent decrease in pericentrin and Cdk5Rap2 levels correlating with increased exogenous Cep120 expression. Pericentrin: N = 180 (control), and 120 (Myc-Cep120). Cdk5Rap2: N = 165 (control), and 130 (Myc-Cep120). Results are averages of three independent experiments; *p<0.05. Scale bars = 10 μm. (C) Schematic of Cep120-GFP deletion constructs. CC = coiled coil; MT-BD = microtubule binding domain; CPAP-BD = CPAP binding domain. Domains required for centrosome localization were previously described (Mahjoub et al., 2010). (D) MEF cells were transfected with plasmids expressing Cep120-GFP deletion constructs, serum-starved for 24 hr, fixed and stained for GFP, centrin, and pericentrin. Graphs show quantification of the relative fluorescence intensity for pericentrin at the centrosome. Only over-expression of the full-length protein reduced centrosomal pericentrin levels. Results are averages of two independent experiments; *p<0.05.
Figure 5
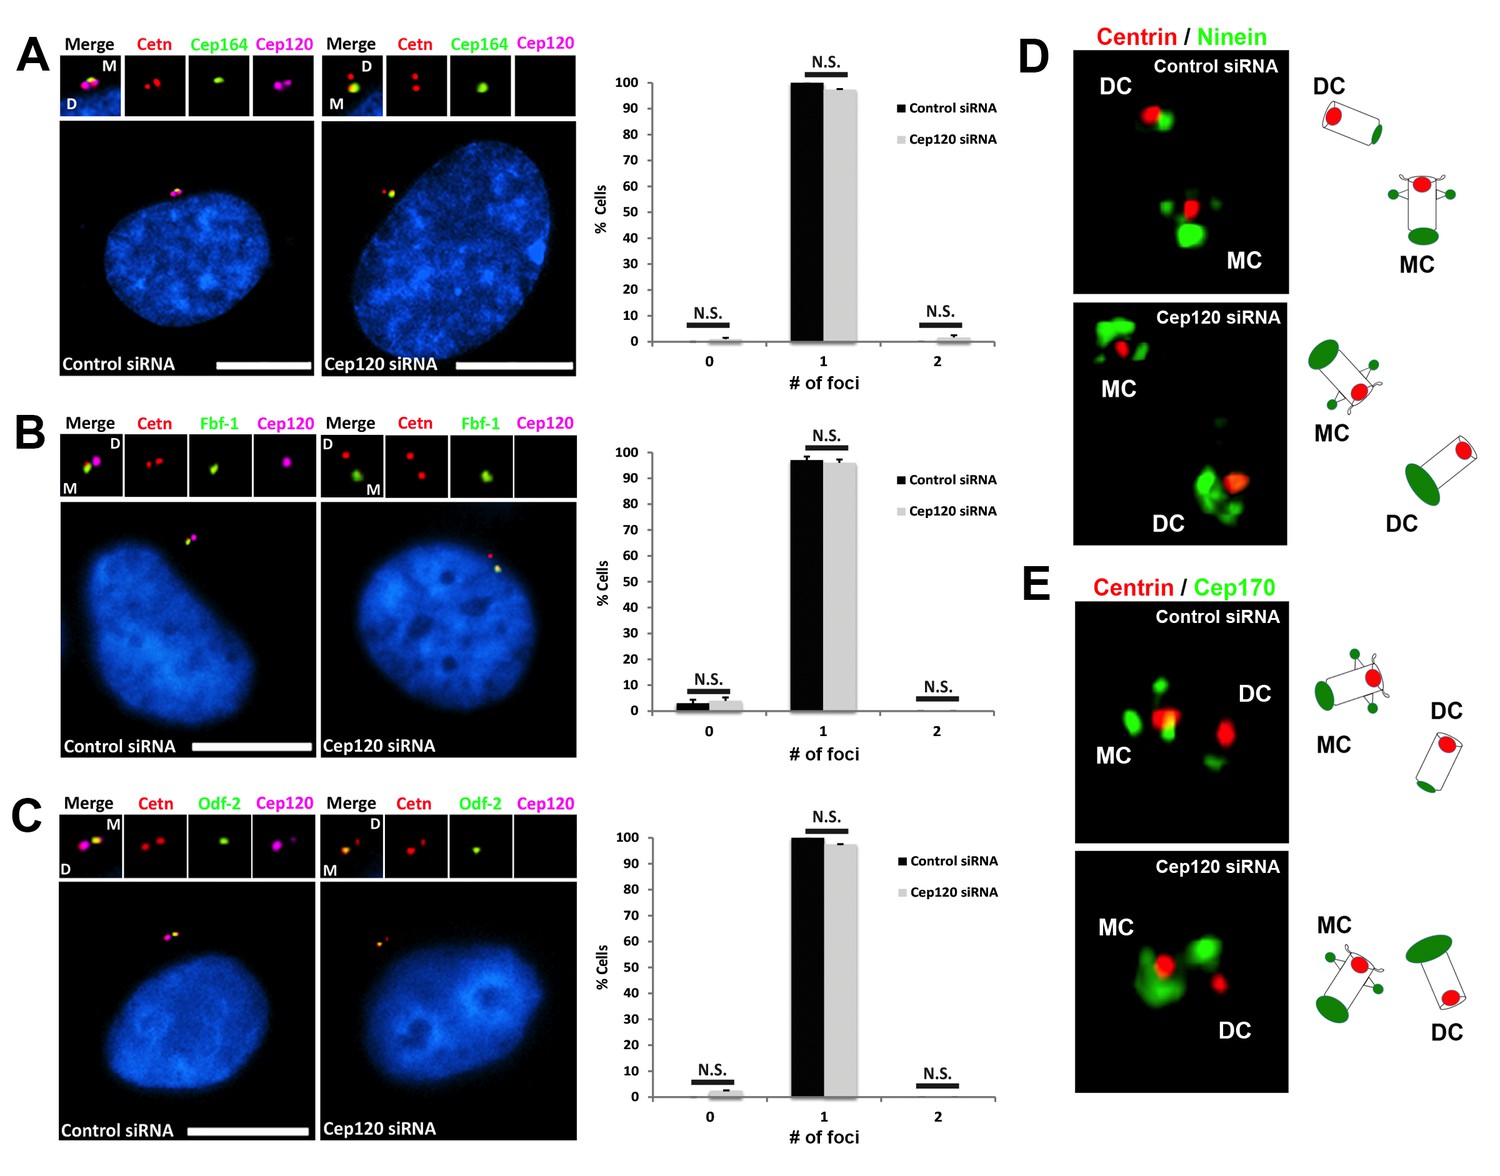
Depletion of Cep120 does not affect the localization of distal or subdistal appendage proteins.
MEF cells were transfected with control or Cep120-targeting siRNA, and immunostained for centrin (centrioles), Cep120, the distal appendage proteins (A) Cep164 (N = 300 (control) and 300 (Cep120) siRNA) and (B) Fbf-1 (N = 300 (control) and 300 (Cep120) siRNA), or (C) the subdistal appendage protein Odf-2 (N = 200 (control) and 200 (Cep120) siRNA). Quantification of the number of foci per cell indicates that Cep120-depleted cells mainly contain one focus of each protein, which is similar to control siRNA-treated cells. Results are averages of three independent experiments; *p<0.05. N.S. = not significant. Scale bars = 10 μm. (D–E) 3D-SIM images of centrioles from control and Cep120-depleted MEF cells, immunostained for centrin (centrioles), ninein or Cep170. Schematics (right) represent relative positions of each marker on mother versus daughter centrioles.
Figure 6
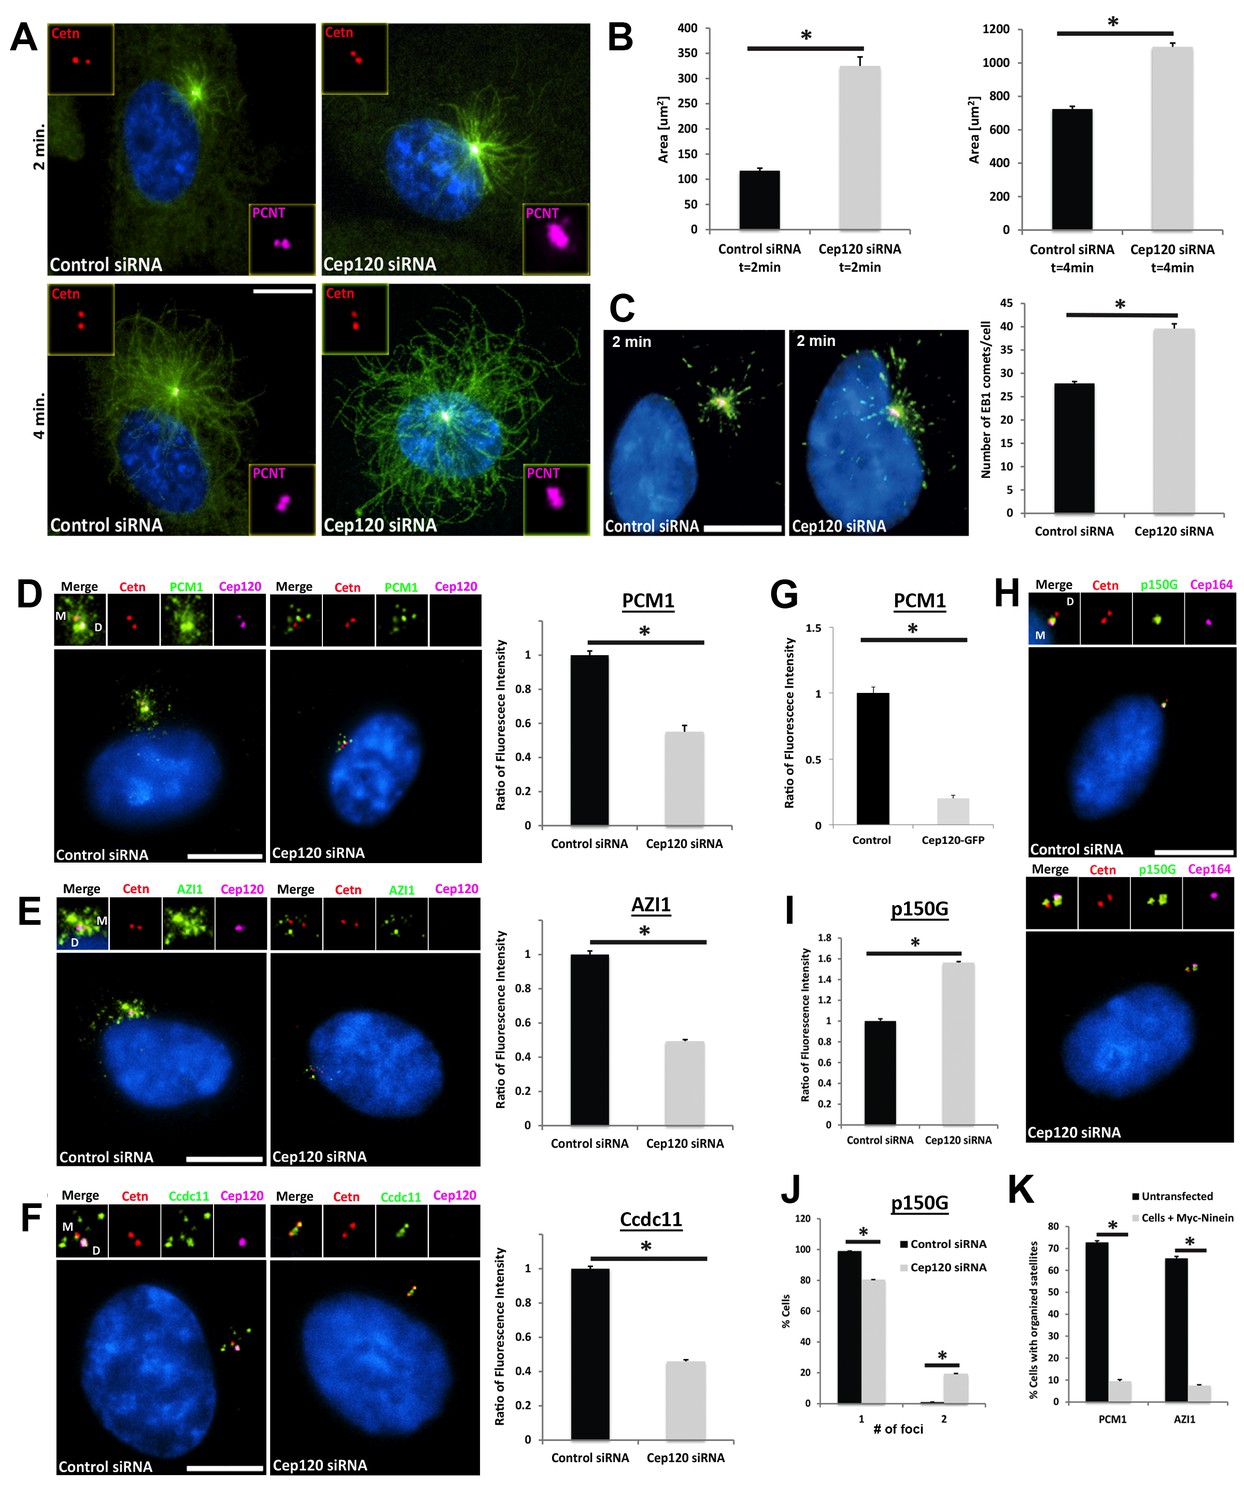
Increased microtubule nucleation and dispersal of centriolar satellites in Cep120-depleted cells.
(A) MEFs transfected with control or Cep120-siRNA for 48 hr were incubated with 0.1 μg/mL nocodazole on ice for 1 hr, washed and incubated with warm (37°C) media for the indicated times, fixed and stained for centrin (centrioles), pericentrin (PCM), α-tubulin (microtubules), and DAPI (DNA). (B) Quantification of microtubule aster size during regrowth. N = 400 (control) and 400 (Cep120) siRNA. (C) Cells at 2 min of regrowth were fixed and stained for α-tubulin (red), EB1 (green) and DAPI (blue). Graph denotes average number of EB1-positive foci at each centrosome. N = 300 (control) and 240 (Cep120) siRNA. (D–F) Loss of Cep120 causes mislocalization (dispersal) of centriolar satellites. Graphs show quantification of the fluorescence intensity for each satellite protein, normalized to control cells. (D) PCM-1: N = 375 (control) and 275 (Cep120) siRNA. (E) Azi-1: N = 215 (control) and 175 (Cep120) siRNA. (F) Ccdc11: N = 130 (control) and 134 (Cep120) siRNA. (G) Overexpression of exogenous Cep120 disrupts centriolar satellite localization. MEF cells were transfected with plasmid expressing Cep120-GFP, serum-starved for 24 hr, fixed and stained for GFP, centrin (centrioles) and PCM-1. Graph shows the fraction of cells with organized satellite protein localization at the centrosome. N = 200 cells per sample. Results are averages of two independent experiments; *p<0.05. (H–J) Loss of Cep120 results in accumulation of p150Glued at the centrosome. N = 315 (control) and 285 (Cep120) siRNA. Results are averages from three independent experiments; *p<0.05. Scale bars = 10 μm. (K) Overexpression of exogenous ninein disrupts centriolar satellite localization. MEF cells were transfected with plasmid expressing Myc-ninein, serum-starved for 24 hr, fixed and stained for Myc, centrin (centrioles), and the satellite proteins PCM-1 and Azi-1. Graph shows the fraction of cells with organized satellite protein localization at the centrosome. PCM-1: N = 300 (control untransfected) and 100 (Myc-ninein). Azi-1: N = 300 (control untransfected) and 100 (Myc-ninein). Results are averages of three independent experiments; *p<0.05. Scale bars = 10 μm.
Figure 7 with 1 supplement
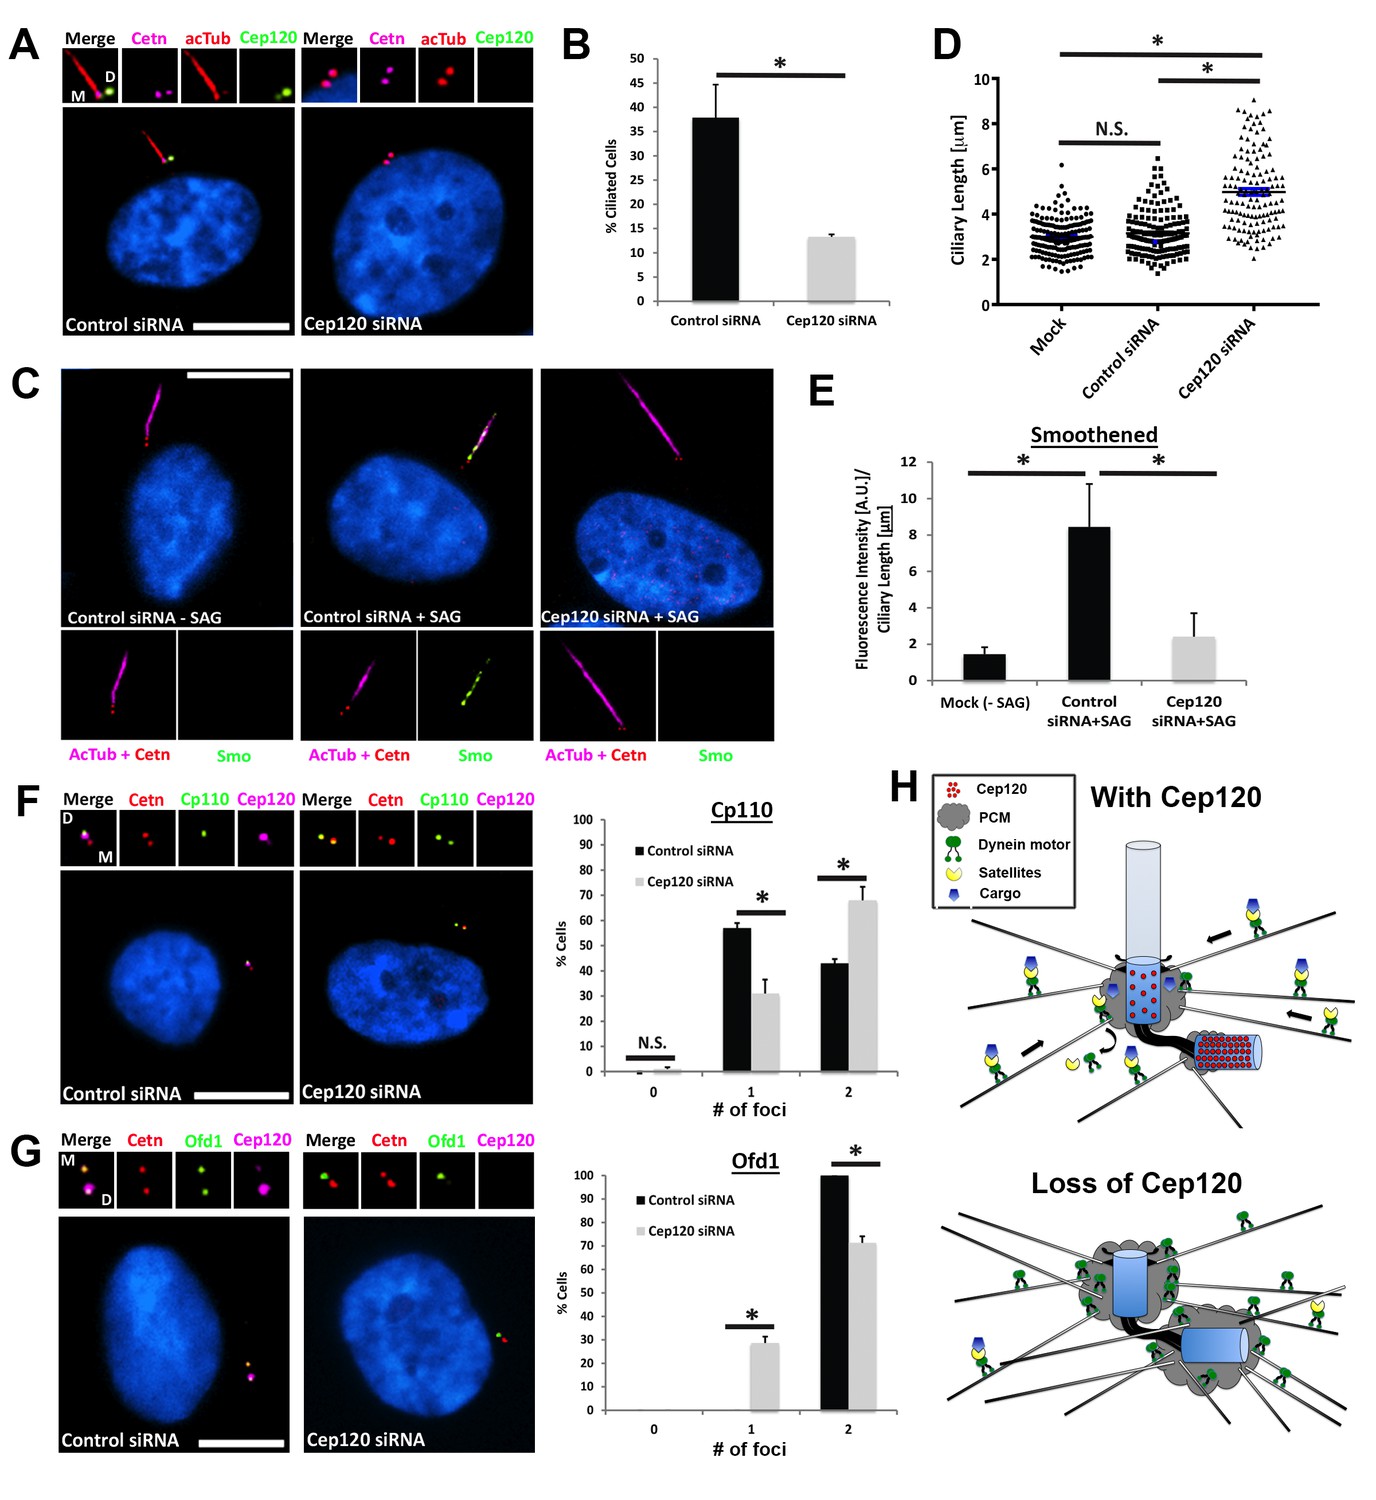
Loss of Cep120 disrupts ciliary assembly and signaling.
(A) Quiescent MEF cells stained with antibodies against Cep120, centrin (centrioles), and acetylated α-tubulin (cilia). (B) Quantification of control (N = 300) and Cep120-depleted (N = 300) cells that form cilia. (C) Endogenous Smo localization in control and Cep120-depleted cells treated with the Shh pathway agonist SAG. (D) Distribution of ciliary length in untransfected (N = 185), control siRNA (N = 160), and Cep120-depleted (N = 132) cells. (E) Ratio of ciliary Smo intensity per unit length cilium in control (N = 156) and Cep120-depleted (N = 136) cells treated with SAG. (F) CP110 predominantly marks the daughter centriole in control quiescent cells. In Cep120-depleted cells, there is higher incidence of CP110 association with both centrioles, correlating with the decrease in ciliogenesis. N = 300 (control) and 300 (Cep120) siRNA. (G) Ofd1 localizes to both centrioles in control cells, which is disrupted in Cep120-depleted cells. N = 300 (control) and 300 (Cep120) siRNA. Results are averages from three independent experiments; *p<0.05. N.S. = not significant. Scale bars = 10 μm. (H) Model depicting PCM accumulation, increased microtubule nucleation, aberrant centriolar satellite organization and ciliogenesis defects upon Cep120 loss in quiescent cells.
Figure 7—figure supplement 1
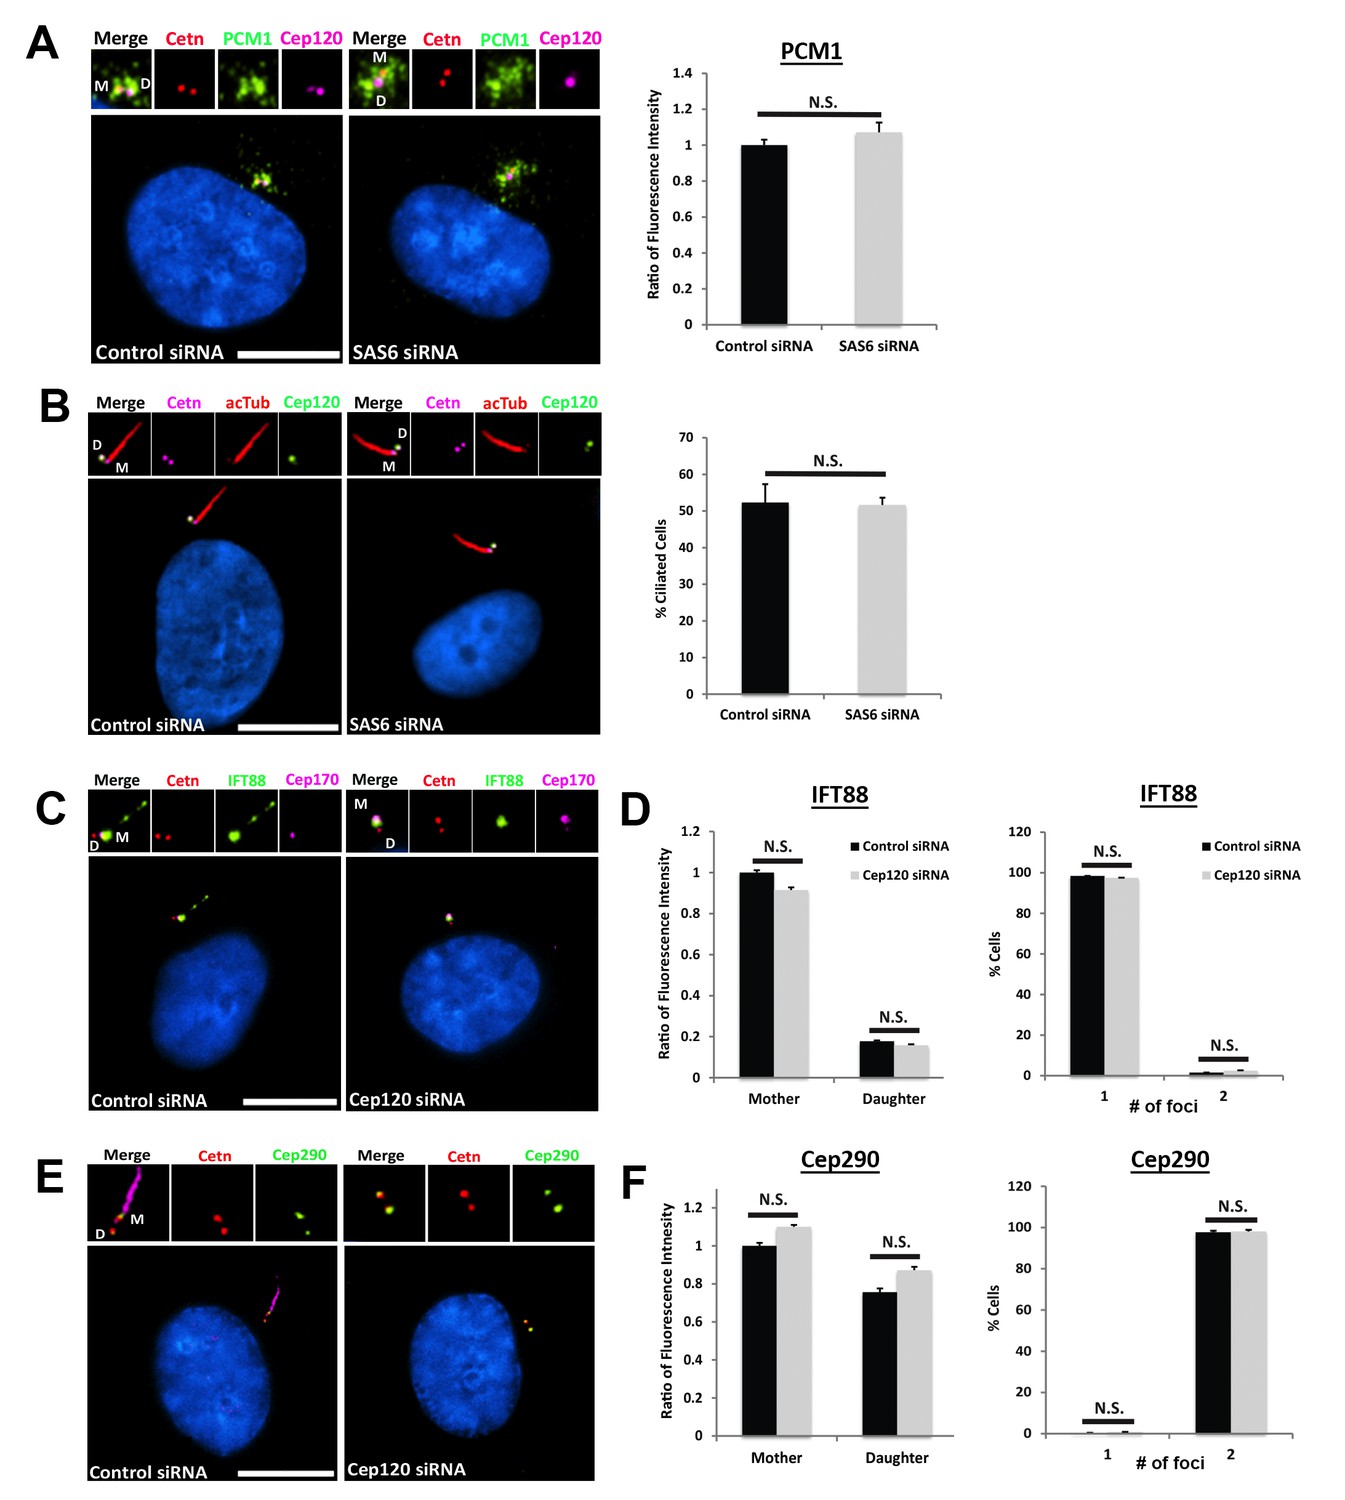
– Depletion of Sas6 does not affect centriolar satellite organization or ciliogenesis.
(A) Cells were transfected with control or Sas6 siRNA, serum starved for 24 hr, fixed and stained for Cep120, centrin (centrioles), and PCM-1. Graph shows the ratio of fluorescence intensity of centrosomal PCM-1, compared to control siRNA-untransfected cells. N = 130 (control) and 130 (Sas6) siRNA. (B) Loss of Sas6 did not perturb ciliogenesis. Cells were stained with antibodies against centrin (centrioles), Cep120, and acetylated α-tubulin (cilia). Graph shows the percentage of ciliated cells. N = 300 (control) and 300 (Sas6) siRNA. (C) Control and Cep120-depleted cells were stained for the intraflagellar transport protein IFT88, centrin (centrioles) and Cep170 (to mark the mother centriole). IFT88 localizes predominantly to the mother centriole and cilium in control cells, and its localization to the mother centriole is unaffected in Cep120-depleted cells. (D) Quantification of fluorescence intensity of IFT88 on mother and daughter centrioles, showing no significant change. In addition, the average number of IFT88-positive centrioles is unchanged upon Cep120 depletion. N = 390 (control) and 390 (Cep120) siRNA. (E) Control and Cep120-depleted cells were stained for Cep290 and centrin (centrioles). Cep290 localizes to the transition zone at the distal end of both centrioles in control cells, and its localization is unaffected in Cep120-depleted cells. (F) Quantification of fluorescence intensity of Cep290 on mother and daughter centrioles, showing no significant change. The number of Cep290-positive foci is also unchanged upon Cep120 depletion. N = 350 (control) and 350 (Cep120) siRNA. Results are averages of three independent experiments; N.S. = not significant. Scale bars = 10 μm.
Additional files
-
Supplementary file 1
List of antibodies used in this study, including fixation and concentrations used for immunofluorescence staining and immunoblotting.
- https://doi.org/10.7554/eLife.35439.014
-
Transparent reporting form
- https://doi.org/10.7554/eLife.35439.015
Download links
A two-part list of links to download the article, or parts of the article, in various formats.
Downloads (link to download the article as PDF)
Open citations (links to open the citations from this article in various online reference manager services)
Cite this article (links to download the citations from this article in formats compatible with various reference manager tools)
A novel Cep120-dependent mechanism inhibits centriole maturation in quiescent cells
eLife 7:e35439.
https://doi.org/10.7554/eLife.35439


