Long read sequencing reveals poxvirus evolution through rapid homogenization of gene arrays
- University of Utah, United States
Figures
Figure 1 with 3 supplements
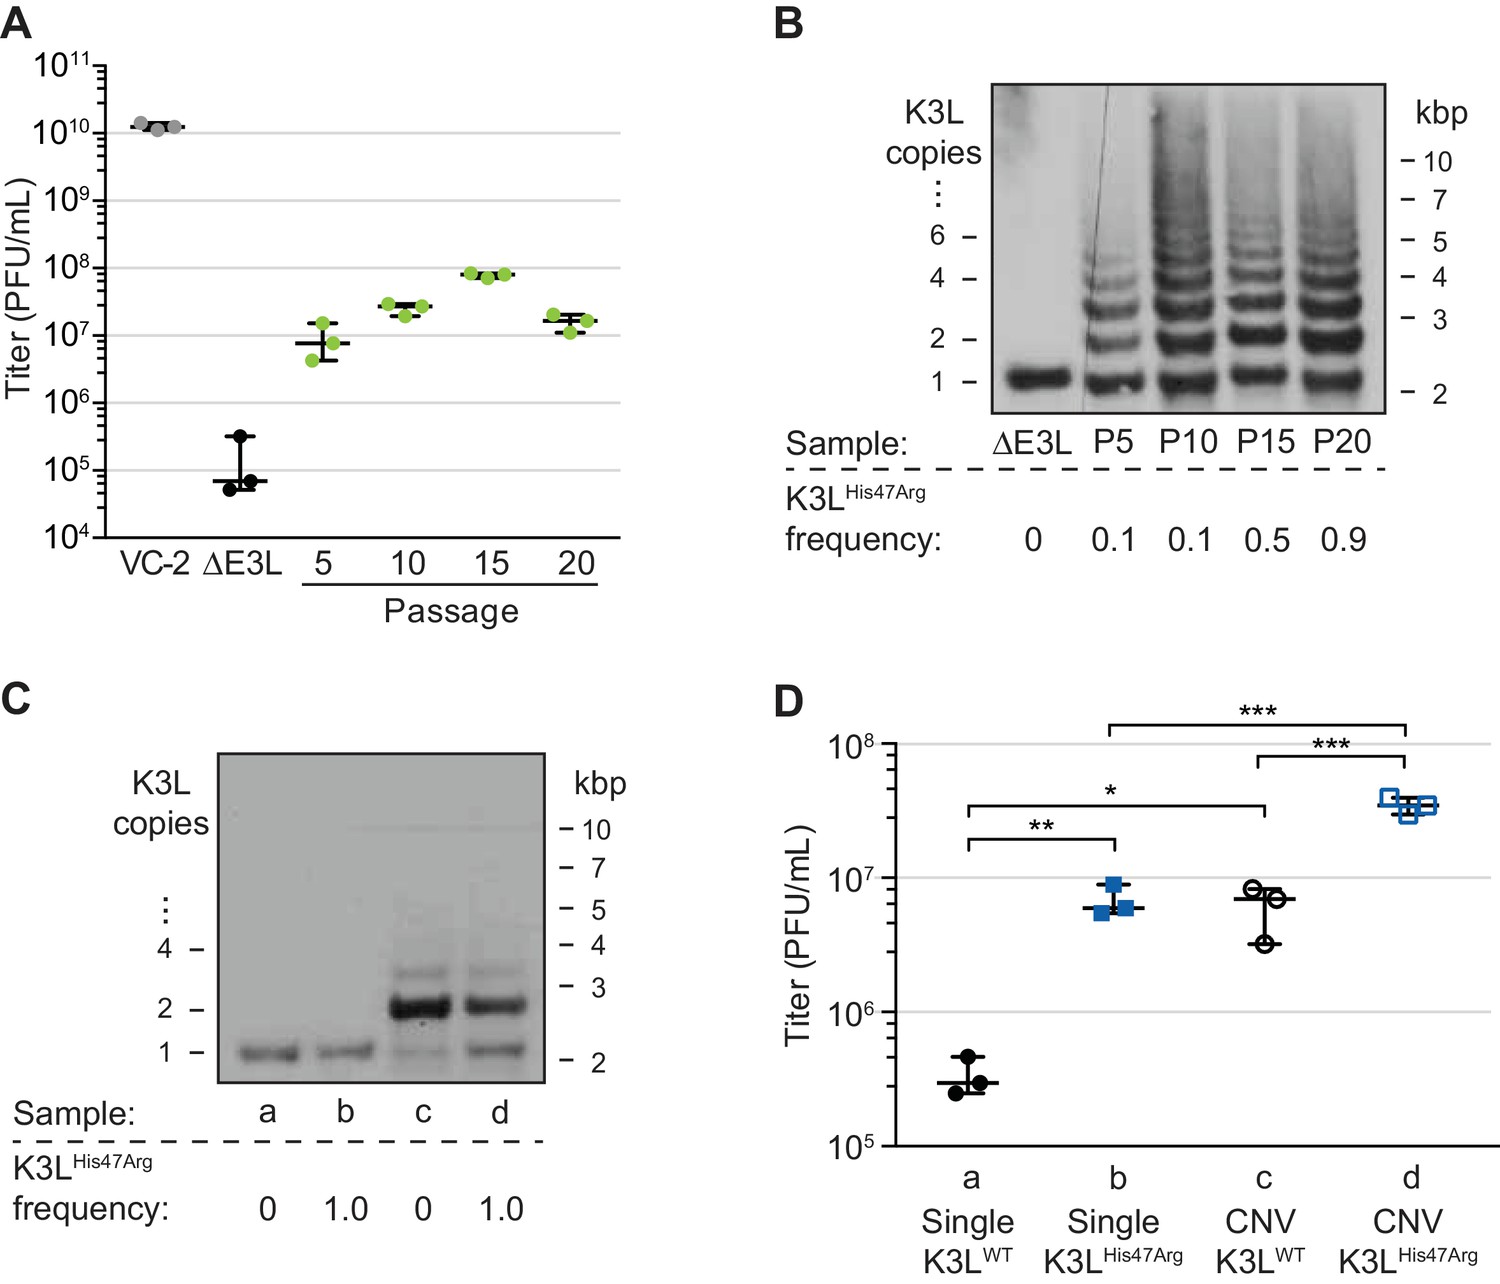
A single nucleotide variant accumulates following increases in K3L copy number.
(A) Following 20 serial infections of the ΔE3L strain (MOI 0.1 for 48 hr) in HeLa cells (see Materials and methods for further details), replication was measured in triplicate in HeLa cells for every fifth passage, and compared to wild-type (VC-2) or parent (ΔE3L) virus. (B, C) Digested viral DNA from every 5th passage (B) and four plaque-purified clones (C) were probed with a K3L-specific probe by Southern blot analysis. Number of K3L copies (left) and size in kbp (right) are shown. K3LHis47Arg allele frequency for each population (shown below) was estimated by PCR and Sanger sequencing of viral DNA. (D) Replication of plaque purified clones from (C) was measured in HeLa (D) or BHK (Figure 1—figure supplement 1) cells in triplicate. Statistical analysis was performed to compare the means of populations b or c relative to a, or between the means of populations b or c relative to d by one-way ANOVA followed by Dunnett’s multiple comparison test. *p<0.05, **p<0.01, ***p<0.005. K3LHis47Arg and E9LGlu495Gly population-level allele frequencies estimated from Illumina MiSeq reads are shown in Figure 1—figure supplement 2. Replication of clone a compared to ΔE3L is shown in Figure 1—figure supplement 3. All titers were measured multiple times in BHK cells by plaque assay, shown with median and 95% confidence intervals.
-
Figure 1—source data 1
Data used to generate Figure 1A.
- https://doi.org/10.7554/eLife.35453.006
-
Figure 1—source data 2
Data used to generate Figure 1D.
- https://doi.org/10.7554/eLife.35453.007
-
Figure 1—source data 3
Statistics for Figure 1D, One-way ANOVA followed by Dunnett’s multiple comparison test.
- https://doi.org/10.7554/eLife.35453.008
Figure 1—figure supplement 1
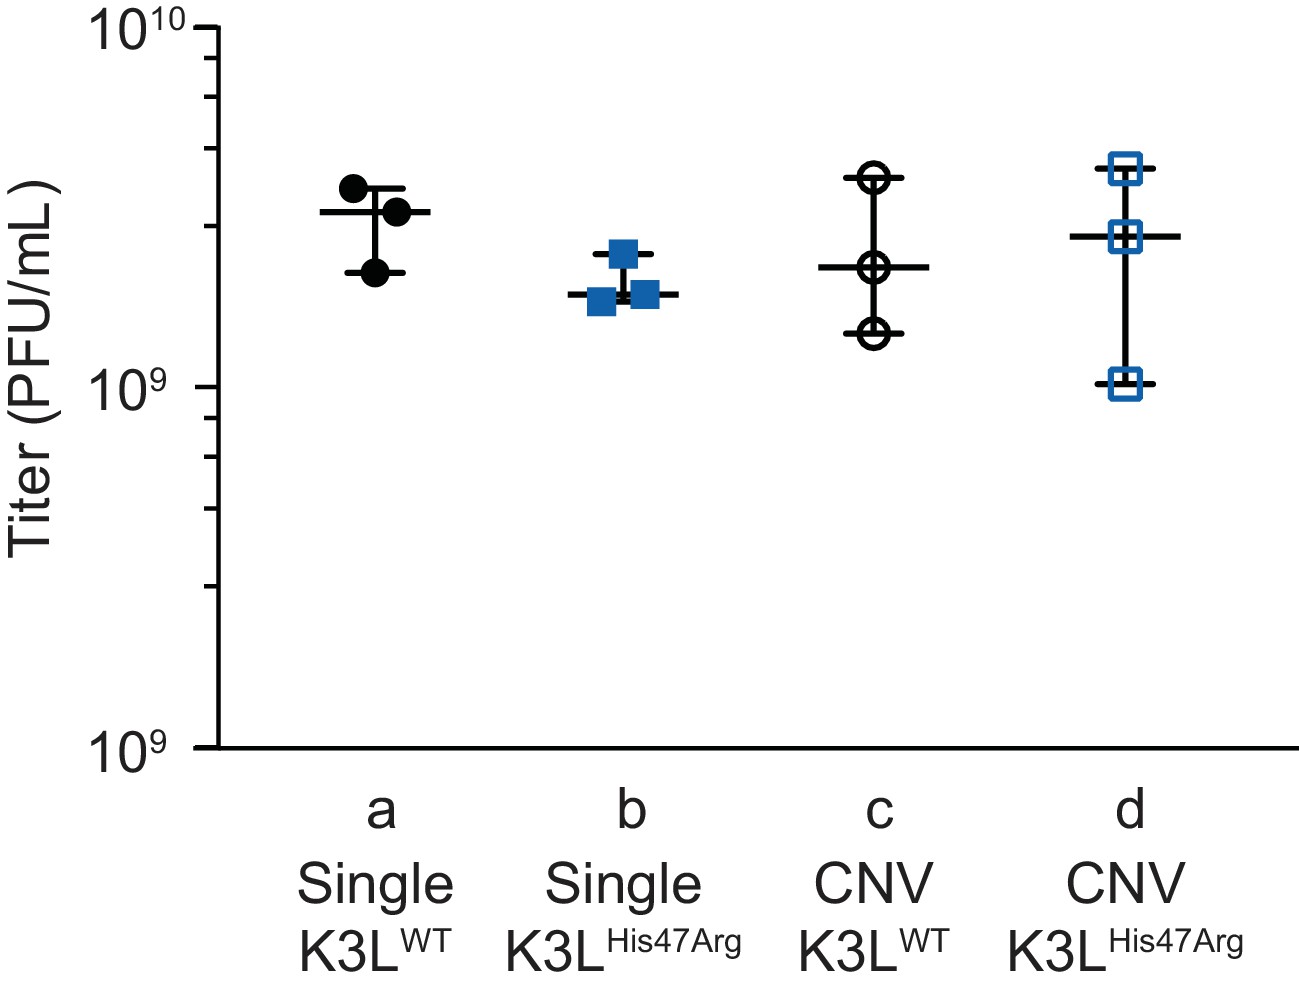
K3LHis47Arg and K3L CNV are non-adaptive in the permissive BHK cell line.
Replication was measured for plaque purified clones (as in Figure 1D) in BHK cells by 48 hr infection (MOI 0.1) in triplicate. All titers were measured multiple times in BHK cells by plaque assay, shown with median and 95% confidence intervals. Statistical analysis was performed to compare the means of populations b or c relative to a, or between the means of populations b or c relative to d by one-way ANOVA followed by Dunnett’s multiple comparison test. No significant differences were observed between any of the compared populations.
-
Figure 1—figure supplement 1—source data 1
Data used to generate Figure 1—figure supplement 1.
- https://doi.org/10.7554/eLife.35453.009
-
Figure 1—figure supplement 1—source data 2
Statistics for Figure 1—figure supplement 1, One-way ANOVA followed by Dunnett’s multiple comparison test.
- https://doi.org/10.7554/eLife.35453.010
Figure 1—figure supplement 2

Allele frequencies of the two high-frequency SNVs identified in vaccinia populations.
Population-level K3LHis47Arg and E9LGlu495Gly allele frequencies were estimated using freebayes on Illumina MiSeq reads from different passages.
-
Figure 1—figure supplement 2—source data 3
Data used to generate Figure 1—figure supplement 2.
- https://doi.org/10.7554/eLife.35453.011
Figure 1—figure supplement 3
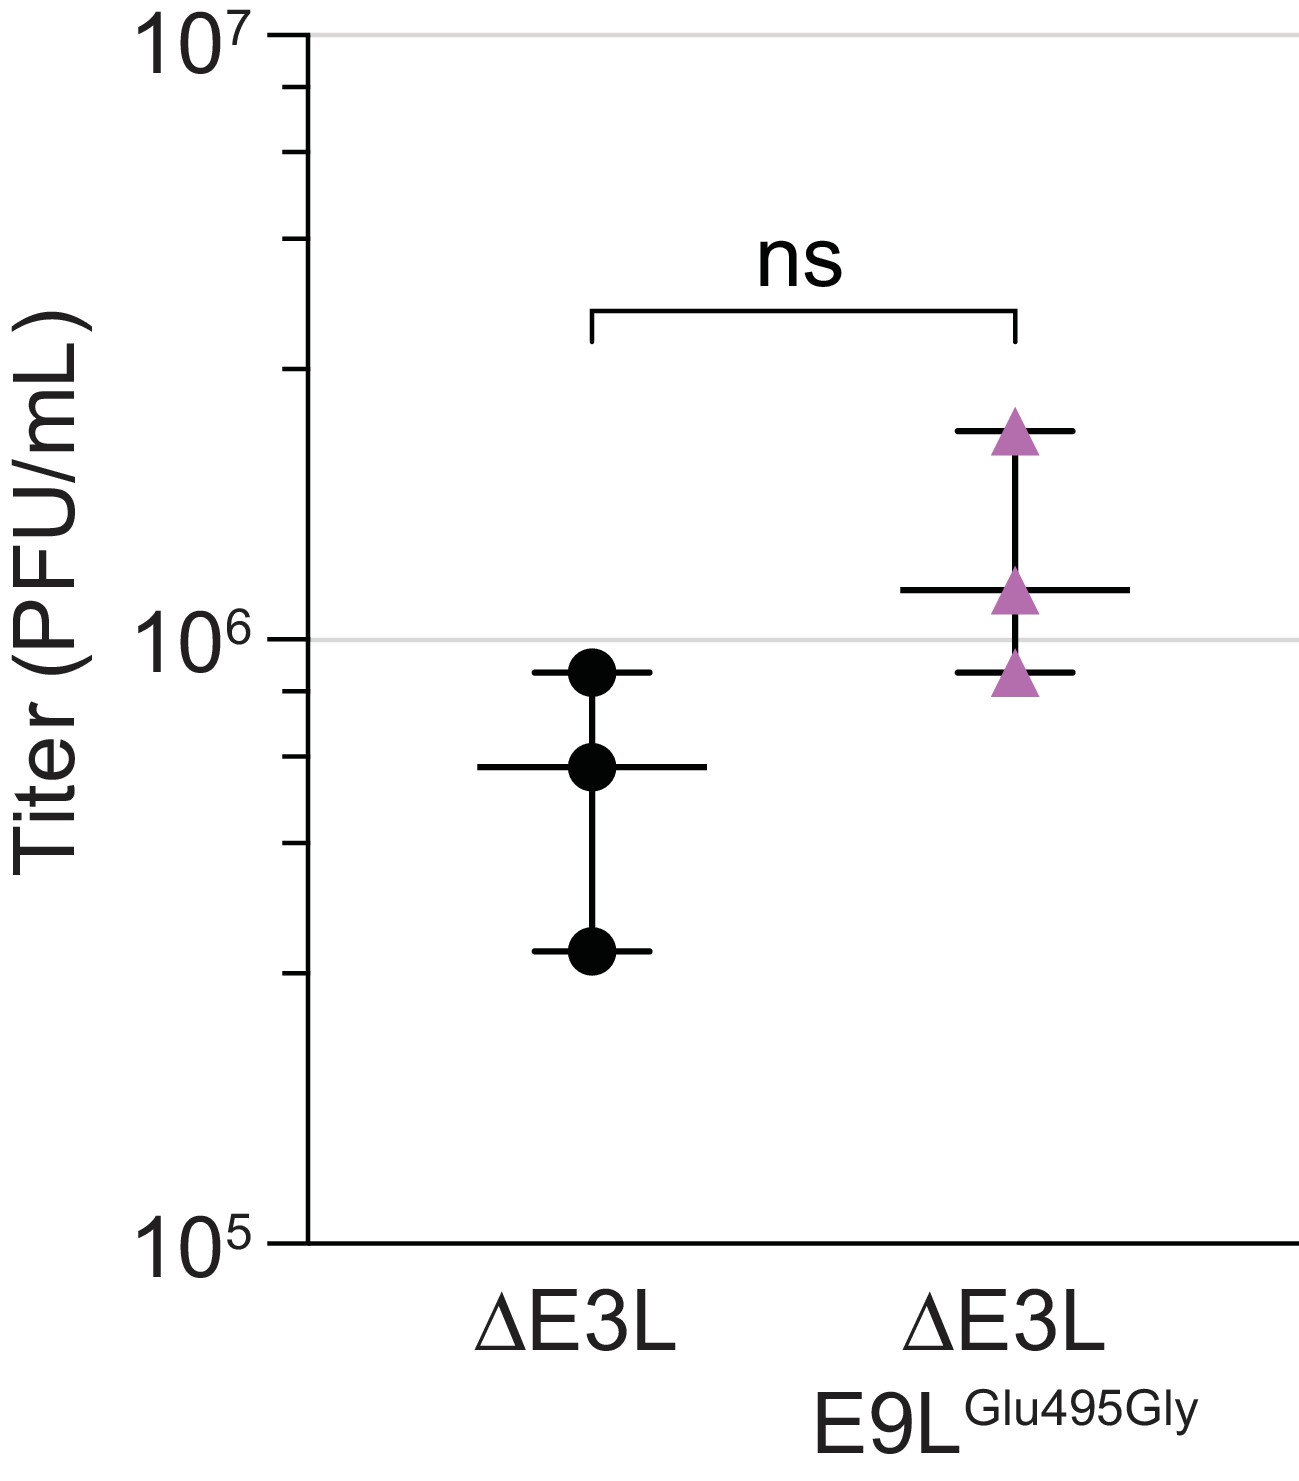
The E9LGlu495Gly variant does not contribute to virus replication.
A virus clone containing the E9LGlu495Gly variant as the only genetic change relative to ΔE3L was isolated following four rounds of plaque purification in BHK cells (clone a in Figure 1C). Replication was measured in comparison to ΔE3L virus after 48 hr of infection (MOI 0.1) of HeLa cells in triplicate. Titers were measured multiple times in BHK cells by plaque assay, shown with median and 95% confidence intervals. ns, not significant by unpaired 2-tailed t test with Welch’s correction.
-
Figure 1—figure supplement 3—source data 4
Data used to generate Figure 1—figure supplement 3.
- https://doi.org/10.7554/eLife.35453.012
-
Figure 1—figure supplement 3—source data 5
Statistics for Figure 1—figure supplement 3, unpaired 2-tailed t test with Welch’s correction.
- https://doi.org/10.7554/eLife.35453.013
Figure 2 with 3 supplements
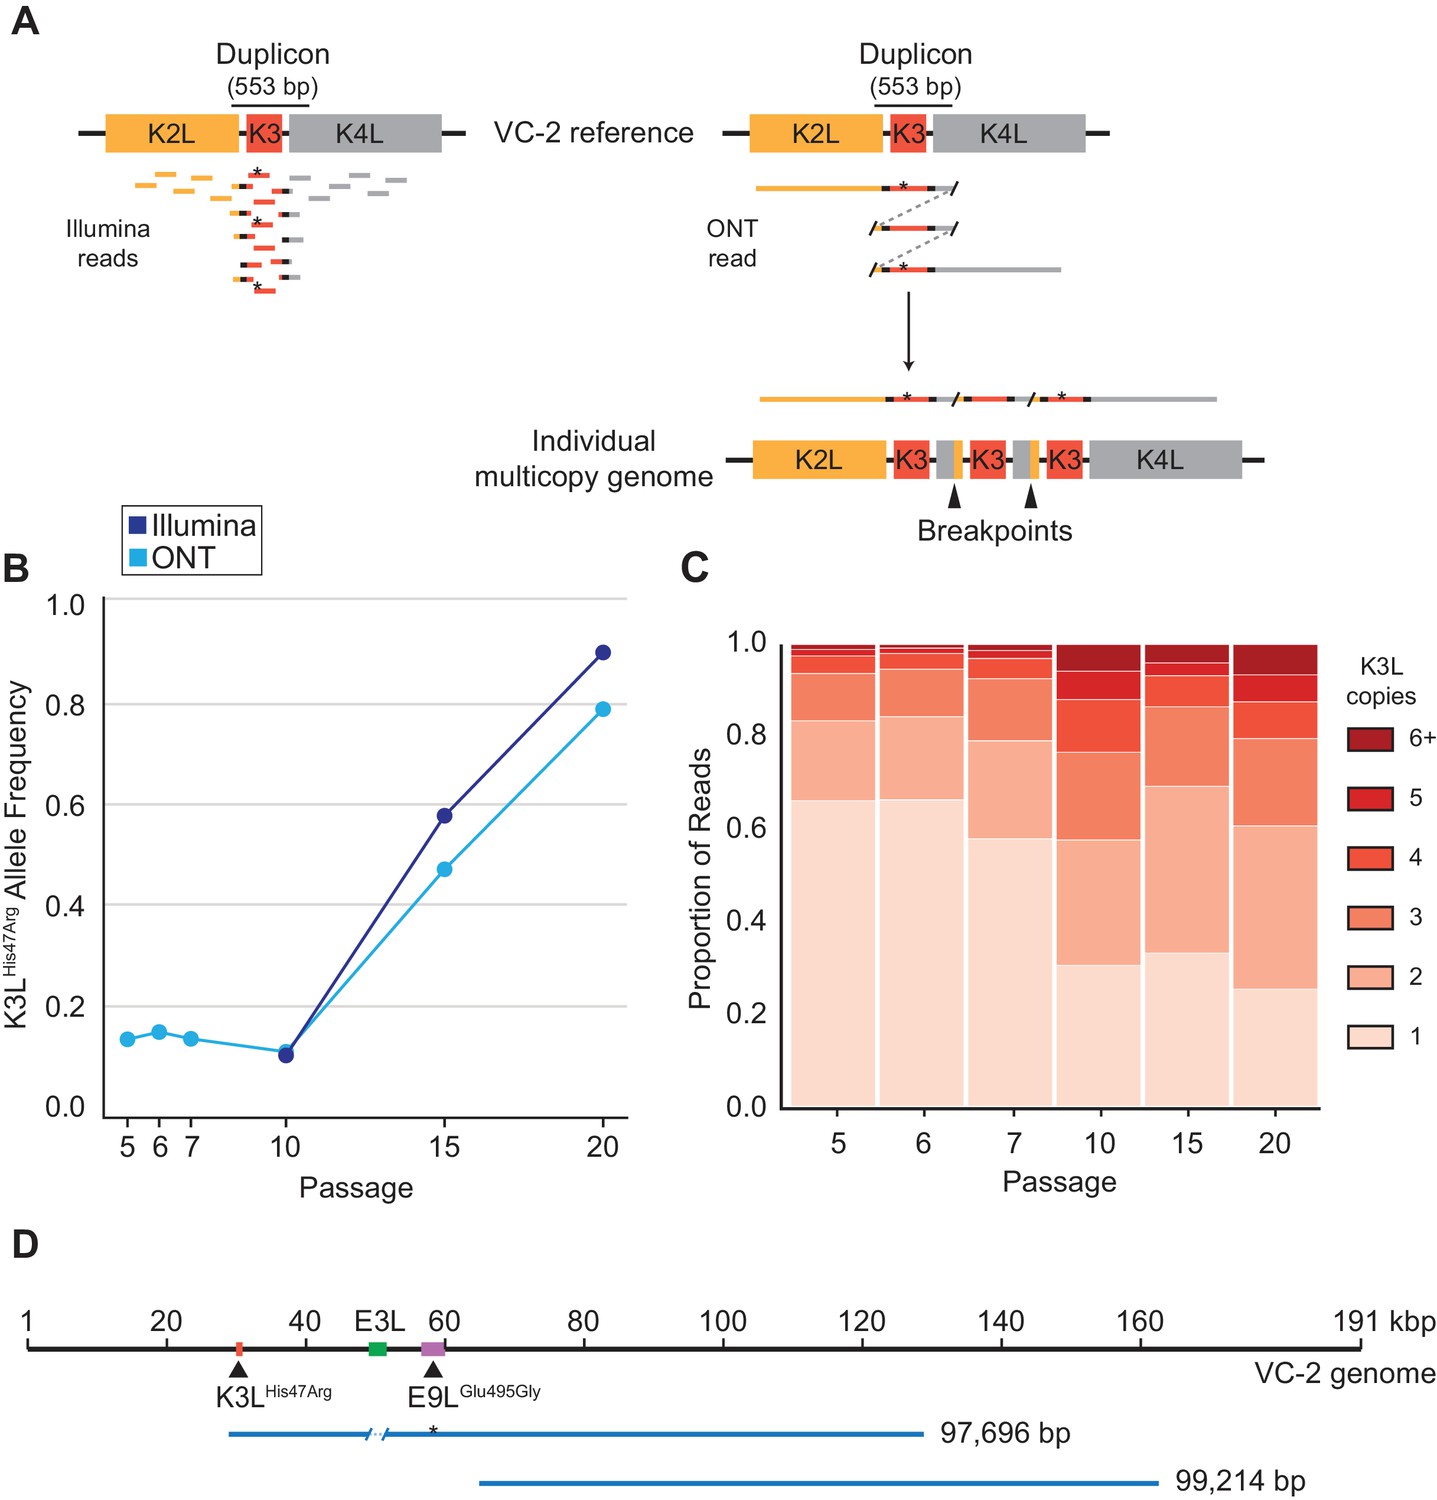
ONT reads capture SNVs and copy number expansions in individual virus genomes.
(A) Representative structure of the K3L locus in the VC-2 reference genome is shown on top, with representative Illumina MiSeq and ONT MinION reads shown to scale below. The K3LHis47Arg variant within reads is indicated by an asterisk. ONT reads that split and re-align to the K3L duplicon are indicative of individual multicopy arrays (shown below). Tandem duplication breakpoints flanking the duplicon are indicated by arrowheads. (B) Population-level K3LHis47Arg allele frequency was estimated using Illumina or ONT reads from different passages. E9LGlu495Gly allele frequencies are shown in Figure 2—figure supplement 1. Error rate calculations for different flow cell chemistries are shown in Figure 2—figure supplement 2. (C) For each sequenced passage, K3L copy number was assessed within each ONT read that aligned at least once to the K3L duplicon (see Materials and methods for further details). Detailed plot of reads containing 6 + K3L copies is shown in Figure 2—figure supplement 3. (D) Representative reads from the specific long read preparation are depicted relative to the VC-2 reference genome. The locations of relevant genes are indicated by colored boxes (gene name above or below), and the locations of high frequency variants in K3L and E9L are indicated by arrowheads.
-
Figure 2—source data 1
Single nucleotide variants in virus populations from Illumina or ONT datasets, used to generate Figure 2B.
- https://doi.org/10.7554/eLife.35453.018
Figure 2—figure supplement 1
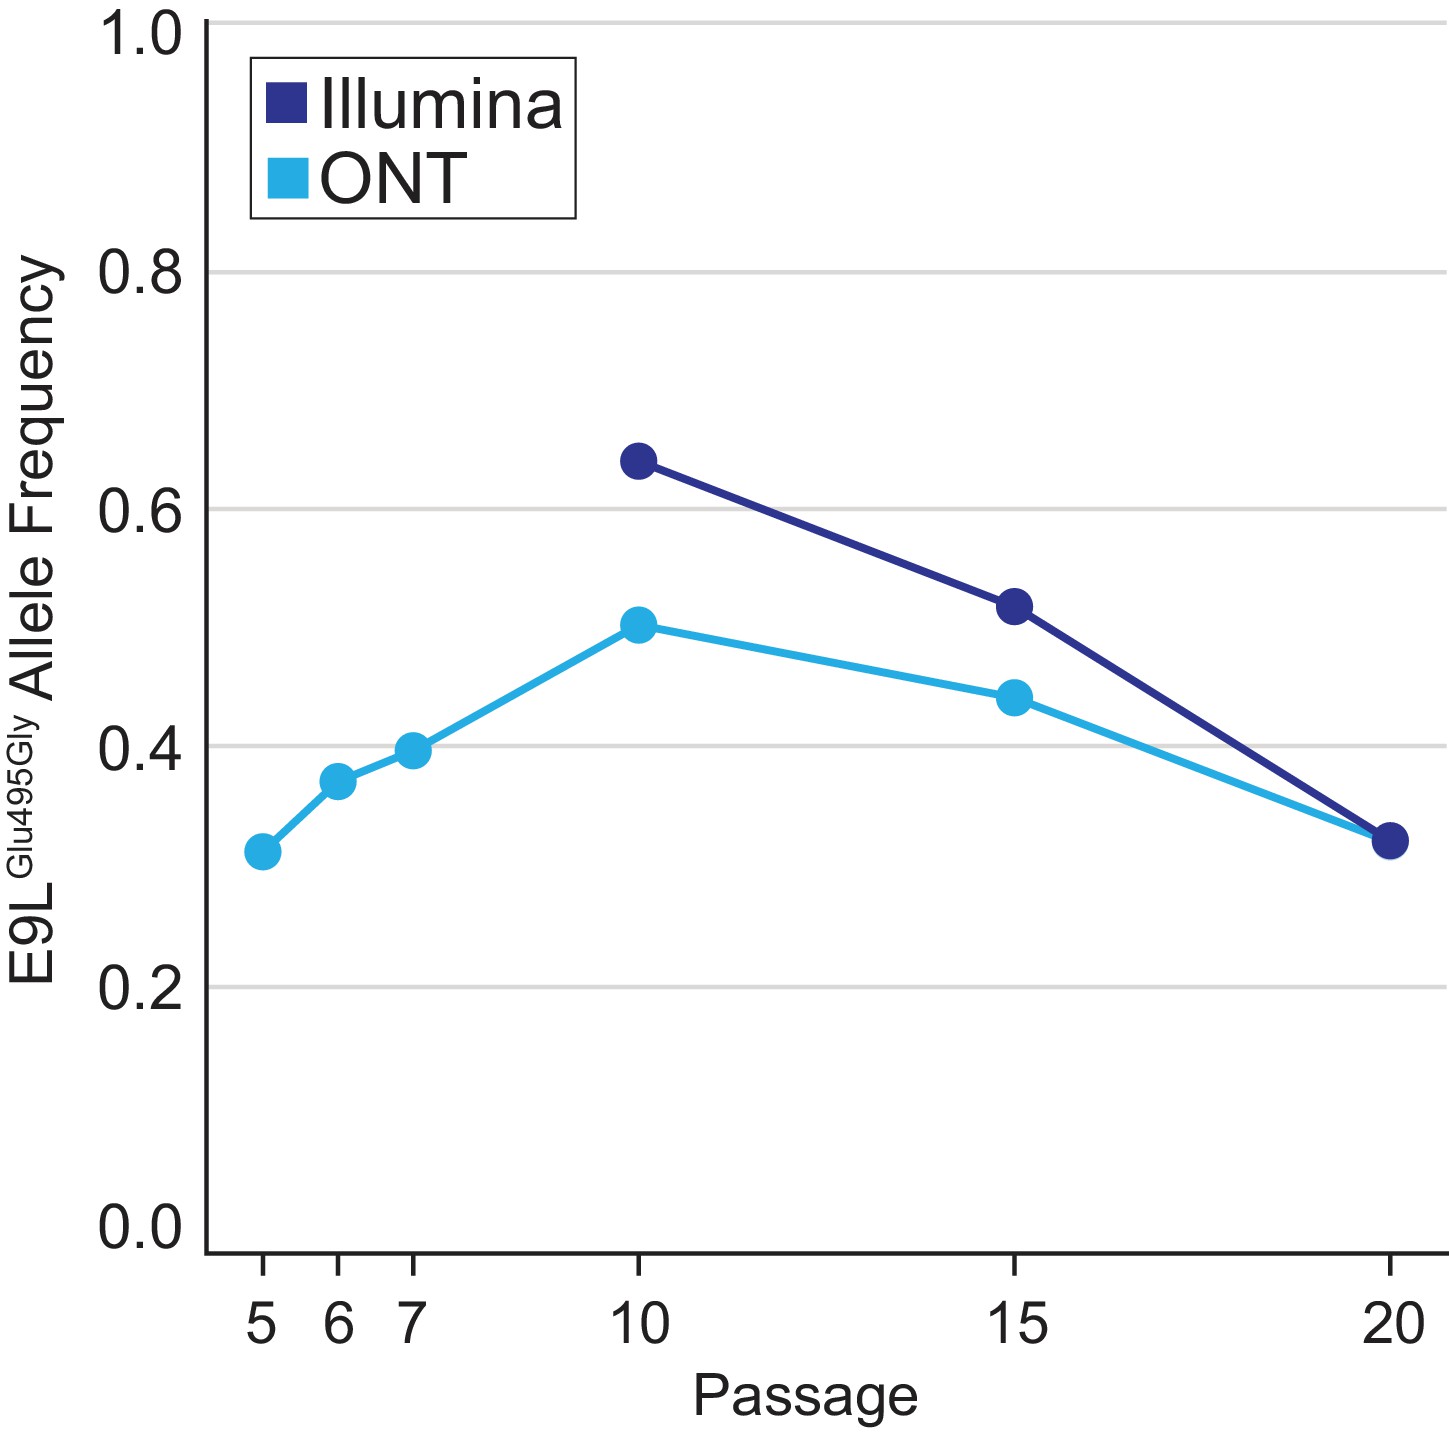
E9LGlu495Gly variant dynamics.
Population-level E9LGlu495Gly allele frequencies were estimated using freebayes and nanopolish on Illumina or ONT reads, respectively, from different passages as in Figure 2B.
-
Figure 2—figure supplement 1—source data 1
Data used to generate Figure 2—figure supplement 1.
- https://doi.org/10.7554/eLife.35453.019
Figure 2—figure supplement 2
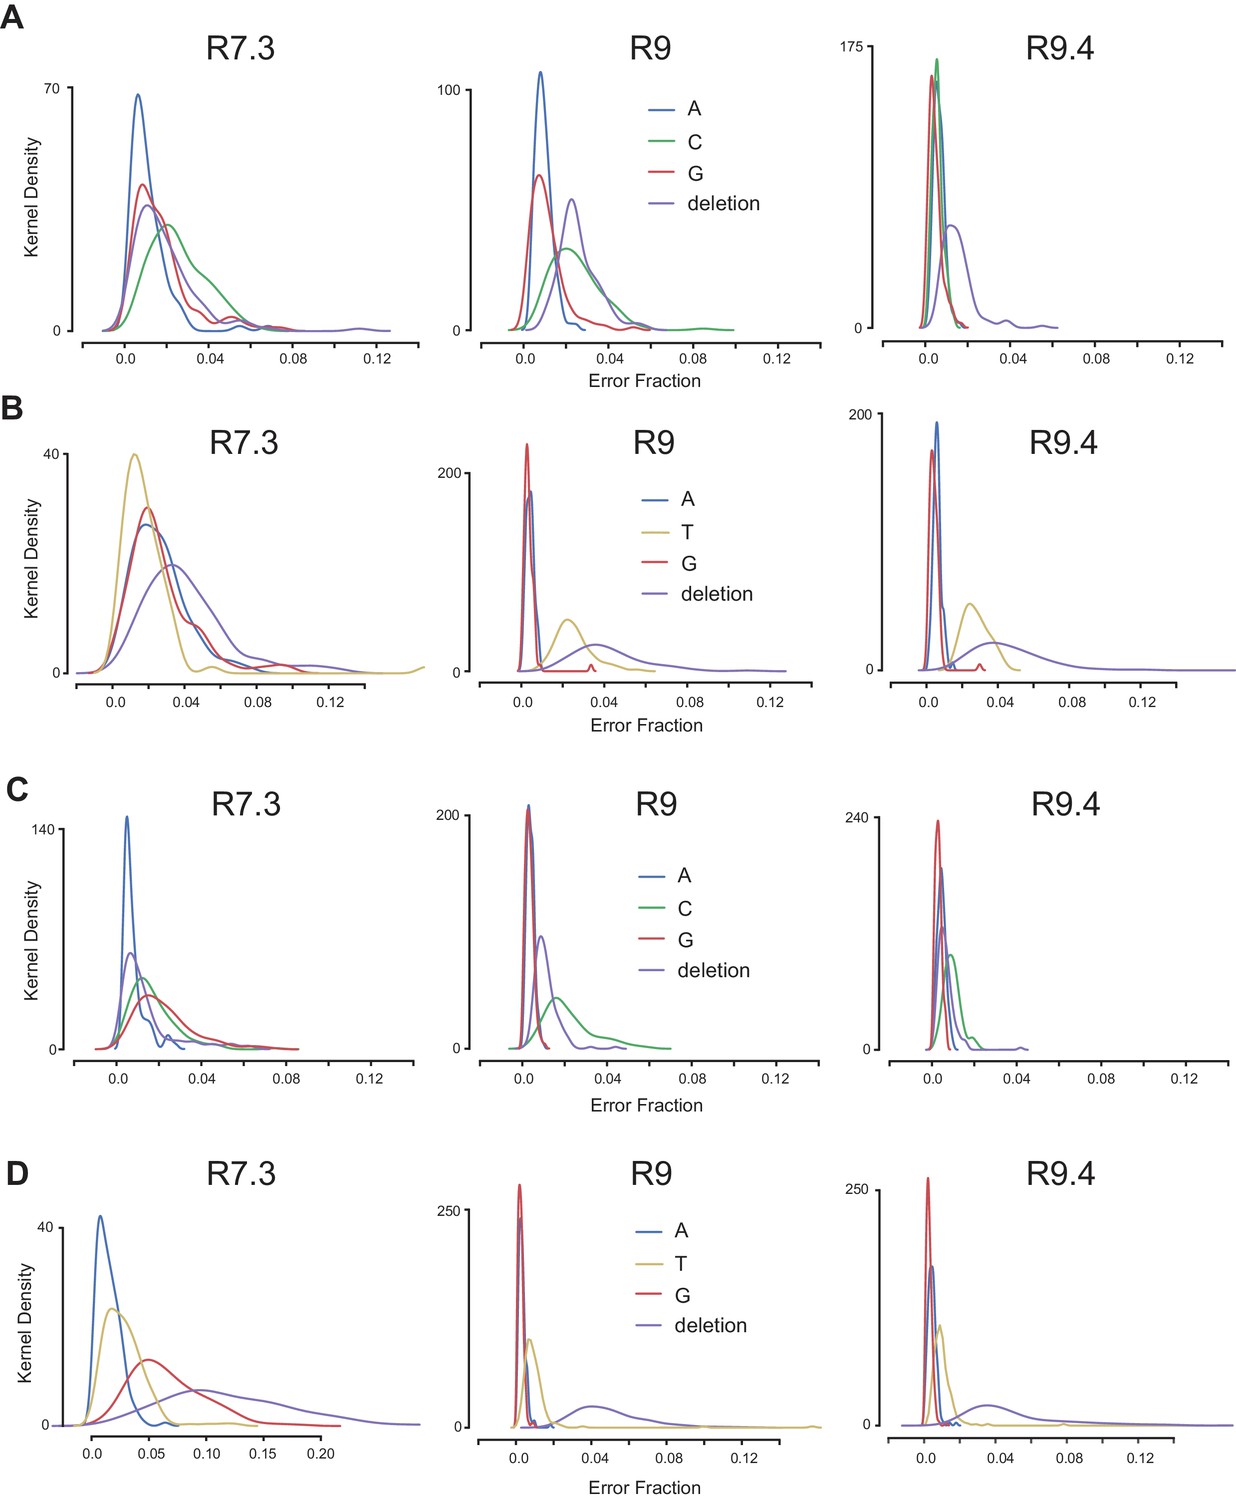
Error rate profiles in ONT reads.
The proportions of non-reference bases aligned to the 5-mers containing the K3LWT (A), K3LHis47Arg (B), E9LWT (C), or E9LGlu495Gly (D) sequences were calculated from alignments of ONT reads from the P15 population generated with three distinct flowcell chemistries (listed above each plot). Kernel density plots represent the distributions of error proportions for each non-reference base across all 5-mers in the vaccinia reference genome.
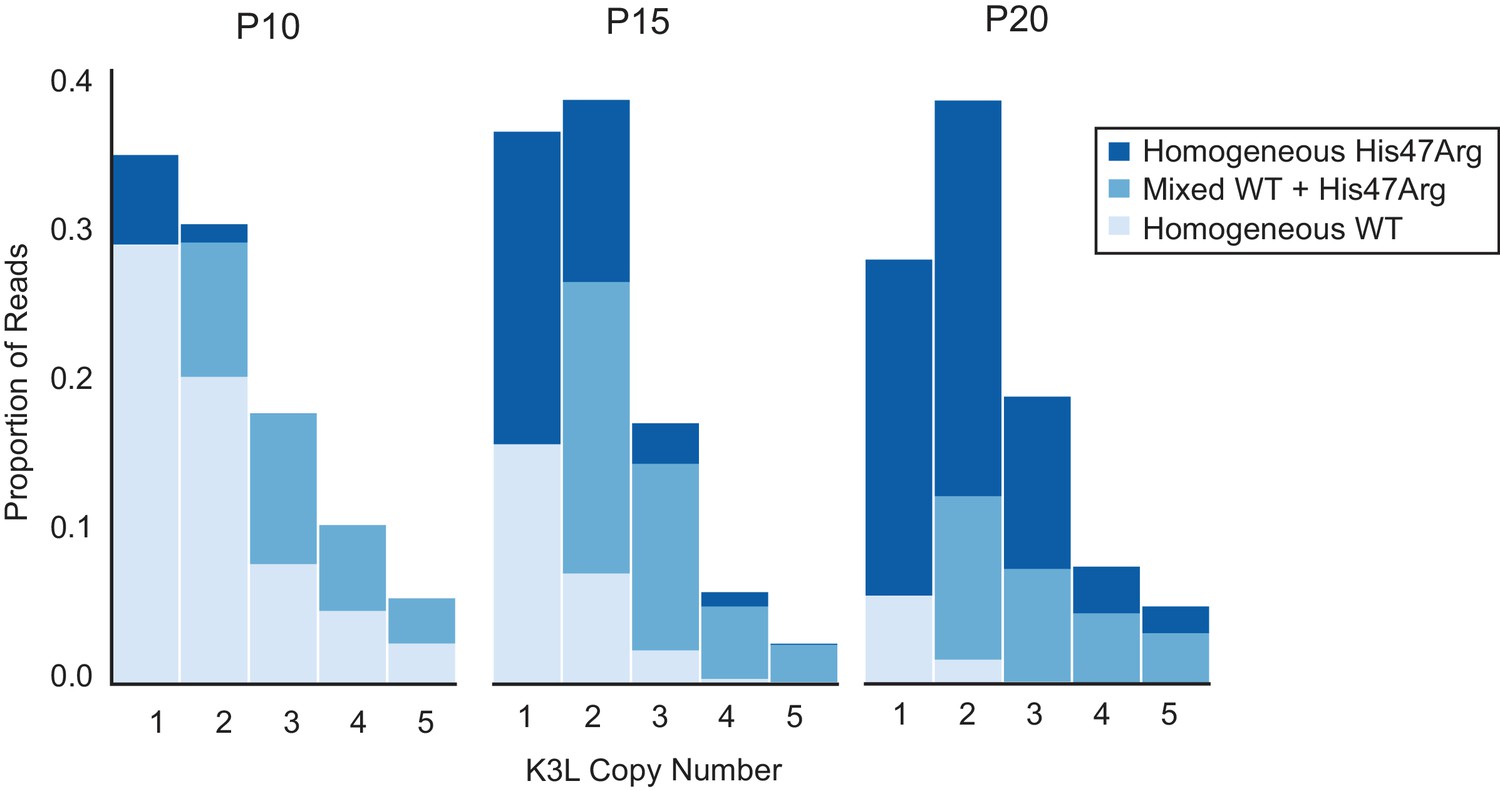
Figure 2—figure supplement 3

ONT reads capture high K3L copy number in vaccinia genomes.
K3L copy number was assessed in ONT reads from P10, P15, and P20 as described in Figure 2C. Stacked bar plots indicate overall proportions of sequencing reads that contain between 6 and 16 copies of K3L, in ascending order (darker bars represent increasing copy number). The maximum copy number observed in any single ONT read is indicated below each passage.
Figure 3 with 4 supplements

The K3LHis47Arg variant homogenizes within multicopy arrays throughout experimental evolution.
Stacked bar plots representing the proportions of mixed and homogeneous K3L arrays were generated from ONT reads for the indicated virus populations (passages are listed above each plot). The proportions of reads containing homogeneous K3LWT, homogeneous K3LHis47Arg, or any combination of mixed alleles are shown for reads containing 1–5 K3L copies. A simulation of SNV accumulation under a binomial distribution is shown in Figure 3—figure supplement 1, and results from sequencing with different flow cell chemistries is shown in Figure 3—figure supplement 2. Simulations of the effects of ONT sequencing error rates on the identification of mixed and homogeneous arrays are shown in Figure 3—figure supplement 3, and the proportions of each combination of K3L alleles in 3, 4, and 5-copy arrays are shown in Figure 3—figure supplement 4.
Figure 3—figure supplement 1
Simulated accumulation of the K3LHis47Arg SNV.
The K3LHis47Arg allele was uniformly distributed in simulated vaccinia populations with copy number distributions identical to passages P10, P15, and P20 (see Materials and methods for further detail). Stacked bar plots representing the proportions of mixed and homogeneous K3L arrays were generated as in Figure 3.
Figure 3—figure supplement 2
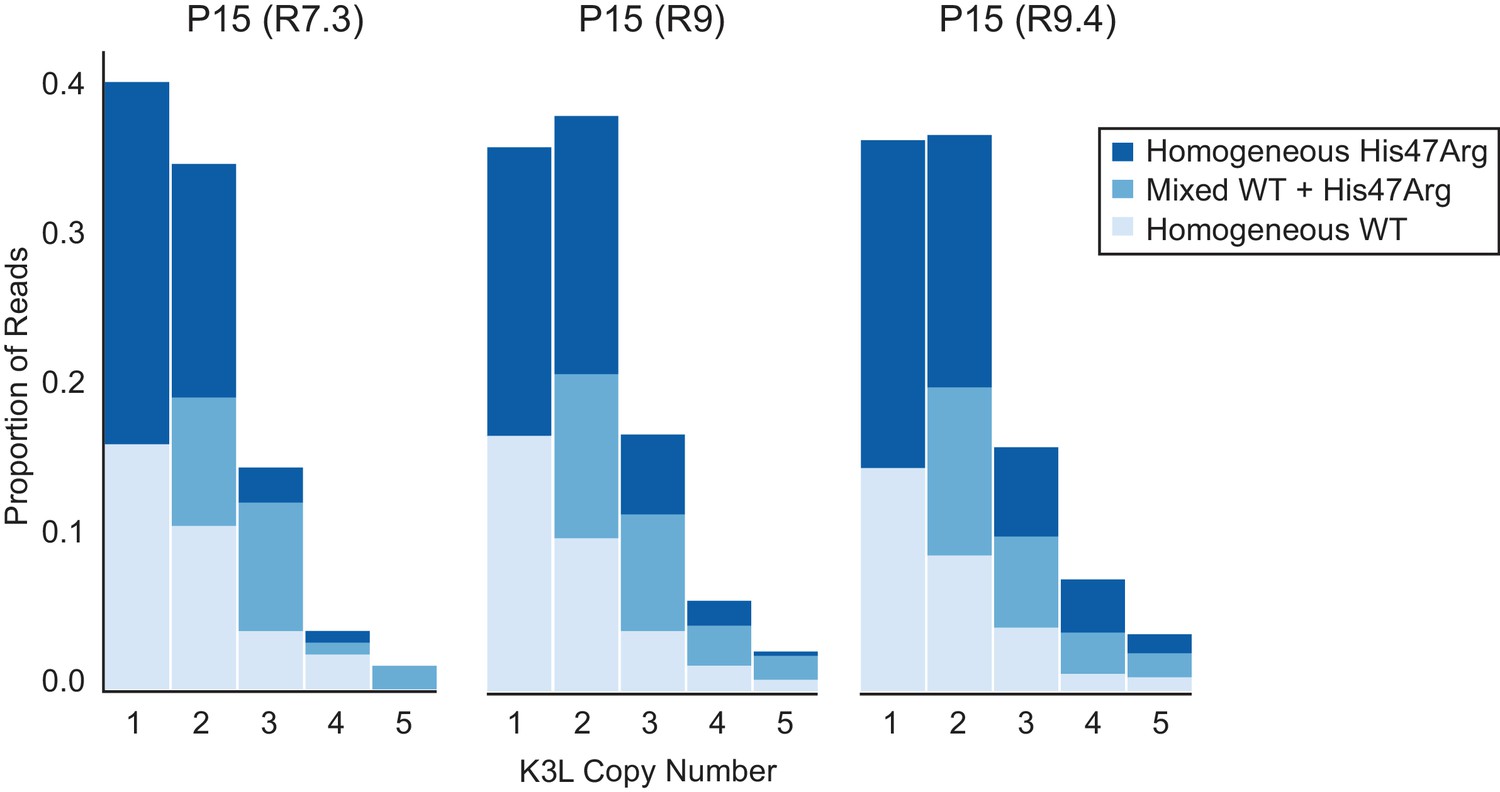
ONT flowcell chemistries do not affect observed proportions of homogeneous and mixed K3L arrays.
The P15 population was sequenced using R7.3, R9, and R9.4 ONT flowcell chemistries, and stacked bar plots representing the proportions of mixed and homogeneous K3L arrays were generated as in Figure 3.
Figure 3—figure supplement 3

ONT sequencing error rates do not affect observed proportions of homogeneous and mixed K3L arrays.
(A) Using reads from passage 15 populations sequenced with R7.3, R9, and R9.4 flowcell chemistries, all mixed arrays were converted into homogeneous arrays (see Materials and methods for further detail). K3LWT and K3LHis47Arg alleles were then switched as a proxy for sequencing errors, and the proportions of mixed arrays recovered were calculated. Stacked bar plots representing the proportions of mixed and homogeneous arrays were then generated following one simulation. (B) Kernel density plots were also generated, representing the distributions of expected mixed array proportions recovered across 1000 simulations. The observed proportion of mixed arrays using the indicated flowcell chemistry is shown as a dotted red line.
Figure 3—figure supplement 4
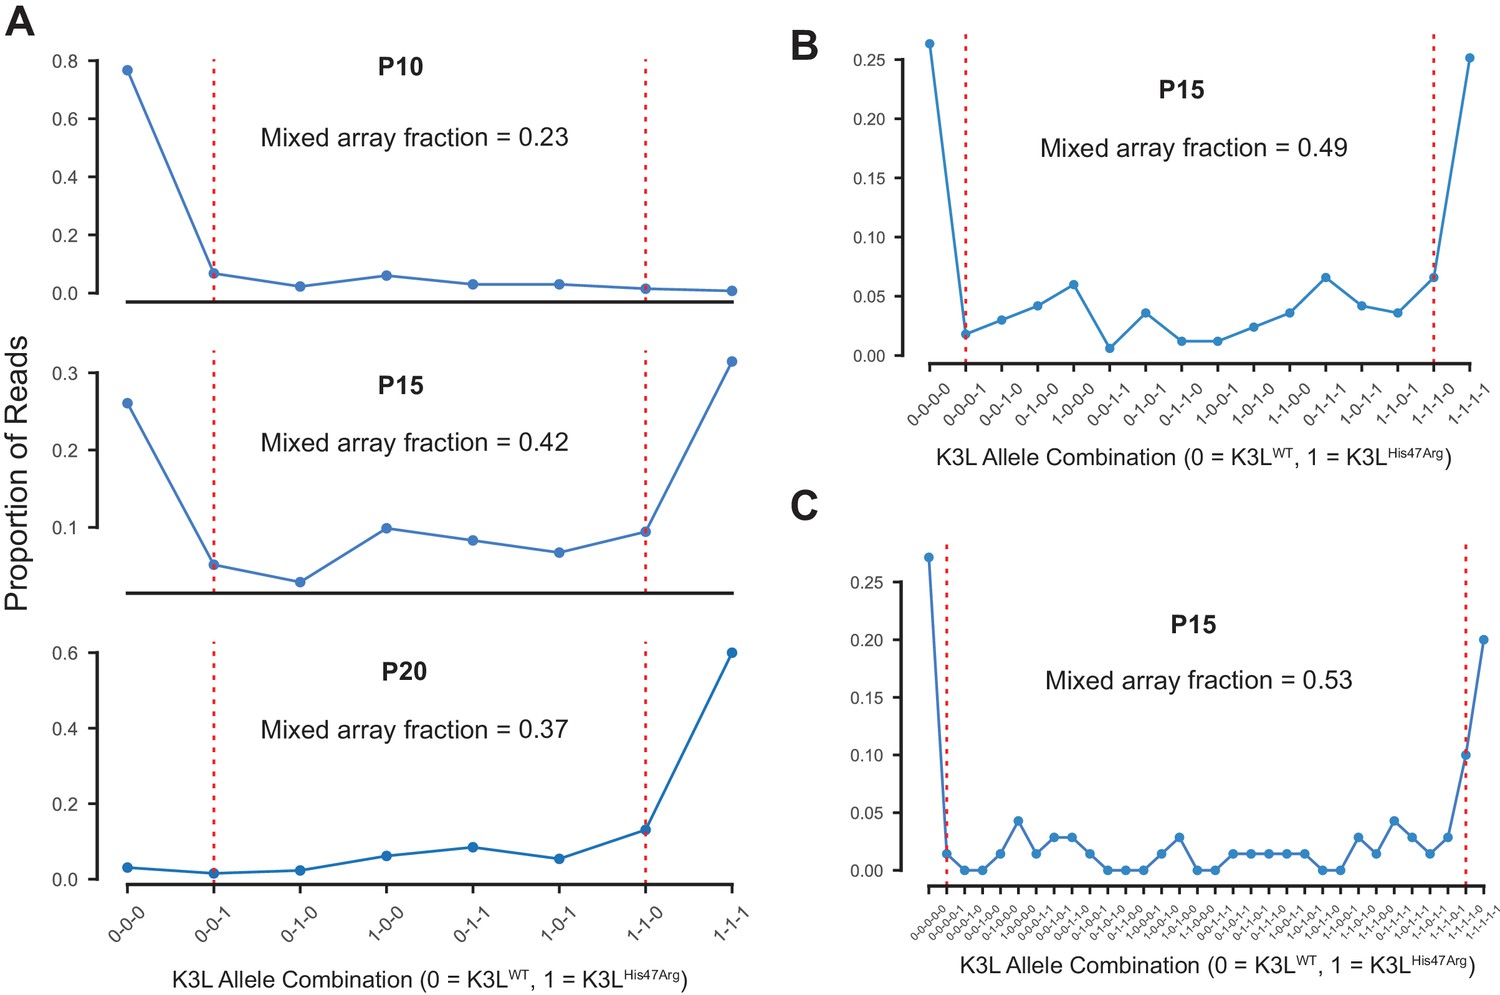
Multicopy K3L arrays contain diverse combinations of K3LWT and K3LHis47Arg alleles.
(A) The proportions of 3-copy K3L arrays containing each possible combination of K3LWT and K3LHis47Arg alleles at P10, P15, and P20 were counted. Dotted red lines separate mixed and homogeneous arrays, and the total fraction of mixed arrays is indicated above each plot. The proportions of (B) 4-copy and (C) 5-copy arrays with each possible combination of K3L alleles are shown for passage 15, which was re-sequenced to generate a larger number of reads.
Figure 4
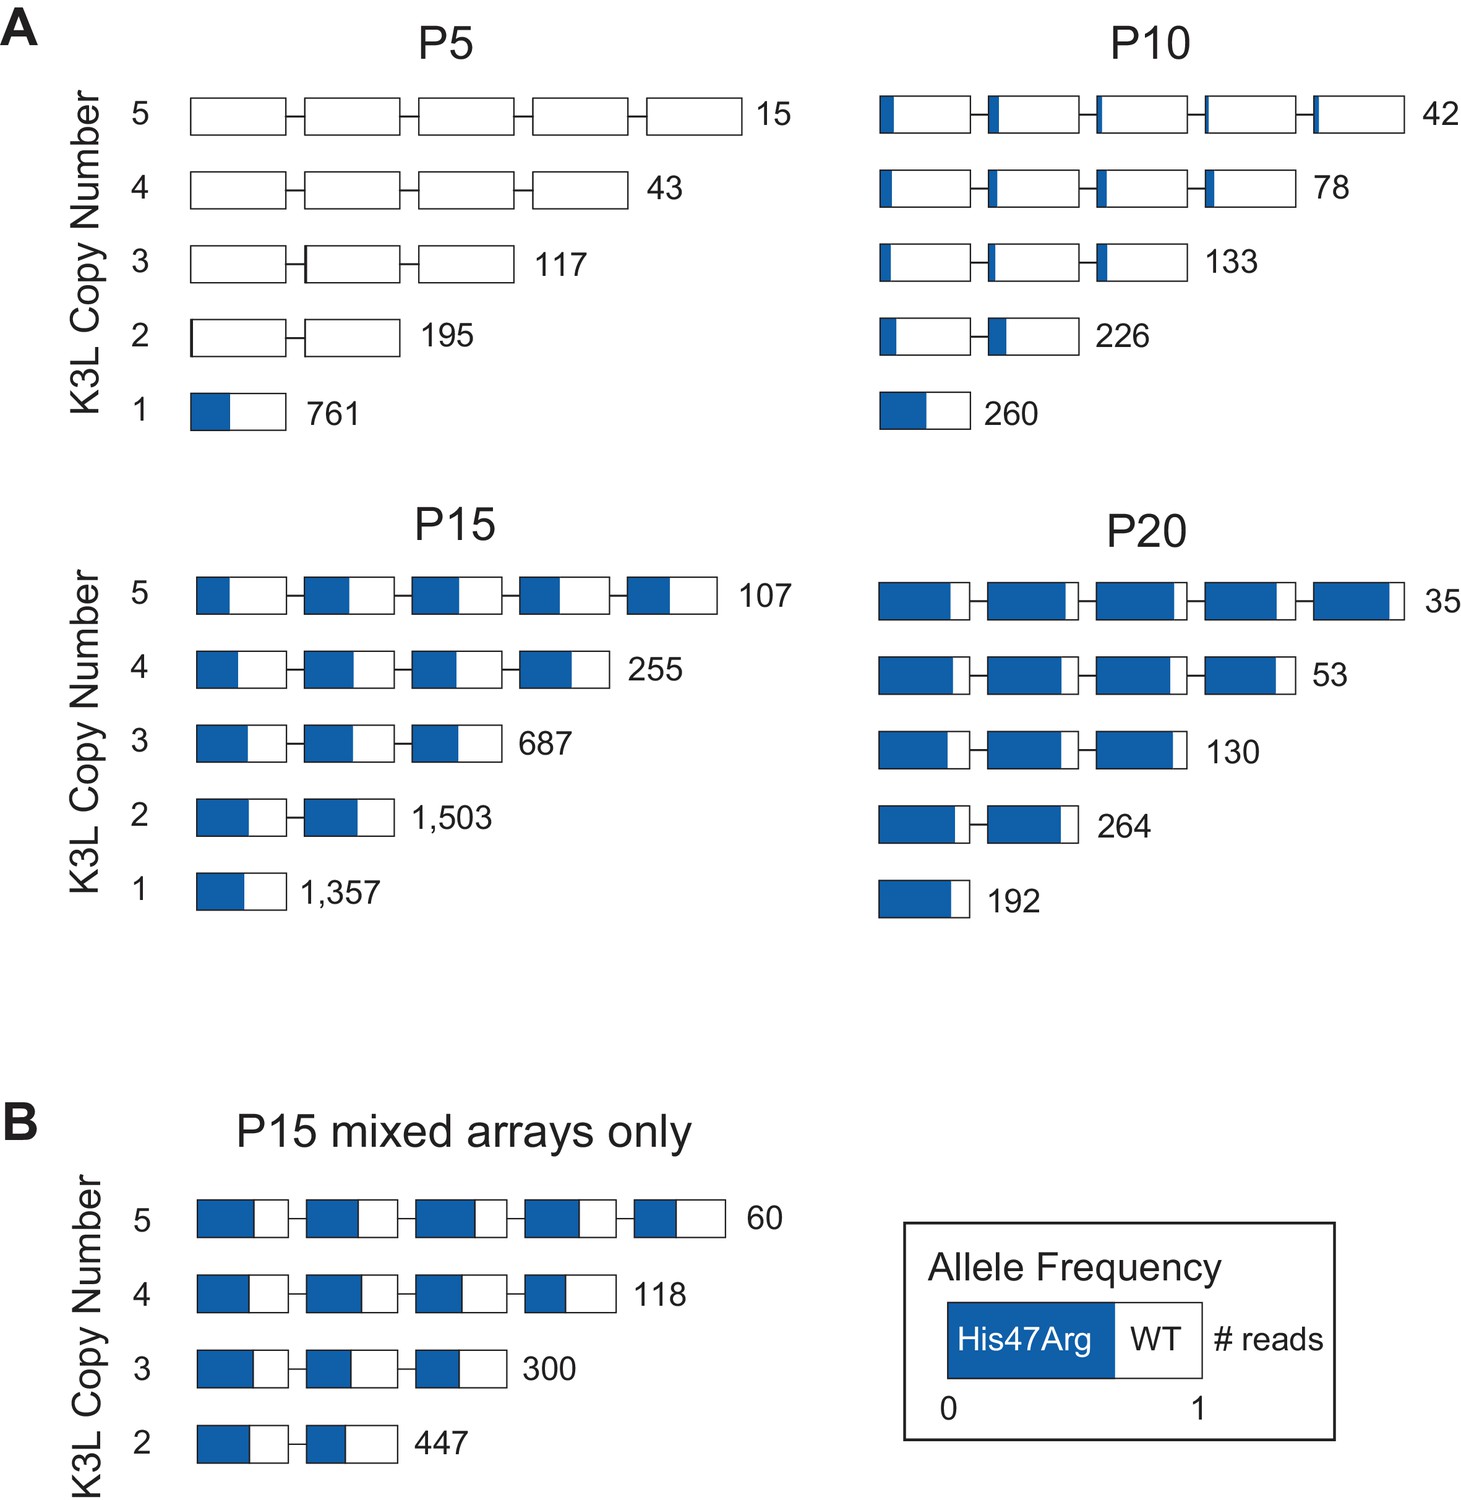
The K3LHis47Arg variant homogenizes in K3L arrays regardless of copy number.
(A) ONT reads from every 5th passage were grouped by K3L copy number, and each K3L copy was assessed for the presence or absence of the K3LHis47Arg SNV. Reads containing 1–5 K3L copies are shown. (B) Using reads from the P15 population, homogeneous K3L arrays were removed from the dataset, and K3LHis47Arg SNV frequency was plotted exclusively in mixed arrays. The number of reads of each copy number is indicated to the right of each row. Reads are oriented 5’ to 3’ relative to the VC-2 reference sequence, and the K3LHis47Arg allele frequency in each copy is indicated in blue.
Figure 5

K3LHis47Arg homogenization within multicopy arrays is independent of intergenomic recombination rate.
The P10 population was serially passaged in HeLa cells at different MOIs (listed above each plot), and each of the resulting P15 populations was sequenced with ONT. Stacked bar plots representing the proportions of mixed and homogeneous arrays were generated as in Figure 3.
Figure 6
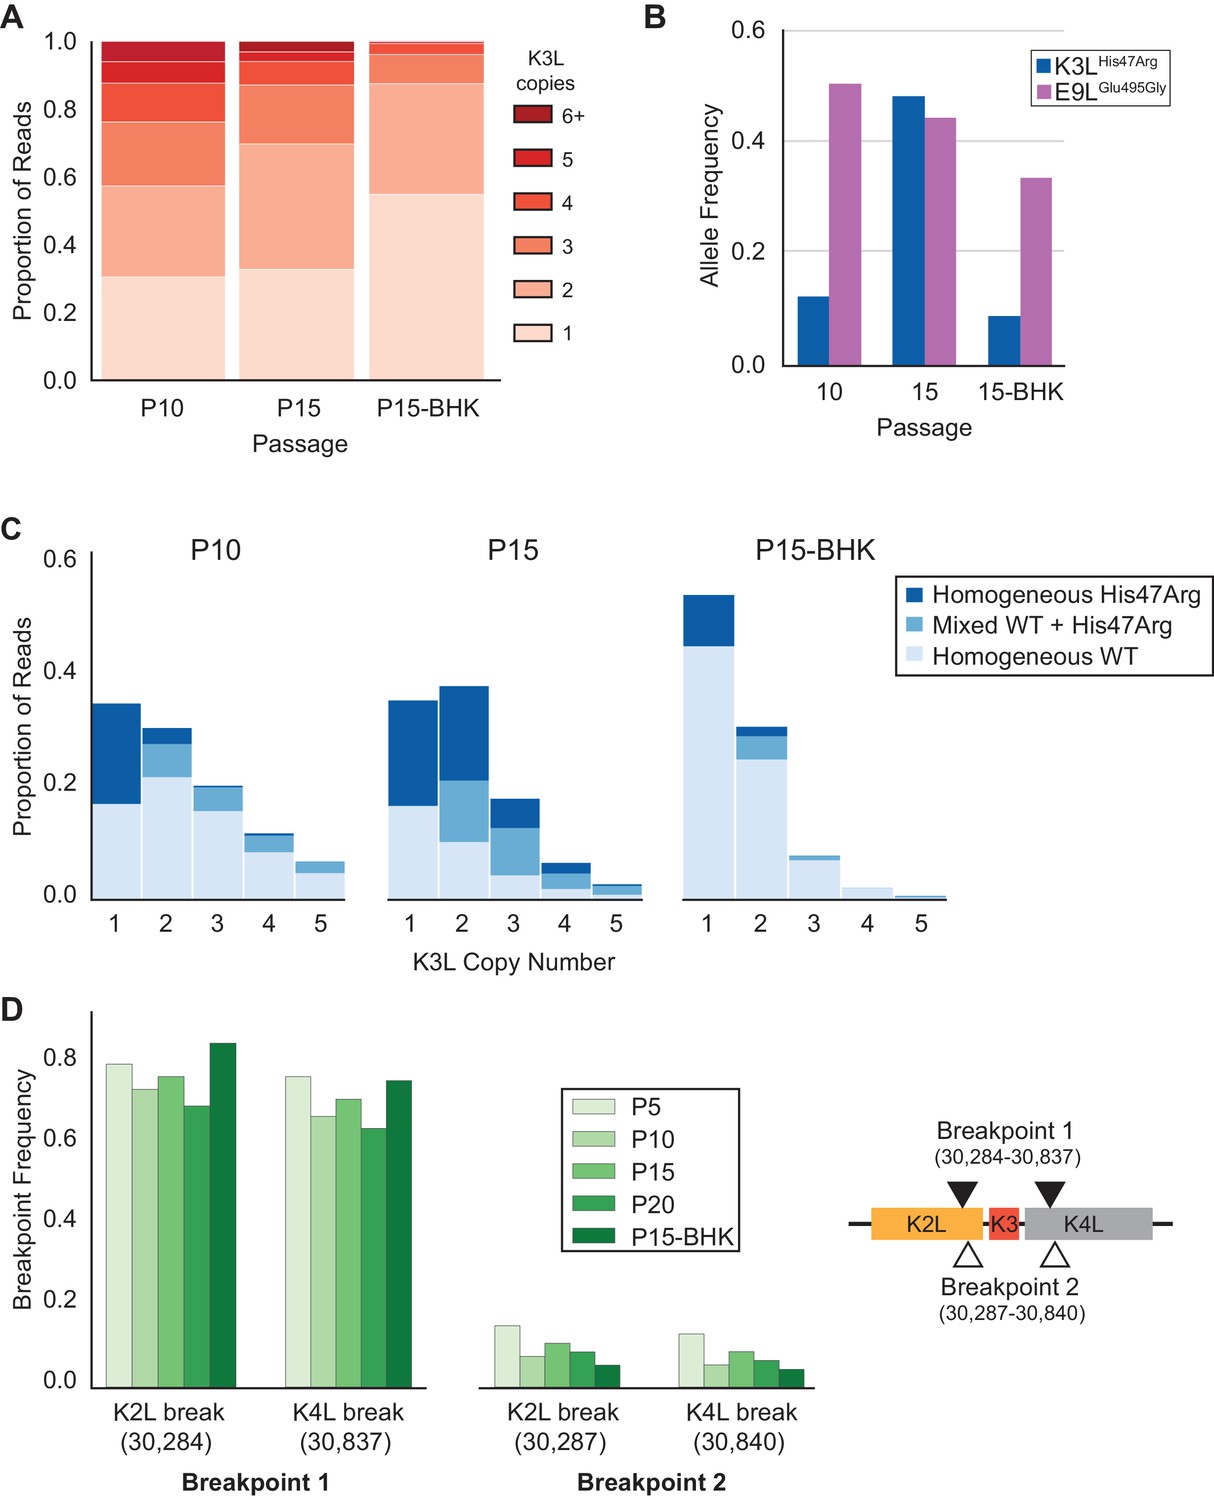
K3LHis47Arg variant homogenization is dependent on selection.
The P10 population was serially passaged five times in BHK cells (MOI = 0.1, 48 hr; P15-BHK). P10 and P15 data are included from previous figures for comparison with P15-BHK. (A) K3L copy number was assessed for all sequenced reads that unambiguously aligned to K3L at least once, as in Figure 2C. (B) K3LHis47Arg and E9LGlu495Gly allele frequencies in each population were estimated using ONT reads, as in Figure 2B. Allele frequencies for all sequenced populations are included in Figure 6—source data 1. (C) Stacked bar plots representing the proportions of mixed and homogeneous arrays were generated from sequenced ONT reads, as in Figure 3. (D) ONT reads were assessed for the presence of each breakpoint (shown relative to the genome to the right) by aligning reads to a query sequence containing K3L using BLAST and extracting the starts and ends of individual alignments to the K3L duplicon. Due to sequencing errors, a proportion of reads do not match either breakpoint 1 or breakpoint 2.
-
Figure 6—source data 2
Data used to generate Figure 6D.
- https://doi.org/10.7554/eLife.35453.032
-
Figure 6—source data 1
Single nucleotide variants in all sequenced virus populations from Illumina or ONT datasets.
Data used to generate Figure 6B.
- https://doi.org/10.7554/eLife.35453.033
Figure 7
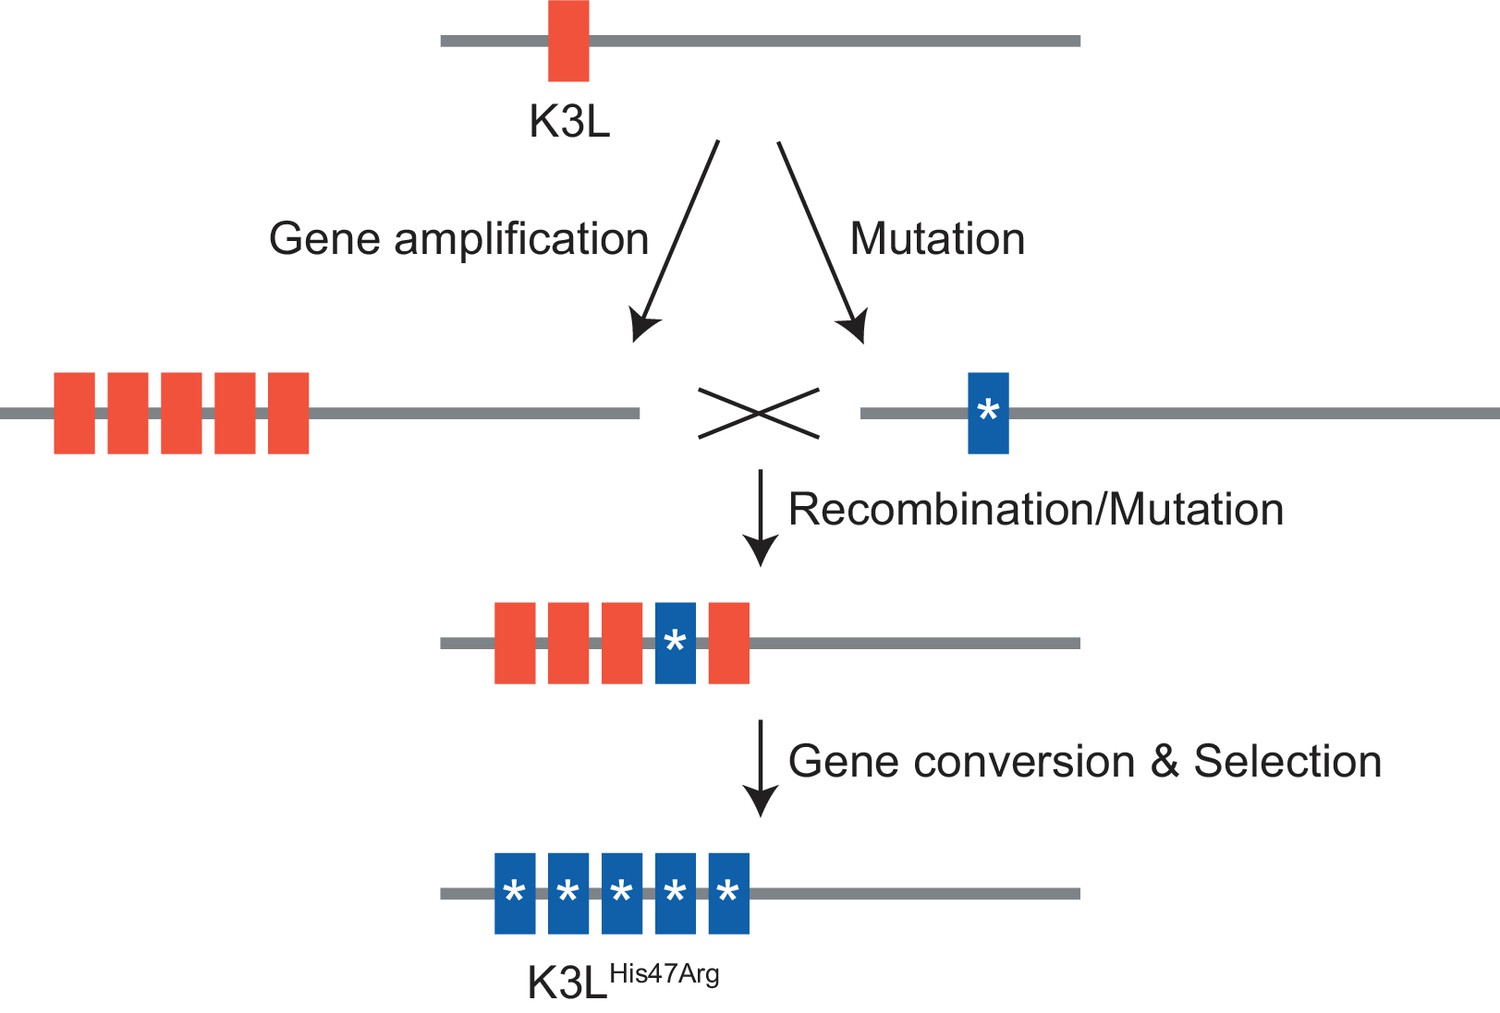
Model of K3LHis47Arg homogenization within K3L CNV via gene conversion.
https://doi.org/10.7554/eLife.35453.034
Author response image 1
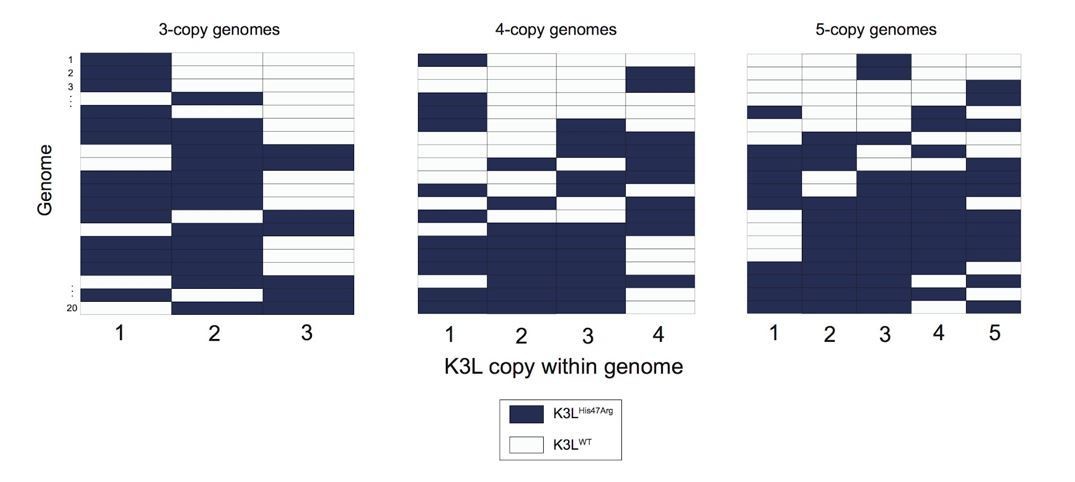
Variety of mixed vaccinia genomes in P15 sequencing data.
We selected a random set of 20 vaccinia genomes of the specified copy number from the P15 sequencing data (a passage with a large proportion of mixed genomes), and plotted the distribution of K3LHis47Arg and K3LWT alleles within each genome.
Author response image 2

Error rate distribution within K3LHis47Arg sequence context.
(A) Kernel density plots representing the distribution of error rates for T>C, T>A, T>G, and T>deletion error across all TATGC 5-mers in data from each flowcell chemistry. (B) Kernel density plots representing the distribution of error rates for C>T, C>A, C>G, and C>deletion errors across all TACGC 5-mers in data from each flowcell chemistry.
Author response image 3
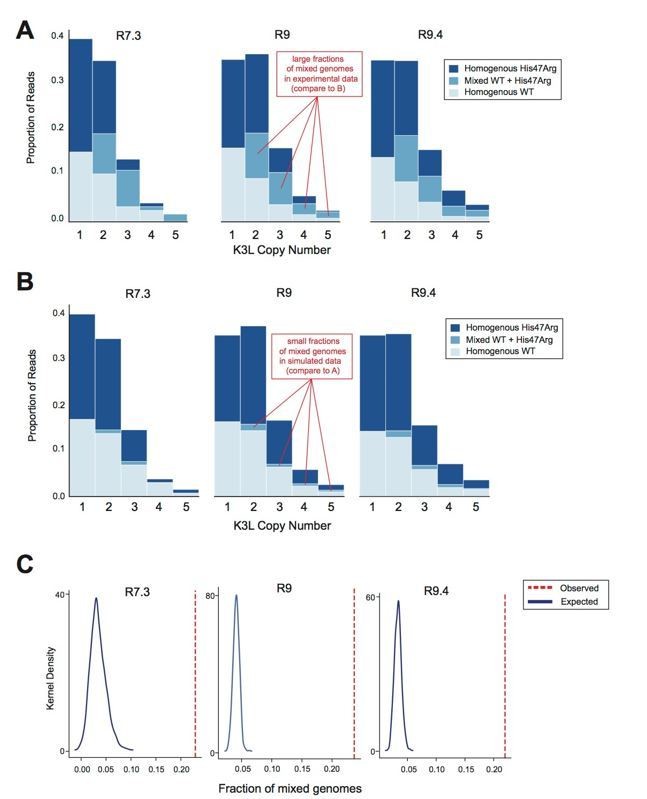
Oxford Nanopore sequencing error does not impact observed patterns of K3L copy number or K3LHis47Arg allele heterogeneity.
The P15 vaccinia population was sequenced with R7.3, R9, and R9.4 chemistry ONT flowcells. (A) Stacked bar plots representing the diversity of allele combinations within single-copy and multicopy reads were generated from sequenced ONT reads from each chemistry, as in Figure 3 and Figure 5 (original manuscript). (B) All mixed genomes observed in the data from each flowcell chemistry were converted to homogeneous genomes (Extended Methods), and sequencing errors were randomly distributed throughout these genomes at a rate equivalent to the median C>T or T>C error rate for the particular chemistry (see Response Table 1). Stacked bar plots representing the resulting diversity of allele combinations were then created as in (A). (C) We performed the simulation in (B) a total of 1000 times, and generated kernel density plots representing the distribution of mixed genome proportions recovered in each simulation. The red line indicates the proportion of mixed genomes observed in the experimental data for the sequencing chemistry of interest..
Author response image 4
Tables
Table 1
Summary of ONT sequencing datasets
https://doi.org/10.7554/eLife.35453.020| Population* | Total sequenced reads | Mean read length (bp) | Read length N50 (bp) | Total sequenced bases (Gbp) | Reads containing K3L |
|---|---|---|---|---|---|
| P5 | 239,737 | 2168 | 5932 | 0.52 | 1190 |
| P10 | 91,815 | 3523 | 7693 | 0.32 | 912 |
| P15 | 388,502 | 4493 | 6908 | 1.75 | 4317 |
| P20 | 94,050 | 2893 | 7702 | 0.27 | 789 |
-
*ONT sequencing datasets for all populations are available in Table 1-source data 1
-
Table 1-source data 1
Complete summary of ONT sequencing datasets
- https://doi.org/10.7554/eLife.35453.021
Table 2
Median sequencing error rates using various ONT flowcell chemistries
https://doi.org/10.7554/eLife.35453.022| Mutation and context (amino acid change) | R7.3 | R9 | R9.4 |
|---|---|---|---|
| TA[T > C]GC (His47Arg) | 0.023 | 0.023 | 0.005 |
| TA[C > T]GC (Arg47His) | 0.015 | 0.024 | 0.026 |
| AT[T > C]CG (Glu495Gly) | 0.014 | 0.018 | 0.009 |
| AT[C > T]CG (Gly495Glu) | 0.025 | 0.009 | 0.009 |
Table 3
Structural variant breakpoint frequencies during passaging
https://doi.org/10.7554/eLife.35453.023| Breakpoint frequency* | ||||||
|---|---|---|---|---|---|---|
| Breakpoint | K2L break | K4L break | P5 | P10 | P15 | P20 |
| 1 | 30,284 | - | 0.76 | 0.69 | 0.76 | 0.66 |
| 1 | - | 30,837 | 0.76 | 0.63 | 0.72 | 0.62 |
| 2 | 30,287 | - | 0.14 | 0.06 | 0.10 | 0.08 |
| 2 | - | 30,840 | 0.12 | 0.04 | 0.09 | 0.05 |
-
*Due to sequencing errors, a proportion of reads do not match either breakpoint
Key resources table
| Reagent type (species) or resource | Designation | Source or reference | Identifiers | Additional information |
|---|---|---|---|---|
| Gene (Vaccinia virus) | K3L | NA | NCBI_Gene ID:3707649 | |
| Strain, strain background (Vaccinia virus) | VC-2, Copenhagen | (Goebel et al., 1990) PMID: 2219722 | NCBI_txid:10249; NCBI_GenBank:M35027.1 | |
| Strain, strain background (Vaccinia virus) | ΔE3L, Copenhagen | (Beattie et al., 1995) PMID: 7527085 | ||
| Cell line (Homo sapiens) | HeLa | Other | Obtained from Geballelab, University of Washington | |
| Cell line (Mesocricetus auratus) | BHK | Other | Obtained from Geballelab, University of Washington | |
| Commercial assay or kit | Covaris g-TUBE | Covaris, Inc. | Catalog no: 520079 | |
| Commercial assay or kit | DIG High-Prime DNA Labeling and Detection Starter Kit II | Roche | Catalog no: 11585614910 | |
| Commercial assay or kit | Nextera XT DNA library preparation kit | Illumina | Catalog no: FC-131–1024 | |
| Commercial assay or kit | SQK-NSK007; SQK-LSK208; SQK-LSK308; SQK-RAD002 | Oxford Nanopore Technologies | Catalog no: SQK-NSK007; SQK-LSK208; SQK-LSK308; SQK-RAD002 | |
| Commercial assay or kit | FLO-MIN104; FLO-MIN106; FLO-MIN107 | Oxford Nanopore Technologies | Catalog no: FLO-MIN104; FLO-MIN106; FLO-MIN107 | |
| Chemical compound, drug | DMEM | HyClone, VWR | Catalog no: 16777–129 | |
| Chemical compound, drug | FBS | HyClone, VWR | Catalog no: 26-140-079 | |
| Chemical compound, drug | Penicillin-streptomycin | GE Life Sciences, VWR | Catalog no: 16777–164 | |
| Chemical compound, drug | SG-2000 | GE Life Sciences, VWR | Catalog no: 82024–258 | |
| Software, algorithm | GraphPad Prism | GraphPad Software | ||
| Software, algorithm | BWA-MEM | (Li, 2013) | v0.7.15 | arxiv.org/abs/1303.3997 |
| Software, algorithm | samblaster | (Faust and Hall, 2014) PMID: 24812344 | v0.1.24 | https://github.com/GregoryFaust/samblaster |
| Software, algorithm | freebayes | (Garrison and Marth, 2012) | v1.0.2–14 | arxiv.org/abs/1207.3907 |
| Software, algorithm | Metrichor | Oxford Nanopore Technologies | v2.40 | |
| Software, algorithm | Albacore | Oxford Nanopore Technologies | v1.2.4 | |
| Software, algorithm | poretools | (Loman and Quinlan, 2014) PMID: 25143291 | v0.6.0 | https://github.com/arq5x/poretools |
| Software, algorithm | Porechop | Other | v0.2.3 | https://github.com/rrwick/Porechop |
| Software, algorithm | nanopolish | (Loman et al., 2015) PMID: 26076426 | v0.8.4 | https://github.com/jts/nanopolish |
| Software, algorithm | source code | this paper | See Materials andmethods, https://github.com/tomsasani/vacv-ont-manuscript; copy archived at https://github.com/elifesciences-publications/vacv-ont-manuscript) | |
| Software, algorithm | raw sequencing data | this paper | SRP128569; SRP128573; DOI: 10.5281/zenodo.1319732 | See Materials and methods |
| Software, algorithm | raw sequencing data | (Elde et al., 2012) PMID: 22901812 | SRP013146 |
Download links
A two-part list of links to download the article, or parts of the article, in various formats.
Downloads (link to download the article as PDF)
Open citations (links to open the citations from this article in various online reference manager services)
Cite this article (links to download the citations from this article in formats compatible with various reference manager tools)
Long read sequencing reveals poxvirus evolution through rapid homogenization of gene arrays
eLife 7:e35453.
https://doi.org/10.7554/eLife.35453


