CCL2 mobilizes ALIX to facilitate Gag-p6 mediated HIV-1 virion release
- Albert Einstein College of Medicine, United States
Figures
Figure 1 with 3 supplements

Differential effects of CCL2 levels in the medium on HIV-1B and HIV-1C replication in MDMs.
(A, B) MDMs were infected with 10ng/1×106 cells each of either HIV-1BADA (panel A) or HIV-1CIndieC1 (panel B) and the cultures propagated in the presence of CCL2 (0.25 µg/ml), α-CCL2 (2.5 µg/ml) or isotype antibody (2.5 µg/ml). Mock indicates no virus added and UT refers to no CCL2 or antibodies. Data are represented as mean ± SEM (n = 3). The experiment was performed three times with MDMs from three separate donors with two replicates per experiment. Means ± SEM are plotted. (C) Media and cells were collected at day 15, virus in the supernatant was pelleted via 20% sucrose cushion. Both the cell lysate and purified virus were analyzed in a Gag-p24 Western immunoblot.
-
Figure 1—source data 1
- https://doi.org/10.7554/eLife.35546.006
Figure 1—figure supplement 1
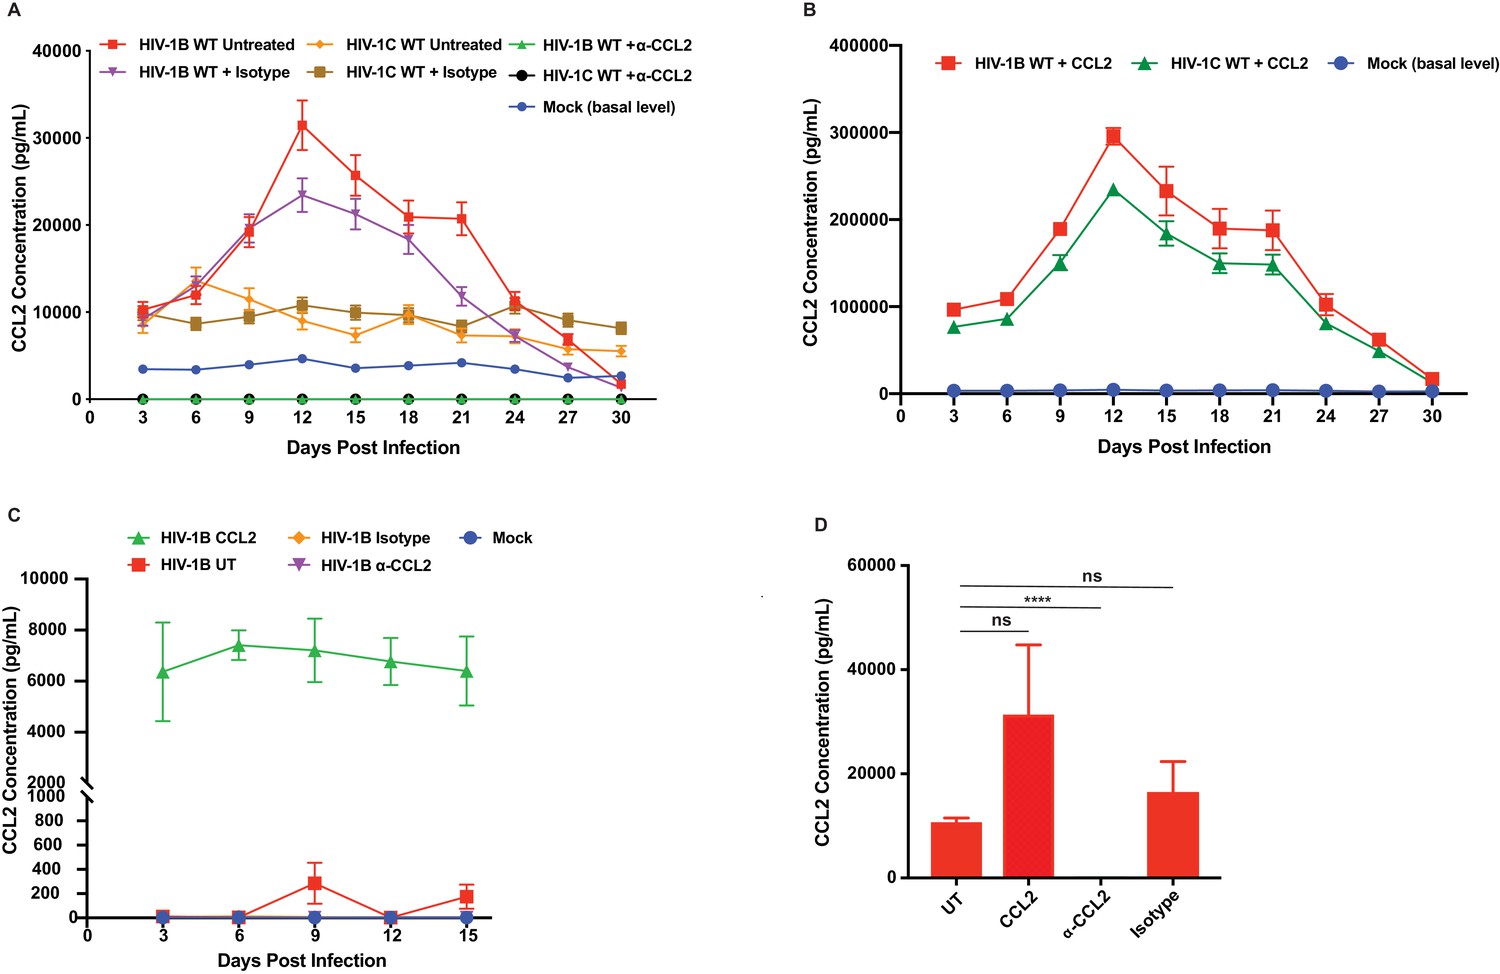
CCL2 measurement in HIV-1 infected MDM, CEM-CCR5 culture media and HeLa cells.
(A and B). CCL2 measurement in HIV-1 infected MDM culture media. Aliquots of culture media were collected during the multi-day propagation of HIV-infected MDMs depicted in Figure 3 and were assayed for CCL2 using Luminex assay. Data are represented as mean ± SEM (n = 2) – the experiment has been performed at least 3 times. (B) The CCL2 values in HIV-1B ADA and HIV-1 IndieC1 with CCL2 addition are separately plotted as these values are much higher due to added CCL2. (C) Supernatant from uninfected and HIV-1B ADA infected CEM-CCR5 cells (untreated, CCL2, α-CCL2 antibody, and isotype antibody treated cells) were assayed for CCL2 production. CCL2 was measurable only in CCL2 treated cells. Data are represented as mean ± SEM (n = 3). (D) The supernatants from HeLa cells (untreated, CCL2, α-CCL2 and isotype treatment) were assayed for CCL2 production. The untreated, CCL2 and isotype conditions showed comparable CCL2 levels and α-CCL2 antibody treatment reduced the CCL2 level to 35.8 pg/mL. Data are represented as mean ± SEM (n = 3). p value untreated vs CCL2:0.15 (ns), untreated vs isotype:0.35 (ns), untreated vs α-CCL2:<0.0001 (****).
-
Figure 1—figure supplement 1—source data 1
CCL2 values plotted in Figure 1—figure supplement 1A and B.
- https://doi.org/10.7554/eLife.35546.007
-
Figure 1—figure supplement 1—source data 2
CCL2 values plotted in Figure 1—figure supplement 1C.
- https://doi.org/10.7554/eLife.35546.008
-
Figure 1—figure supplement 1—source data 3
CCL2 values plotted in Figure 1—figure supplement 1D.
- https://doi.org/10.7554/eLife.35546.009
Figure 1—figure supplement 2
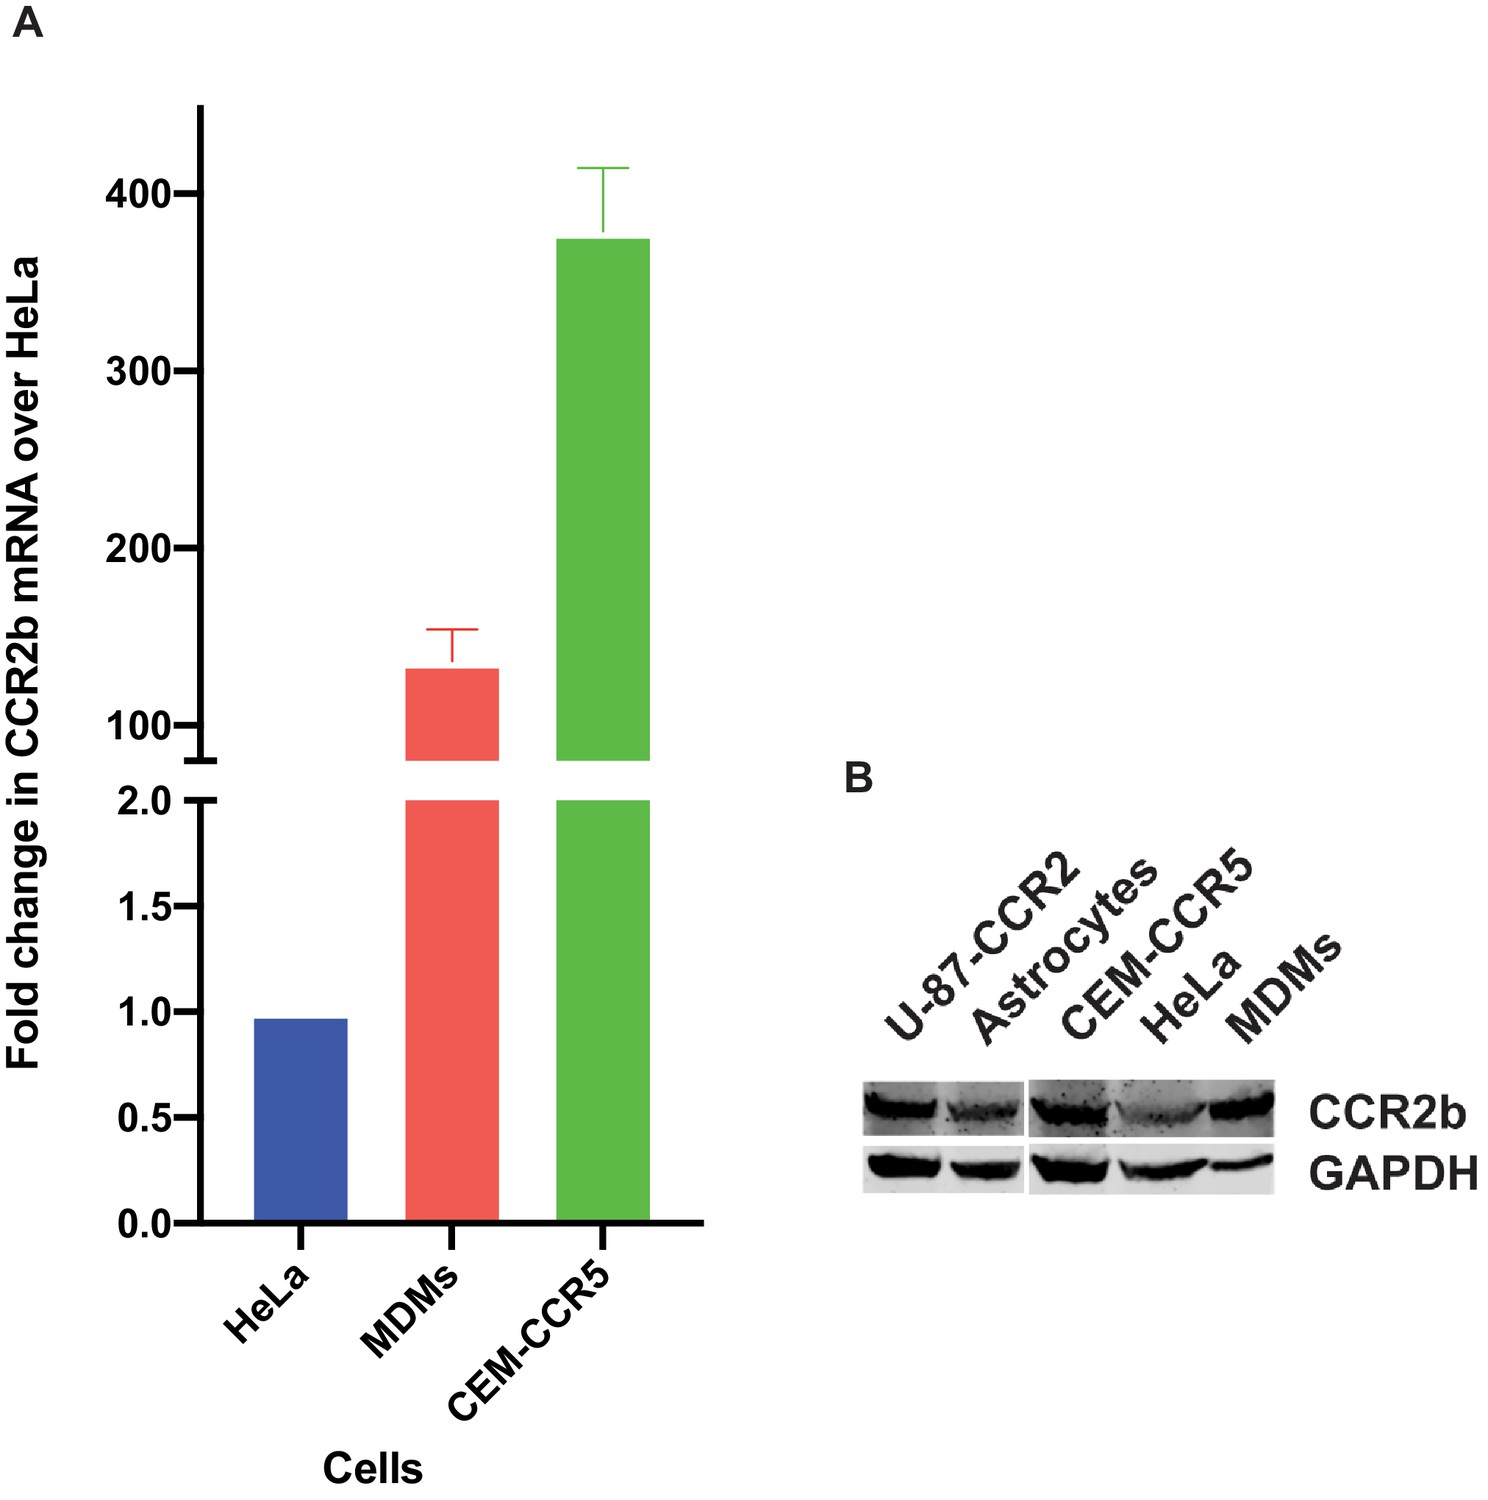
Assessing expression levels of CCR2b mRNA and protein in cells employed in this study.
(A) RNA was extracted from MDMs, CEM-CCR5 and HeLa cells. The amplification and Ct values were analyzed using QuantStudio Real-Time PCR software v1.3. (B) U87-CCR2 cells, primary astrocytes, CEM-CCR5, HeLa cells and macrophages were probed for total CCR2 expression through immnoblotting. Immunoblot was developed using Licor Odyssey fc and Imagestudio software.
-
Figure 1—figure supplement 2—source data 4
Fold change in CCR2b mRNA plotted in Figure 1—figure supplement 2A.
- https://doi.org/10.7554/eLife.35546.010
Figure 1—figure supplement 3

Inhibition of virus replication by α-CCL2 can be reversed by exogenous CCL2.
HIV-1B ADA infected macrophages were treated with CCL2, α-CCL2 or Isotype antibody for 24 days. Samples labeled HIV-1B α-CCL2_CCL2 were first treated with α-CCL2 for 9 days, cells washed α- CCL2 replaced with CCL2 until day 24. Media were collected every 3 days and replenished with fresh media. The p24 levels are shown as mean ± SEM of 2 experiments. The results show that CCL2 addition can reverse the effects of CCL2 immuno-depletion.
-
Figure 1—figure supplement 3—source data 5
All the p24 values plotted in Figure 1—figure supplement 3.
- https://doi.org/10.7554/eLife.35546.011
Figure 2
Differential CCL2-responsiveness of HIV-1B and HIV-1C is also observed in a T cell line albeit to a lower degree.
(A, B) CEM-CCR5 cells were infected with 10ng p24/ 1×10⁶ cells input of either HIV-1BADA (panel A) or HIV-1CIndiec1 (panel B) and the culture was propagated in the presence of no additional treatment (UT) , CCL2 (0.25 µg/ml), α-CCL2 (2.5 µg/ml) or isotype antibody (2.5 µg/ml). Mock indicates no virus added and UT refers to no CCL2 or antibodies. Data are represented as mean ± SEM (n = 3). The experiment was performed three times.
-
Figure 2—source data 1
- https://doi.org/10.7554/eLife.35546.013
Figure 3
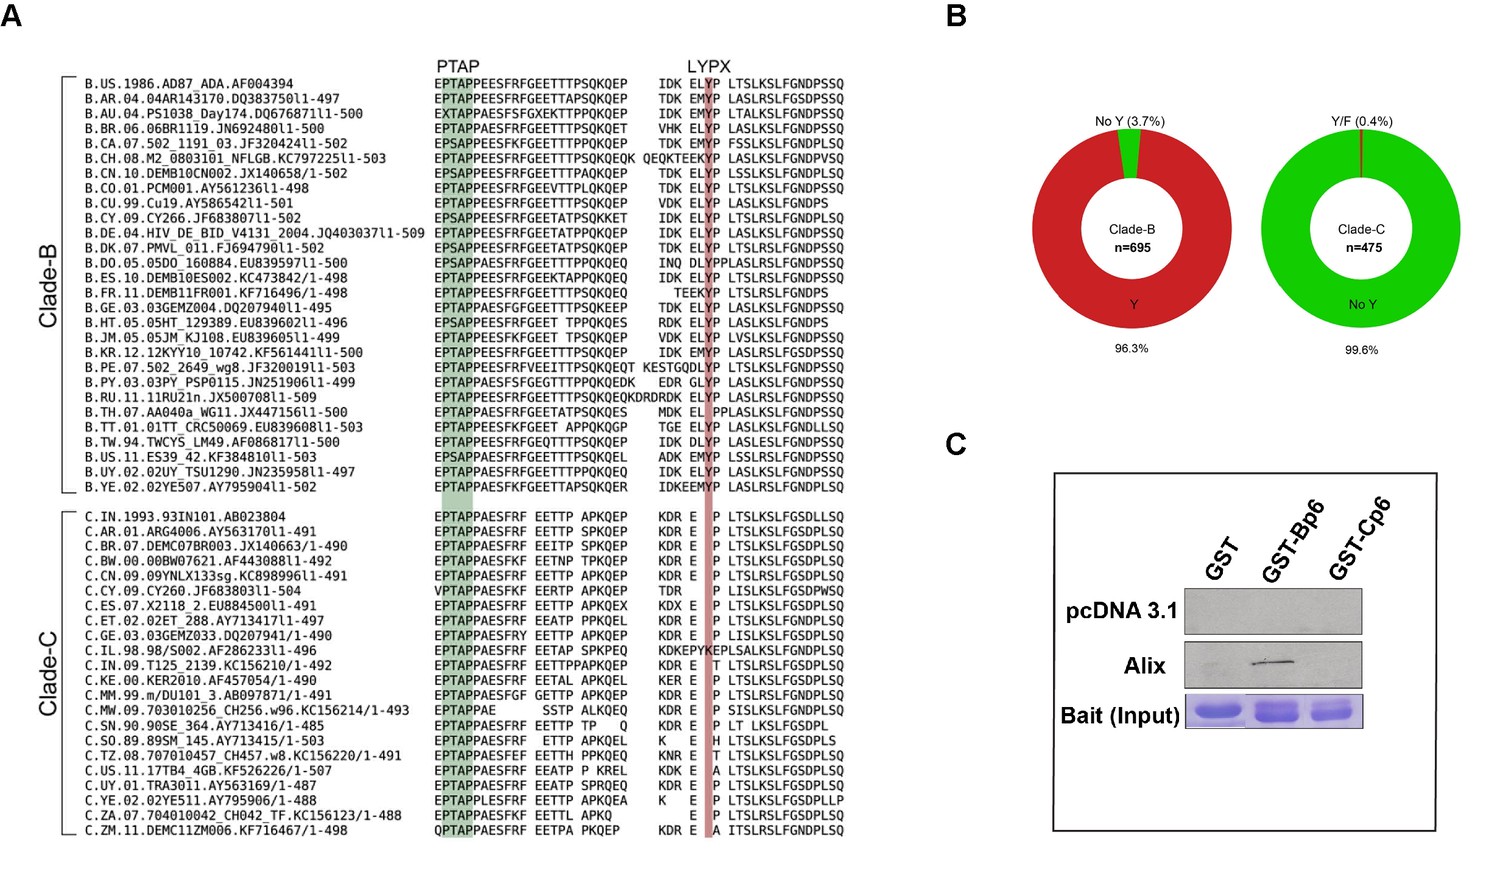
Sequence alignment of HIV-1B and HIV-1C Gag-p6 proteins, and Gag p6-ALIX interaction.
(A) Representative HIV-1 Gag p6 sequences from either HIV-1B or HIV-1C isolates that are prevalent in different geographic regions were selected from the Los Alamos database and aligned using Clustal-X. As shown, HIV-1B Gag-p6 retains both the late domains (PTAP and LYPXnL), whereas HIV-1C Gag p6 sequences have a LY deletion. (B) The pie charts represent the frequencies of clade B (left) or clade C (right) sequences with or without the residue Y (of the LYPX motif) in Gag-p6. Clade-B sequences containing the Y residue are shown in red, the remaining sequences have been combined and shown in green. The frequencies of residues replacing Y are 1.6% (H), 0.9% (none), 0.4% (C), 0.3% (F), 0.3% (S), 0.1% (N) and 0.1% (P) respectively. Clade-C sequences without a Y (LY deletion) are shown in green and the 0.2% of the sequences that retain the Y residue or the 0.2% sequences that contain an F residue are combined and shown in red. The total number of sequences examined in Clade-B or Clade-C are 695 and 475, respectively, after removing redundancy at 95%. (C) Employing lysates of Hela cells transfected with either empty vector (pcDNA 3.1) or ALIX-expressing pcDNA construct, pull-downs were performed using GST by itself or GST fused to either HIV-1B-p6 or HIV-1C-p6. GST-B-p6 binds to ALIX, whereas GST-C-p6 does not, due to absence of LY in the HIV-1C Gag p6.
-
Figure 3—source data 1
HIV-1 clade C sequences used in the analysis in Figure 3B.
- https://doi.org/10.7554/eLife.35546.015
-
Figure 3—source data 2
HIV-1 clade B sequences used in the analysis in Figure 3B.
- https://doi.org/10.7554/eLife.35546.016
-
Figure 3—source data 3
Sequences that were aligned in Figure 3A.
- https://doi.org/10.7554/eLife.35546.017
Figure 4 with 2 supplements
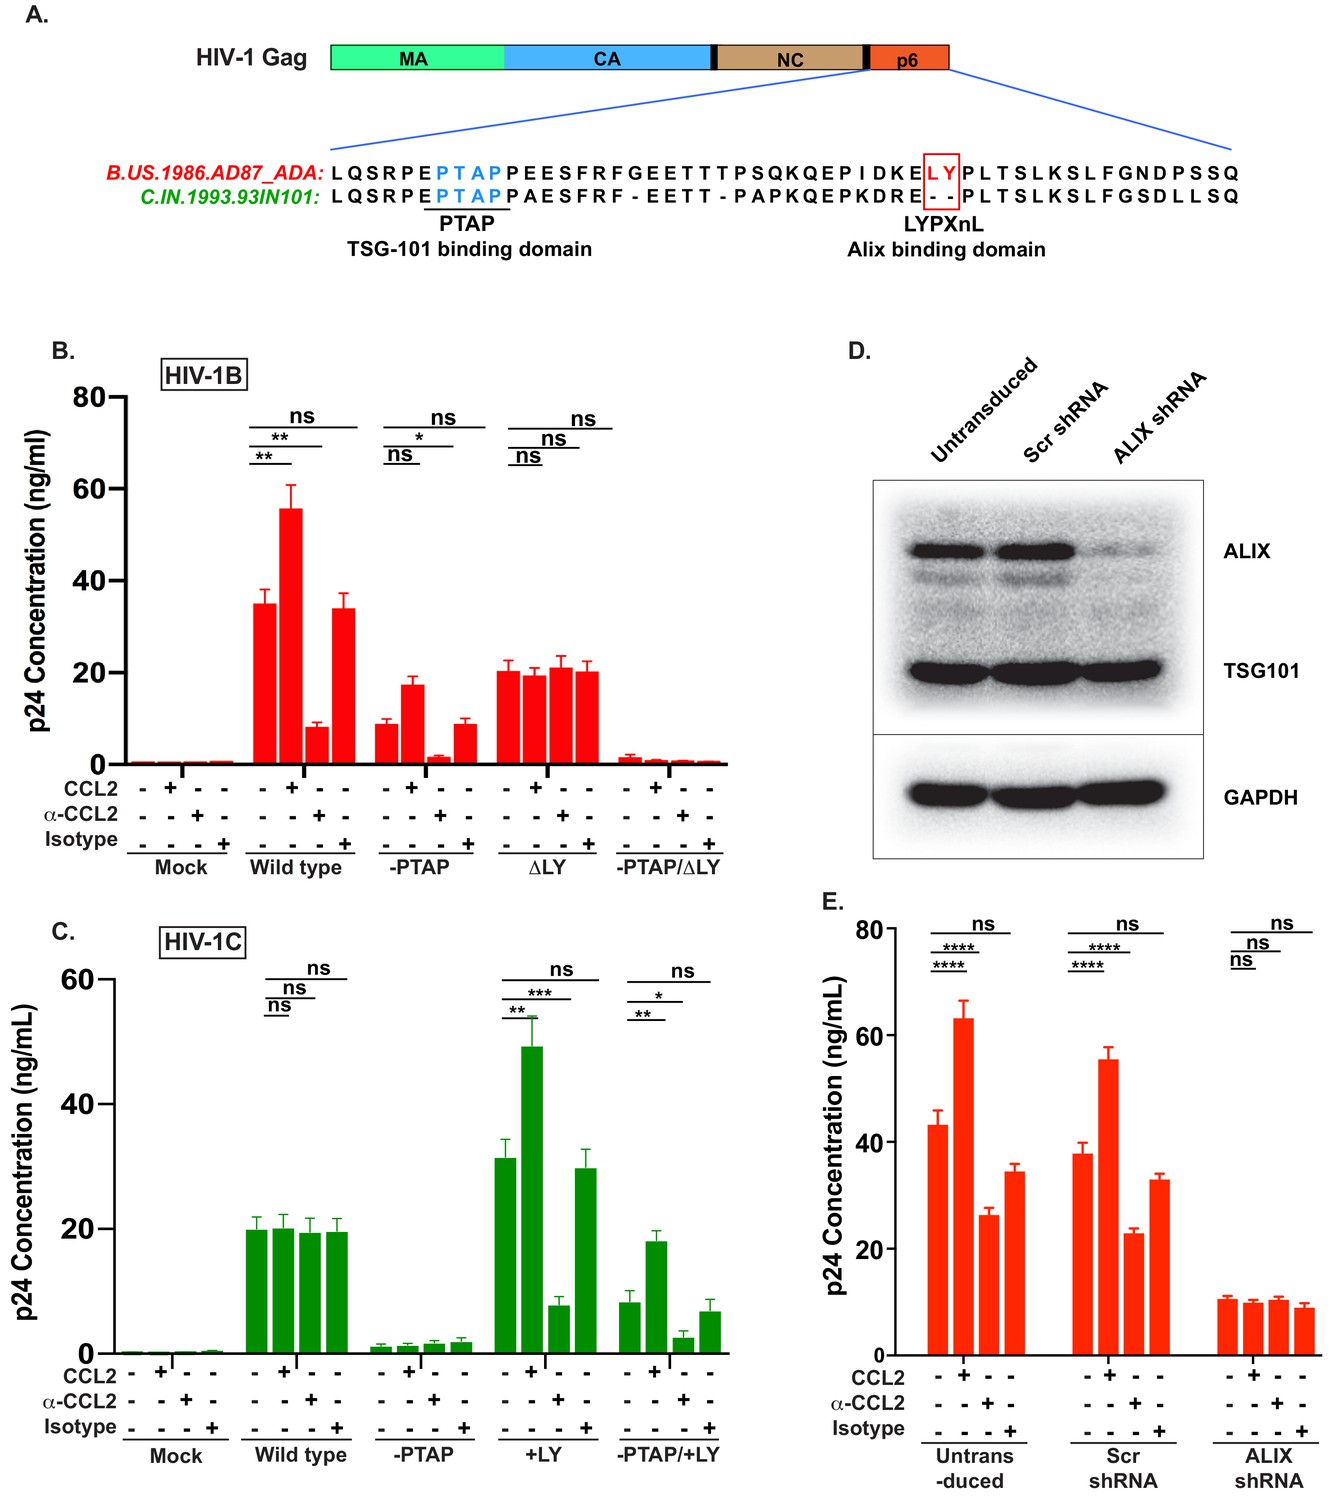
CCL2-mediated changes in virus production requires the presence of Gag-p6 LYPX motif in the virus and ALIX in target cells.
(A) Alignment of Gag-p6 amino acid sequences from the two viruses employed in this study - HIV-1BADA and HIV-1CIndieC1. HIV-1BADA has both late motifs (PTAP and LYPX) while HIV-1CIndieC1 lacks the LY dipeptide in LYPX motif. (B, C) Modulation of virus production by CCL2 levels in the media of HeLa cells transfected with HIV-1BADA (panel B) or HIV-1CIndieC1 (panel C) molecular clones or their late domain mutant versions. (B) Shows results of transfecting HIV-1BADA or its -PTAP, ΔLY or –PTAP/ΔLY variants and (C) Shows HIV-1CIndieC1 or its –PTAP, +LY or –PTAP/+LY variants. For each virus, p24 production 24 hr post transfection is plotted including with no treatment, in the presence of CCL2 (0.25 µg/ml), α-CCL2 antibody (2.5 µg/ml) or Isotype antibody (2.5 µg/mL). Data are represented as mean ± SEM (n = 4). The experiment was performed four times with two replicates in each experiment. (D) CEM-CCR5 cells were transduced with lentiviral vectors carrying either a control scrambled shRNA or an ALIX shRNA 29394 expression cassette. Western blot analysis of lysates of untransduced CEM-CCR5 cells or transduced with either the scrambled shRNA or the ALIX shRNA is shown. The bottom panel shows GAPDH protein as a loading control. (E) CEM-CCR5 cells with ALIX knocked-down were infected with HIV-1BADA, either in the presence of CCL2, α-CCL2 or Isotype antibody followed by measurement of virus replication at 12 days post-infection. The results show that CCL2-responsiveness of HIV-1BADA is dependent on ALIX expression. The experiment was performed three times and the mean ± SEM are plotted.
-
Figure 4—source data 1
All p24 values plotted in Figure 4B and 4C.
- https://doi.org/10.7554/eLife.35546.021
-
Figure 4—source data 2
All p24 values plotted in Figure 4E.
- https://doi.org/10.7554/eLife.35546.022
Figure 4—figure supplement 1
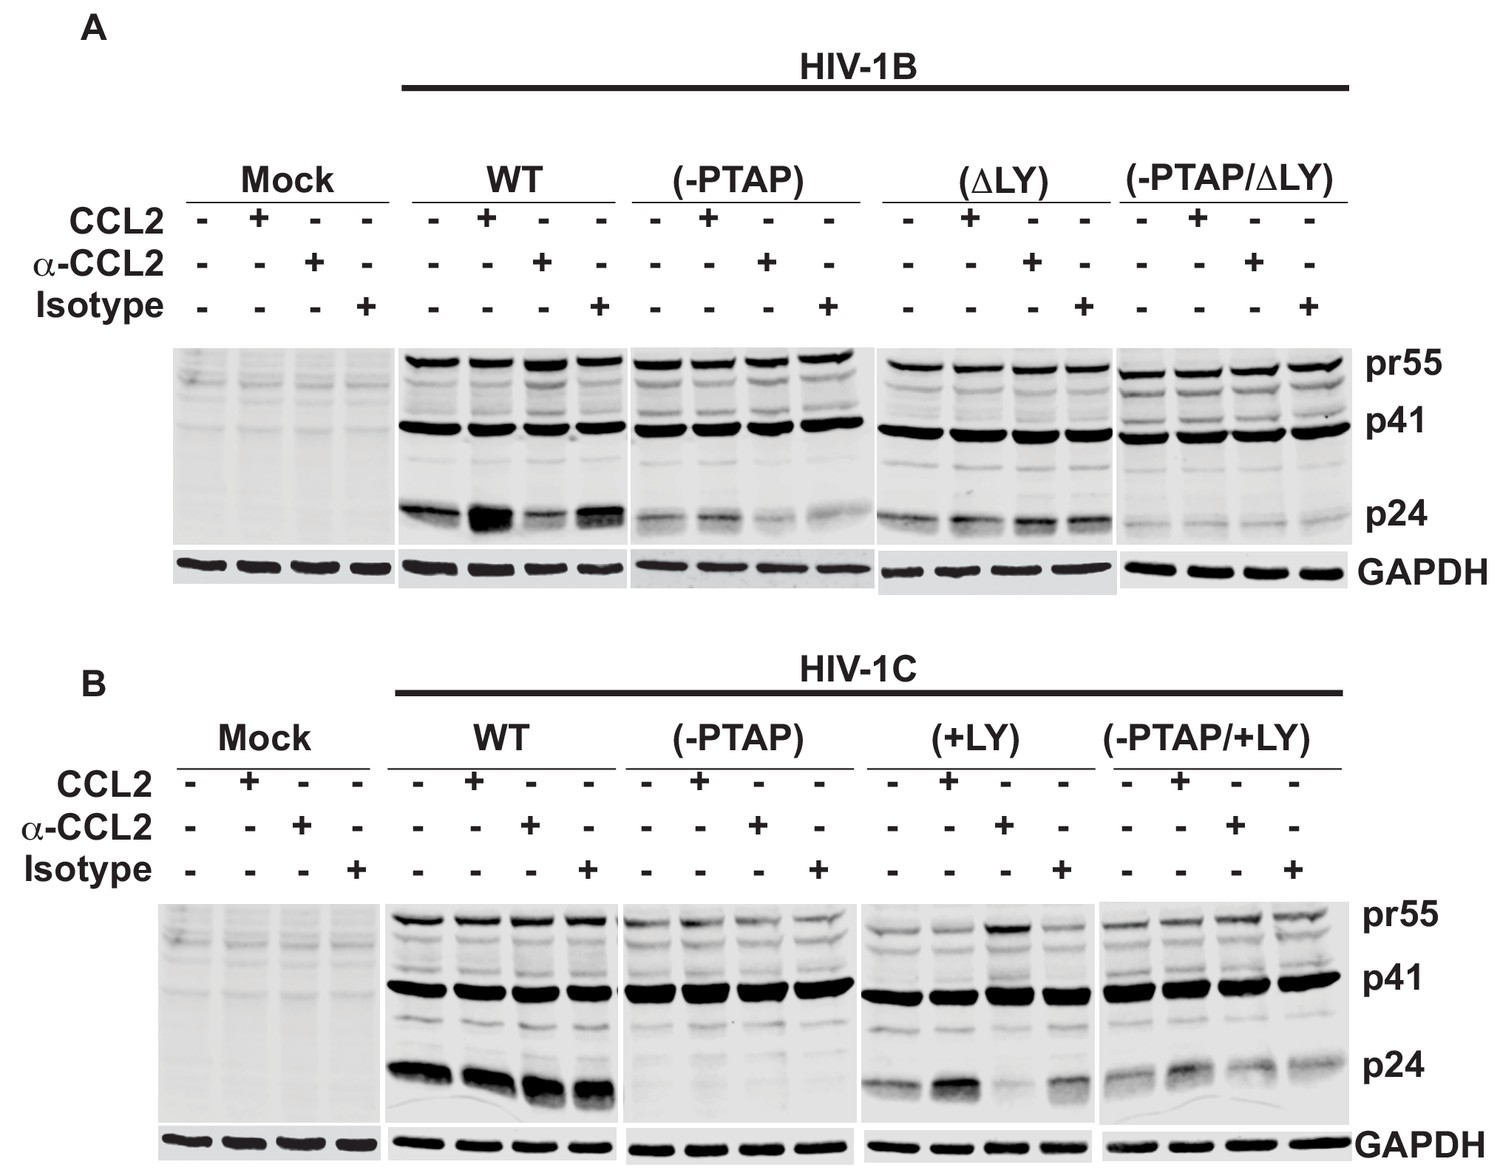
Western blot to measure intracellular capsid protein levels.
HeLa cells transfected with HIV-1B and HIV-1C wildtype and L domain mutants molecular clones were treated with one of the following: 1X PBS, CCL2, -CCL2 and Isotype antibody. Cell lysates were subjected to immunoblotting analysis with anti-p24 and -GAPDH antibodies. The results indicate that a decrease in extracellular p24 was associated with a corresponding increase in the intracellular Gag levels that in viruses with LYPX motif.
Figure 4—figure supplement 2
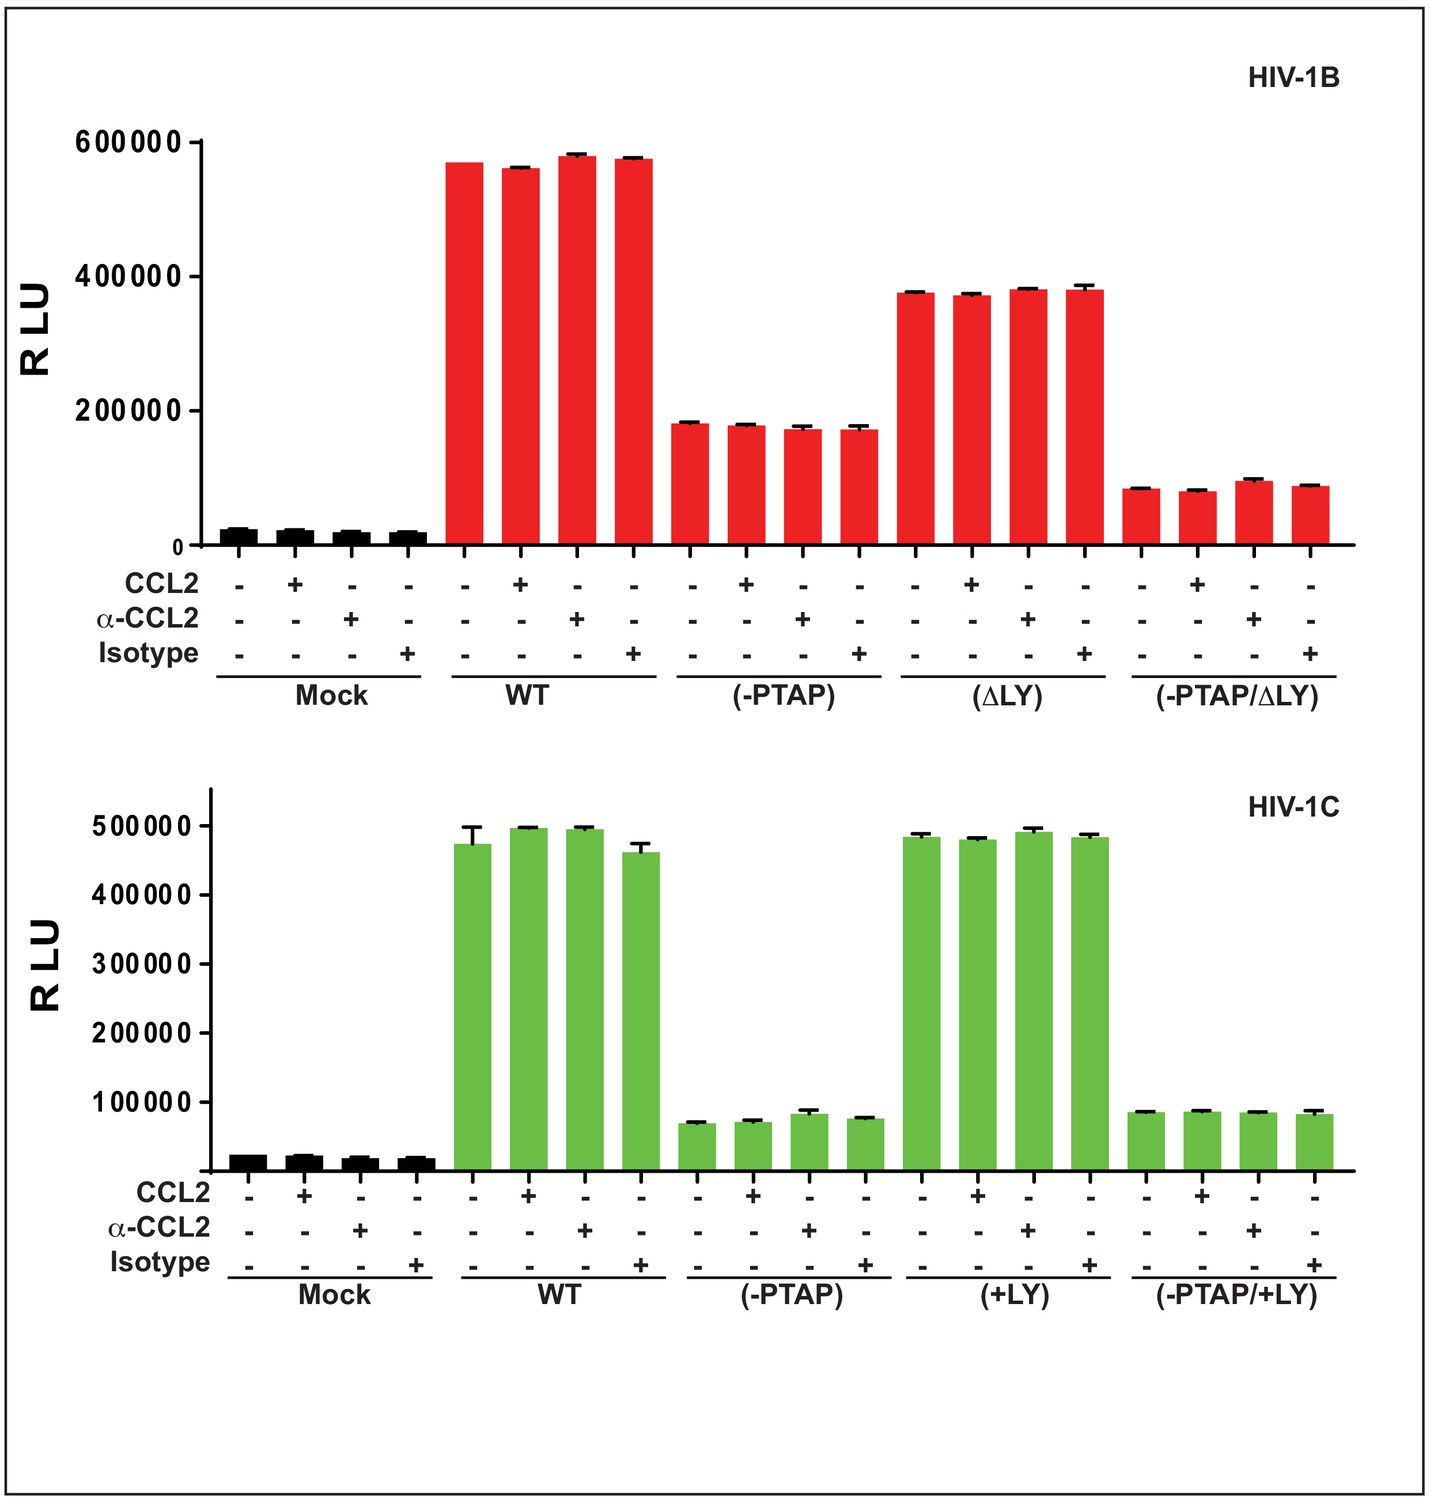
Effect of CCL2 levels on the infectivity of HIV-1B, HIV-1C and L-domain mutant viruses.
TZMbL cells were infected with equal p24 input (10ng per 1x10 6 cells) for 24 h. Infected cells were collected and lysed as before. Luciferase activity was measured to determine the infectivity of the virus to ascertain the effect of CCL2 levels on virus infectivity. Data are represented as mean ± SEM (n = 3) and show a lack of effect of CCL2 on infectivity.
-
Figure 4—figure supplement 2—source data 1
Relative ight units (from Luciferase assays) plotted in Figure 4—figure supplement 2.
- https://cdn.elifesciences.org/articles/35546/elife-35546-fig4-figsupp2-data1-v2.xlsx
Figure 5
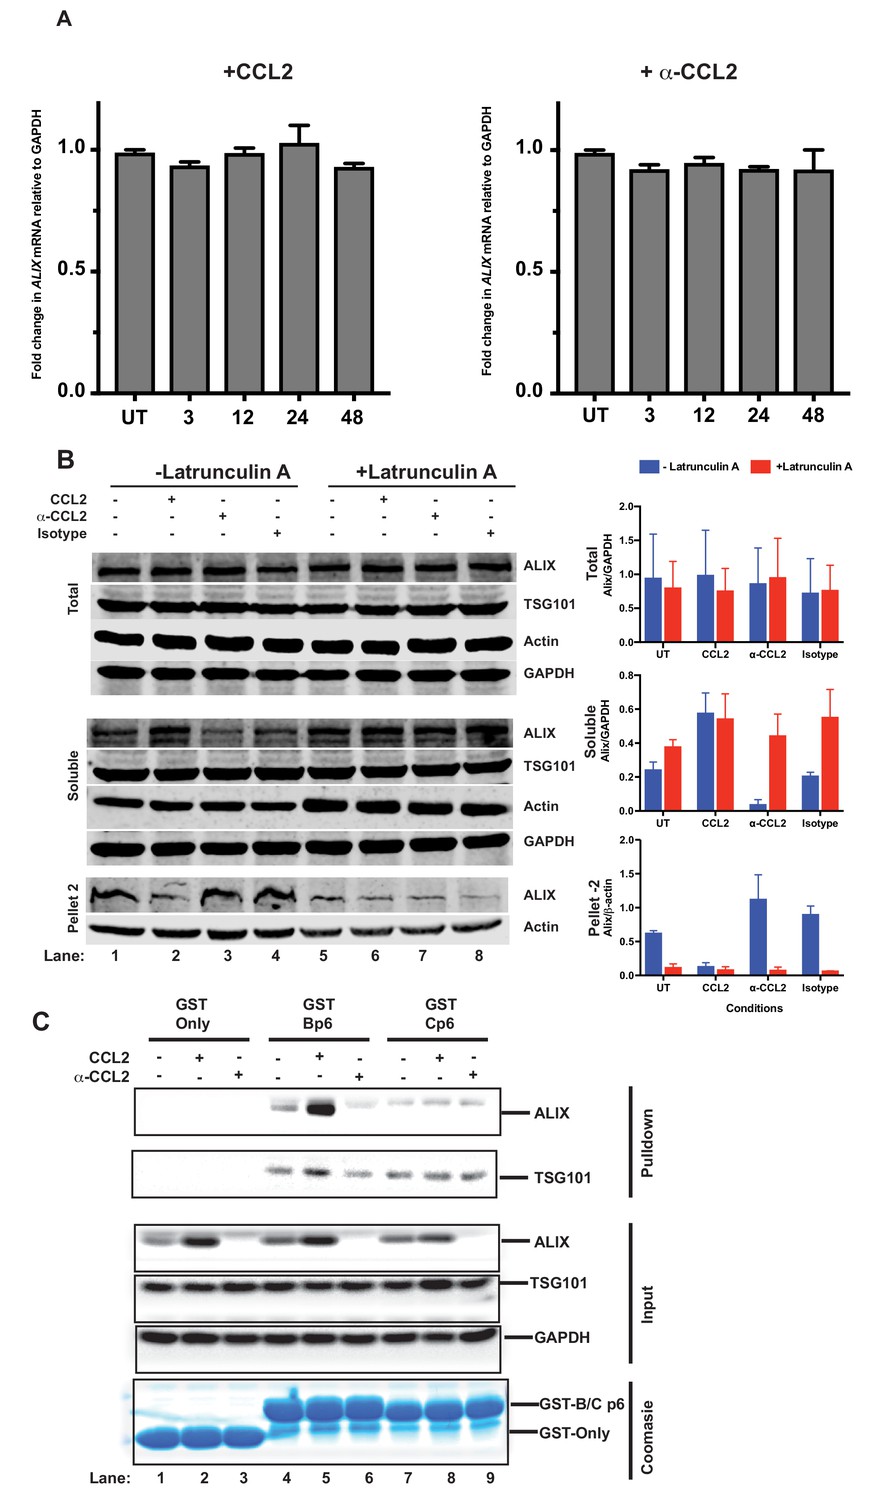
CCL2 does not impact ALIX mRNA levels but increases soluble ALIX and facilitates Gag-p6 binding.
(A) Effect of CCL2 levels on ALIX mRNA levels. Total RNA from HeLa cells treated with CCL2 (0.25 µg/ml) or α-CCL2 (2.5 µg/ml) was extracted, reverse transcribed and the cDNAs employed in real-time polymerase chain reactions. Data are represented as mean ± SEM (n = 3). The experiment was performed three times. (B) Immunoblots showing ALIX levels in the total, soluble and insoluble fractions of HeLa cells. Total ALIX protein levels in untreated (UT), CCL2 treated or α-CCL2-treated HeLa cells are similar (Top panel). However, upon CCL2 treatment, most of the ALIX is in the soluble phase while α-CCL2 treatment shows the reverse (middle panel) ALIX levels in pellet II (which constitutes uncross-linked actin - see Materials and methods) represent the converse of what is seen in the soluble fraction (bottom Panels). Two identically treated batches of cells were used, but with or without Latrunculin treatment. ALIX band intensities are quantified, normalized for GAPDH (Total and Soluble) or Actin (Pellet 2) and plotted to the right of the immunoblot. The experiment has been performed three times. (C) CCL2 treatment facilitates Gag-p6-ALIX interaction. GST protein, either by itself or fused to HIV-1B-p6 or HIV-1C-p6 proteins, were expressed in E. coli and purified using Glutathione agarose beads, and incubated with HeLa cell lysates that were either untreated, treated with CCL2 or with α-CCL2 for 24 hr followed by pull-down experiments (two top panels). The input control panels show that the quantities of all proteins (GST and its p6 fusions, ALIX, TSG101 and GAPDH) in the cell lysates from all treatments were comparable within each set – except ALIX, which appears to be absent upon α-CCL2 treatment (three middle panels). The bottom panel shows that the levels of GST bait proteins used were also at equivalent levels. The experiment was performed three times.
-
Figure 5—source data 1
The mRNA fold change values for Figure 5A.
- https://doi.org/10.7554/eLife.35546.025
-
Figure 5—source data 2
Densitometric intensity values for ALIX bands in Figure 5B.
- https://doi.org/10.7554/eLife.35546.026
Figure 6
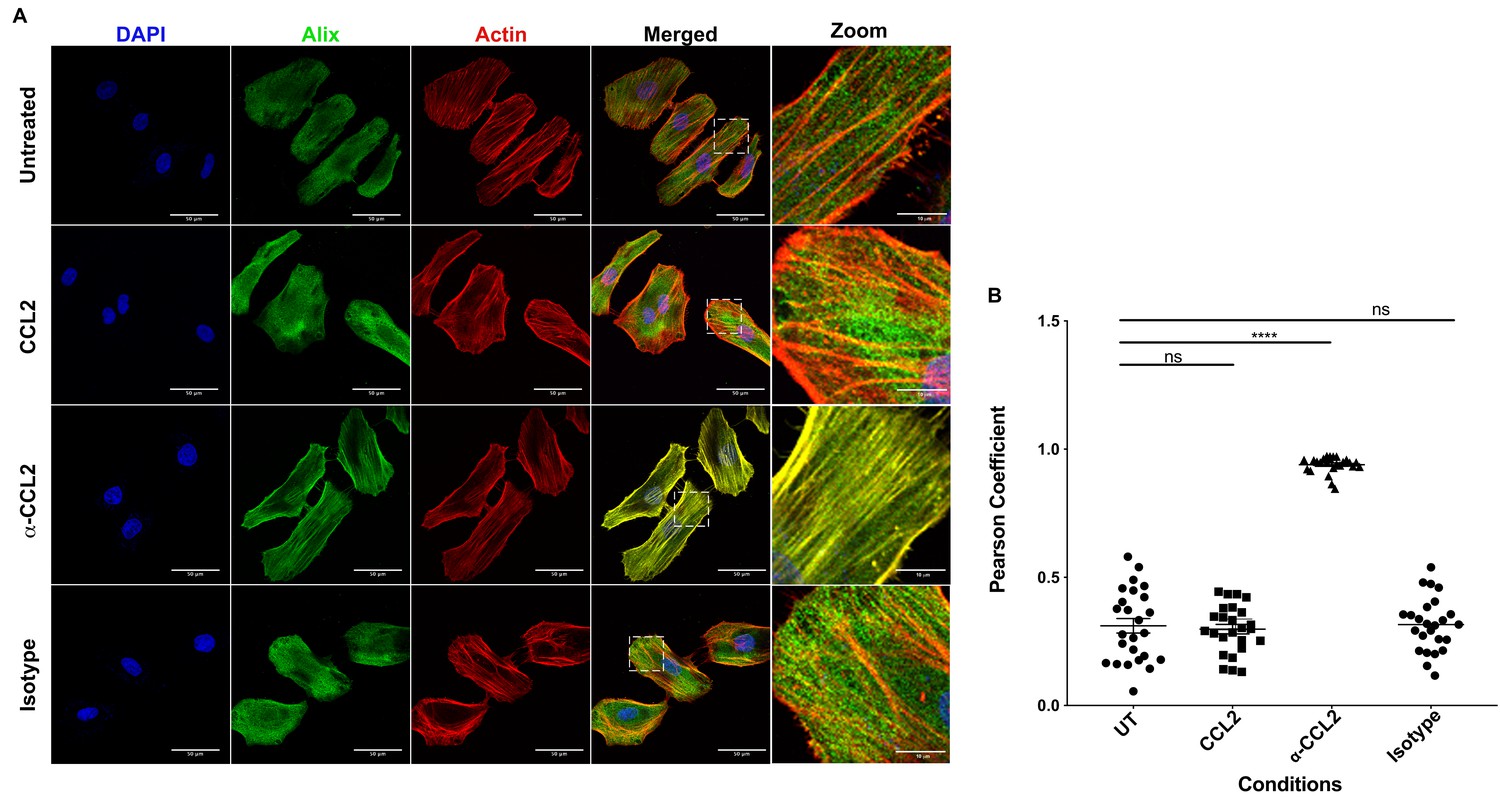
CCL2 triggers intracellular redistribution of ALIX in HeLa cells.
(A) Confocal microscopy to visualize ALIX in HeLa cells. Cells treated with nothing (Untreated), CCL2, α-CCL2 or Isotype antibody for 4 hr were stained for ALIX, F-actin and DAPI to determine the cellular localization of ALIX upon modulating CCL2 levels. Fluorescence micrographs show that upon CCL2 depletion (α-CCL2 panels), ALIX is dramatically redistributed from the cytoplasm to F-actin stress fibers, while in the presence of CCL2 (both Untreated and CCL2-treated), ALIX is more diffuse throughout the cytoplasm and near the plasma membrane. A small portion of the merged panels was amplified 5.21X to show that the signals colocalize only in α-CCL2-treated cells (B) To quantify the degree of colocalization of ALIX and F-actin signals under conditions of CCL2 addition and depletion, we calculated the Pearsoncorrelation coefficients between the two fluorophores. For HeLa cells, the data plotted indicates the close proximity of F-actin and ALIX upon CCL2 depletion, while in the presence of CCL2 (untreated and CCL2) ALIX and F-actin signals are distinct from each other. Data are represented as mean ± SEM (n = 50 cells each for HeLa cells).
-
Figure 6—source data 1
Pearson coefficient values plotted in Figure 6B.
- https://doi.org/10.7554/eLife.35546.028
Figure 7

CCL2 triggers intracellular redistribution of ALIX in macrophages.
(A) MDM cells treated similarly as in Figure 6, were stained as described above. Fluorescence micrographs show that upon CCL2 depletion, ALIX is redistributed from the cytoplasm to the F-actin structures (podosomes), while in the presence of CCL2 (Untreated and CCL2+) ALIX is diffuse (present as smaller puncta than podosomes) throughout the cytoplasm and near the plasma membrane. (B) To quantify the degree of colocalization of ALIX and F-actin under conditions of CCL2 addition and depletion, we calculated the Pearson correlation coefficient between the two fluorophores. For MDMs, the data plotted indicates the close proximity of F-actin and ALIX upon CCL2 depletion, while in the presence of CCL2 (untreated and CCL2) ALIX signal is distinct from that of F-actin. Data are represented as mean ± SEM (n = 100 cells each for MDMs).
-
Figure 7—source data 1
Pearson coefficient values plotted in Figure 7B.
- https://doi.org/10.7554/eLife.35546.030
Figure 8
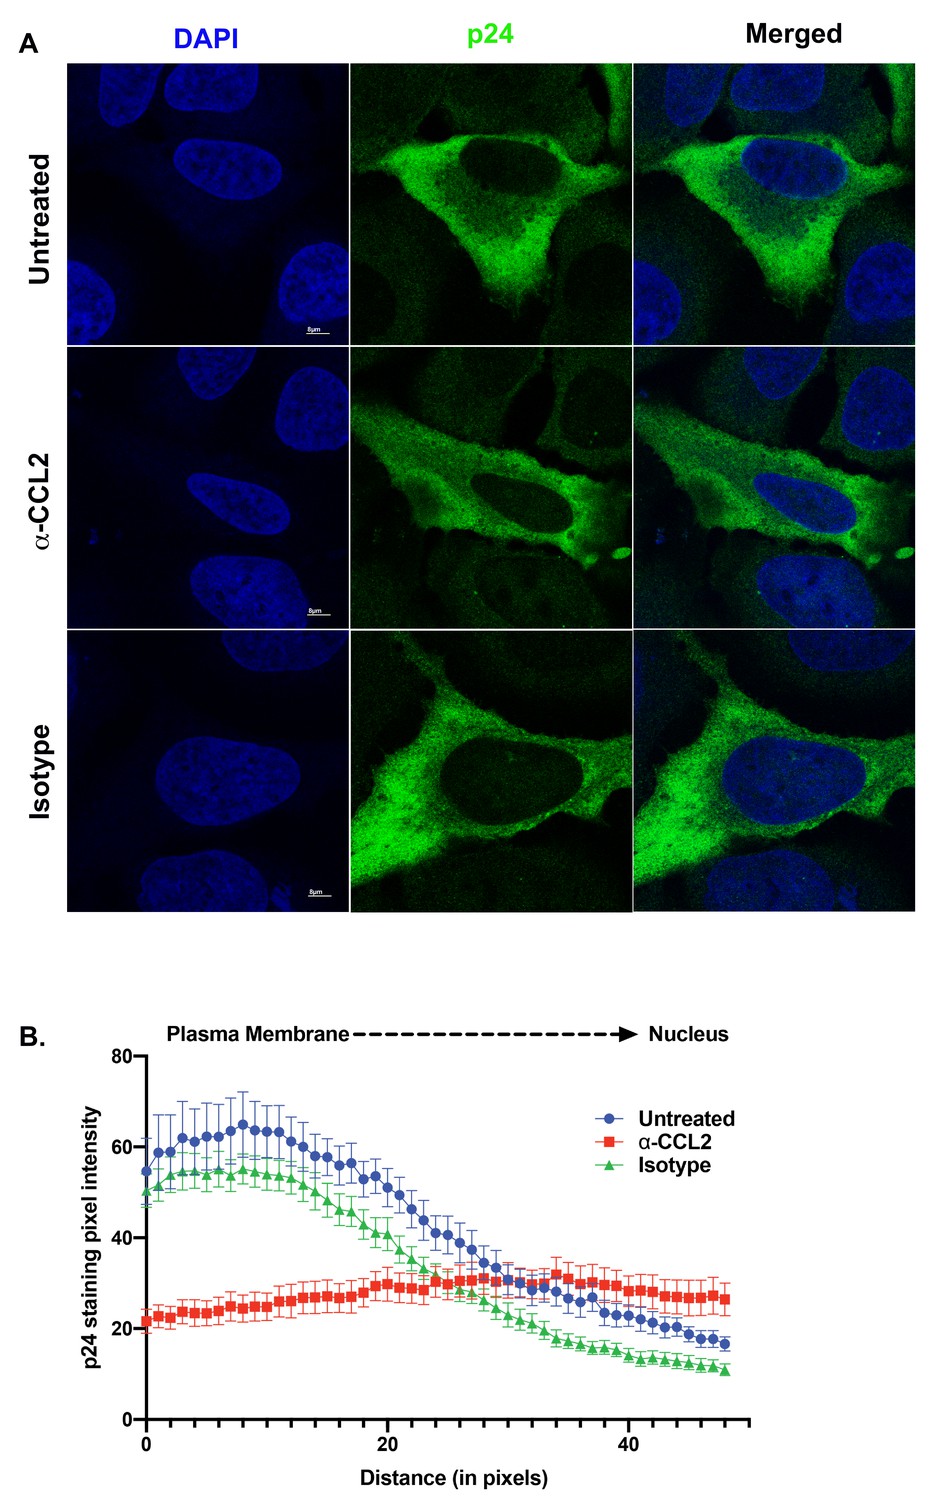
ALIX sequestration to actin cytoskeleton alters Gag trafficking.
(A) Confocal microscopy to visualize HIV-1 p24 in HeLa cells transfected with HIV-1BADA molecular clone. Cells were treated with 1X PBS, α-CCL2 or Isotype antibody for 24 hr were stained for p24, and DAPI to determine the cellular distribution of p24 upon modulating CCL2 levels. Fluorescence micrographs show that upon CCL2 depletion (α-CCL2 panels), p24 signal is diffused evenly throughout the cytoplasm, while in the untreated and Isotype antibody treated cells, p24 appears to be concentrated near the plasma membrane. (B) To quantify the distribution of p24, we quantified p24 pixel intensities starting from plasma membrane to nucleus. Data are represented as mean ± SEM (n = 13) cells.
-
Figure 8—source data 1
Pixel intensity values of p24 staining plotted in Figure 8B.
- https://doi.org/10.7554/eLife.35546.032
Figure 9
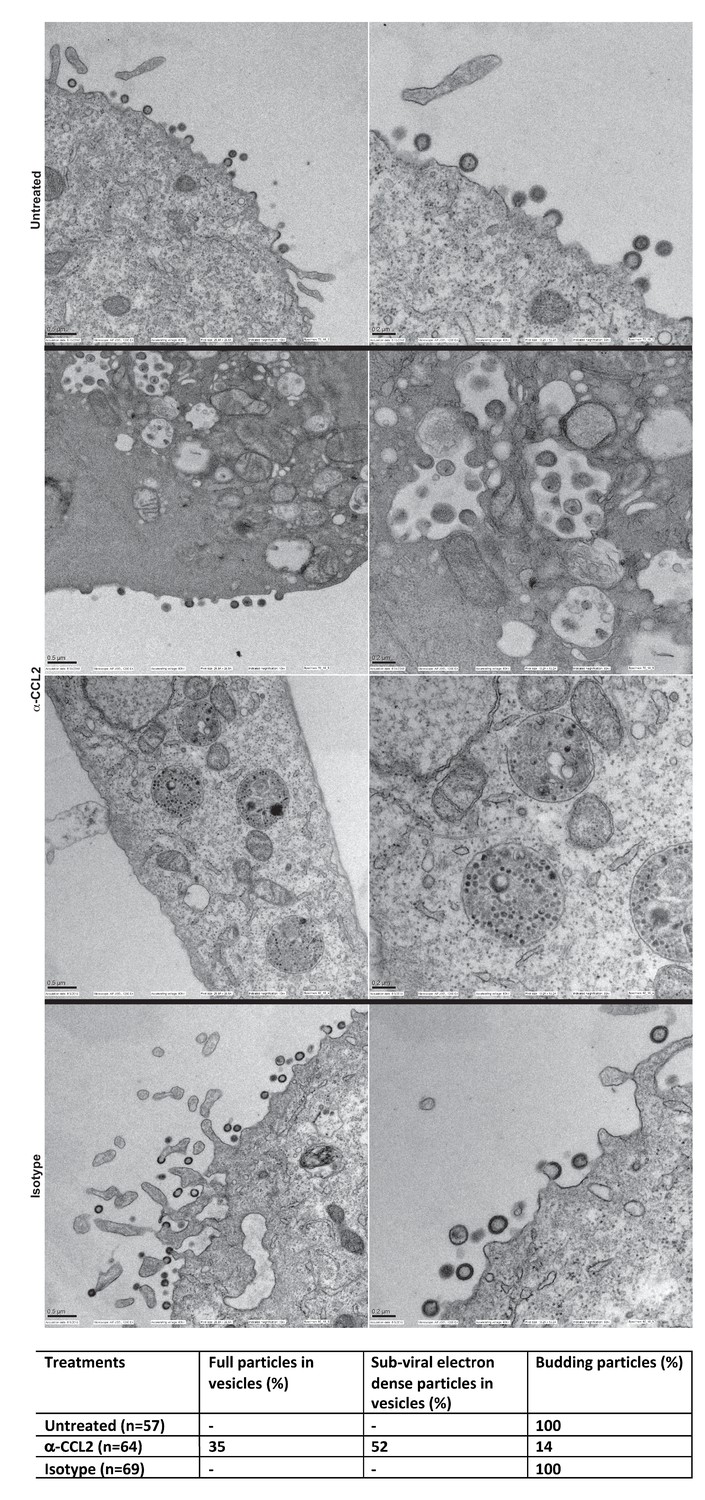
Intracellular compartments of HIV-1 assembly are observed when ALIX is sequestered to actin.
(A) Electron micrographs to detect HIV-1 budding particles from HeLa cells producing HIV-1B virus particles. HeLa cells tranfected with HIV-1BADA molecular clone DNA were treated with: nothing (Untreated), α-CCL2 (2.5 μg/mL) or isotype antibody (2.5 μg/mL) for 24 hr post-transfection. The cells were fixed and processed for scanning electron microscopy and imaged at 15,000x, 20,000x and 30,000x magnification. (B) The types of virion budding observed was analyzed from 57 (Untreated), 64 (α-CCL2-treated) or 69 (Isotype antibody-treated) cells and the results tabulated. Anti-CCL2 treated cell images collected show low level budding at the cell surface, but display more robust intracellular HIV-1 particle and sub-viral particles in cytoplasmic vacuoles.
Figure 10

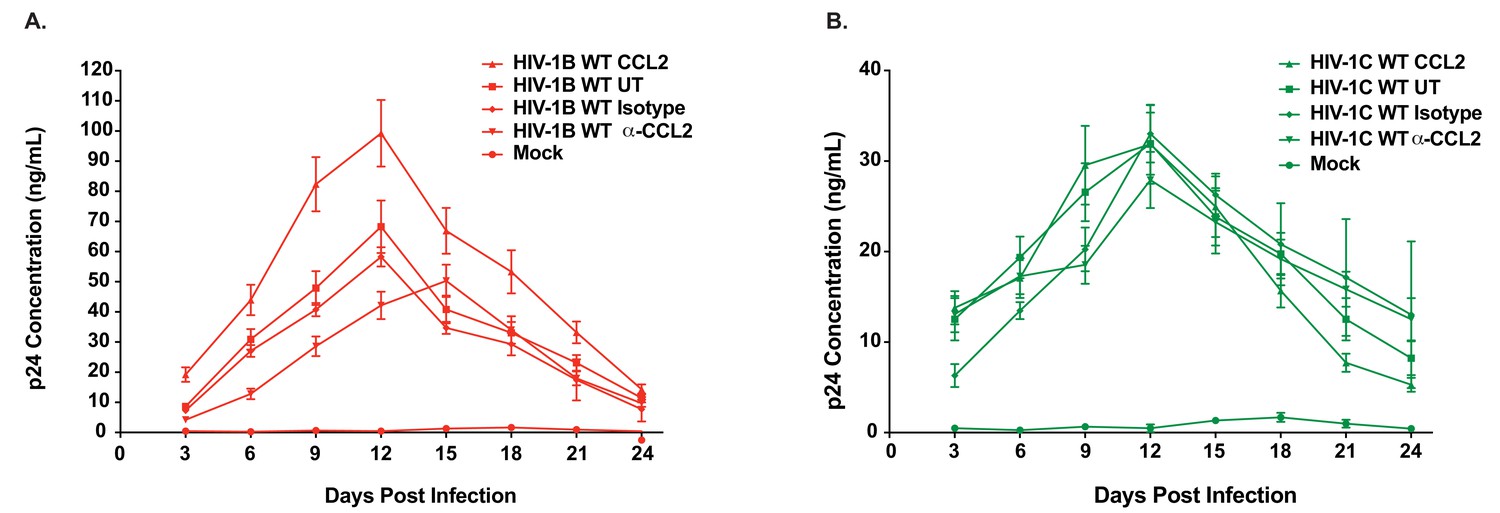
Effect of restoring the LYPX motif on HIV-1C replication.
Activated PBMCs (Panel A) or MDMs (Panel B) were infected with equal inputs of HIV-1BADA, HIV-1CIndieC1 and HIV-1CIndieC1+LY viruses. Aliquots of media were collected every 3 days until day 30 and the p24 levels were determined (PBMCs, n = 2 and macrophage, n = 3). Data are represented as mean ± SEM. Results indicate increased replication capacity of LYPX-containing viruses.
-
Figure 10—source data 1
All p24 values plotted in Figure 10A.
- https://doi.org/10.7554/eLife.35546.035
-
Figure 10—source data 2
All p24 values plotted in Figure 10B.
- https://doi.org/10.7554/eLife.35546.036
Figure 11
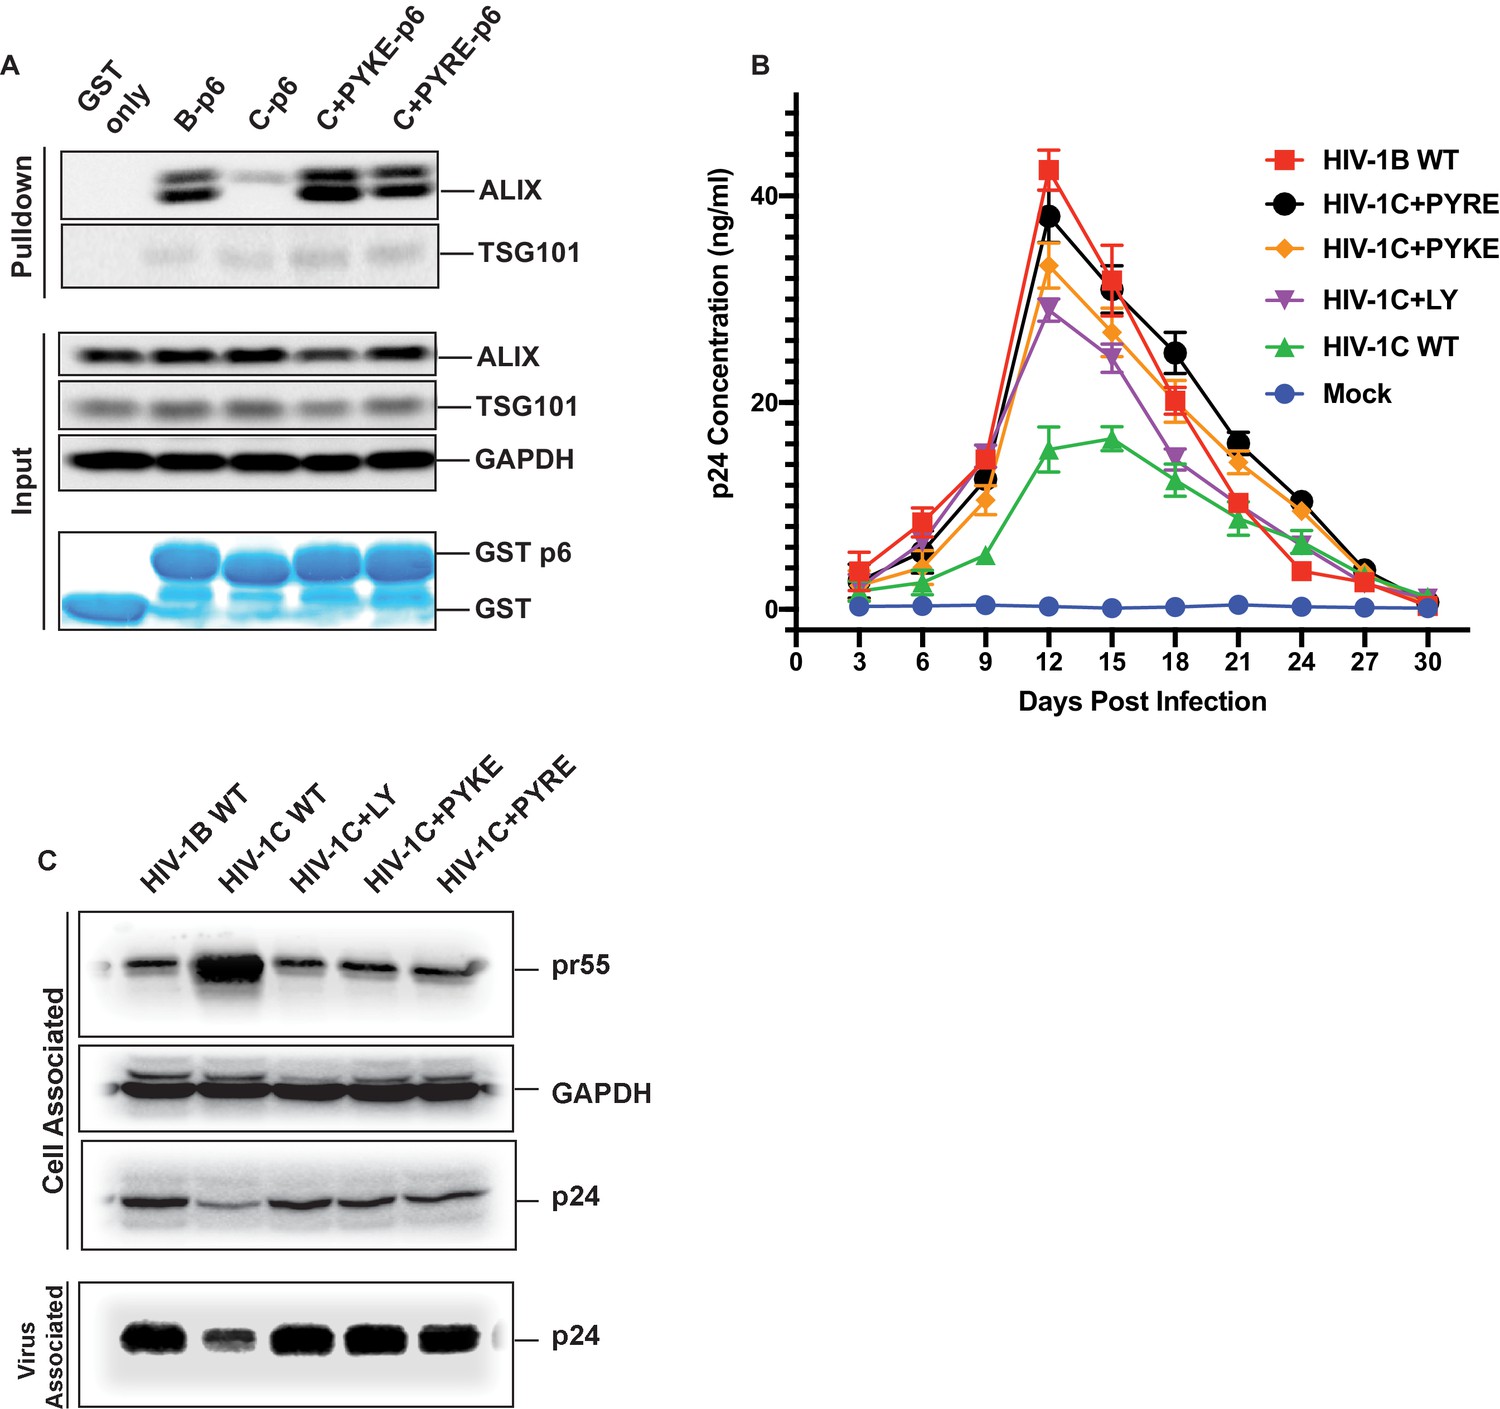
PYxE insertions restore ALIX binding to Gag-p6 and enhance replication capacity due to improved virion release.
(A) PYxE insertions restore ALIX binding to HIV-1C Gag-p6. GST protein, either by itself or fused to HIV-1B-p6, HIV-1C-p6, HIV-1C+PYxE-p6 were expressed and purified from E. coli using Glutathione agarose beads, and incubated with HeLa cell lysates. Pull-downs of the protein complexes were resolved on SDS-PAGE gels and the western immunoblots probed for ALIX and TSG101 (top panel). Input levels of ALIX, TSG101 as well as the GAPDH control are in the middle panels and purified GST-only and GST-p6 fusion inputs are in lower panels. The experiment was performed three times. (B) The effect of PYxE insertion on virus replication fitness. MDMs were infected with equal p24 and media were collected every 3 days till day 30. Media collected were clarified and p24 levels determined via p24 ELISA. Data are represented as mean ± SEM. The experiment was performed three times. (C) The effect of PYxE insertion on virus release. HeLa cells were transfected with molecular clones. Media were collected 24 hours post-transfection and virus pelleted through a 20% sucrose cushion. Cells were pelleted and lysed. Both virus and cell lysates were subjected to a western immunoblot followed by detecting virus-associated p24 and cell-associated p24 and other Gag-derived proteins (pr55, (p41) with α-p24 antibodies. GAPDH was used as a loading control.
-
Figure 11—source data 1
All p24 values plotted in Figure 11B.
- https://doi.org/10.7554/eLife.35546.038
Figure 12 with 1 supplement
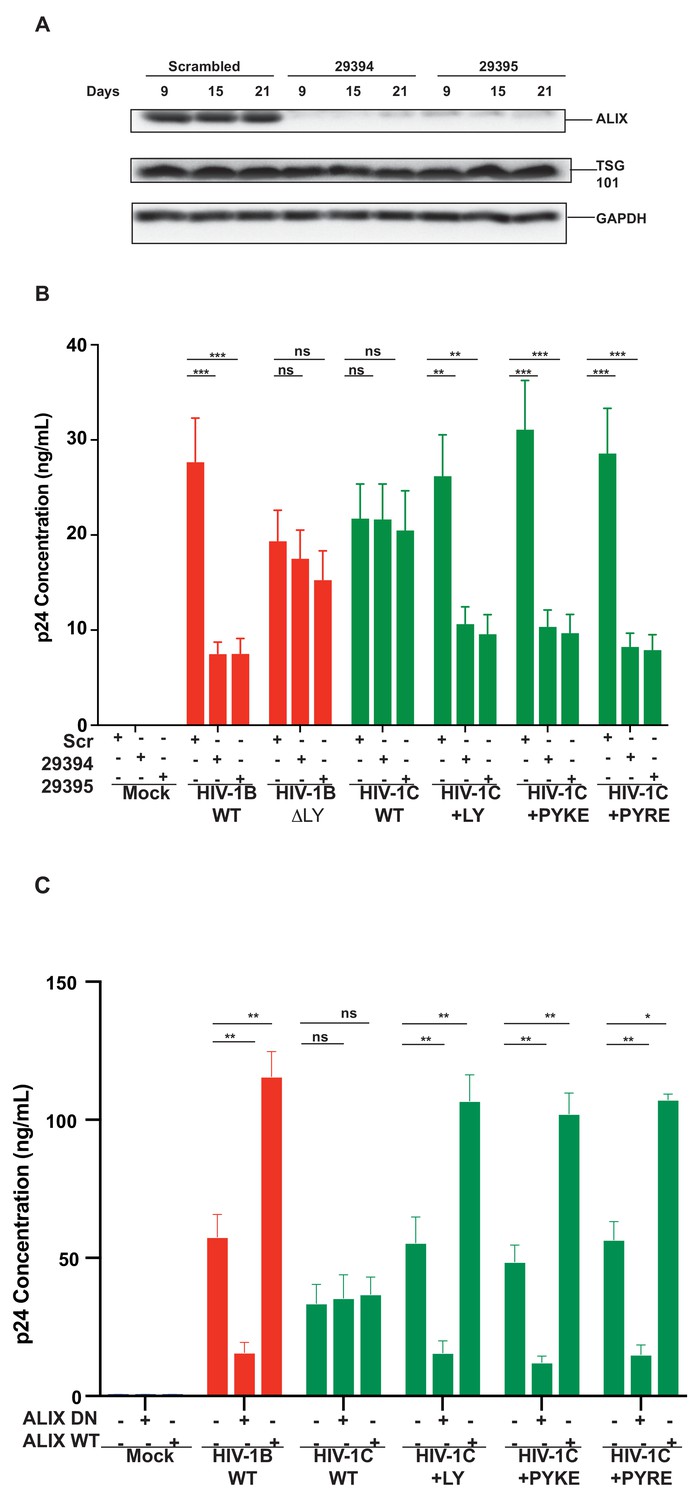
Replication of viruses bearing LYPX or PYxE insertions is inhibited by silencing ALIX or by ALIX dominant negative protein but enhanced by ALIX over expression.
(A) CEM-CCR5 cells were transduced with scrambled shRNA or anti-ALIX shRNA (29394 or 29395) expression cassettes. After selecting for transduction, the presence of ALIX protein was determined by western immunoblotting. (B) The shRNA-transduced cells were infected with HIV-1B, HIV-1B(∆LY), HIV-1C, HIV-1C+LY, HIV-1C+PYKE or HIV-1C+PYRE viruses. Media were collected every 3 days and p24 levels for day 18 at the peak virus replication determined. Data are represented as mean ± SEM (n = 3). (C) HeLa cells were co-transfected with indicated HIV-1 molecular clones and ALIX wild type or ALIX V domain (ALIX-DN) expression plasmids. At 24 hr post-transfection, p24 levels were measured. Data are represented as mean ± SEM (n = 3).
-
Figure 12—source data 1
All p24 values plotted in Figure 12B.
- https://doi.org/10.7554/eLife.35546.041
-
Figure 12—source data 2
All p24 values plotted in Figure 12C.
- https://doi.org/10.7554/eLife.35546.042
Figure 12—figure supplement 1
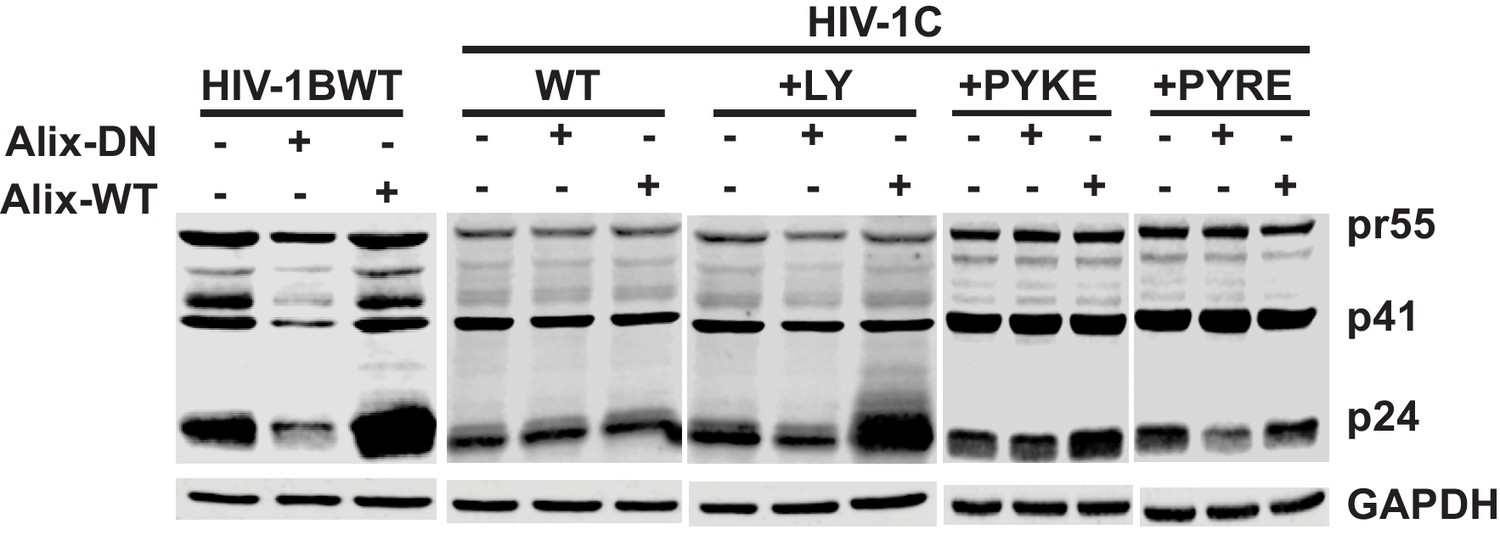
Effect of over-expression of wild type and dominant negative ALIX on intracellular capsid protein.
HeLa cells were either transfected HIV-1B wildtype, HIV-1C wildtype, HIV-1C+LY, HIV-1C+PYKE and HIV-1C+PYRE molecular clones. Cells were also co-transfected with either ALIX dominant negative or ALIX wildtype plasmid DNA. Cell lysates were prepared 24 h post transfection and subjected to immunoblotting with anti-p24 and α-GAPDH antibodies. The intracellular Gag levels were comparable between cells expressing different ALIX forms or that were transfected with different HIV-1 variants. Also see source files.
Figure 13
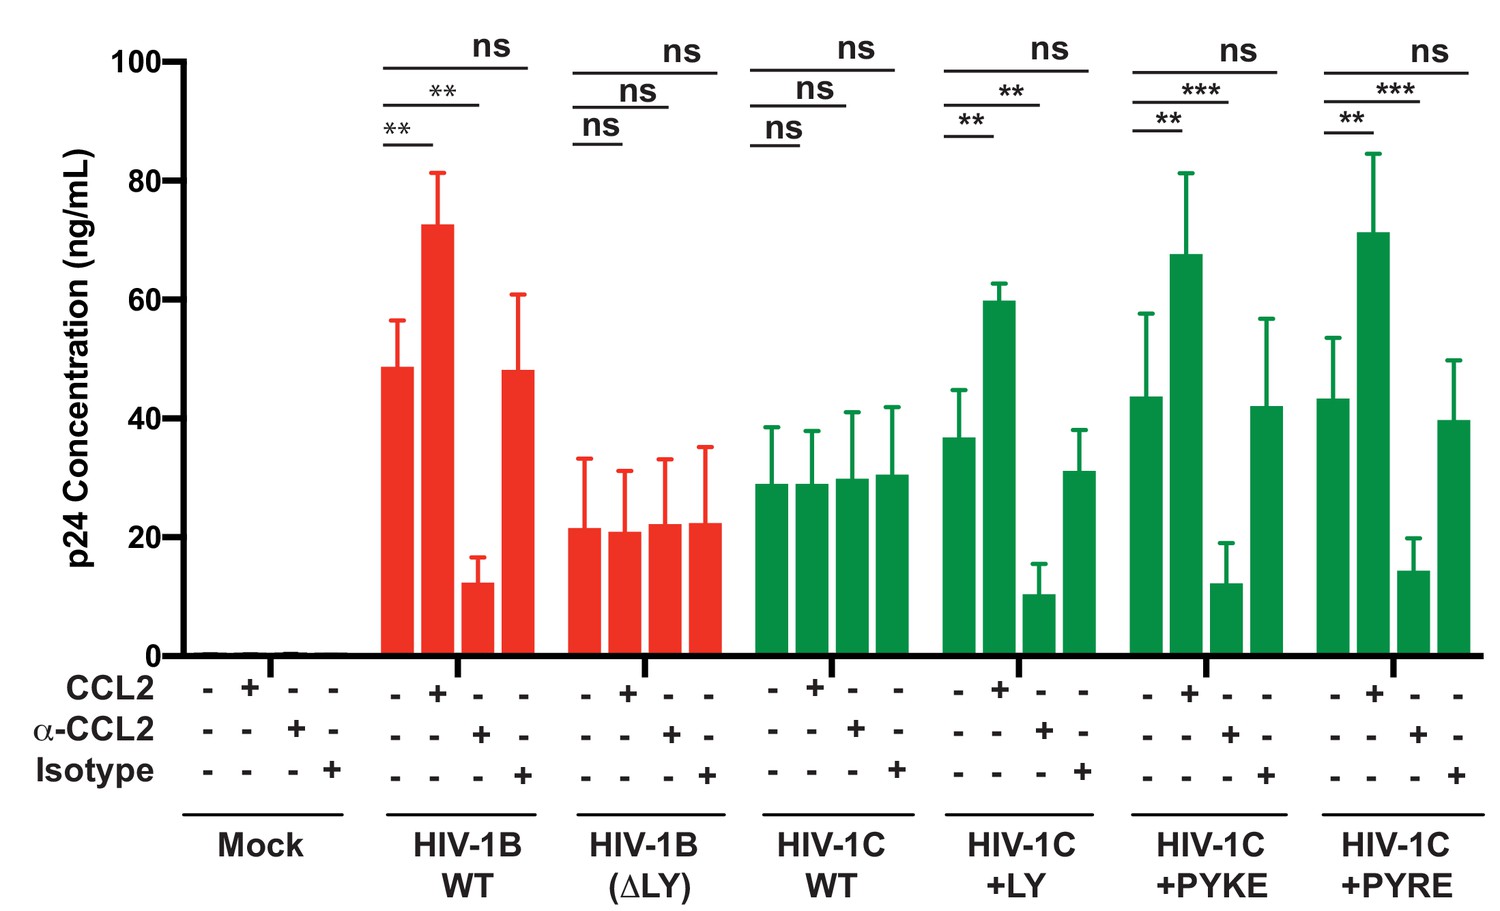
PYxE insertions restore CCL2-mediated increase in virus production in HIV.
HeLa cells were transfected with equal DNA concentrations of HIV-1BADA, HIV-1CIndieC1 and HIV-1CIndieC1+LY or HIV-1CIndieC1+PYxE molecular clones. Transfected cells were treated with nothing (untreated), CCL2, α-CCL2 or with isotype antibodies. After 24 hr post-transfection, media were collected, clarified and p24 levels determined. Data are represented as mean ± SEM. The experiment was performed three times.
-
Figure 13—source data 1
All p24 values plotted in Figure 13.
- https://doi.org/10.7554/eLife.35546.044
Tables
Key resources table
| Reagent type (species) or resource | Designation | Source or reference | Identifiers | Additional information |
|---|---|---|---|---|
| Cell line (H. sapiens) | HeLa | ATCC | RRID:CVCL_0030 | |
| Cell line (H. sapiens) | 293T | ATCC | CRL-3216 | |
| Cell line (H. sapiens) | TZMbl | NIH AIDS Reagent repository | 8129 | |
| Cell line (H. sapiens) | U87-CCR2 (U87 CD4+ CCR2+ cells) | NIH AIDS Reagent repository | 4033 | |
| Cell line (H. sapiens) | CEM.NKR CCR5 (CEM-CCR5) cells | NIH AIDS Reagent repository | 4376 | |
| Recombinant DNA reagent | Molecular clone HIV-1ADA (HIV-1B) | Theodore et al., 1996 | Dr. Keith Peden | |
| Recombinant DNA reagent | Molecular clone HIV-1IndieC1 (HIV-1C) | Mochizuki et al., 1999 | Dr. Udaykumar Ranga, Jawaharalal Nehru Centre for Advanced Research, Bangalore, India | |
| Recombinant DNA reagent | GFP expression plasmid peGFP n1 | Clontech | 6085–1 | For eukaryotic expression under CMV promoter. Includes Kanamycin resistance/Neomycin resistance marker |
| Recombinant DNA reagent | MISSION Lentiviral Packaging mix pLKO | Sigma Aldrich PMID: 16929317 | SHP001 | Includes two plasmids: pMission Gag-Pol and pCMV VSV-G both - carrying ampicillin resistance marker |
| Recombinant DNA reagent | pLKO.1 construct expressing shRNA targeting ALIX | Sigma Aldrich Eekels et al., 2011; PMID: 16929317 | Clone ID TRCN0000029394 | Target sequence: 5’ GCTGCTAAACATTACCAGTTT 3’ Carries the puromycin-resistance marker |
| Recombinant DNA reagent | pLKO.1 construct expressing shRNA targeting ALIX | Sigma Aldrich Eekels et al., 2011; PMID: 16929317 | Clone ID TRCN0000029395 | Target sequence: 5’ CCTGAATTACTGCAACGAAAT 3’ Carries the puromycin-resistance marker |
| Recombinant DNA reagent | pLKO.1 encoding sequences for scrambled shRNA control | Sigma Aldrich Eekels et al., 2011; PMID: 16929317 | SHC001 | Carries puromycin-resistance marker |
| Recombinant DNA reagent | pBluescript-KS | Stratagene | X52331.1 | Bacterial cloning plasmid with a polylinker |
| Recombinant DNA reagent | pSL1190 | Amersham | Bacterial cloning plasmid with a polylinker | |
| Recombinant DNA reagent | HIV-1ADA mutant Gag p6ΔLY | This paper | Molecular clone of a HIV-1ADA clade B variant created by site directed mutagenesis | |
| Recombinant DNA reagent | HIV-1ADA mutant Gag p6ΔPTAP(+LIRL) | This paper | Molecular clone of a HIV-1ADA clade B variant created by site directed mutagenesis | |
| Recombinant DNA reagent | HIV-1ADA mutant Gag p6ΔPTAP(+LIRL) | This paper | Molecular clone of a HIV-1ADA clade B variant created by site directed mutagenesis | |
| Recombinant DNA reagent | HIV-1ADA mutant ΔLY | This paper | Molecular clone of a HIV-1ADA clade B variant created by site directed mutagenesis | |
| Recombinant DNA reagent | HIV-1IndieC1 mutant Gag p6+LY | This paper | Molecular clone of a HIV-1IndieC1 clade C variant created by site directed mutagenesis | |
| Recombinant DNA reagent | HIV-1IndieC1 mutant Gag p6ΔPTAP(+LIRL) | This paper | Molecular clone of a HIV-1IndieC1 clade C variant created by site directed mutagenesis | |
| Recombinant DNA reagent | HIV-1IndieC1 mutant Gag p6ΔPTAP(+LIRL) | This paper | Molecular clone of a HIV-1IndieC1 clade C variant created by site directed mutagenesis | |
| Recombinant DNA reagent | HIV-1CIndieC1 + PYKE | This paper | Molecular clone of a HIV-1IndieC1 clade C variant created by site directed mutagenesis | |
| Recombinant DNA reagent | HIV-1CIndieC1 + PYRE | This paper | Molecular clone of a HIV-1IndieC1 clade C variant created by site directed mutagenesis | |
| Recombinant DNA reagent | pGEX-6Pi | GE Healthcare | 28954648 | For expression of Glutatione S Transferase (GST) protein in E. coli |
| Recombinant DNA reagent | pGEX-6Pi-Bp6 | This paper | For expression of GST-Bp6 fusion protein in E. coli | |
| Recombinant DNA reagent | pGEX-6Pi-Cp6 | This paper | For expression of purified GST-Cp6 fusion protein E. coli. | |
| Recombinant DNA reagent | pGEX-6Pi-C + PYKE p6 | This paper | For expression of purified GST-C + PYKEp6 fusion protein in E. coli. | |
| Recombinant DNA reagent | pGEX-6Pi-C + PYRE p6 | This paper | For expression of purified GST-C + PYREp6 fusion protein in E. coli. | |
| Antibody | anti-CCL2 (Mouse Monoclonal) | PeproTech | 500-M71-500UG | 2.5 μg/mL |
| Antibody | Isotype antibody IgG2a, kappa (Mouse polyclonal) | PeproTech | 500-M00 | 2.5 μg/mL |
| Antibody | anti-ALIX (mouse Monoclonal) | Thermo-Scientific | MA183977 | (1:500) |
| Antibody | anti-TSG101(mouse Monoclonal) | GeneTex | GTX70255 | (1:500) |
| Antibody | anti-beta-actin (mouse Monoclonal) | Thermo-Scientific | MA515739 | (1:15000) |
| Antibody | anti-GAPDH (mouse Monoclonal) | Thermo-Scientific | MA515738 | 1:10,000 |
| Antibody | anti-HIV p24 (goat) | Gift from Dr. David Otts (NCI) | Gift from Dr. David Otts (NCI) | (1:5000) Dr. David Ott, NCI, Frederick |
| Antibody | anti-Goat antibodies Alexa 800 nm (Donkey polyclonal) | Life Technologies | A32930 | 1:10,000 |
| Antibody | anti-mouse antibodies Alexa 680 nm (goat polyclonal) | Life Technologies | A-21058 | 1:10,000 |
| Antibody | anti mouse-Alexa 488 antibody (goat polyclonal) | Life Technologies | A-11001 | 1:250 |
| Antibody | anti-goat Alexa 488 (Donkey polyclonal) | Life Technologies | A-11055 | 1:500 |
| Peptide, recombinant protein | GST | This paper | Recombinant protein purified using Glutathione agarose beads from lysates of E. coli expressing pGEX-6Pi described in this Table | |
| Peptide, recombinant protein | GST-HIV-1Bp6 | This paper | Recombinant protein purified using Glutathione agarose beads from lysates of E. coli expressing pGEX-6Pi-Bp6 described in this Table | |
| Peptide, recombinant protein | GST-HIV-1Cp6 | This paper | Recombinant protein purified using Glutathione agarose beads from lysates of E. coli expressing pGEX-6Pi-Cp6 described in this Table | |
| Peptide, recombinant protein | GST-HIV-1C-PYKE p6 | This paper | Recombinant protein purified using Glutathione agarose beads from lysates of E. coli expressing pGEX-6Pi-C + PYKE p6 described in this Table | |
| Peptide, recombinant protein | GST-HIV-1C-PYRE p6 | This paper | Recombinant protein purified using Glutathione agarose beads from lysates of E. coli expressing pGEX-6Pi-C + PYRE p6 described in this Table | |
| Peptide, recombinant protein | CCL2 | PeproTech | 300-04-50UG | 250 ng/mL |
| Peptide, recombinant protein | rhM-CSF | PeproTech | AF-300–25 | 50 ng/mL |
| Peptide, recombinant protein | PHA | Sigma | 11249738001 | 1 µg/ml |
| Peptide, recombinant protein | IL-2 | PeproTech | 200–02 | 50 U/ml |
| Commercial assay or kit | HCYTO-MAG kit | Millipore | HCYTOMAG-MCP-1 | For CCL2 measurement via Luminex |
| Commercial assay or kit | Quick Change kit | Agilent Technologies | 210518–5 | For site directed mutagenesis |
| Commercial assay or kit | Luciferase assay kit | Promega | PRE1531 | For measuring the luciferase activity in TZMbl cell lysates |
| Commercial assay or kit | HIV-1 p24 antigen capture assay ELISA | ABL, Inc | 5447 | For p24 measurement |
| Software, algorithm | QuantStudio Real-Time PCR software v1.3 | Thermofisher Scientific | For CT value analysis | |
| Software, algorithm | Volocity 6.3 | Perkin Elmer | RRID:SCR_002668 | confocal image analysis |
| Software, algorithm | Graphpad Prism | Graphpad Software, Inc | RRID:SCR_002798 | Plotting data on graphs |
| Software, algorithm | FIJI | NIH | RRID:SCR_002285 | Confocal image analysis |
| Software, algorithm | LI-COR image studio software | LI-COR Biosciences | RRID:SCR_015795 | Western blot band intensity measurements |
| Chemical compound, drug | Gentamicin | Invitrogen | 15750–060 | 0.2% in PBMCs/MDM culture media |
| Chemical compound, drug | Ciprofloxacin | Sigma | 17850 | 4 µg/ml in MDM culture media |
| Chemical compound, drug | Penicillin-Streptomycin | Fischer Scientific | 15140–122 | Provided at 100x, used at 1x concentration in cell culture media (equivalent to 50 to 100 IU/mL Penicillin and 50 to 100 μg/mL Streptomycin) |
| Other | Latrunculin A | Life Technologies | L12370 | 100 ng/mL |
| Other | Texas Red Phalloidin | Life Technologies | T7471 | 1:500 |
| Other | Prolong gold - anti-fade DAPI | Fisher scientific | p36931 | For nuclear staining and mounting |
| Strain, strain background (E. Coli) | BL21 (DE3) | Novagen | 69450 | For bacterial expression of pGEX plasmids |
| Biological sample (H. sapiens) | Leukopak | New York Blood Center | New York Blood center |
Table 1
Sequences of primers employed in site-directed mutagenesis.
https://doi.org/10.7554/eLife.35546.045| Primer | Sequence |
|---|---|
| ADA (PTAP to LIRL mutation) primer Forward | 5’CTACAGAGCAGACCAGAGCTGATCAGACTGCCAGAAGAGAGCTTCAGG3’ |
| ADA (PTAP to LIRL mutation) primer Reverse | 5’CCTGAAGCTCTCTTCTGGCAGTCTGATCAGCTCTGGTCTGCTCTGTAG3’ |
| ADA (LY deletion) primer Forward | 5’GGAGCCGATAGACAAGGAACCTTTGACTTCCCTC3’ |
| ADA (LY deletion) primer Reverse | 5’GAGGGAAGTCAAAGGTTCCTTGTCTATCGGCTCC3’ |
| IndieC1 (PTAP to LIRL mutation) primer Forward | 5’CTCCAGAGCAGACCGGAGCTGATCAGACTGCCAGCAGAGAGCTTCAGG3’ |
| IndieC1 (PTAP to LIRL mutation) primer Reverse | 5’CCTGAAGCTCTCTGCTGGCAGTCTGATCAGCTCCGGTCTGCTCTGGAG3’ |
| IndieC1 (LY insertion) primer Forward | 5’GCCGAAAGACAGGGAACTGTATCCCTTAACTTCCCTCAAA3’ |
| IndieC1 (LY insertion) primer Reverse | 5’TTTGAGGGAAGTTAAGGGATACAGTTCCCTGTCTTTCGGC3’ |
Download links
A two-part list of links to download the article, or parts of the article, in various formats.
Downloads (link to download the article as PDF)
Open citations (links to open the citations from this article in various online reference manager services)
Cite this article (links to download the citations from this article in formats compatible with various reference manager tools)
CCL2 mobilizes ALIX to facilitate Gag-p6 mediated HIV-1 virion release
eLife 8:e35546.
https://doi.org/10.7554/eLife.35546


