Ssd1 and Gcn2 suppress global translation efficiency in replicatively aged yeast while their activation extends lifespan
- Weill Cornell Medicine, United States
- Houston Methodist Research Institute, United States
- Manhattan College, United States
- University of Saskatchewan, Canada
- University of Texas MD Anderson Cancer Center, United States
- Baylor College of Medicine, United States
Figures
Figure 1
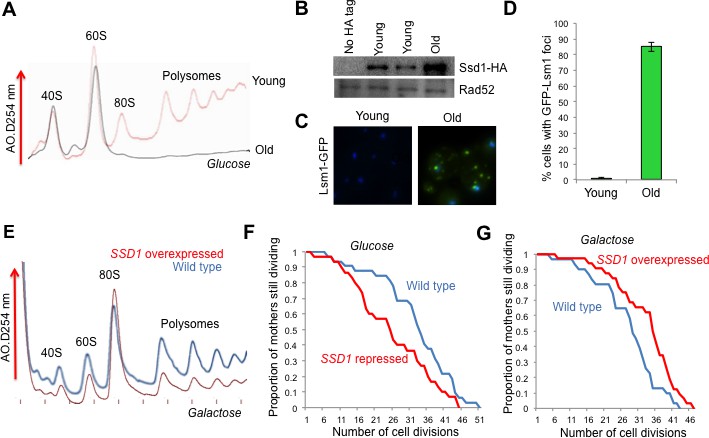
The role of Ssd1 in translational regulation and replicative lifespan.
(A). Polysome analysis of yeast cell lysates. UV traces of RNA distribution on sucrose gradients from young and old ZHY2 cells. (B). Western blot analysis of HA tagged Ssd1 protein where endogenous Ssd1 was tagged with HA at the C-terminus (ZHY6), from an equal number of young or old yeast cells. Two independent young samples were analyzed. Cells with no HA tag serve as a control (strain ZHY2). Rad52 serves as a loading control. (C). The number of cells showing visible P-body aggregation is increased during aging. WT cells expressing a GFP tagged version of Lsm1 (strain ZHY9) are shown in young and old cells. Young and old cells were stained with DAPI. (D). Quantitation of the percentage of young and old cells with Lsm1-GFP foci. For each cell type, an average of 100 cells were examined in three independent experiments (n = 3, mean ±SD). (E) Polysome analysis of yeast cell lysates. UV traces of RNA distribution on sucrose gradients from WT cells (strain ZYH2) and ssd1Δ cells overexpressing Ssd1 under the GAL1 promoter (strain ZYH3) grown in 0.5% galactose. (F) Replicative lifespan of yeast strain ZHY2 (wild type) and the isogenic strain expressing pGAL-SSD1 (strain ZHY3) grown on glucose to repress the pGAL promoter. (G) the same strains as F. grown on 0.5% galactose medium to induce the expression of Ssd1 from pGAL-SSD1.
Figure 2 with 5 supplements

Global reduction in protein synthesis during aging.
(A) Ribo-seq, (B) RNA-seq, (C) Translational efficiency, and (D) efficiency change of every mRNA obtained by normalizing the Ribo-seq data to RNA-seq data, after normalizing both data sets to spike-in controls. All panels had genes ranked as shown in D, by the Log2 fold change of translation efficiency between old and young cells, with the genes with the biggest reduction in translation efficiency on the top and the genes with the least changes in translational efficiency at the bottom. Data for three independent experimental repeats is shown (Q value cutoff < 0.05) for young, middle aged (mid) and old cells. All data was obtained using strain ZYH2. See also Figure 2—figure supplements 1–5.
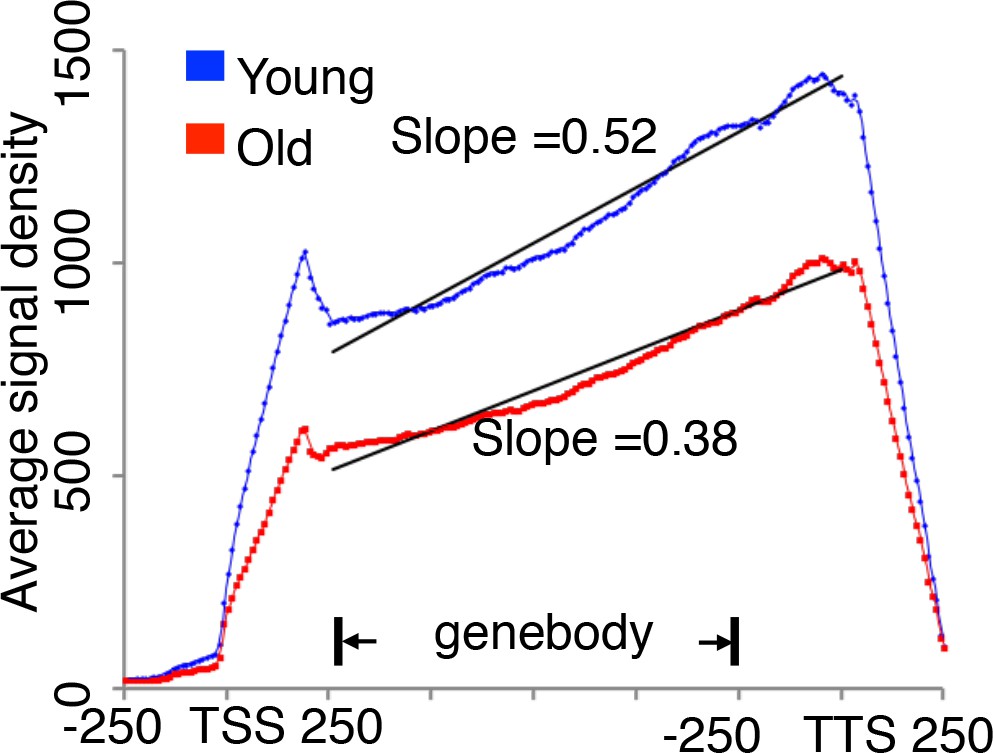
Figure 2—figure supplement 1
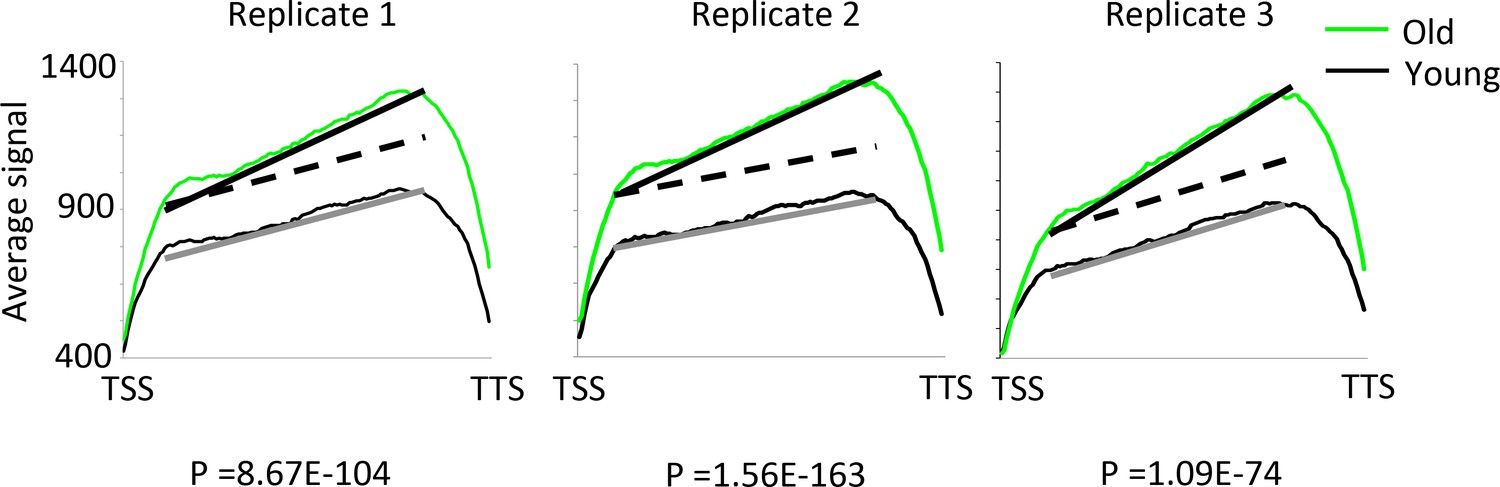
Internal transcription initiation increases with age.
The regression lines compare the average signal rate of increase of RNA reads from transcription start site (TSS) to the transcription termination site (TTS). The dotted lines show where the regression line slopes would be if the rate of transcription initiation was the same in old as young cells. Sold lines show the actual regression lines. A z-test for comparing regression line slopes was performed and the very low p values show that the average signal increases significantly faster for young compared to old in all three replicates. Note that antisense transcripts were removed from this analysis.
Figure 2—figure supplement 2
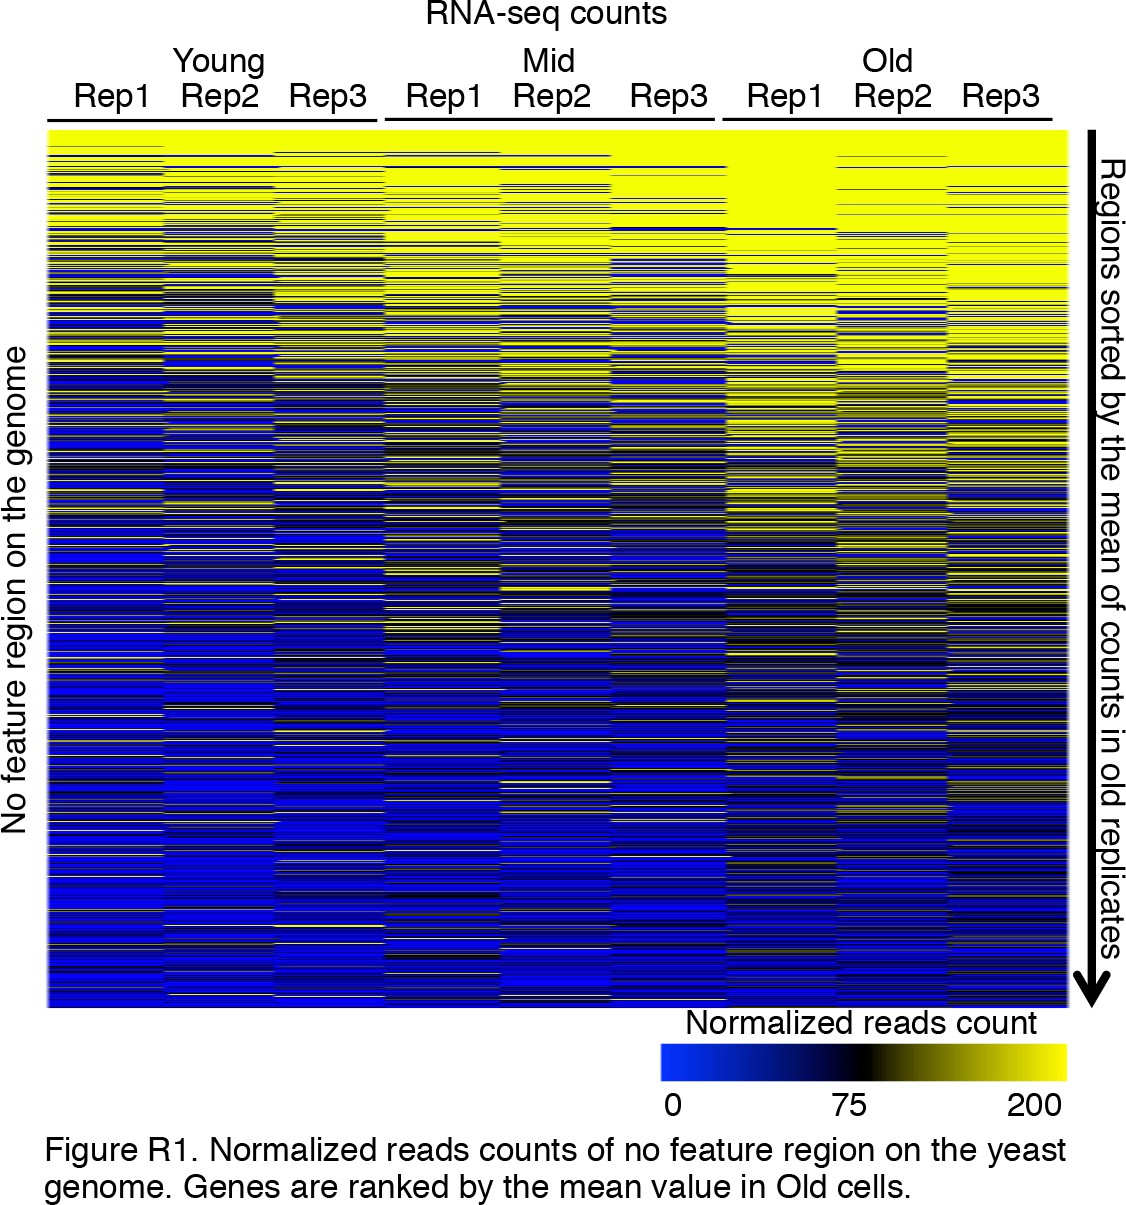
Intergenic transcription initiation increases with age.
We checked intergenic regions defined by the SGD database. It is clear that during aging, the expression of intergenic regions was significantly increased. Normalized read counts are shown for three replicates of RNA-seq that correspond to all genomic regions with no features of genes, that is, between genes. Genes are ranked by the mean value of transcript levels in old cells.
Figure 2—figure supplement 3
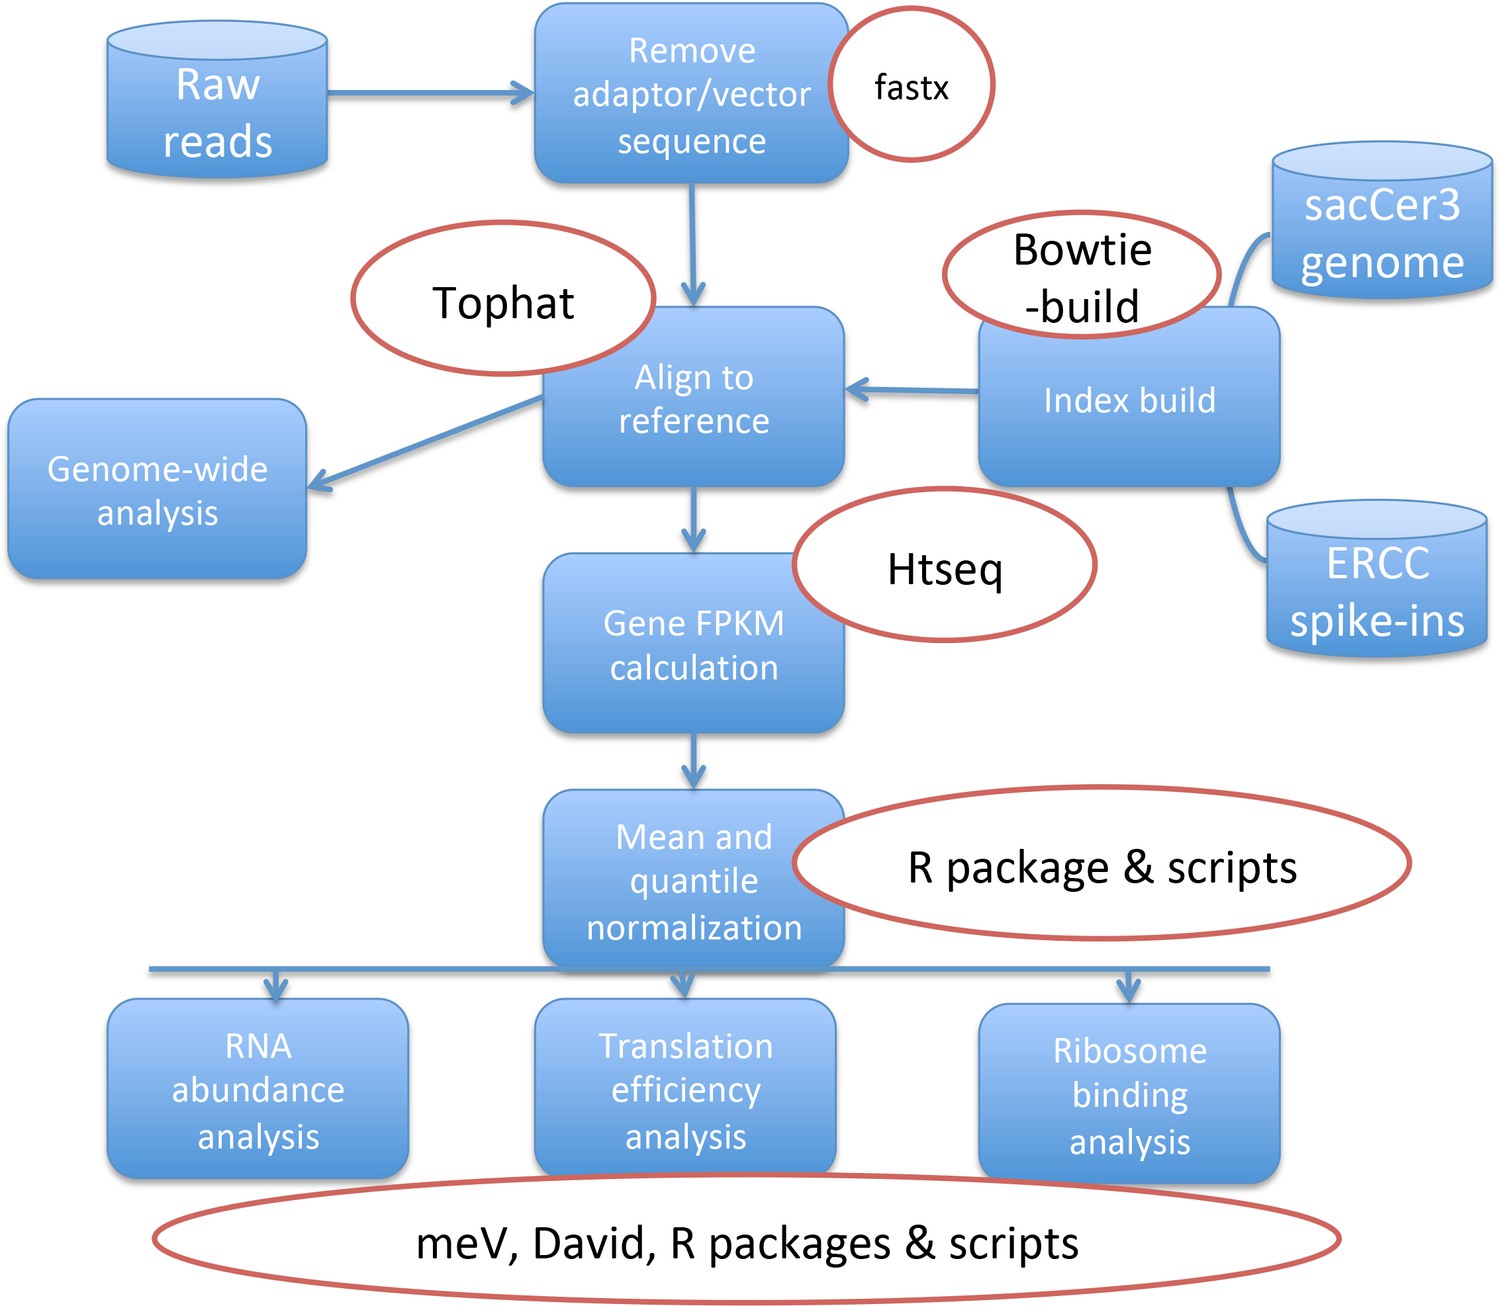
Overview of steps used in the analysis of the Ribo-seq Data.
The raw reads were mapped to the Saccharomyces Cerevisiae genome. Differential gene expression values were calculated and then normalized to spike-ins. The resulting values were used to calculate translation efficiency ratios and were further processed for detailed analyses.
Figure 2—figure supplement 4
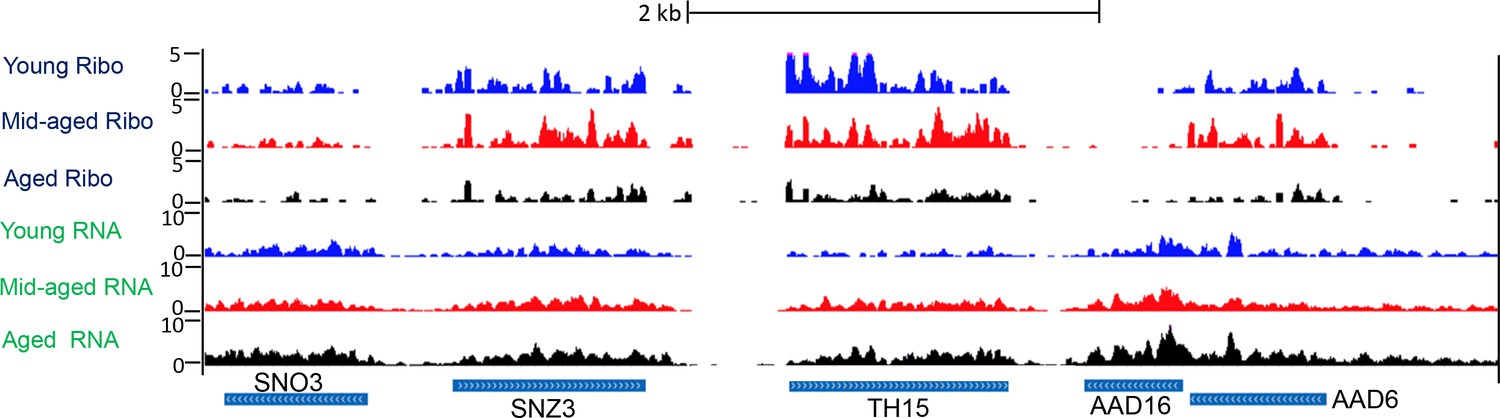
Screen shot of typical genomic region, showing Ribo-seq and RNA-seq.
Typical UCSC browser screen shot of Ribo-seq data and RNA-seq data from a random region of the genome.
‘Mid-aged’ refer to 15 hr incubation after adding the estradiol during MEP. ‘Aged’ refer to 30 hr incubation after adding the estradiol during MEP. Ribo-Seq and RNA-Seq data has been normalized to spike-ins.
Figure 2—figure supplement 5
translational initiation not elongation is reduced during replicative aging.
Ribosome profiling of old cells and young cells, with average signal density for ribosome-seq data from Figure 2, normalized to RNA abundance for every yeast gene. If there is a translation rate reduction or slower translation elongation, an increasing read density should be observed in the slower region. However, based on our analysis, we observed very similar trend of translation ribosome profile between young and old, although there were significant less translation in old cells. So we concluded there is no reduction in translation elongation rates during aging.
Figure 3 with 3 supplements
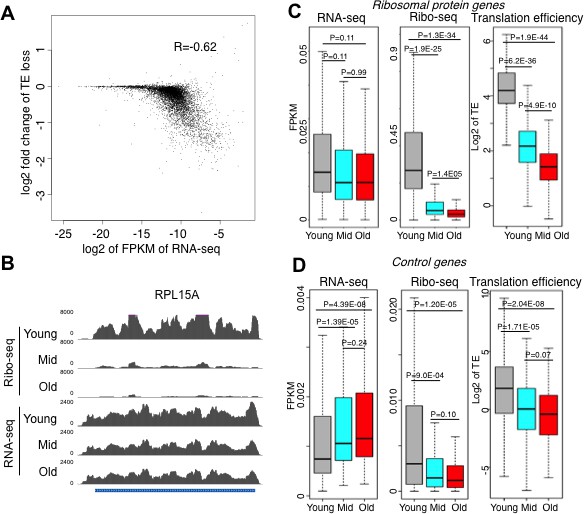
Reduced initiation of protein synthesis during aging; genes that are most highly transcribed in young cells having the greatest reduction in protein synthesis.
(A) Scatter plot of log2 fold change of translational efficiency reduction during aging and log2 of FPKM (RNA abundance) in young cells. (B). Screen shot of ribosomal protein gene RPL15A, showing the typical reduction in translation efficiency, with no significant change in transcript levels during aging. (C). RNA-seq and Ribosome profiling and translation efficiency of the ribosome protein genes (RPG) during aging. P values are calculated by Wilcoxon test. While the reduction in transcript levels for all 136 of the RPGs is significant, each RPG transcript decreases on average only 23% during aging. (D). As for C, but for 100 randomly chosen genes. See also Figure 3—figure supplements 1–3.
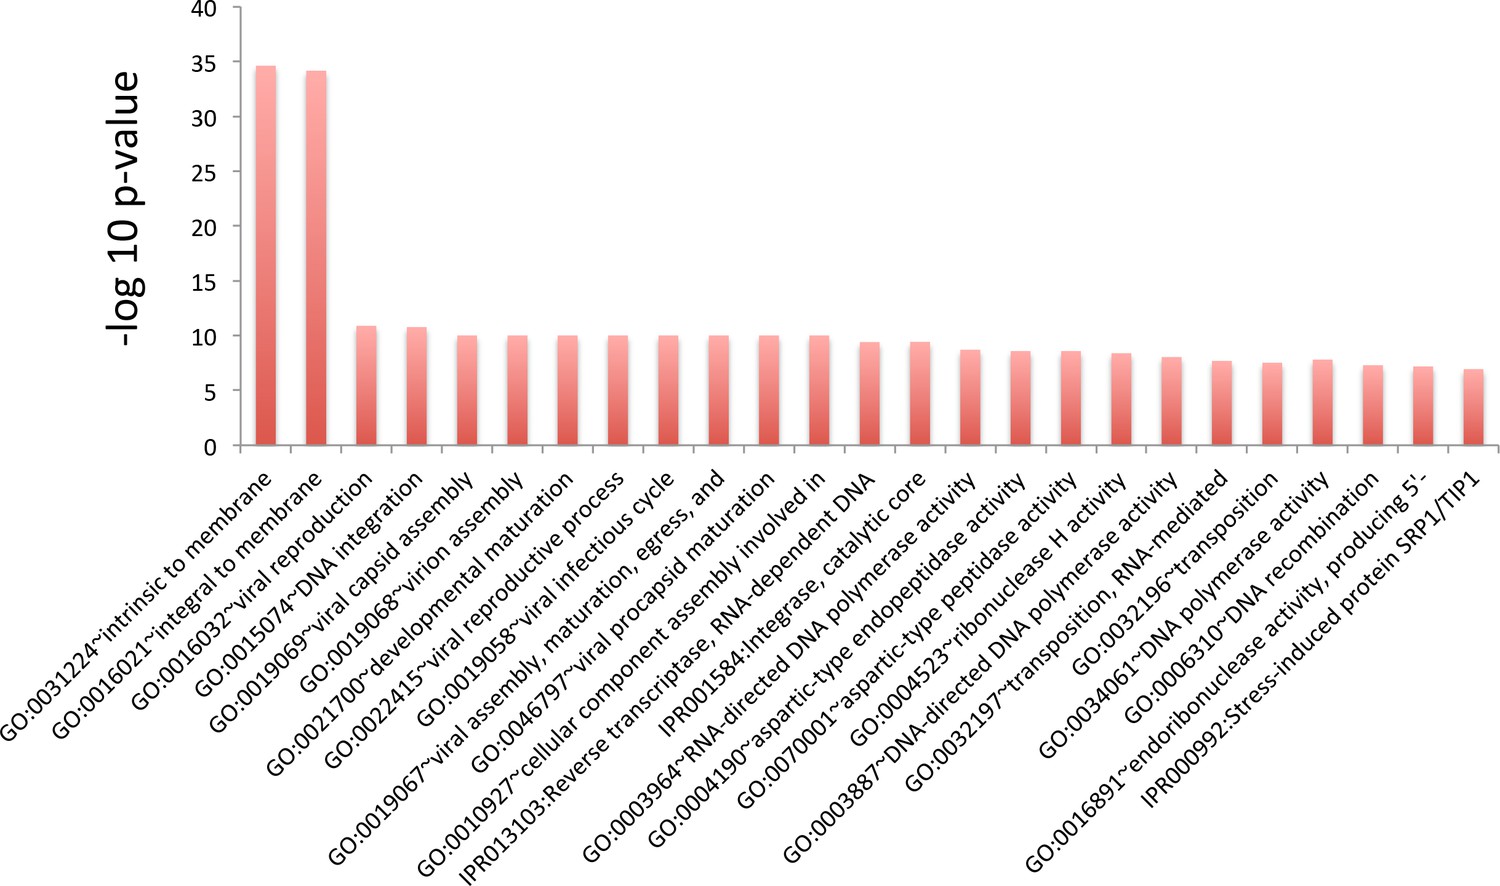
Figure 3—figure supplement 1
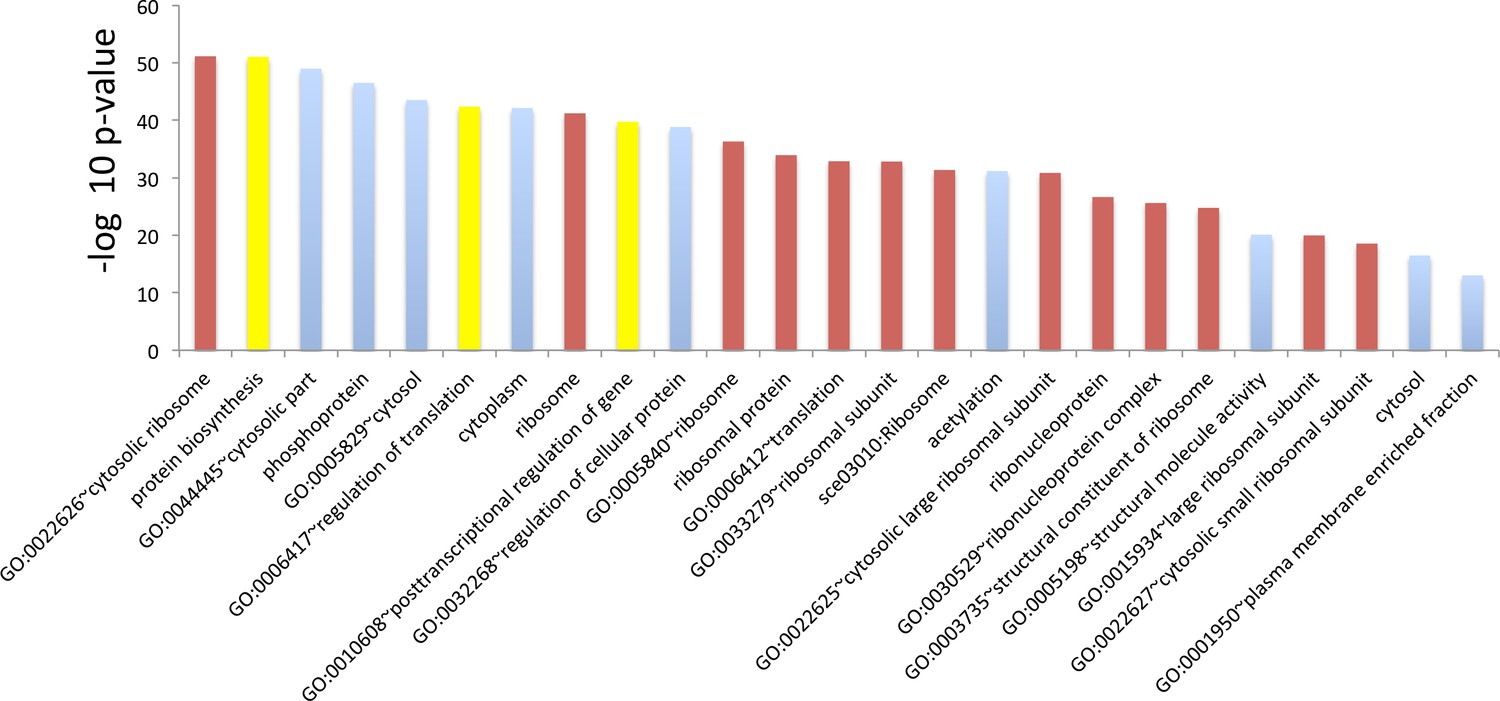
GO term analysis for genes whose translation efficiency went down the most during aging.
Top 25 terms for the 500 genes whose translation efficiency went down the most during aging. Genes were sorted using p values from Cochran’s Q test such that genes that suffered the highest loss of translation efficiency across all three replicates were ranked at the top. The red bars indicate terms that are ribosome function related, the blue ones, terms that are clearly not related to ribosome function and yellow ones are ambiguous terms. The majority, 16 of the top 25 terms, are either ribosome related or ambiguous.
Figure 3—figure supplement 2
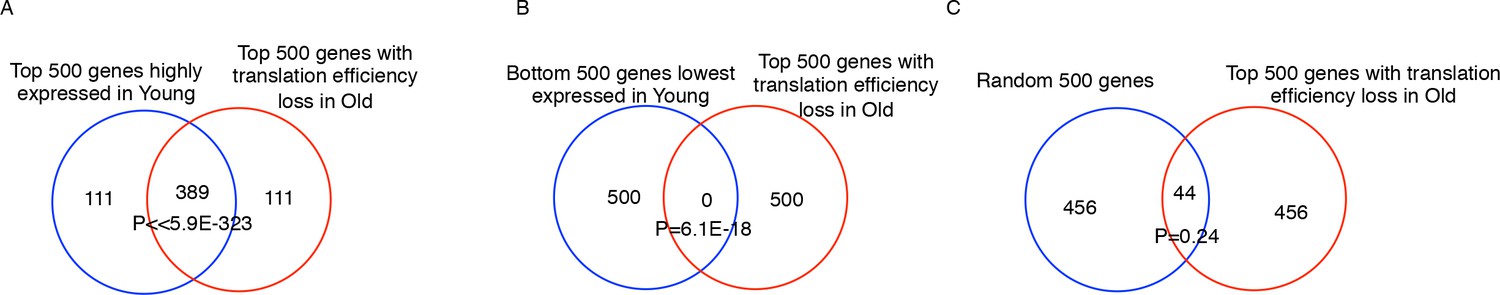
Translation efficiency (TE) is reduced the most during aging for genes that were highly expressed in young cells.
(A) Venn diagram of top 500 TE loss genes during aging and top 500 highly expressed genes in young cells. (B) Venn diagram of top 500 TE loss genes during aging and top 500 less expressed genes in young cells. (C) Venn diagram of top 500 TE loss genes during aging 500 random control genes. Old cells possess 389 overlapping genes with the top 500 genes with the most robust transcript levels in Young cells. On the other hand, there were 0 and 44 overlaps of top500 TE loss genes in old cells towards 500 lowest expressed genes in young cells and random control genes respectively. The P values are defined by fisher exact test. The result supported the notion that the translation efficiency is reduced the most for the most abundant mRNAs.
Figure 3—figure supplement 3
GO term analysis for genes whose translation efficiency went down the least during aging.
Top 25 terms for the 500 genes whose translation efficiency went down the least during aging. Genes were sorted using p values from Cochran’s Q test such that genes that suffered the highest loss of translation efficiency across all three replicates were ranked at the top. This ranking shows no clear pattern, as terms with varied functions are represented.
Figure 4 with 3 supplements
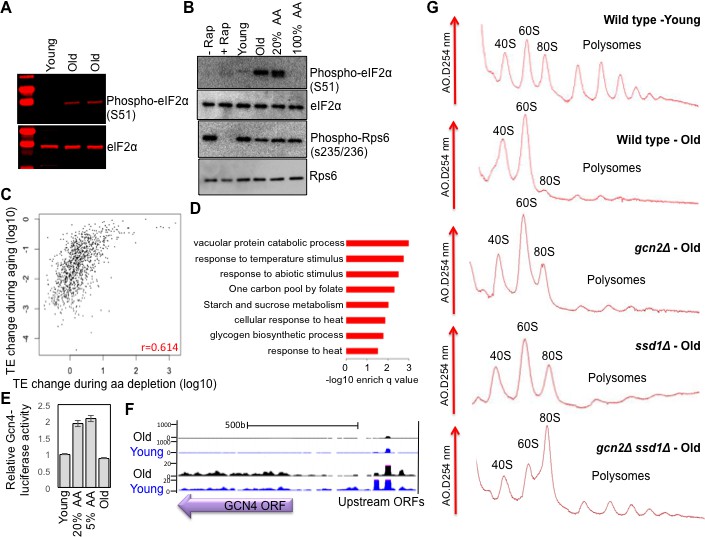
Activation of Gcn2 but not Gcn4 in old cells.
(A) Western blot analysis detects the induction of eIF2α phosphorylation during aging. The equivalent number of cells worth of protein from young and old cells was loaded (strain ZYH2). Two independent samples are shown for old cells. (B) Induction of eIF2α phosphorylation but not inactivation of TOR during aging. The equivalent number of cells worth of protein from young and old cells was loaded, or cells treated with or without Rapamycin (200 nM for 2 hr) or with 100% or 20% of the normal level of amino acids (all in strain ZYH2). (C) Comparison of the changes in translational efficiency during aging vs. translational efficiency during amino acid depletion. The translation efficiency values have been sorted, grouped in sets of 5 and averaged; the x and y coordinates of each dot are the averages of the amino acid depletion and the aging translation efficiency values, respectively. (D) Genes that are highly translated only during starvation but not during aging are Gcn4-induced genes. David pathway analysis of genes with high increase in translational efficiency only in starvation but not in aging. (E) Gcn4 luciferase levels with either 20% or 5% of the normal level of amino acids (to induce Gcn4) in comparison to young and old yeast (strain ZYH2). Averages and standard deviation are plotted of three independent experiments. (F) UCSC browser screen shot of the distribution of ribosome footprint reads across the GCN4 gene ORF and its uORFs. The bottom shows 50 fold lower numbers on the y-axis. Pink indicates values that are off scale. (G) UV traces of RNA distributions on sucrose gradients from old cells of young wild type cells (ZHY2 strain), old wild type cells, old gcn2Δ cells (ZHY8 strain), old ssd1Δ cells (ZHY7 strain), and old ssd1Δ gcn2Δ cells (ZHY22 strain) from polysome profiles ran in parallel. See also Figure 4—figure supplements 1–3.
Figure 4—figure supplement 1
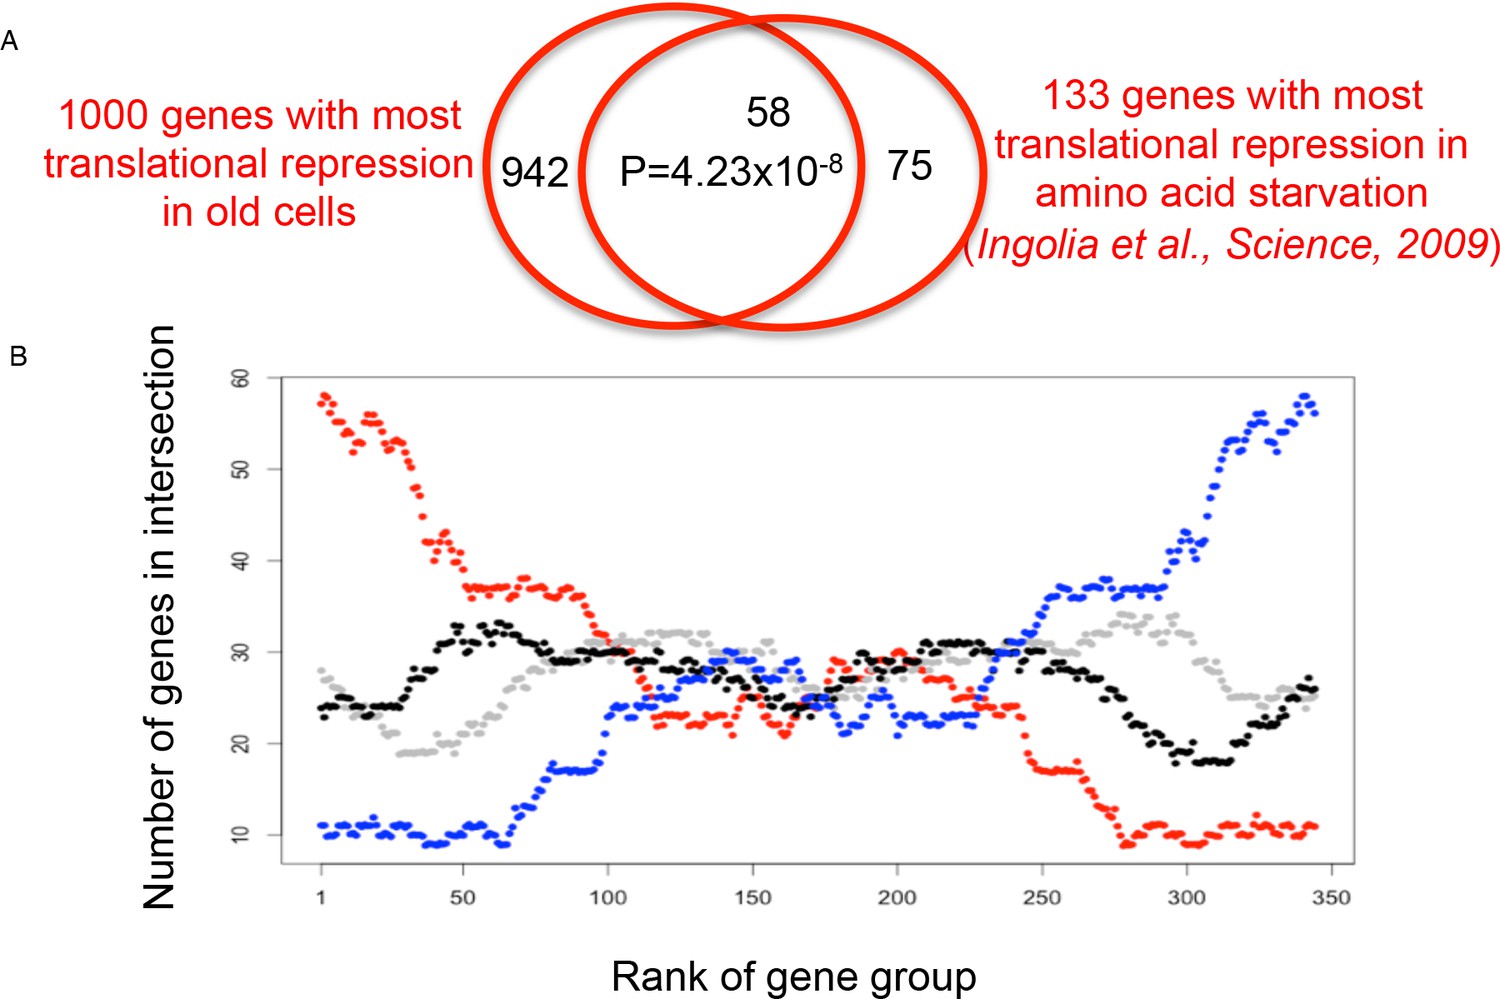
Overlap analysis of the translational efficiency changes during aging vs amino acid depletion.
(A) The overlap between the 1000 genes with the biggest reduction in translational efficiency during aging and the 133 genes with the biggest reduction in translational efficiency in response to amino acid starvation is shown at the top. The p value was calculated using Fisher’s exact test. (B) A sliding window of groups of 1000 genes in 10 gene increments, for the 4410 genes shared between both analyses. Each dot represents the size of the overlap between the two rankings (ranking of TE loss during aging, and ranking of TE loss during amino acid depletion from Ingolia et al., 2009): the red line compares translation efficiency down during aging vs translation efficiency down during amino acid depletion; blue indicates translation efficiency up during aging vs translation efficiency down during amino acid depletion; black indicates translation efficiency up during aging vs translation efficiency up during amino acid depletion; gray indicates translation efficiency down during aging vs translation efficiency up during amino acid depletion.
Figure 4—figure supplement 2
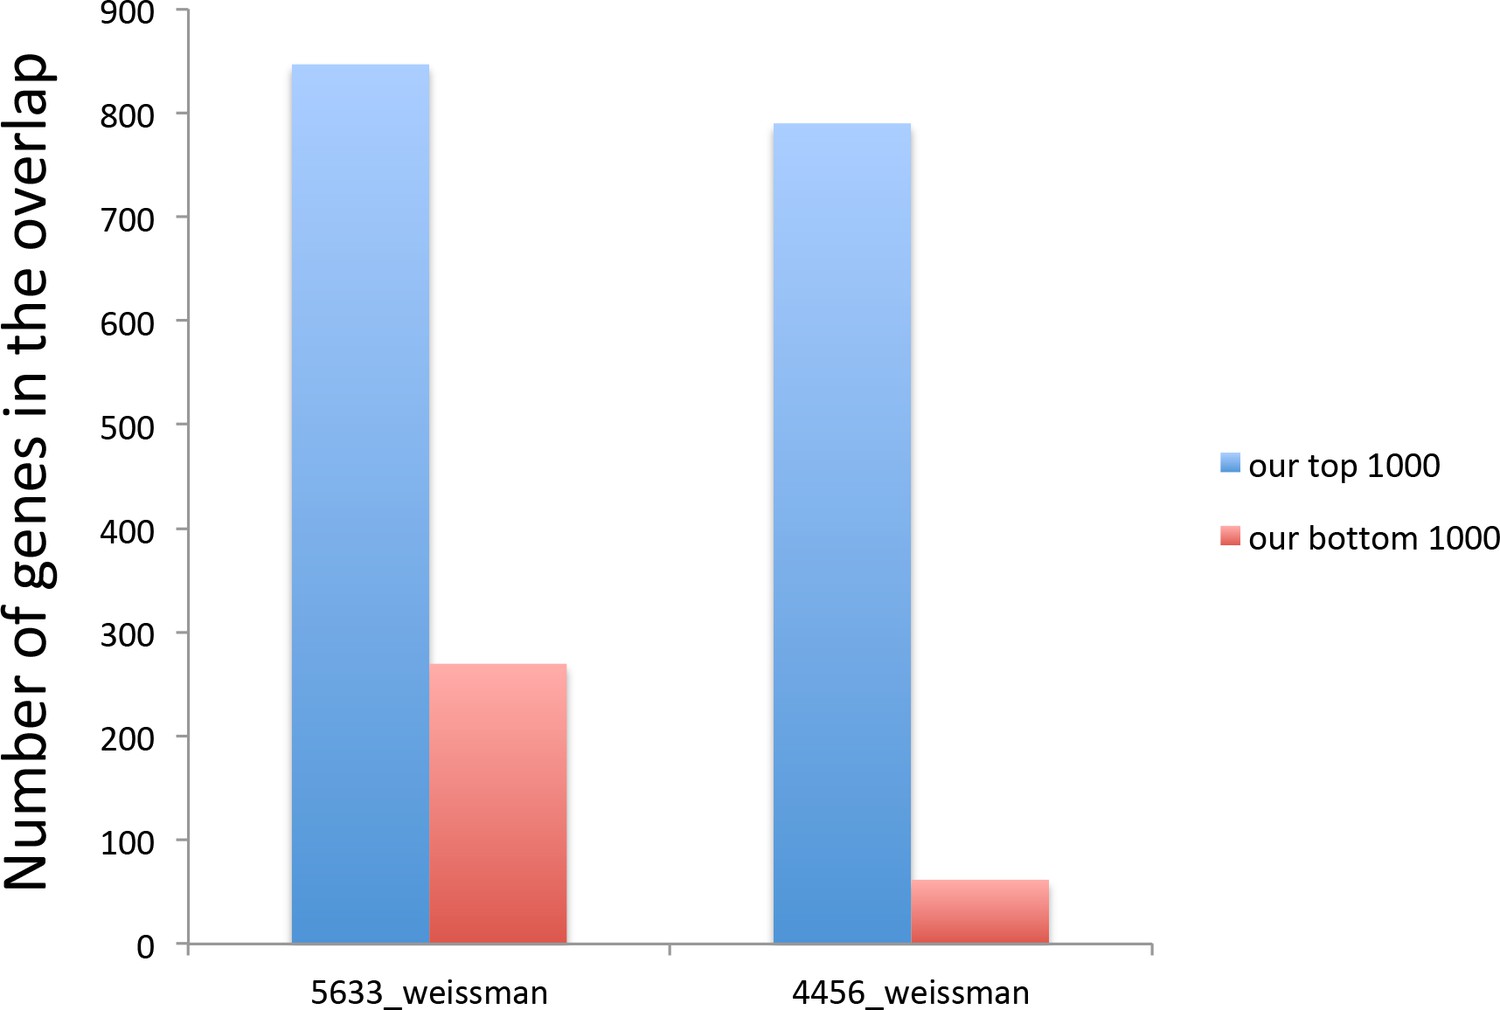
The genes with the lowest translational efficiency change during aging were not detectable in the analysis during amino acid depletion.
Graphs show how many out of 1000 of our top and bottom genes were included in the Weissman’s lab (Ingolia et al., 2009) 5633 genes detected by RNA seq and the 4456 genes detected by Ribo-seq. ‘our top 1000’ in blue refers to the 1000 genes with the biggest reduction in translational repression efficiency during aging, while ‘our bottom 1000’ in red refers to the 1000 genes with the smallest reduction in translational repression efficiency during aging.
Figure 4—figure supplement 3
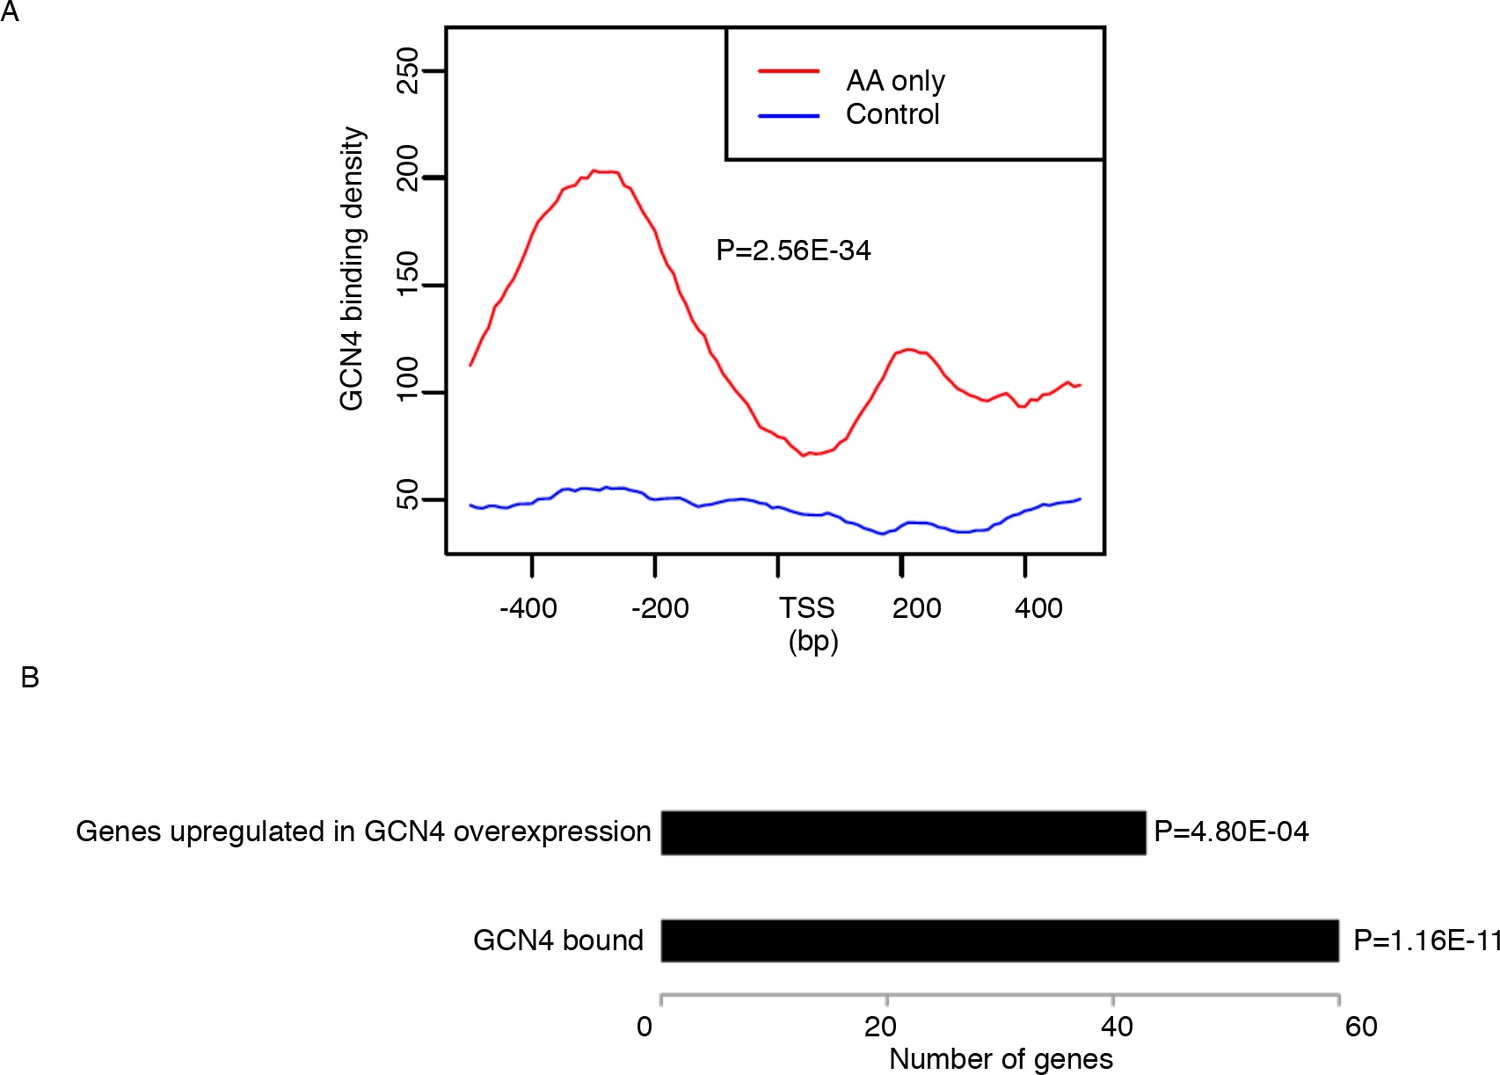
Genes that are highly translated only in starvation but not in aging are GCN4 induced genes.
There are 122 genes with higher TE in starvation but not in aging. These genes are significantly enriched in metabolic and stress related pathways. We compared our data with the GCN4 chipseq data and GCN4 overexpression RNAseq data from GEO database (GSE85591) (Mittal et al., 2017). Based on our analysis, GCN4 binding signals are significantly enriched in the promoter region of genes with higher TE in starvation but not in aging. In addition, most genes with increased TE in AA starvation but not in aging are upregulated in GCN4 overexpression RNAseq data, marked by the p values as 4.8E-04. (A) GCN4 binding profiling of promoter region of genes that are highly translated only in starvation but not in aging. P value is calculated by wilcoxon test. (B) Barplots of number of genes that are bound by GCN4 or induced during GCN4 overexpression. P values are calculated by fisher exact test.
Figure 5
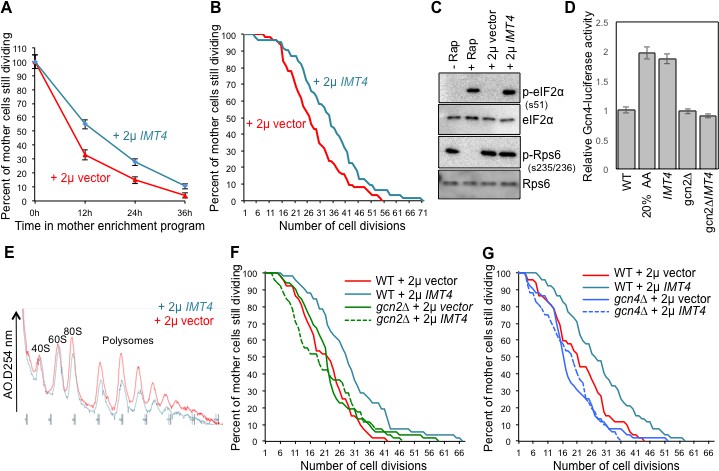
Overexpressing a tRNA activates Gcn2 and extends lifespan.
(A) Replicative lifespan analysis by plating at the indicated times in the MEP, for the wild type cells (ZHY2) harboring the plasmid pRS423-IMT4 or empty pRS423 vector. Average and standard deviation of three independent experiments are shown. (B) Replicative lifespan analysis for the wild type cells (ZHY2) harboring the plasmid pRS423-IMT4 or empty pRS423 vector. (C) Comparison of eIF2α and Rps6 phosphorylation in the same strains as used in B. Wild type cells with 200 nm rapamycin treatment for two hours or without treatment are shown as controls. (D) Expression of Gcn4-luciferase fusion with 20% of the normal level of amino acids (to induce Gcn4) in comparison to wild type (ZHY2) or gcn2Δ cells (ZHY8) harboring the plasmid pRS423-IMT4 or empty pRS423 vector as indicated. Averages and standard deviation are plotted of three independent experiments. (E) Polysome profiling using the same number of cells from the strains used in A. (F) Replicative lifespan analysis for BY4742 or BY4742gcn2∆ strains harboring the plasmid pRS423-IMT4 or empty pRS423 vector. 2-tail Mann-Whitney test: WT +2µ vector vs WT +2µ IMT4 p=0.00072; all other differences are not significant. (G) Replicative lifespan analysis for BY4742 or BY4742gcn4∆ harboring the plasmid pRS423-IMT4 or empty pRS423 vector. 2-tail Mann-Whitney test: WT +2µ vector vs WT +2µ IMT4 p=0.000614; all other differences are not significant.
Figure 6
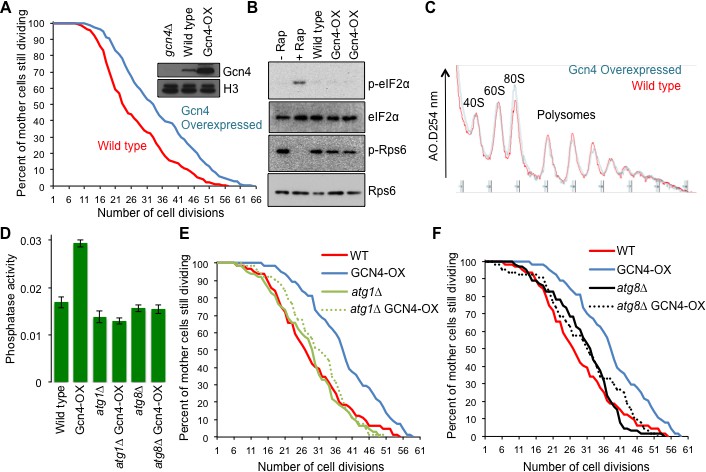
Overexpressing Gcn4 extends lifespan in a manner dependent on autophagy, without reducing global protein synthesis.
(A) Replicative lifespan analysis for the wild type cells (strain F113) or with integration of the Gcn4 uORF deletion mutant (ZHY12). 2 tailed Mann-Whitney test p<0.00001. Inset shows Gcn4 protein levels in the indicated strains. (B) As for Figure 5C, using the strains used in A. (C) As for Figure 5E, using the strains used in A. (D). Analysis of autophagy using strains: WT (WLY176), GCN4-OX (ZSY2119), atg1∆ (WLY192), atg1∆ GCN4-OX (ZSY21113), atg8∆ (ZSY2117) and atg8∆ GCN4-OX (ZSY2118). (E) Replicative lifespan analysis for the indicated isogenic strains listed in D. 2 tailed Mann-Whitney tests: WT vs GCN4-OX p<0.00001. The difference between WT, atg1∆ and atg1∆ GCN4-OX were not significantly different. (F) Replicative lifespan analysis for the indicated isogenic strains, listed in D. 2 tailed Mann-Whitney tests: WT vs GCN4-OX p<0.00001. The difference between WT, atg8∆ and atg8∆ GCN4-OX were not significantly different.
Figure 7 with 1 supplement
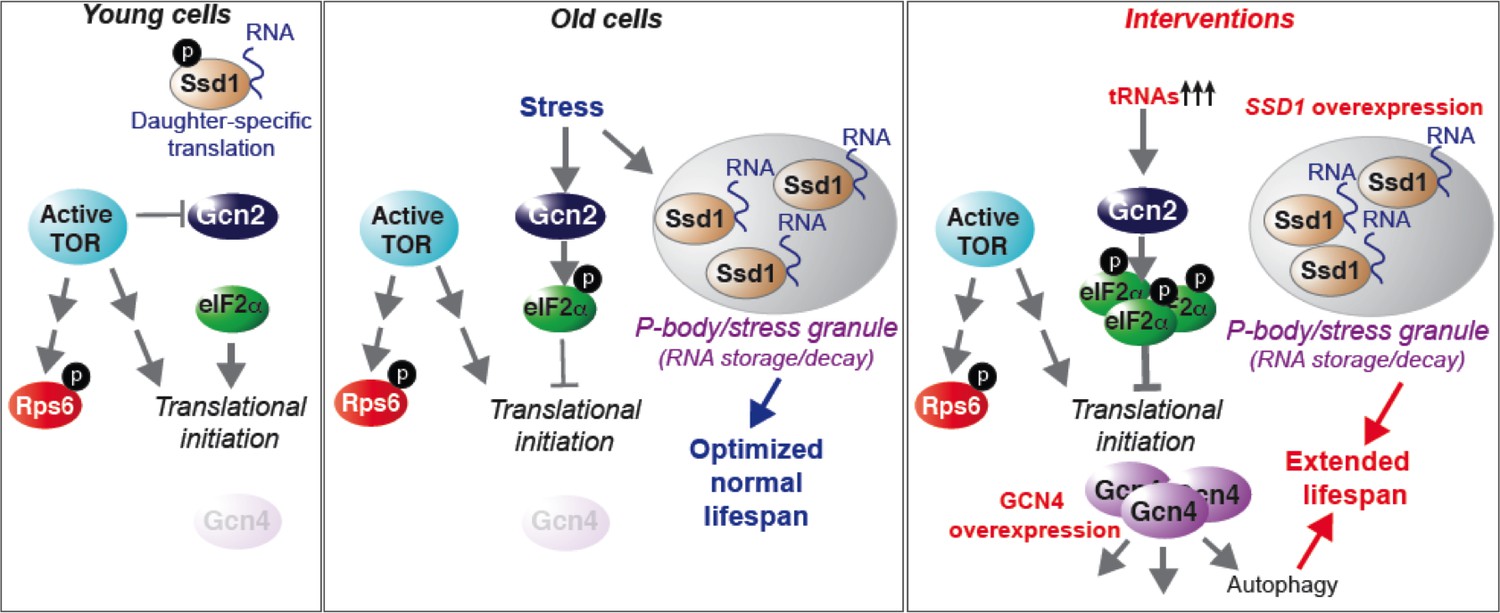
Model summarizing our results, as described in the text.
See also Figure 7—figure supplement 1.
Figure 7—figure supplement 1

Amino acid depletion induces P bodies and induces Ssd1.
(A) ZHY9 strain expressing Lsm1 with a C-terminal GFP tag was stained with DAPI in synthetic medium of 2% glucose (control), 0.05% glucose, and 2% glucose with 20% amino acids mixtures. (B) Quantitation of the percentage of the cells with Lsm1-GFP foci. An average of 100 cells in each condition were examined. The average and standard deviation of independent triplicate experiments is shown. (C) HA-tagged Ssd1 is induced by amino acid depletion. Two independent repeats are shown. Western blot analysis detects the HA tagged Ssd1 level change during amino acid starvation. Cells which were not tagged with HA serve as a control. Rad52 serves as a loading control.
Additional files
-
Supplemental file 1
Supplemental Table Legends, supplemental table 2 (yeast strains) and supplemental table 3 (plasmids).
- https://doi.org/10.7554/eLife.35551.021
-
Supplemental file 2
Supplemental Table 1.
Ribo-seq data during aging. The complete list of sorted genes including their gene expression values and translation efficiency calculations.
- https://doi.org/10.7554/eLife.35551.022
-
Transparent reporting form
- https://doi.org/10.7554/eLife.35551.023
Download links
A two-part list of links to download the article, or parts of the article, in various formats.
Downloads (link to download the article as PDF)
Open citations (links to open the citations from this article in various online reference manager services)
Cite this article (links to download the citations from this article in formats compatible with various reference manager tools)
Ssd1 and Gcn2 suppress global translation efficiency in replicatively aged yeast while their activation extends lifespan
eLife 7:e35551.
https://doi.org/10.7554/eLife.35551


