SAC1 degrades its lipid substrate PtdIns4P in the endoplasmic reticulum to maintain a steep chemical gradient with donor membranes
- University of Pittsburgh School of Medicine, United States
Figures
Figure 1
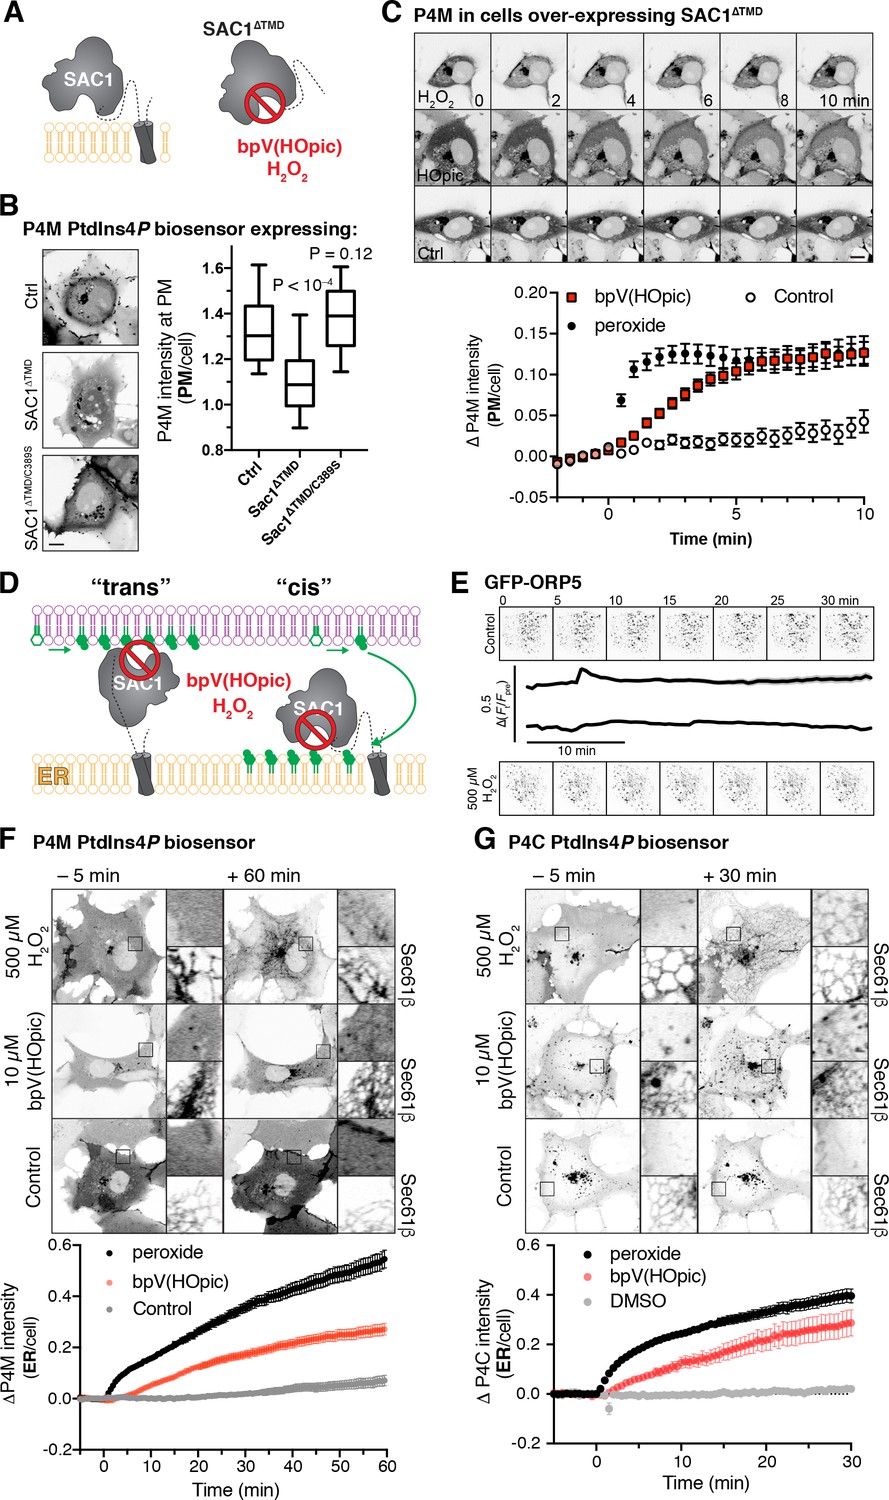
Inhibition of SAC1 causes PtdIns4P accumulation in the ER.
(A) A soluble fragment of SAC1 (SAC1∆TMD) is inhibited by peroxide and bpV(HOpic). (B) SAC1 expression depletes PM PtdIns4P. COS-7 cells transfected with GFP-P4M and either FKBP-mCherry (Ctrl), SAC1∆TMD-FKBP-mCherry or catalytically inactive SAC1∆TMD/C389S-FKBP-mCherry were imaged live by confocal microscopy. Representative images are shown (bar = 10 µm). The graph shows P4M intensity at the plasma membrane (defined by CellMask deep red dye) normalized to total cell intensity; box and whisker plot shows quartiles and 5–95 percentiles of 90 cells from three independent experiments. P values derive from Dunn’s multiple comparison test compared to Ctrl after a Kruskal-Wallis test (p<10–4). (C) Peroxide and bpV(HOpic) inhibit SAC1 in live cells. COS-7 cells were transfected with P4M and SAC1∆TMD as in B and imaged by time-lapse confocal microscopy. 500 µM peroxide or 10 µM bpV(HOpic) were added at time 0. P4M intensity was quantified as in B. Data are means ± s.e. of 44 or 45 cells from four independent experiments. Scale bar = 10 µm. (D) Predicted PtdIns4P accumulation for ‘cis’ and ‘trans’ operation of SAC1. (E) Peroxide does not disrupt ORP5 localization at ER-PM MCS. Images show TIRF images of COS-7 cells expressing GFP-ORP5 at the indicated times. Traces are means with s.e. shaded for 31–32 cells from three independent experiments. (F–G) SAC1 inhibitors cause PtdIns4P accumulation in the ER. Time-lapse images of representative COS-7 cells expressing GFP-P4M (F) or GFP-P4C (G) and treated with inhibitors at time 0. The insets are 10 µm squares, and are expanded at right and show PtdIns4P accumulation relative to a co-expressed ER marker, iRFP-Sec61β. Graphs show P4M intensity at the ER (defined by iRFP-Sec61β) normalized to total cell intensity; data are means ± s.e. of 38–41 (F) or 29–30 (G) cells from three (G) or four (F) independent experiments.
-
Figure 1—source data 1
Data for panel 1B.
- https://doi.org/10.7554/eLife.35588.003
-
Figure 1—source data 2
Data for panel 1C.
- https://doi.org/10.7554/eLife.35588.004
-
Figure 1—source data 3
Data for panel 1E.
- https://doi.org/10.7554/eLife.35588.005
-
Figure 1—source data 4
Data for panel 1F.
- https://doi.org/10.7554/eLife.35588.006
-
Figure 1—source data 5
Data for panel 1G.
- https://doi.org/10.7554/eLife.35588.007
Figure 2
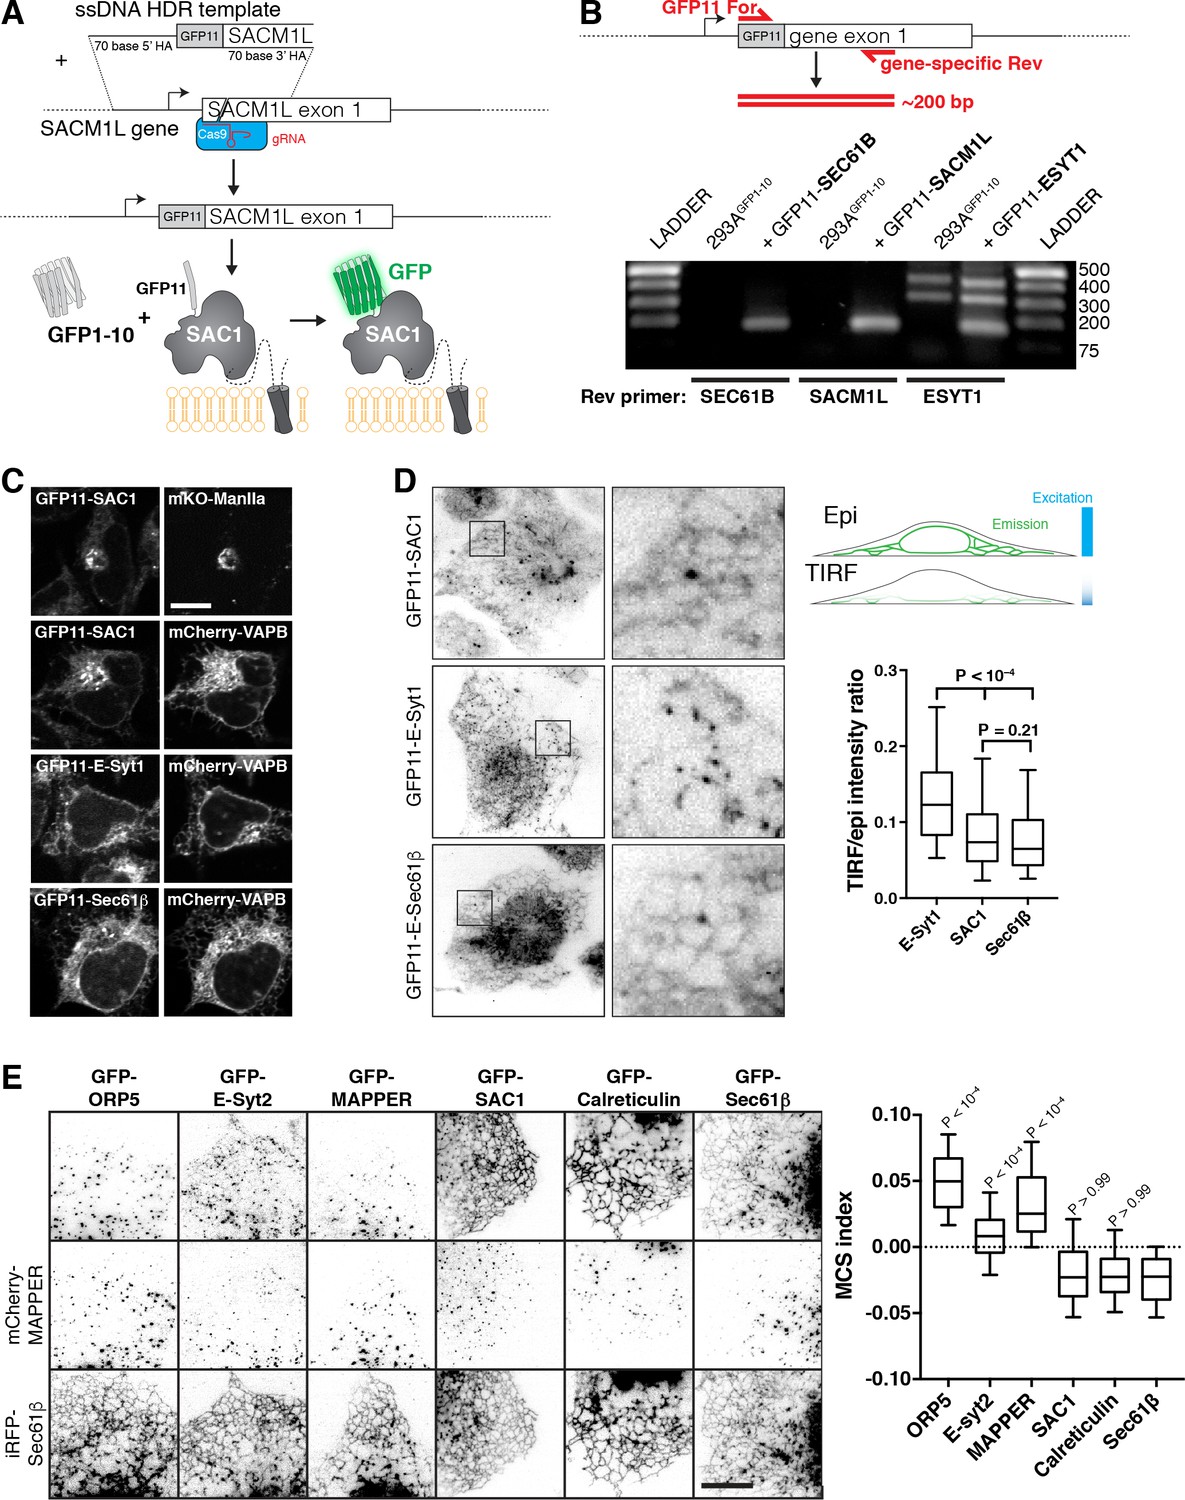
Localization of SAC1 relative to ER-PM MCS and ER proteins.
(A) Strategy for tagging endogenous SAC1: a guide RNA is complexed with Cas9 protein and electroplated into HEK-293A cells with a short single-stranded homology-directed repair (HDR) template. This adds a short tag encoding the 11th strand of the GFP beta barrel. When expressed, this strand assembles with co-expressed GFP1-10 to make functional GFP. (B) Specificity of genomic tagging. 293A cells stably over-expressing GFP1-10 and edited with the indicated GFP11 tags were genotyped with GFP11 specific forward primers and a gene-specific reverse primer located ~200 bp downstream in exon 1. (C) Confocal images of GFP11 gene edited cells co-expressing mKo-Manosidase II as a cis/medial Golgi marker, or mCherry-VAPB as an ER marker. (D) E-Syt1 shows enrichment at the PM relative to SAC1 and Sec61β. Cells were imaged in both TIRF and epi-illumination, and the fluorescence intensity ratio of the two images was calculated. Boxes represent quartiles, whiskers 5–95 percentile. P values are from Dunn’s Multiple Comparisons following a Kruskall-Wallis test (p<10–4). Data are from 180 (E-Syt1), 234 (SAC1) or 246 (Sec61β) cells imaged across five independent experiments. Insets = 10 µm. (E) Expressed SAC1 is not enriched at ER-PM MCS in COS-7 cells. TIRF images of COS-7 cells transfected for 24 hr with the indicated GFP-tagged plasmid and mCherry-MAPPER to label ER-PM MCS along with iRFP-Sec61β to label total ER. Scale bar = 10 µm. The MCS index is the ‘difference of differences’ between GFP and iRFP-Sec61β as well as GFP and MAPPER signals. P values are from Dunn's Multiple Comparison test relative to GFP-Sec61β, run as a post-hoc to a Kruskal-Wallis test (p<10–4). Box and whiskers are quartiles with 10–90 percentiles of 90 (Sec61β), 92 (Calreticulin), 91 (SAC1), 93 (MAPPER) or 92 (E-Syt2, ORP5) cells imaged across three independent experiments.
-
Figure 2—source data 1
Data for panel 2D.
- https://doi.org/10.7554/eLife.35588.009
-
Figure 2—source data 2
Data for panel 2E.
- https://doi.org/10.7554/eLife.35588.010
Figure 3
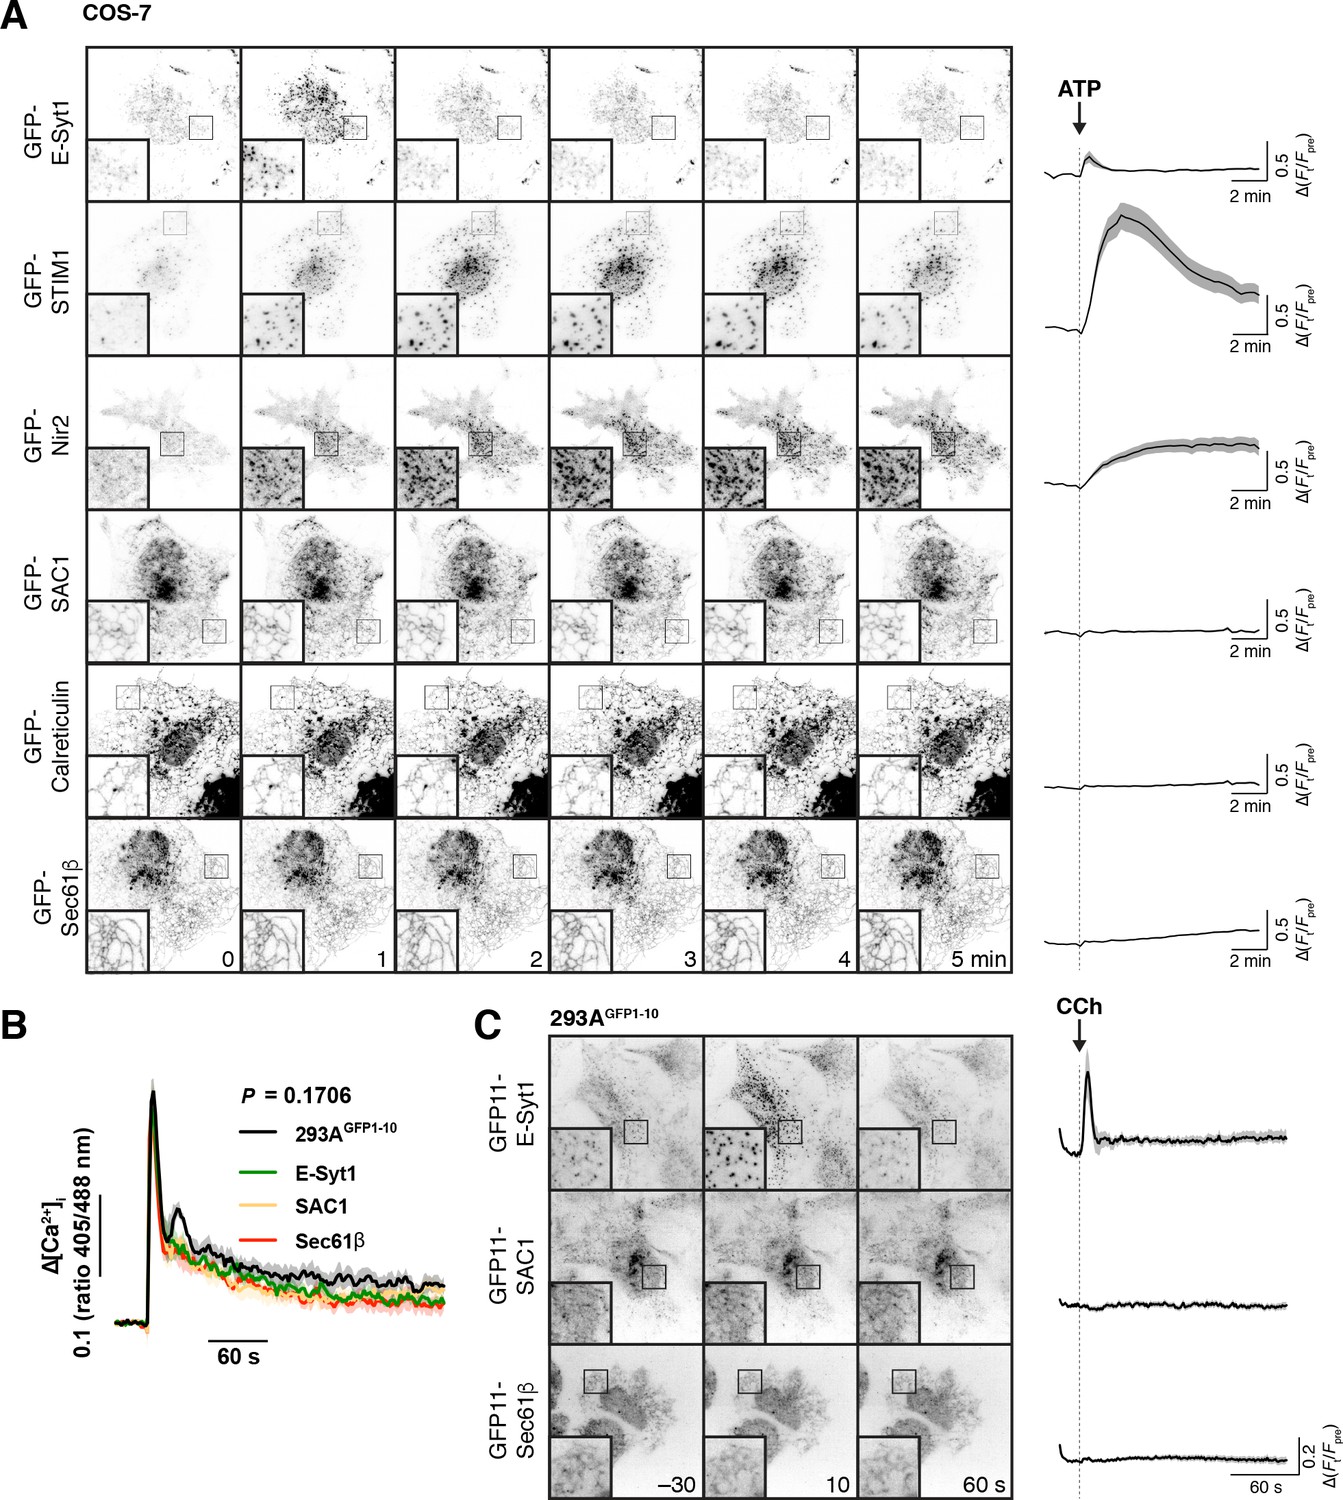
Recruitment of proteins to ER-PM MCS.
(A) Transfected SAC1 does not dynamically re-distribute to ER-PM MCS in COS-7 cells. Time-lapse TIRF microscopy of COS-7 cells transfected with the indicated GFP-tagged proteins for 6–7 hr. Cells were stimulated with 100 µM ATP as indicated. Insets = 10 µm. The traces at right show ∆(Ft/Fpre) and are means ± s.e. of 30 (Sec61β, SAC1, Calreticulin), 27 (STIM1), 29 (ESyt1) or 20 (Nir2) cells imaged across three independent experiments. (B) Gene edited alleles do not perturb calcium signals. Edited 293AGFP1-10 cells were loaded with Fura-red and the ratio of fluorescence intensity with respect to 405 and 488 nm excitation was measured. Cells were stimulated with carbachol (CCh) at 30 s to activate phospholipase C signaling. Data are grand means of four experiments (shaded regions represent s.e.). The P value represents results of a two-way ANOVA comparing cell lines. (C) Endogenous SAC1 does not recruit to ER-PM contact sites in 293AGFP1-10 cells. Images show representative gene-edited cells at the indicated times during time-lapse TIRF imaging. Carbachol was added to stimulate phospholipase C signaling at time 0. Images are averages of 5 frames acquired over 10 s to improve signal to noise. Traces represent mean change in fluorescence intensity (normalized to pre-stimulation levels) with s.e. of 40 (E-Syt1), 38 (SAC1) or 37 (Sec61β) cells imaged across five independent experiments.
-
Figure 3—source data 1
Data for panel 3A.
- https://doi.org/10.7554/eLife.35588.012
-
Figure 3—source data 2
Data for panel 3B.
- https://doi.org/10.7554/eLife.35588.013
-
Figure 3—source data 3
Data for panel 3C.
- https://doi.org/10.7554/eLife.35588.014
Figure 4
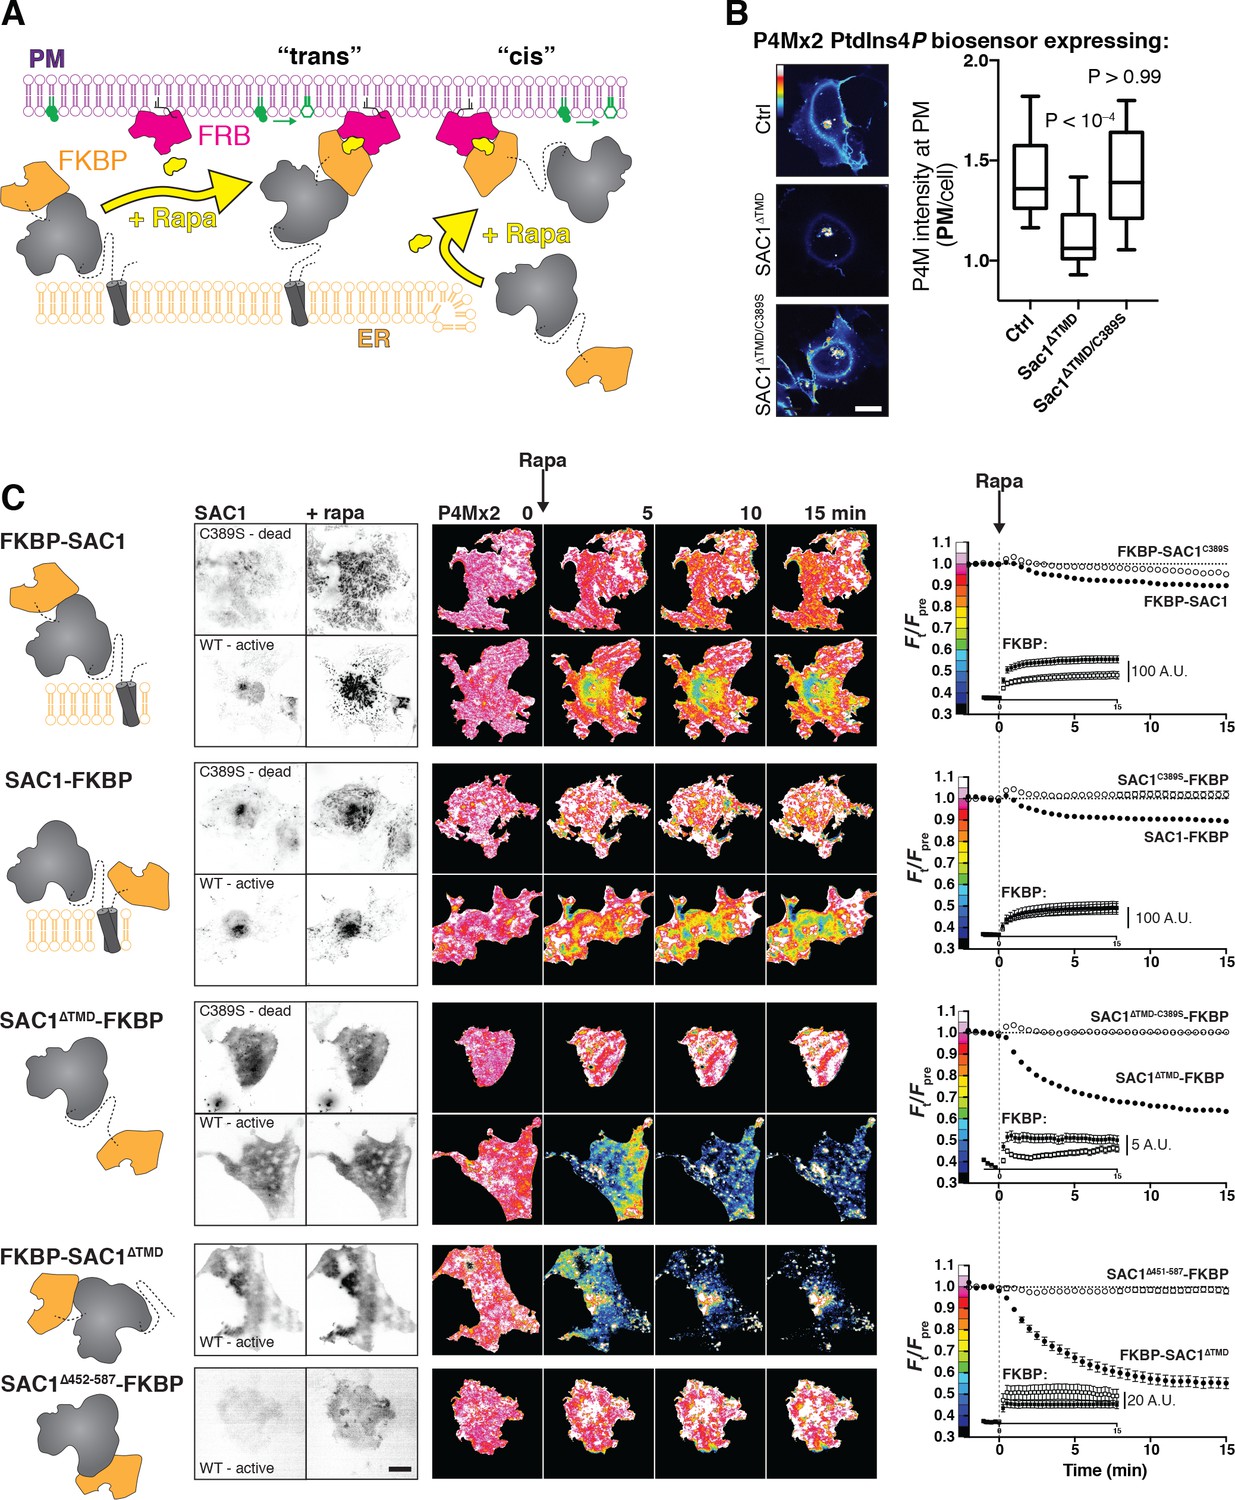
SAC1 is much more active at the PM in ‘cis’.
(A) Strategy to recruit SAC1 to the PM in ‘cis’ or ‘trans’ using the FRB/FKBP12 heterodimerization system. (B) PM PtdIns4P is still detectable at the PM with P4M × 2 after transfection with SAC1∆TMD. COS-7 cells transfected with GFP-P4M and either FKBP-mCherry (Ctrl), SAC1∆TMD-FKBP-mCherry or catalytically inactive SAC1∆TMD/C389S were imaged live by confocal microscopy. Representative images are shown (bar = 20 µm). The graph shows P4M intensity at the plasma membrane (defined by CellMask deep red dye) normalized to total cell intensity; box and whisker plot shows quartiles and 5–95 percentiles of 90 cells from three independent experiments. P values derive from Dunn's multiple comparison test compared to Ctrl after a Kruskal-Wallis test (p<10–4). (C) Recruitment of SAC1 to the PM in ‘cis’ is far more effective in depleting PtdIns4P than it is in ‘trans’. TIRF images of COS-7 cells transfected with a Lyn11-FRB-iRFP PM recruiter, the indicated mCherry-tagged SAC1-FKBP or FKBP-SAC1, and GFP-P4M × 2. Graphs show means ± s.e. Images are representative of n cells, x independent experiments: 57, 6 (FKBP-SAC1); 41, 4 (FKBP-SAC1C389S); 28, 3 (SAC1-FKBP); 30, 3 (SAC1-FKBP); 57, 6 (SAC1-FKBP); 36, 4 (SAC1-FKBP); 26, 3 (FKBP-SAC1); 29, 3 (SAC1∆452-587). Inset graphs show the raw change in signal intensity for the mCherry-FKBP tagged SAC1 chimeras. Images of GFP-P4M × 2 are normalized to the mean pre-stimulation pixel intensity, that is Ft/Fpre with the color coding reflected in the graph y-axis. Scale bar = 20 µm.
-
Figure 4—source data 1
Data for panel 4B.
- https://doi.org/10.7554/eLife.35588.016
-
Figure 4—source data 2
Data for panel 4C.
- https://doi.org/10.7554/eLife.35588.017
-
Figure 4—source data 3
Data for panel 4C (insets).
- https://doi.org/10.7554/eLife.35588.018
Figure 5

An extended helical linker confers ‘trans’ activity to SAC1.
(A) Helical linkers (HL) added to FKBP-SAC1 at the end of the first transmembrane domain. Each helical repeat consists of the amino acids EAAAR, expected to form a helix approximately 0.75 nm long. (B) TIRF imaging of PtdIns4P before and after direct recruitment of SAC1 to ER-PM MCS. TIRF images of COS-7 cells transfected with a Lyn11-FRB-iRFP PM recruiter, the indicated mCherry-tagged SAC1-FKBP and GFP-P4M × 2. Images are representative of 30 cells from three independent experiments. Images of GFP-P4M × 2 are normalized to the mean pre-stimulation pixel intensity, that is Ft/Fpre with the color coding reflected in the graph y-axis of D. Scale bar = 20 µm. (C) Helical linkers do not impair recruitment efficiency of FKBP-SAC1. (D) FKBP-SAC1-HLx8 and -HLx10 have ‘trans’ activity. Graphs in C and D show fluorescence intensity in the TIRF footprint of each cell for mCherry-tagged FKBP-SAC1 or GFP-tagged P4M × 2, respectively. Data are means ± s.e., 30 cells for all except WT, with 57 cells. Data for the wild-type FKBP-SAC1 is re-plotted from Figure 4.
-
Figure 5—source data 1
Data for panel 5C.
- https://doi.org/10.7554/eLife.35588.020
-
Figure 5—source data 2
Data for panel 5D.
- https://doi.org/10.7554/eLife.35588.021
Figure 6
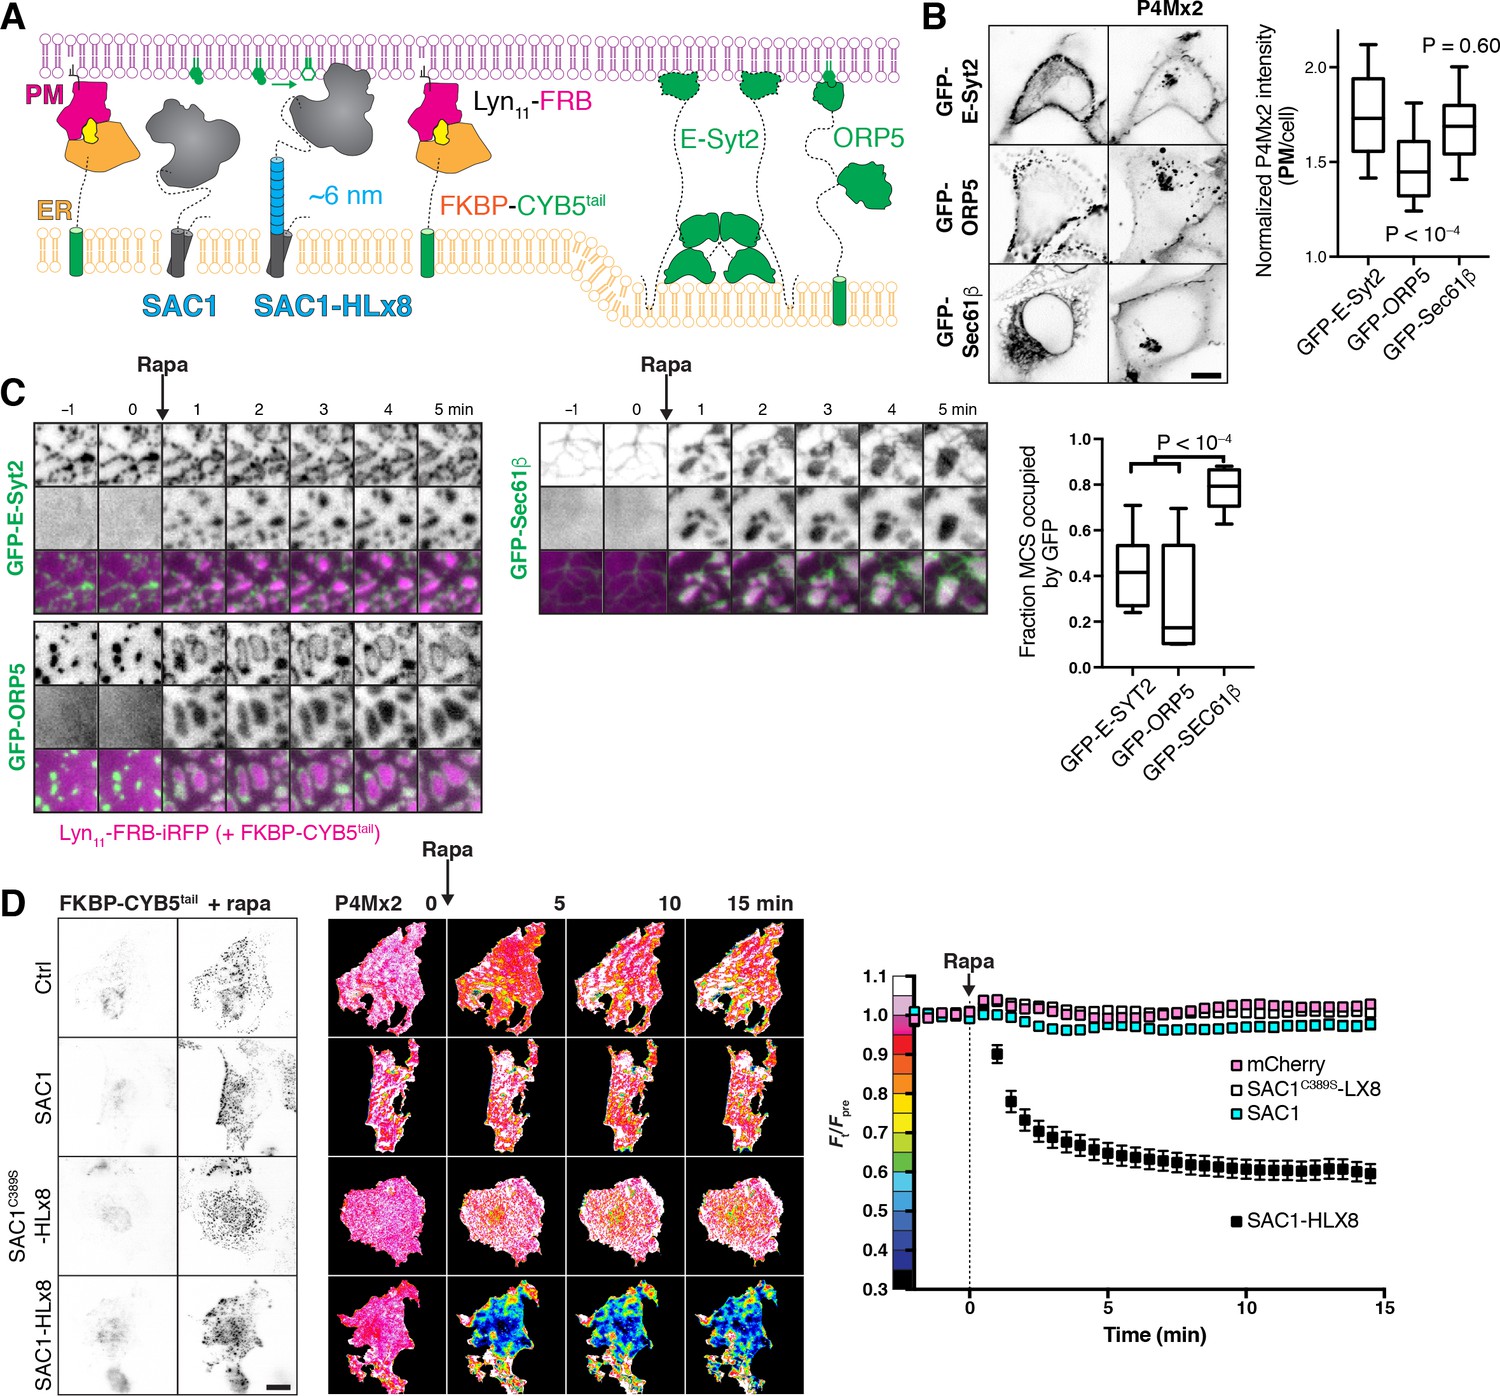
An extended helical linker is required for ‘trans’ activity of SAC1 at induced ER-PM MCS.
(A) Induction of artificial ER-PM MCS using rapamycin-induced dimerization of PM Lyn11-FRB and ER FKBP-CYB5Atail. (B) Over-expression of E-Syt2 does not deplete PtdIns4P. COS-7 cells over-expressing GFP-tagged E-Syt2, ORP5 along with mCherry-P4M × 2; scale bar = 10 µm. Graph shows P4M intensity at the plasma membrane (defined by CellMask deep red dye) normalized to total cell intensity; box and whisker plot shows quartiles and 5–95 percentiles of 89–90 cells from three independent experiments. P values derive from Dunn’s multiple comparison test compared to Ctrl after a Kruskal-Wallis test (p<10–4). (C) FKBP-CYB5tail induces narrower contact sites than those occupied by E-Syt2 or ORP5. COS-7 cells expressing the indicated GFP-fusion protein, Lyn11-FRB-iRFP or mCherry-FKBP-CYB5tail (not shown), dimerization induced with Rapa as indicated. Graph shows the fraction of induced contact sites occupied by GFP-fluorescence after 5 min of rapa treatment; box and whisker plot shows quartiles and 5–95 percentiles of 14–19 cells from four independent experiments. P values derive from Dunn’s multiple comparison test compared to Ctrl after a Kruskal-Wallis test (p<10–4). (D) An extended helical linker is required for robust ‘trans’ activity of SAC1 at ER-PM MCS. Images of TagBFP2-tagged FKBP-CYB5 and GFP-P4M × 2 in COS-7 cells co-transfected with iRFP-tagged Lyn11-FRB and the indicated mCherry-tagged SAC1 construct, or mCherry alone as control. Images of GFP-P4M × 2 are normalized to the mean pre-stimulation pixel intensity, that is Ft/Fpre with the color coding reflected in the graph y-axis. Scale bar = 20 µm. Graphs show the fluorescence intensity of GFP-P4M × 2 in the TIRF footprint of each cell (means ± s.e., 29–30 cells from three independent experiments) normalized to the mean pre-stimulation level (Fpre).
-
Figure 6—source data 1
Data for panel 6B.
- https://doi.org/10.7554/eLife.35588.023
-
Figure 6—source data 2
Data for panel 6C.
- https://doi.org/10.7554/eLife.35588.024
-
Figure 6—source data 3
Data for panel 6D.
- https://doi.org/10.7554/eLife.35588.025
Author response image 1
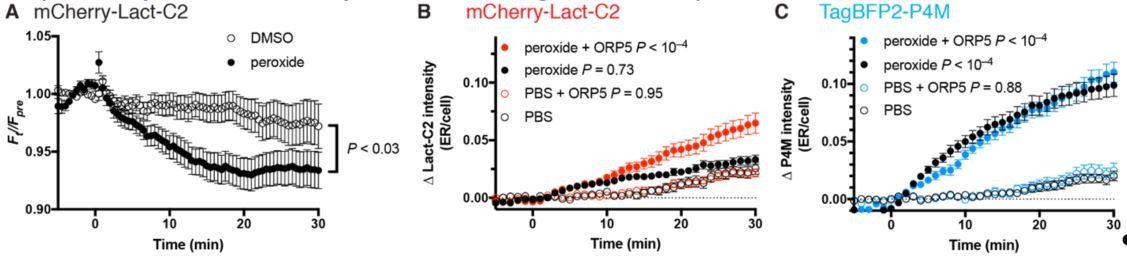
Effects of SAC1 inhibition (with 500 µM peroxide) on PtdSer probe Lact-C2.
(A) COS-7 transfected with mCherry-Lact-C2 were treated with vehicle or 500 µM DMSO during imaging by TIRF microscopy. Data are means ± s.e. of 32 cells from two independent experiments. P value is from a two-way repeated measures ANOVA. (B) mCherry-Lact-C2 and (C) TagBFP2-P4M were co-transfected into the same cells with iRFP-Sec61β (as an ER marker) and either GFP-ORP5 or GFP-calreticulin as control. Cells were imaged by confocal microscopy and assimilation of the probes fluorescence in the ER was measured. Data are means ± s.e. of 32-35 cells from three independent experiments. P values are derived from Sidak’s multiple comparison test after two-way repeated measures ANOVA (P < 10–4 for both).
Author response image 2
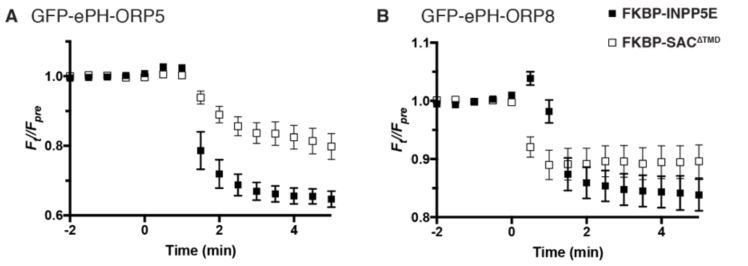
Dissociation of ePH-ORP5 and -ORP8 by PtdIns4P or PtdIns(4,5)P2 depletion.
COS-7 cells were transfected with GFP-tagged ePH probes, Lyn11-FRB-iRFP recruiter and mCherry-FKBP-SAC1∆TMD or -INPP5E as indicated, and imaged by TIRF microscopy. Recruitment of enzymes was induced by rapamycin addition at time 0. Data are means ± s.e. of 6-10 cells from a single experiment.
Author response image 3
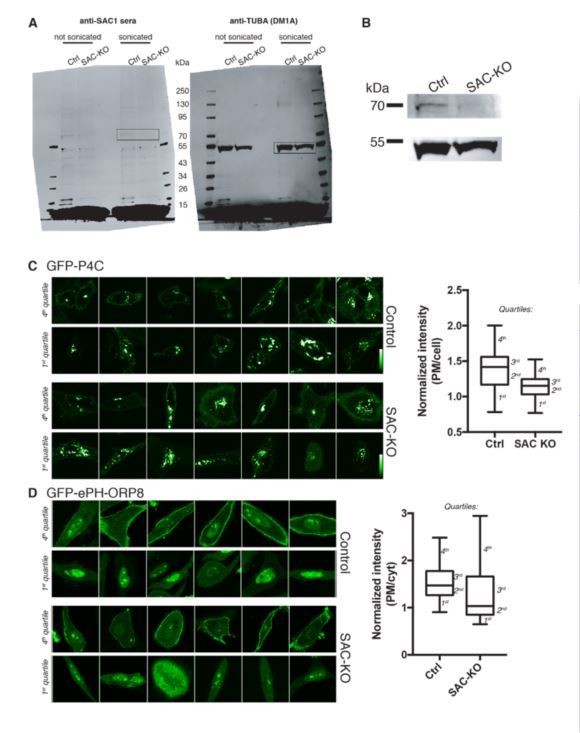
CRISPR/Cas9mediated acute kick-out of SAC1.
(A) Western Blot of duplicate lysates from CRISPR/Cas9 plasmid transfected cells (selected with puromycin) after 72 h of knock down were probes with both SAC1 antisera and monoclonal anti-tubulin antibody DM1A. One sample was sonicated after lysis. The boxed region in blots is expanded in (B). Images of GFP-P4C (C) or GFPePH-ORP8 (D) from the 1st (1-25th percentile) or 4th (75-100th percentile) cohort of control or CRISPR/Cas9 plasmid transfected cells. The Box plots show mean and interquartile range, and the whiskers the list and 4th quartiles of 29 (C) or 25-32 (D) cells from a single experiment. Intensity at the PM was measured using a CellMask-derived mask as described in the manuscript.
Tables
Table 1
Plasmids used in this study.
Genes are human unless otherwise stated
| Plasmid | Backbone | Insert | Ref |
|---|---|---|---|
| APX1-GFP1-10 | APX1 | super-folder GFP | This study |
| CDV-hyPBase | pigg | piggyBAC transposase | (Yusa et al., 2011) |
| NES-EGFP-P4M × 1 | pEGFP-C1 | X.leavis map2k1.L(32-44):EGFP:L. pneumophila SidM(546-647) | This study |
| FKBP-mCherry | pmCherry-N1 | FKBP1A(isoform a, 3–108):mCherry | This study |
| SAC1∆TMD-FKBP-mCherry | pmCherry-N1 | SACM1L(1-521):FKBP1A(3-108):mCherry | This study |
| SAC1C389S∆TMD-FKBP-mCherry | pmCherry-N1 | SACM1L(C389S; 1–521):FKBP1A(3-108):mCherry | This study |
| iRFP-Sec61β | piRFP-C1 | iRFP:SEC61B | This study |
| mKO-ManII | pmKO-N1 | Kusabira Orange 2:Man2a(1-102) | Tamas Balla |
| mCherry-VAPB | pmCherry-C1 | mCherry:VAPB | This study |
| mCherry-MAPPER | pmCherry-C1 | mCherry:MAPPER | (Chang et al., 2013) |
| EGFP-MAPPER | pEGFP-C1 | EGFP:MAPPER | (Chang et al., 2013) |
| GFP-ORP5 | pEGFP-C1 | EGFP:OSBPL5(isoform a) | (Sohn et al., 2016) |
| GFP-E-Syt2 | pEGFP-C1 | EGFP:ESYT2 | (Giordano et al., 2013) Addgene plasmid #66831 |
| EGFP-SAC1 | pEGFP-C1 | EGFP:SACM1L | (Sohn et al., 2016) |
| mEmerald-N16-Calreticulin | pmEmerald-N1 | mEmerald:CALR | Michael Davidson (Addgene plasmid #54023) |
| GFP-Sec61β | pAcGFP-C1-Sec61β | Aequorea coerulescens GFP:SEC61B | (Voeltz et al., 2006) Addgene plasmid #15108 |
| EGFP-E-Syt1 | pEGFP-C1 | EGFP-ESYT1 | (Giordano et al., 2013) Addgene plasmid #66830 |
| EGFP-STIM1 | pEGFP-C1 | STIM1(isoform 1 1–22):EGFP:STIM1(23–791) | (Várnai et al., 2007) |
| EGFP-Nir2 | pEGFP-N1 | EGFP:PITPNM1(isoform 2) | (Kim et al., 2015) |
| EGFP-P4M × 2 | pEGFP-C1 | EGFP:L. pneumophila SidM(546-647):SidM(546-647) | (Hammond et al., 2014) |
| Lyn11-FRB-iRFP | piRFP-N1 | LYN(1-11):MTOR(2021–2113):iRFP | (Hammond et al., 2014) |
| mCherry-FKBP | pmCherry-C1 | mCherry:FKBP1A(3-108):[GGSA]4GG | (Hammond et al., 2014) |
| mCherry-FKBP-SAC1 | pmCherry-C1 | mCherry:FKBP1A(3-108):[GGSA]4GG:SACM1L | This study |
| mCherry-FKBP-SAC1C389S | pmCherry-C1 | mCherry:FKBP1A(3-108):[GGSA]4GG:SACM1LC389S | This study |
| mCherry-SAC1-FKBP | pmCherry-C1 | mCherry:SACM1L:FKBP1A(3-108) | This study |
| mCherry-SAC1C389S-FKBP | pmCherry-C1 | mCherry:SACM1LC389S:FKBP(3-108) | This study |
| SAC1∆452-587-FKBP-mCherry | pmCherry-N1 | SACM1L(1-451):FKBP1A(3-108):mCherry | This study |
| mCherry-FKBP-SAC1∆TMD | pmCherry-C1 | mCherry:FKBP1A(3-108):[GGSA]4GG:SACM1L(1-521) | This study |
| mCherry-FKBP-SAC1-HLx2 | pmCherry-C1 | mCherry:FKBP1A(3-108):[GGSA]4GG::SACM1L(1-520):[EAAAR]2:SACM1L(521-587) | This study |
| mCherry-FKBP-SAC1-HLx4 | pmCherry-C1 | mCherry:FKBP1A(3-108):[GGSA]4GG::SACM1L(1-520):[EAAAR]4:SACM1L(521-587) | This study |
| mCherry-FKBP-SAC1-HLx6 | pmCherry-C1 | mCherry:FKBP1A(3-108):[GGSA]4GG:SACM1L(1-520):[EAAAR]6:SACM1L(521-587) | This study |
| mCherry-FKBP-SAC1-HLx8 | pmCherry-C1 | mCherry:FKBP1A(3-108):[GGSA]4GG:SACM1L(1-520):[EAAAR]8:SACM1L(521-587) | This study |
| mCherry-FKBP-SAC1-HLx10 | pmCherry-C1 | mCherry:FKBP1A(3-108):[GGSA]4GG:SACM1L(1-520):[EAAAR]10:SACM1L(521-587) | This study |
| mCherry-FKBP-SAC1C389S-HLx8 | pmCherry-C1 | mCherry:FKBP1A(3-108):[GGSA]4GG:SACM1LC389S(1-520):[EAAAR]8:SACM1L(521-587) | This study |
| mCherry | pmCherry-C1 | mCherry | (Hammond et al., 2014) |
| mCherry-SAC1 | pmCherry-C1 | mCherry:SAC1ML | (Sohn et al., 2016) |
| mCherry-SAC1-HLx8 | pmCherry-C1 | mCherryLSACM1L(1-520):[EAAAR]8:SACM1L(521-587) | This study |
| mCherry-SAC1C389S-HLx8 | pmCherry-C1 | mCherry:SACM1LC389S(1-520):[EAAAR]8:SACM1L(521-587) | This study |
| mTagBFP2-FKBP-CYB5Atail | pmTagBFP2-C1 | mTagBFP2:FKBP1A(3-108):[GGSA]4GG:CYB5A(100-134) | This study |
Additional files
-
Transparent reporting form
- https://doi.org/10.7554/eLife.35588.027
Download links
A two-part list of links to download the article, or parts of the article, in various formats.
Downloads (link to download the article as PDF)
Open citations (links to open the citations from this article in various online reference manager services)
Cite this article (links to download the citations from this article in formats compatible with various reference manager tools)
SAC1 degrades its lipid substrate PtdIns4P in the endoplasmic reticulum to maintain a steep chemical gradient with donor membranes
eLife 7:e35588.
https://doi.org/10.7554/eLife.35588


