The CLAVATA receptor FASCIATED EAR2 responds to distinct CLE peptides by signaling through two downstream effectors
- Cold Spring Harbor Laboratory, United States
- Pusan National University, Republic of Korea
- DuPont Pioneer, Agricultural Biotechnology, United States
- University of Massachusetts Amherst, United States
- The University of Sydney, Australia
Figures
Figure 1
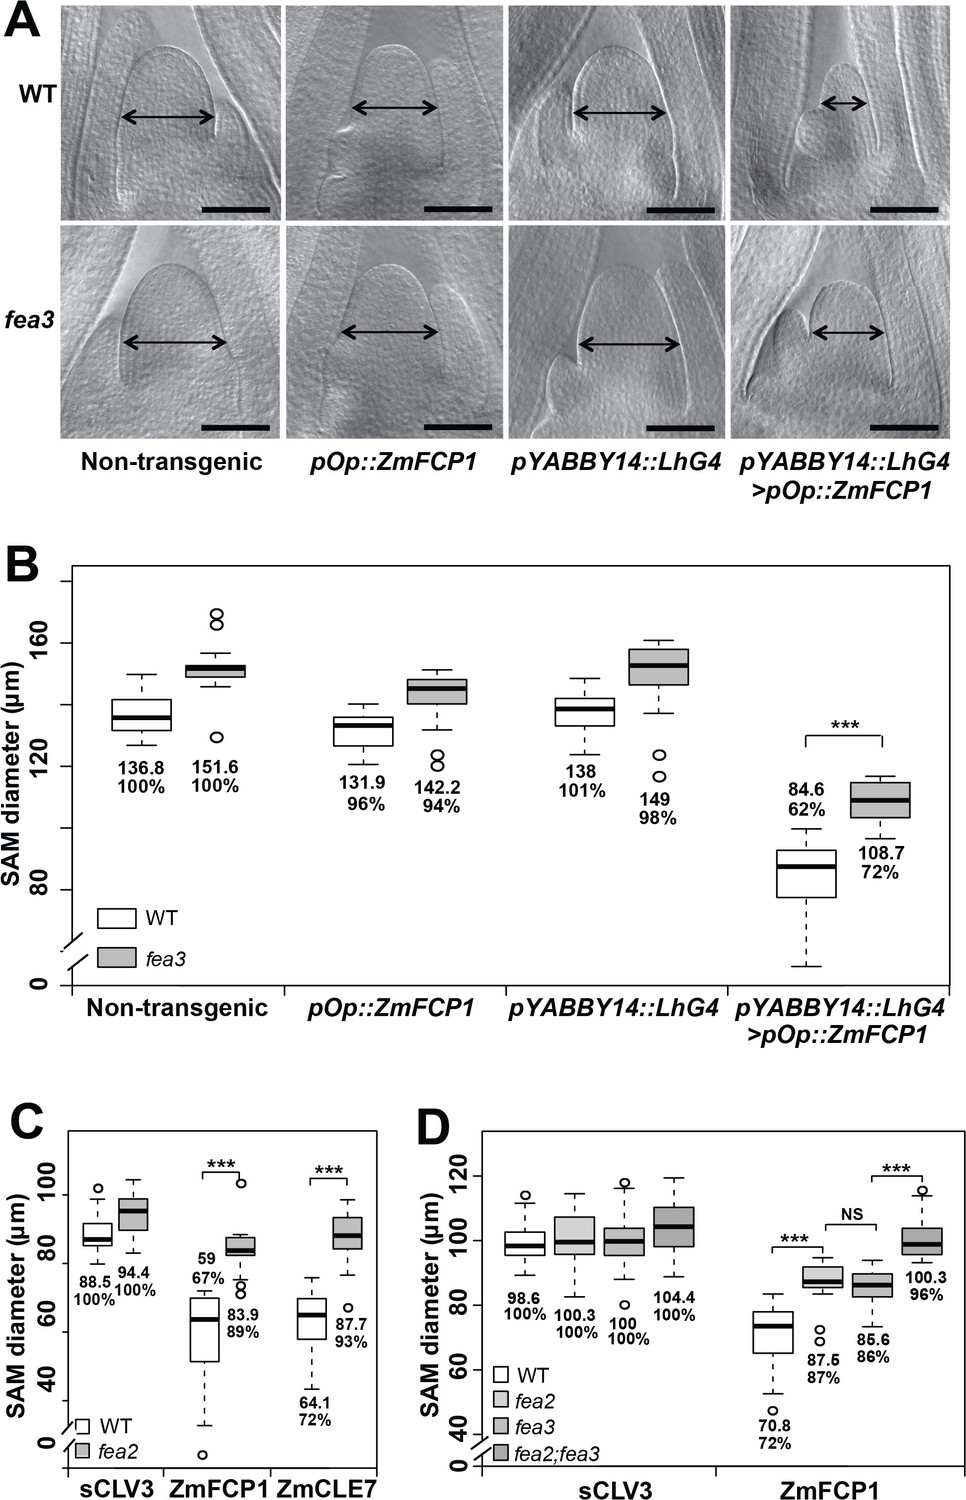
Both fea3 and fea2 mutants are resistant to ZmFCP1 peptide.
(A) Transactivation of ZmFCP1 in primordia using a pYABBY14:LhG4 driver led to a strong reduction in vegetative SAM size as compared to a non-transgenic control, but this effect was only partially rescued in a fea3 mutant background; SAM diameter was quantified (B). In CLE peptide treatments, fea2 mutants were resistant to ZmFCP1, as well as to ZmCLE7 (C), and fea3;fea2 double mutants showed additive resistance to ZmFCP1, restoring SAM size to normal (D). Scale bars; 100 μm in A. n = 20 (B, C) and 30 (D) plants for each genotype. Data in B, C and D are shown by box plots. The mean values as well as the relative % to each untreated control are listed for each genotype. The untreated controls are set to 100%: '***': P value < 0.0001, two-tailed, two-sample t test. ‘NS’: not significant.
-
Figure 1—source data 1
CLE peptide treatments of fea2;fea3 a segregating population.
- https://doi.org/10.7554/eLife.35673.004
Figure 2 with 5 supplements
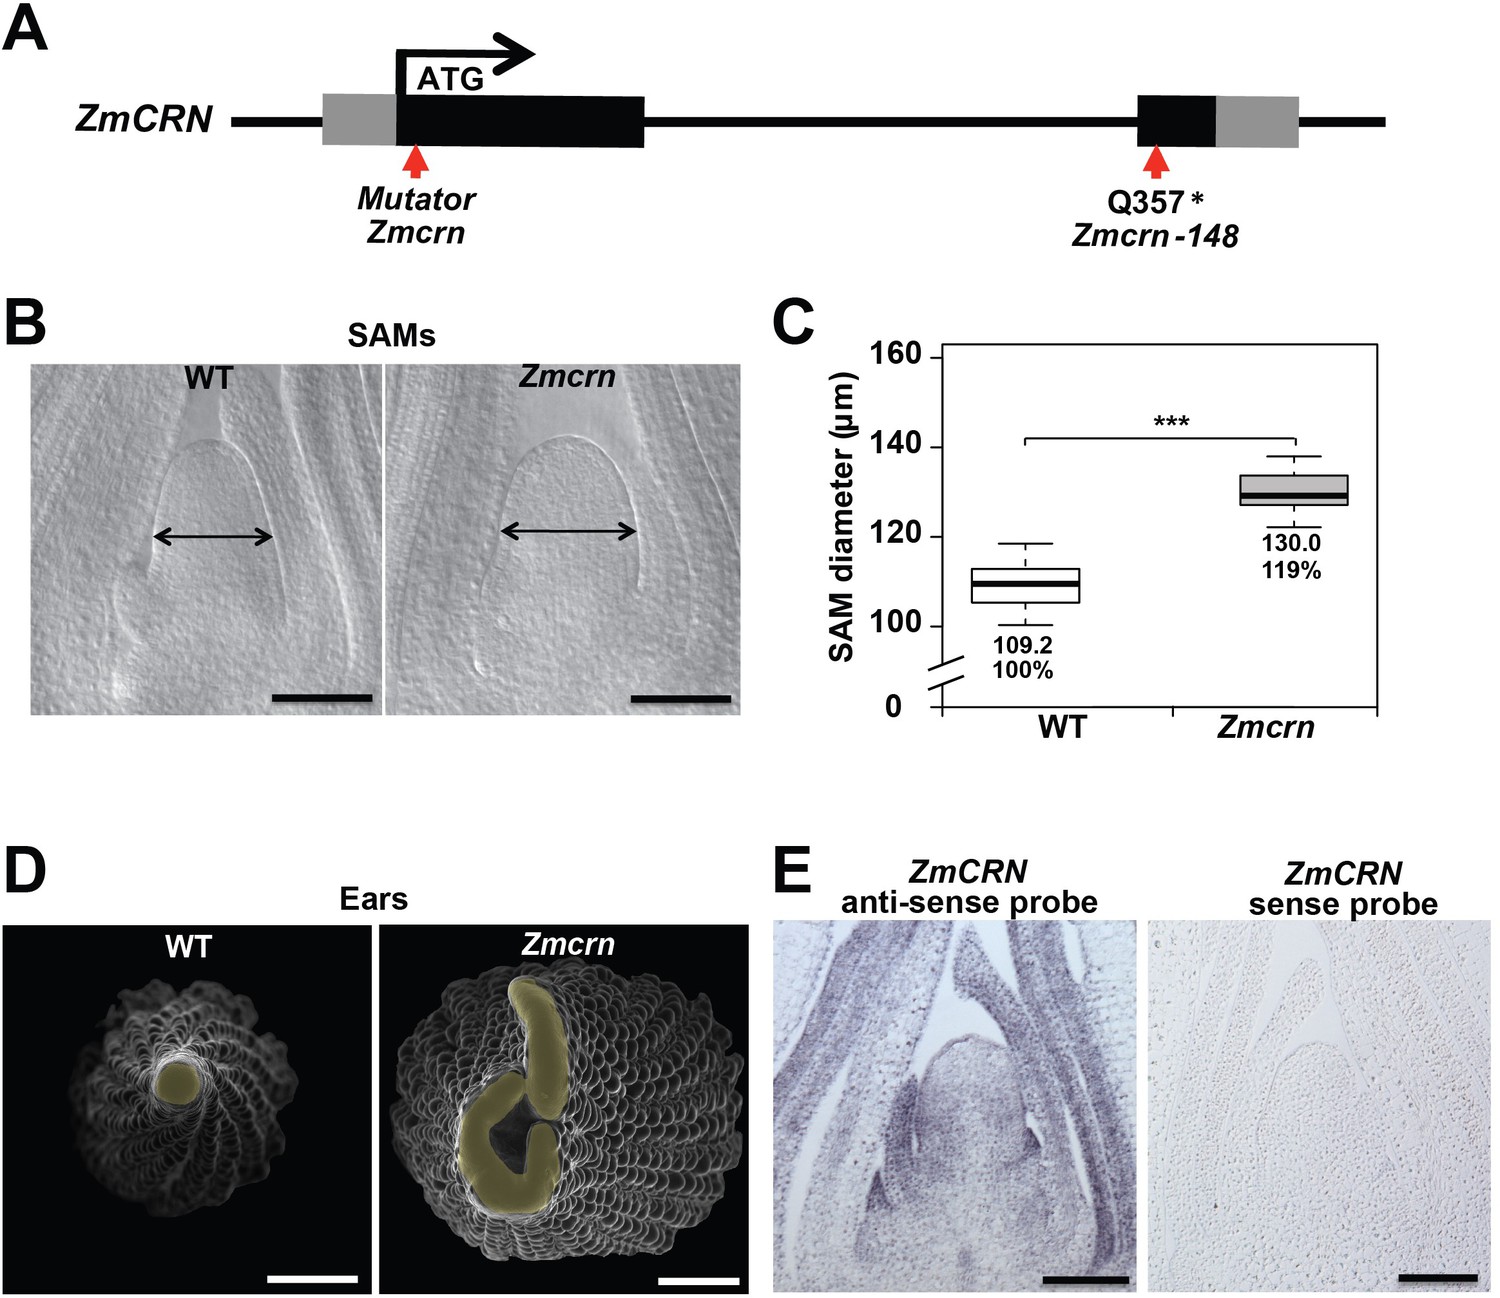
Zmcrn mutants develop fasciated ears.
(A) Schematic of the Zmcrn mutant alleles. The arrows indicate the position of the Mutator transposon insertion and premature stop codon mutation. (B) Cleared SAMs from wild type (WT) and Zmcrn plants. The Zmcrn SAM has a larger diameter (double-headed arrows), SAM diameter was quantified (C). (D) Scanning electron microscopy images of WT and Zmcrn ear primordia (inflorescence meristems in yellow). The Zmcrn ear shows an enlarged and fasciated inflorescence meristem. (E) In-situ hybridization showing ZmCRN expression throughout the SAM, with higher expression in peripheral zone and leaf primordia. Scale bar: 100 μm in B and E, 500 μm in D. n = 30 (C) plants for each genotype. Data in C are shown by box plots. The mean values as well as the relative % to the WT control are listed. ‘***': P value < 0.0001, two-tailed, two-sample t test.
-
Figure 2—source data 1
SAM size of Zmcrnin a segregating population.
- https://doi.org/10.7554/eLife.35673.011
Figure 2—figure supplement 1
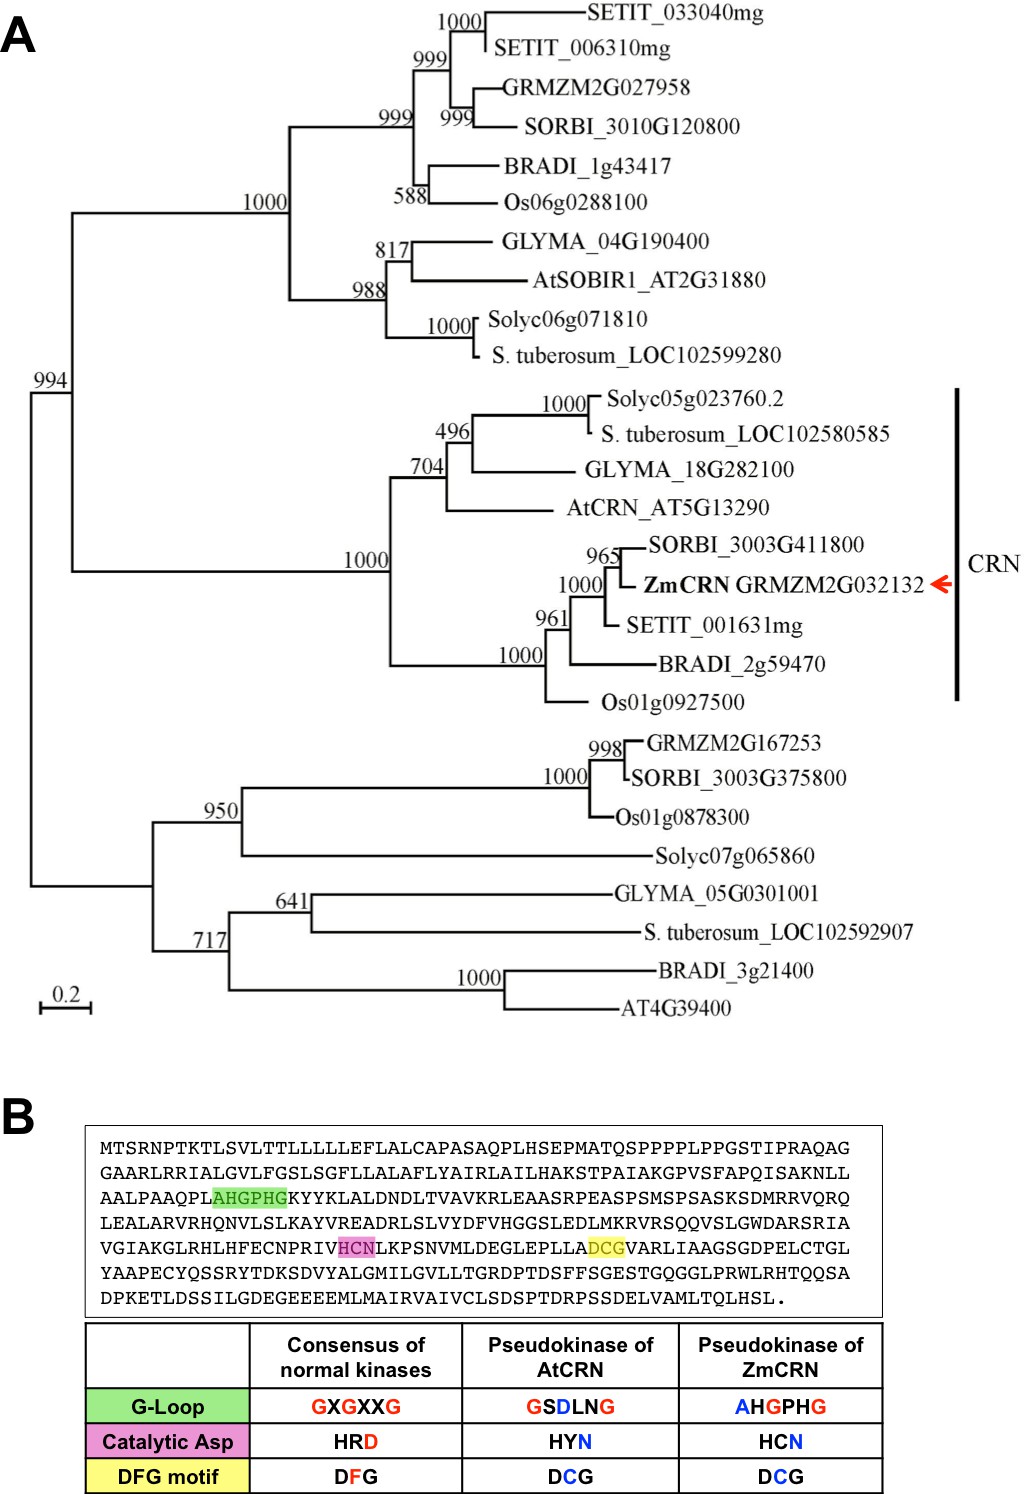
Phylogeny of CRN related proteins, and ZmCRN features of a pseudokinase.
(A) The phylogeny shows that the maize genome has one CRN ortholog, which we named ZmCRN (GRMZM2G032132). The top three hits chosen by BLASTP search of AtCRN against the NCBI database (www.ncbi.nlm.nih.gov) from nine representative species were aligned by Muscle and the phylogeny was made from PhyML 3.1 with 1000 bootstraps. (B) ZmCRN lacks consensus residues necessary for kinase activity (marked green, pink and yellow, top), the table shows the comparison with consensus of active kinases and Arabidopsis CRN (Boudeau et al., 2006; Nimchuk et al., 2011a).
Figure 2—figure supplement 2
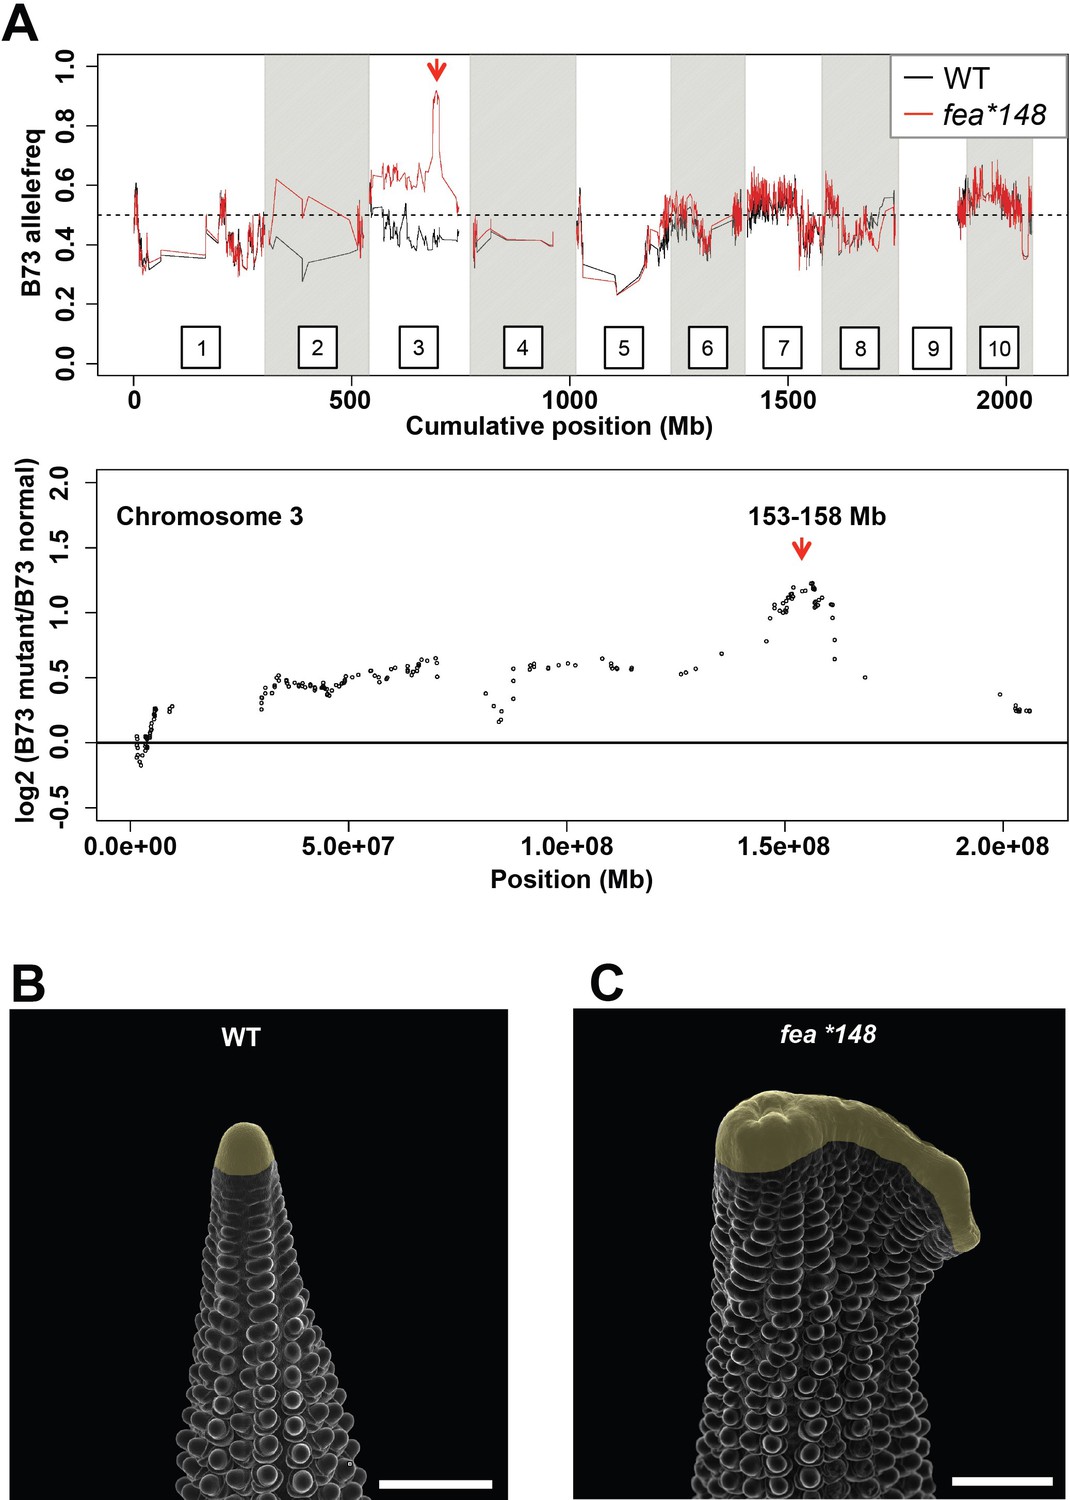
Mapping of the fea*148 fasciated ear mutant.
(A) Bulked segregant analysis of fea*148 using Maize SNP50 chip data delineated a 5 Mb mapping interval surrounding ZmCRN on chromosome 3. Scanning electron microscopy images of wild type (B) and Zmcrn-148 (C) ear primordia (inflorescence meristems in yellow). The fea*148 ear shows an enlarged inflorescence meristem. Scale bars: 500 μm.
Figure 2—figure supplement 3
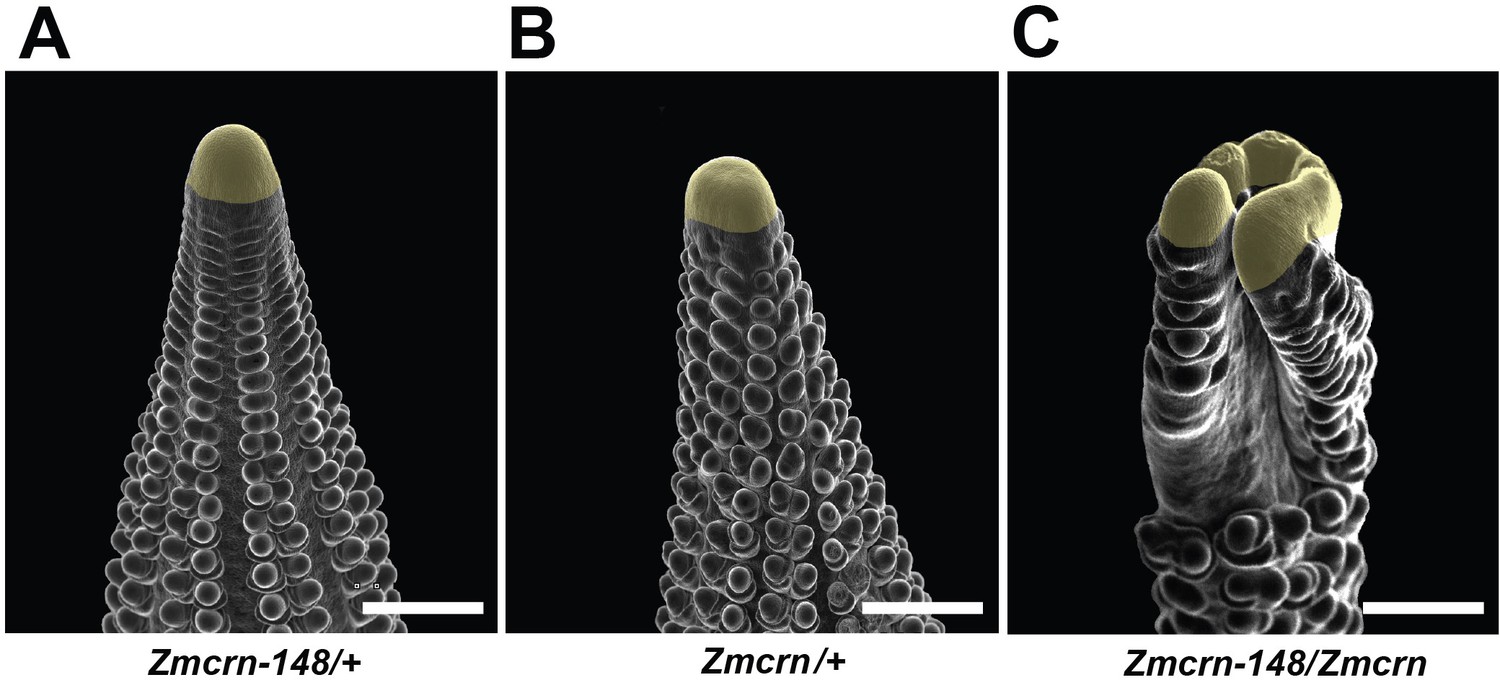
Zmcrn/Zmcrn-148 F1 plants develop fasciated ears.
Scanning electron microscopy image of a Zmcrn/Zmcrn-148 F1 ear shows an enlarged ear inflorescence meristem (C), compared with normal ears of Zmcrn-148/+ (A) or Zmcrn/+ (B), suggesting that these mutations are allelic. Scale bars: 500 μm.
Figure 2—figure supplement 4

Expression of FEA2, CT2 and ZmCRN in different domains of the SAM.
Expression values were extracted from the maize shoot apex RNAseq Atlas from the Timmermans Lab (available at https://maizegdb.org/, ). The samples are from B73 and different domains are captured by laser microdissection (LCM). L1 = epidermal (L1) layer of SAM, p=primordium number), RPM = reads per million.
Figure 2—figure supplement 5
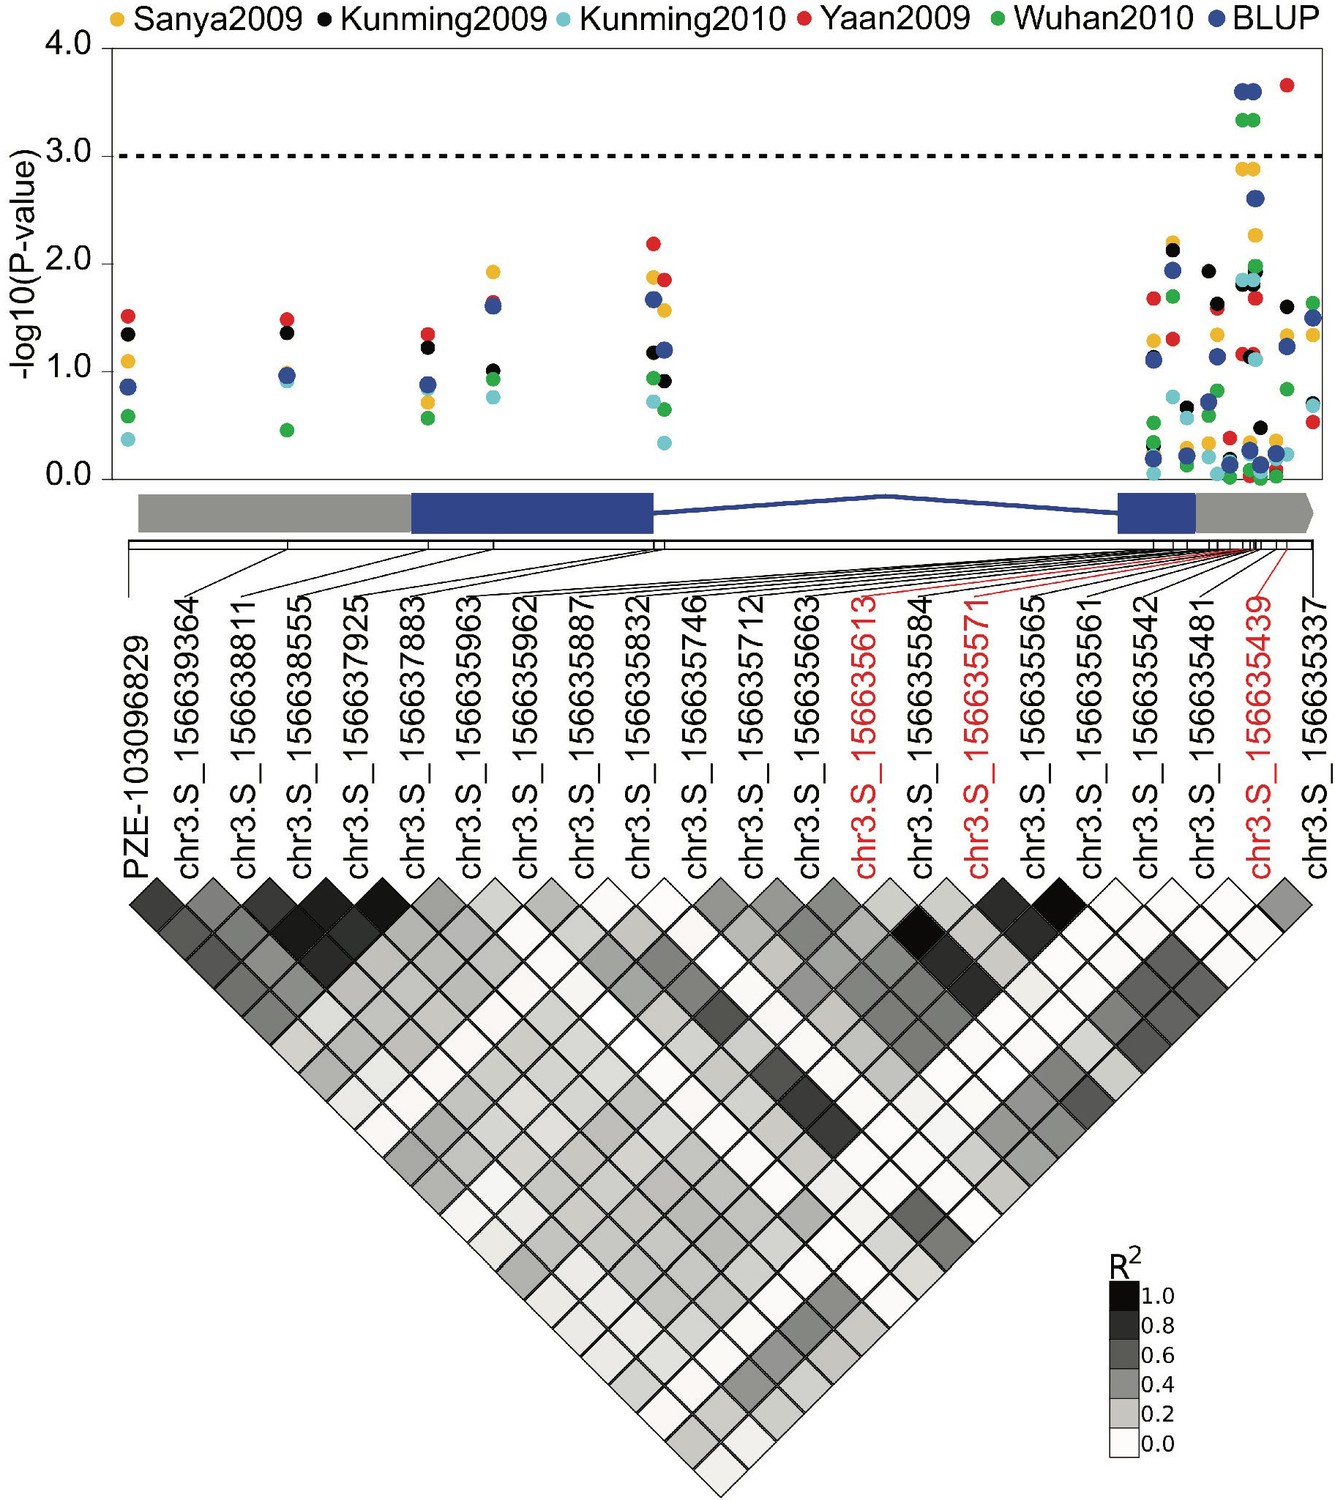
The association of ZmCRN locus with kernel row number (KRN).
The dots show the association of SNPs in the ZmCRN locus with KRN evaluated in five environments, and their BLUP data. The 3’UTR region of ZmCRN locus is significantly associated KRN. BLUP = best linear unbiased prediction; the dotted line represents the threshold of significant association at p-value≤0.001; the x-axis represents the genomic distribution of these SNPs on ZmCRN, and the gray and blue boxes of the gene diagram below the x-axis represent the UTR and exon regions of ZmCRN, respectively; shaded diamonds below gene model show the linkage disequilibrium of those SNPs by their pairwise R2.
Figure 3
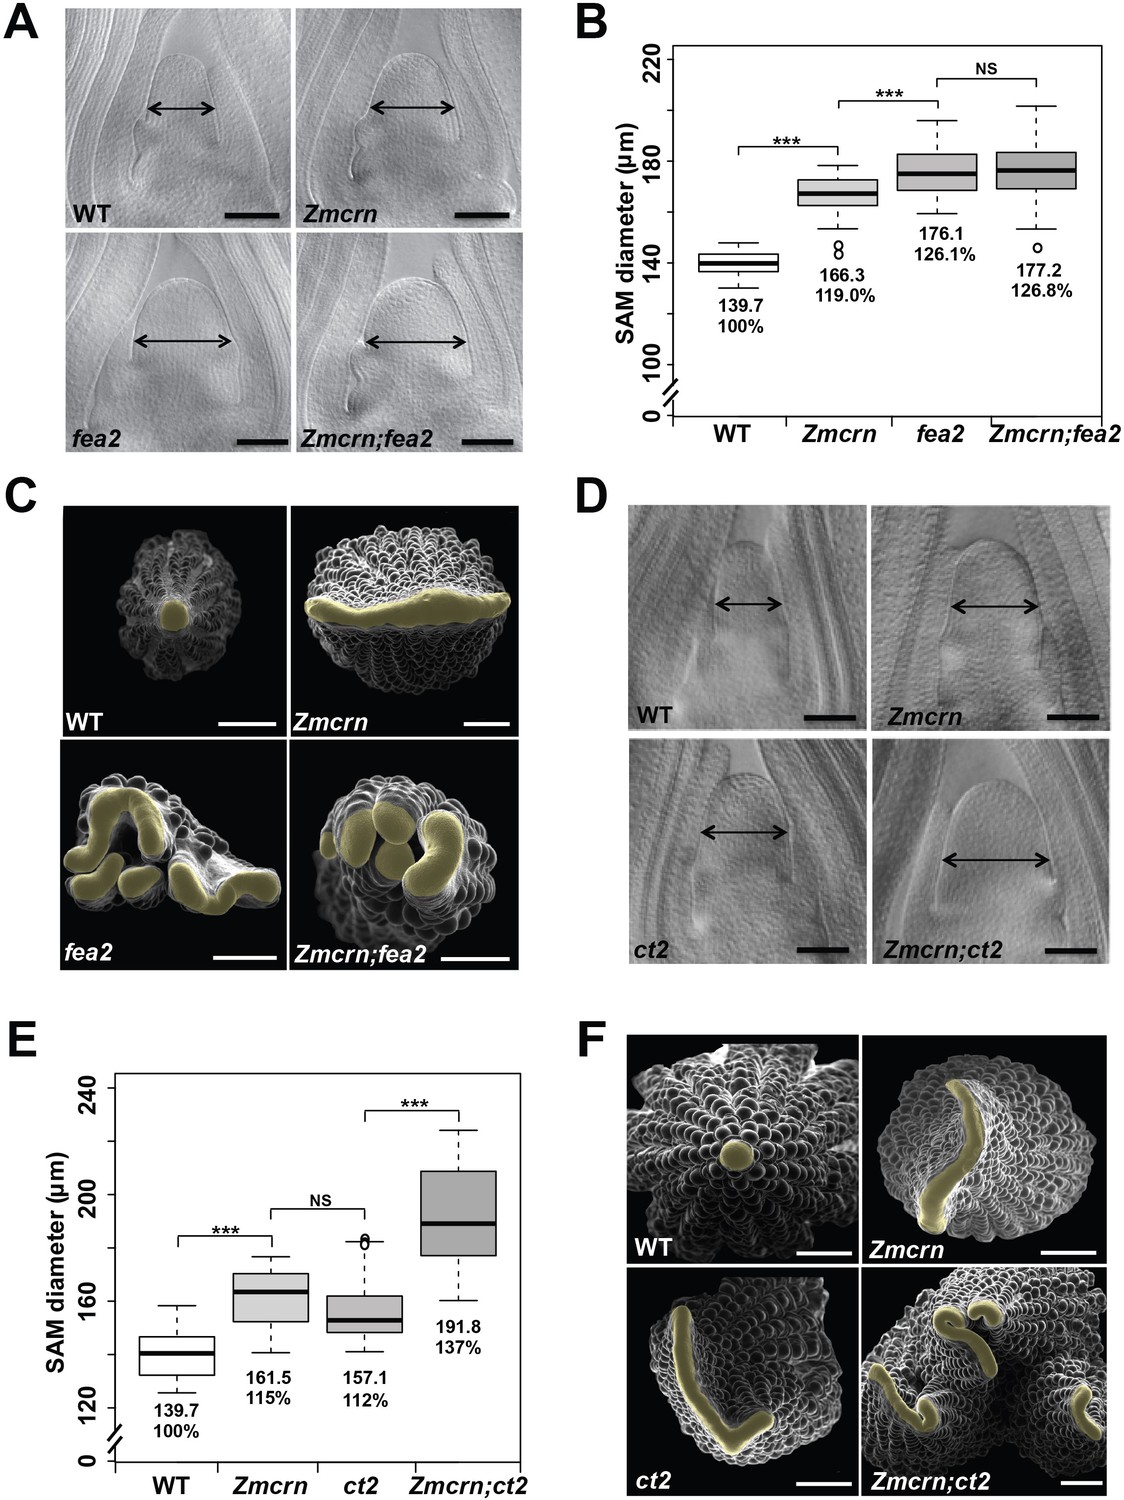
ZmCRN acts in a common pathway with FEA2, but not with CT2.
(A) Cleared SAMs from wild type (WT), Zmcrn, fea2, and Zmcrn;fea2 double-mutant plants. SAMs from Zmcrn and fea2 plants were significantly wider than in wild type (double-headed arrows), but SAM size was not significantly different between fea2 and Zmcrn;fea2 double mutants, SAM diameter was quantified (B). (C) Ear meristems of fea2;Zmcrn double mutants resemble fea2 single mutants. (D) Cleared SAMs from wild type, Zmcrn, ct2, and Zmcrn;ct2 double-mutant plants. SAMs from Zmcrn and ct2 plants were significantly wider than in wild type, and were additively increased in Zmcrn;ct2 double mutants; SAM diameter was quantified (E). (F) Zmcrn;ct2 double mutants had enhanced fasciation of ear primordia. Scale bars: 100 μm in A and D, 500 μm in C and F. n = 30 (B, E) plants for each genotype. Data in B and E are shown by box plots. The mean values as well as the relative % to the WT control are listed. ‘***': P value < 0.0001, two-tailed, two-sample t test, 'NS’: not significant.
-
Figure 3—source data 1
SAM size of Zmcrn;fea2 in a segregating population.
- https://doi.org/10.7554/eLife.35673.013
Figure 4 with 3 supplements
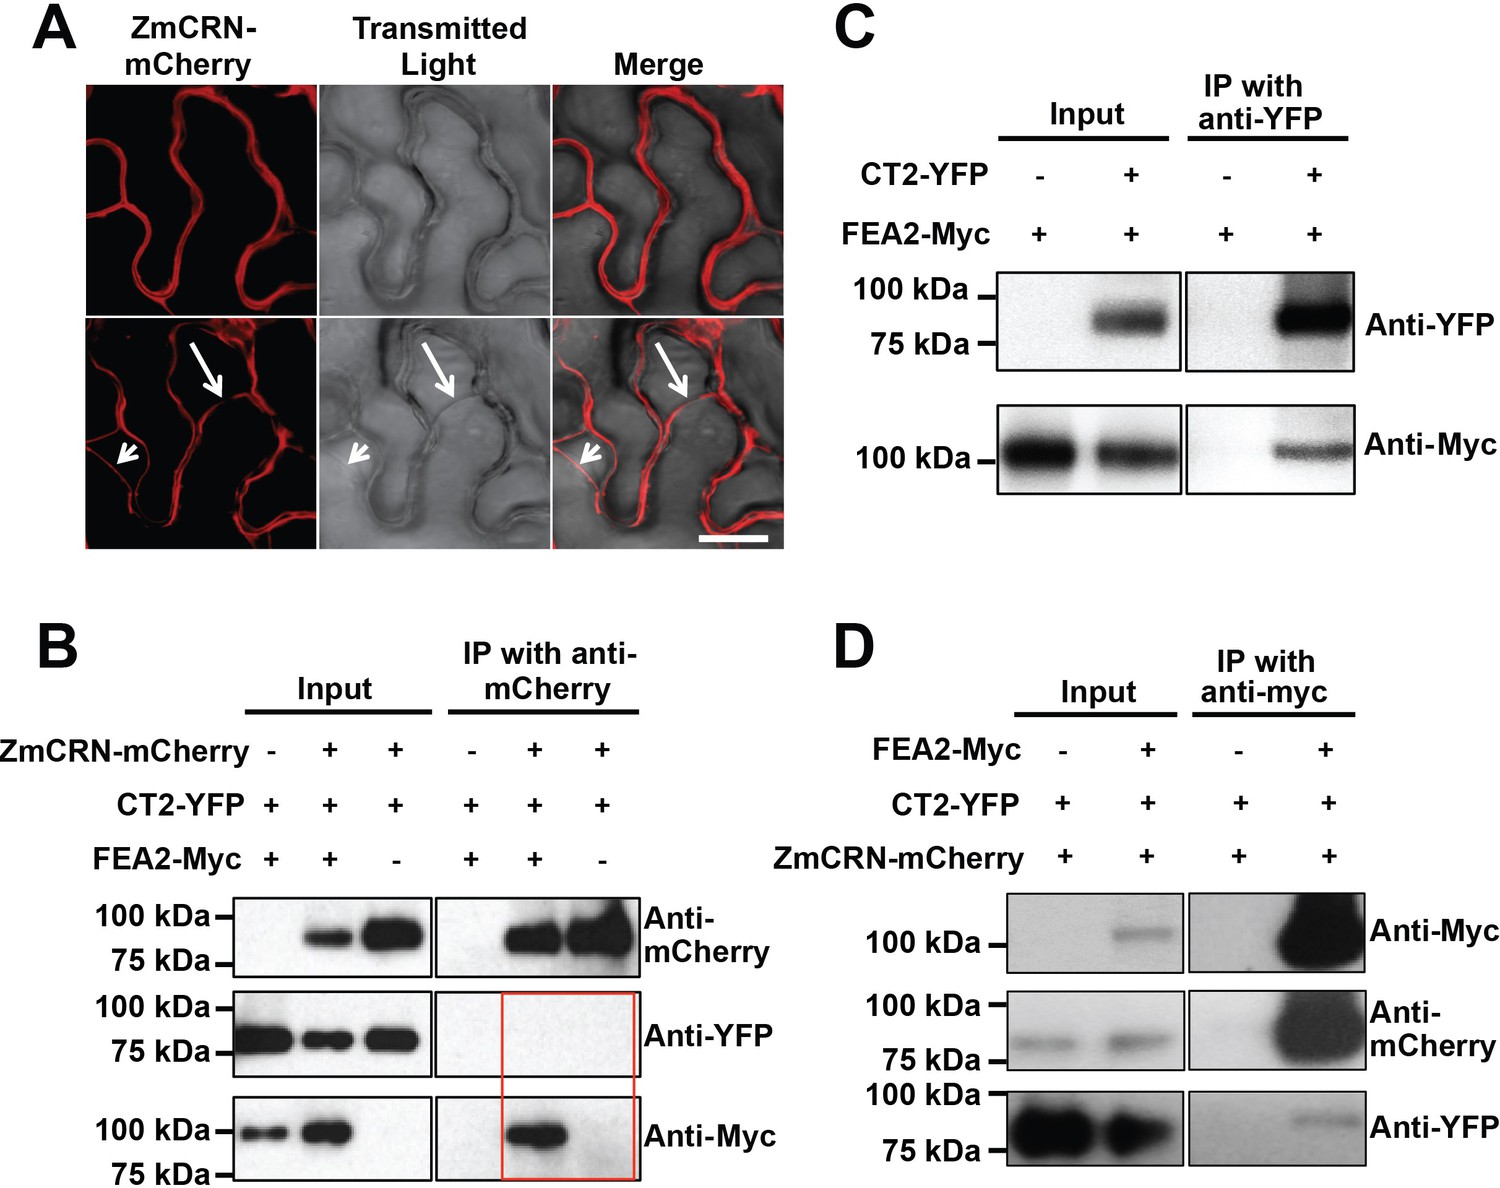
FEA2 is present in two different complexes.
(A) ZmCRN-mCherry was localized at the plasma membrane following tobacco transient expression (top), and in subsequent plasmolysis (bottom). In transient expression followed by immunoprecipitation (IP) assay, ZmCRN-mCherry could IP FEA2-Myc, but not CT2-YFP (B), however CT2-YFP was able to IP FEA2-Myc, as expected (C). FEA2-Myc could also IP ZmCRN-mCherry and CT2-YFP, respectively (D). Scale bar: 20 μm in A.
Figure 4—figure supplement 1

ZmCRN-mCherry co-localized with FEA2-YFP and CT2-YFP on the plasma membrane.
ZmCRN-mCherry co-localized with FEA2-YFP (A) and with CT2-YFP (B) on the plasma membrane following transient expression in N. benthamiana. Scale bars: 20 μm.
Figure 4—figure supplement 2
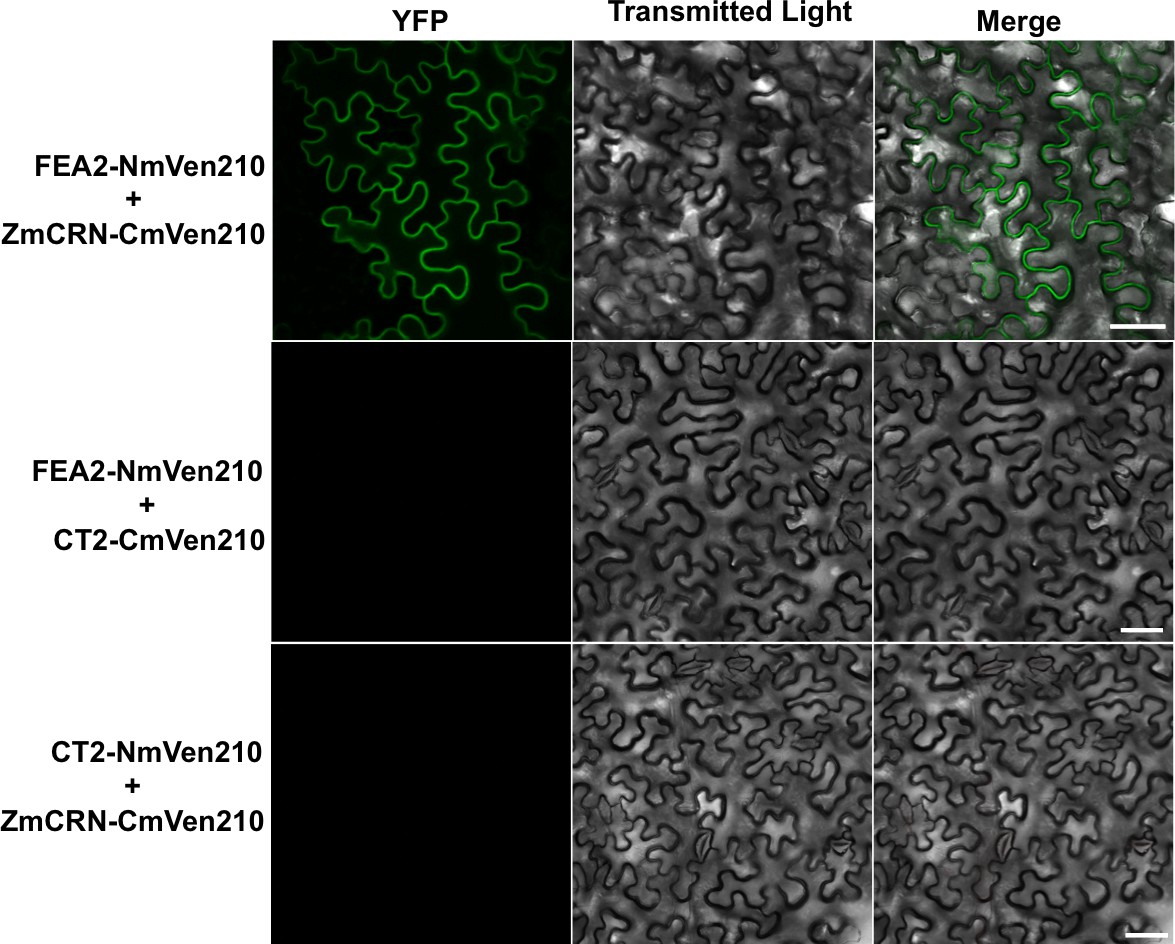
FEA2-NmVen210 interacts with ZmCRN-CmVen210 by BiFC.
YFP signal was detected when FEA2-NmVen210 was co-expressed with ZmCRN-CmVen210. No YFP signal was detected when FEA2-NmVen210 was co-expressed with CT2-CmVen210, suggesting the interaction is indirect, and no YFP signal was detected when CT2-NmVen210 was co-expressed with ZmCRN-CmVen210, as expected from the Co-IP results. Scale bars: 50 μm.
Figure 4—figure supplement 3
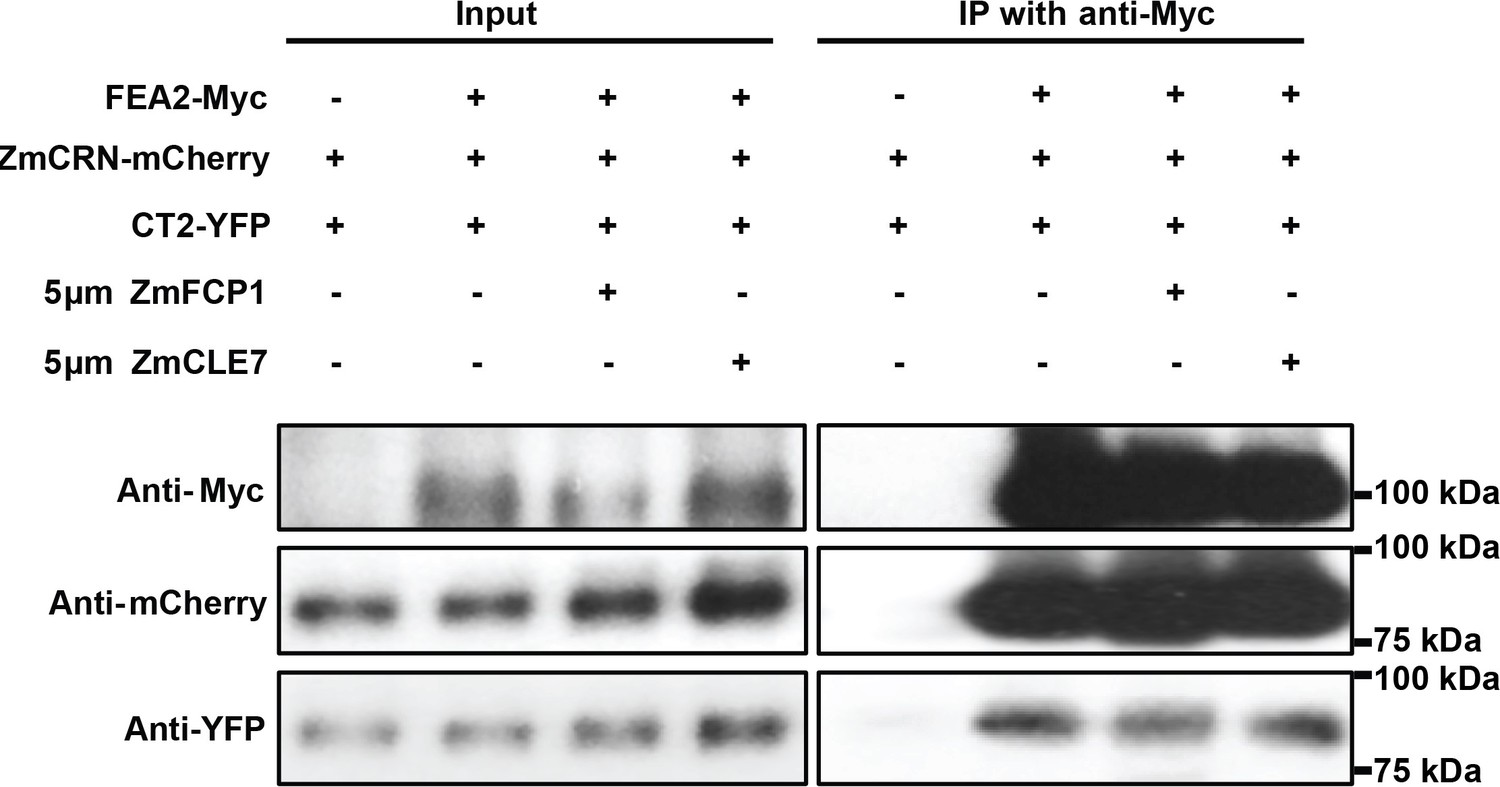
Treatment with ZmFCP1 or ZmCLE7 peptide didn’t affect the protein complex formation.
5 μm ZmFCP1 or ZmCLE7 were infiltrated into the transformed N. benthamiana leaves expressing the indicated proteins following the protocol in Somssich et al. (2015). The presence of ZmFCP1 or ZmCLE7 didn’t affect the interaction between FEA2-Myc and CT2-YFP or the interaction between FEA2-Myc and ZmCRN-mCherry.
Figure 5 with 2 supplements
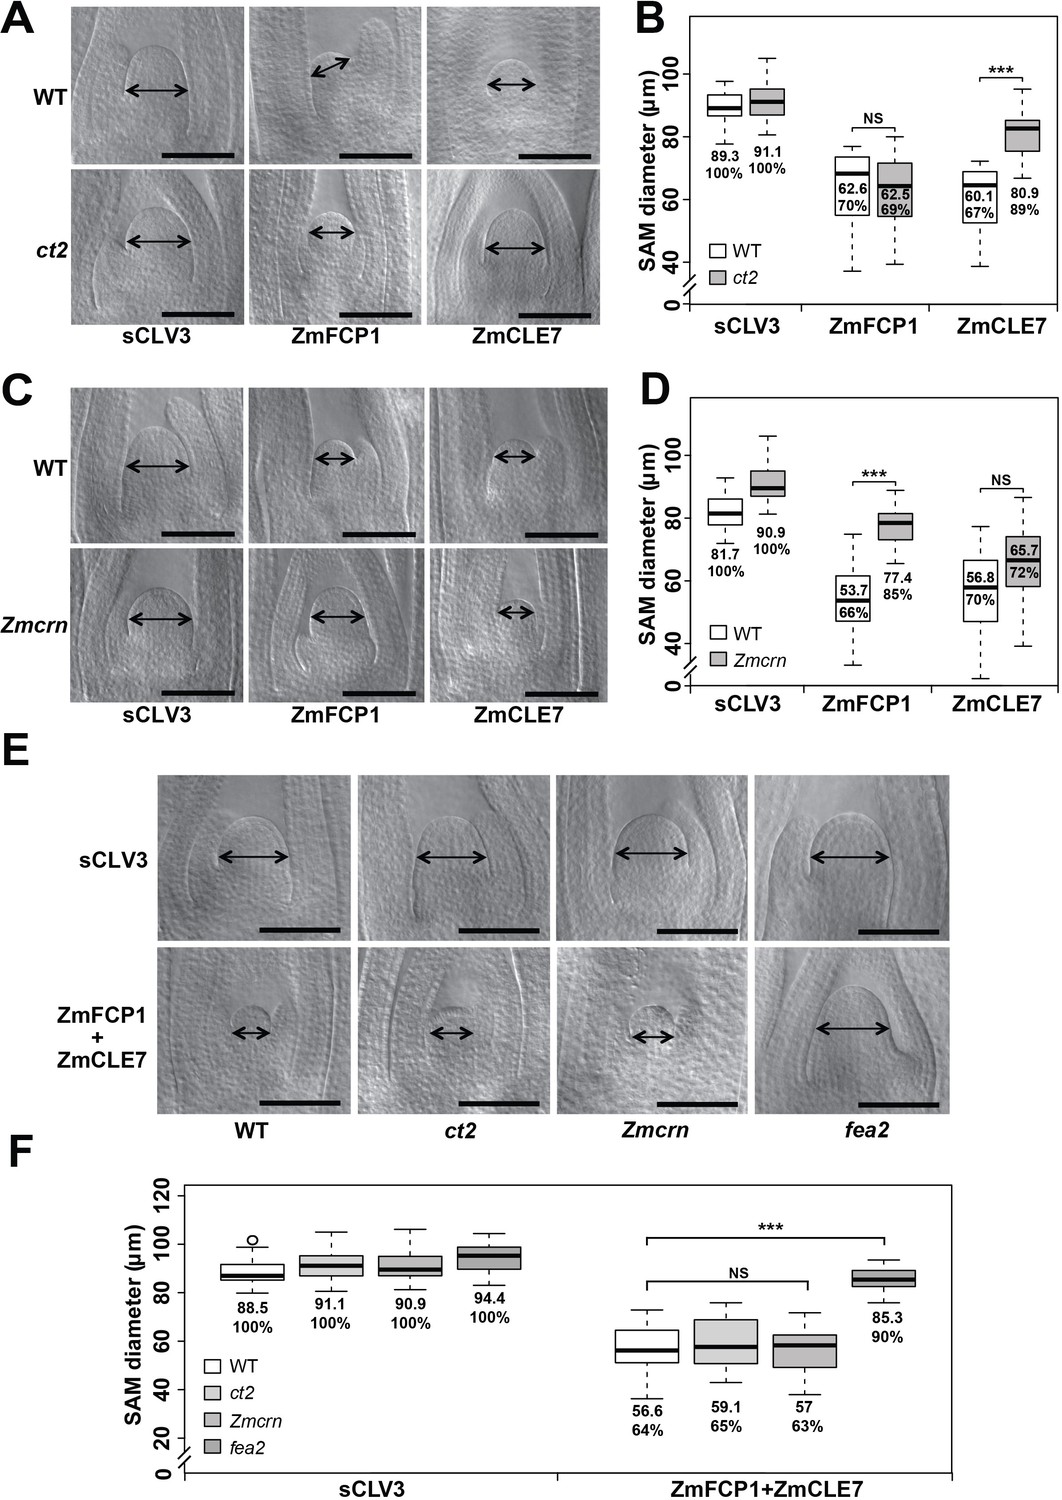
ct2 and Zmcrn show different sensitivity to ZmCLE7 and ZmFCP1 peptides.
Embryos of each genotype were cultured with control, scrambled peptide (sCLV3) or with ZmFCP1 or ZmCLE7. Wild type SAM growth (double-headed arrows) was strongly inhibited by all peptides except sCLV3, and ct2 growth was insensitive only to ZmCLE7 peptide (A), whereas Zmcrn was partially resistant only to ZmFCP1 peptide (C); SAM diameter was quantified (B, D). In treatments with both ZmFCP1 and ZmCLE7, only fea2 showed resistance, but Zmcrn or ct2 did not (E, F). Scale bars: 100 μm in A, C and E. N = 25 (C) plants for each genotype. Data in B, D and F are shown by box plots. The mean values as well as the relative % to each negative control are listed. ‘***': P value < 0.0001, two-tailed, two-sample t test, ‘NS’: not significant.
-
Figure 5—source data 1
ZmFCP1 and ZmCLE7 double peptide treatments inct2,Zmcrnandfea2in a segregating population.
- https://doi.org/10.7554/eLife.35673.023
Figure 5—figure supplement 1
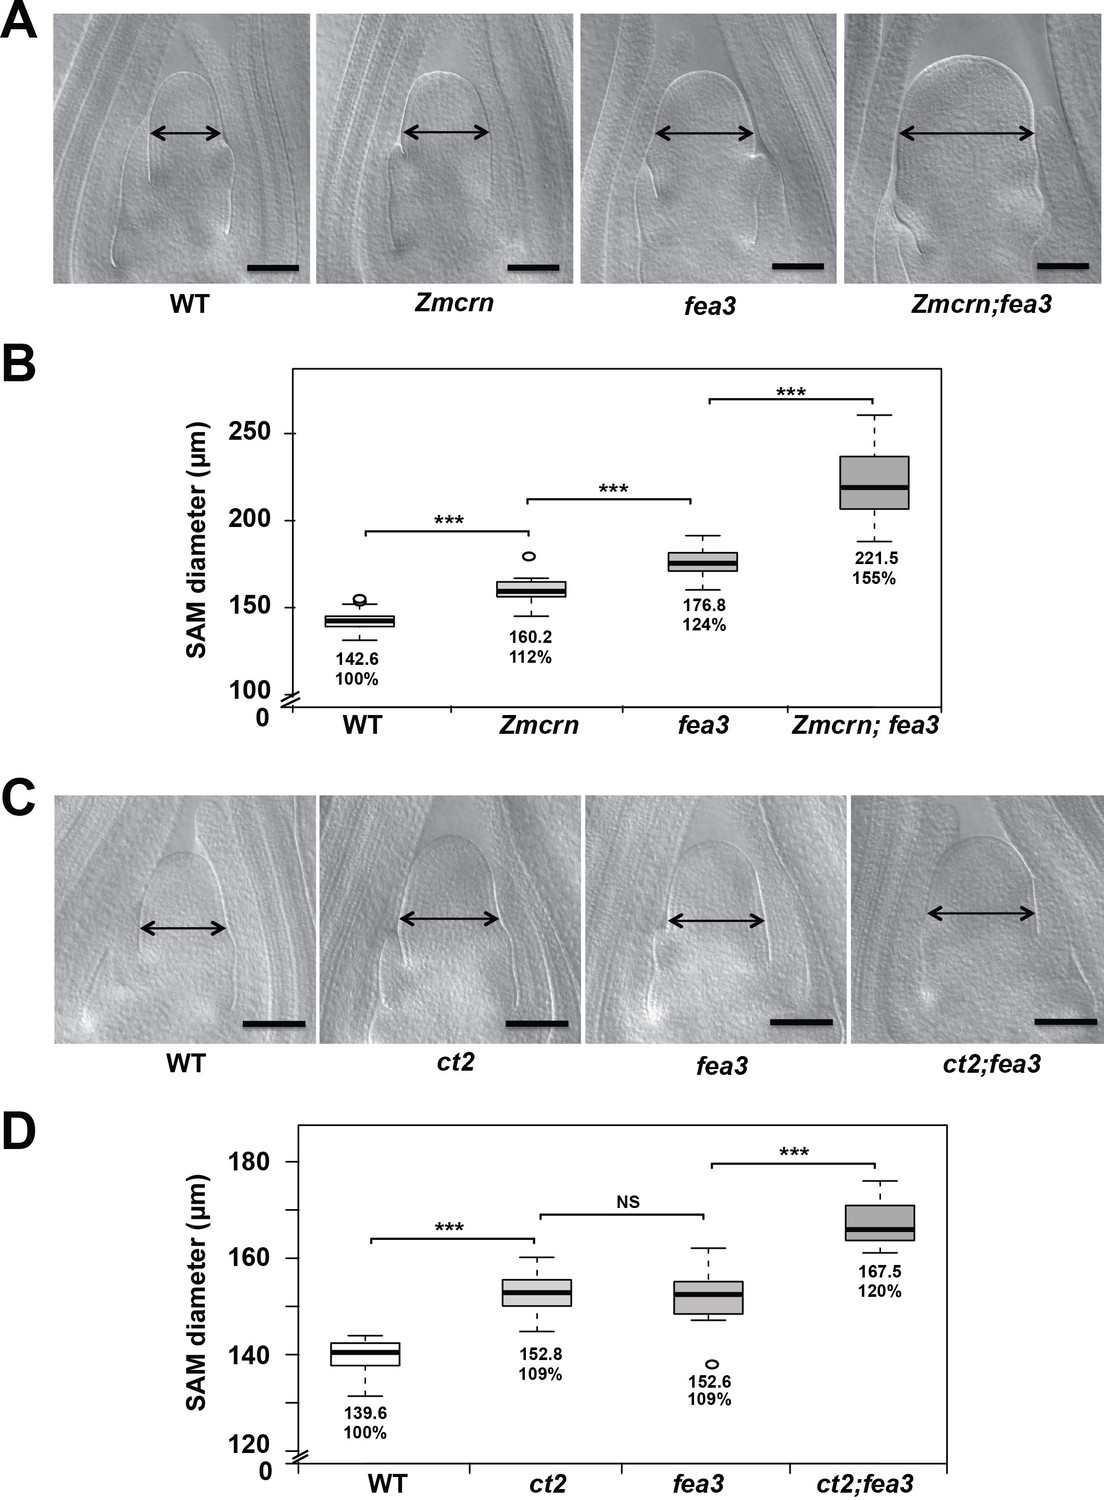
ZmCRN and CT2 function in a different pathway to FEA3.
(A) Cleared SAMs from wild-type (WT), Zmcrn, fea3, and double-mutant plants. SAMs from Zmcrn and fea3 plants were wider than those in wild type (double-headed arrows), and Zmcrn;fea3 double mutants were wider compared to the single mutants. SAM diameter was quantified in (B). (C) Cleared SAMs from wild-type (WT), ct2, fea3, and double-mutant plants. SAMs from ct2 and fea3 plants were wider than those in wild type (double-headed arrows), and the double mutants were wider compared to the single mutants. SAM diameter was quantified in (D). Scale bars: 100 μm in A. n = 28 plants for each genotype, except of Zmcrn;fea3 double (n = 15). Data in B and D are shown by box plots. The mean values as well as the relative % to the WT control are listed. ‘***': P value < 0.0001, two-tailed, two-sample t test.
-
Figure 5—figure supplement 1—source data 1
SAM size of Zmcrn;fea3 in a segregating population.
- https://doi.org/10.7554/eLife.35673.020
Figure 5—figure supplement 2
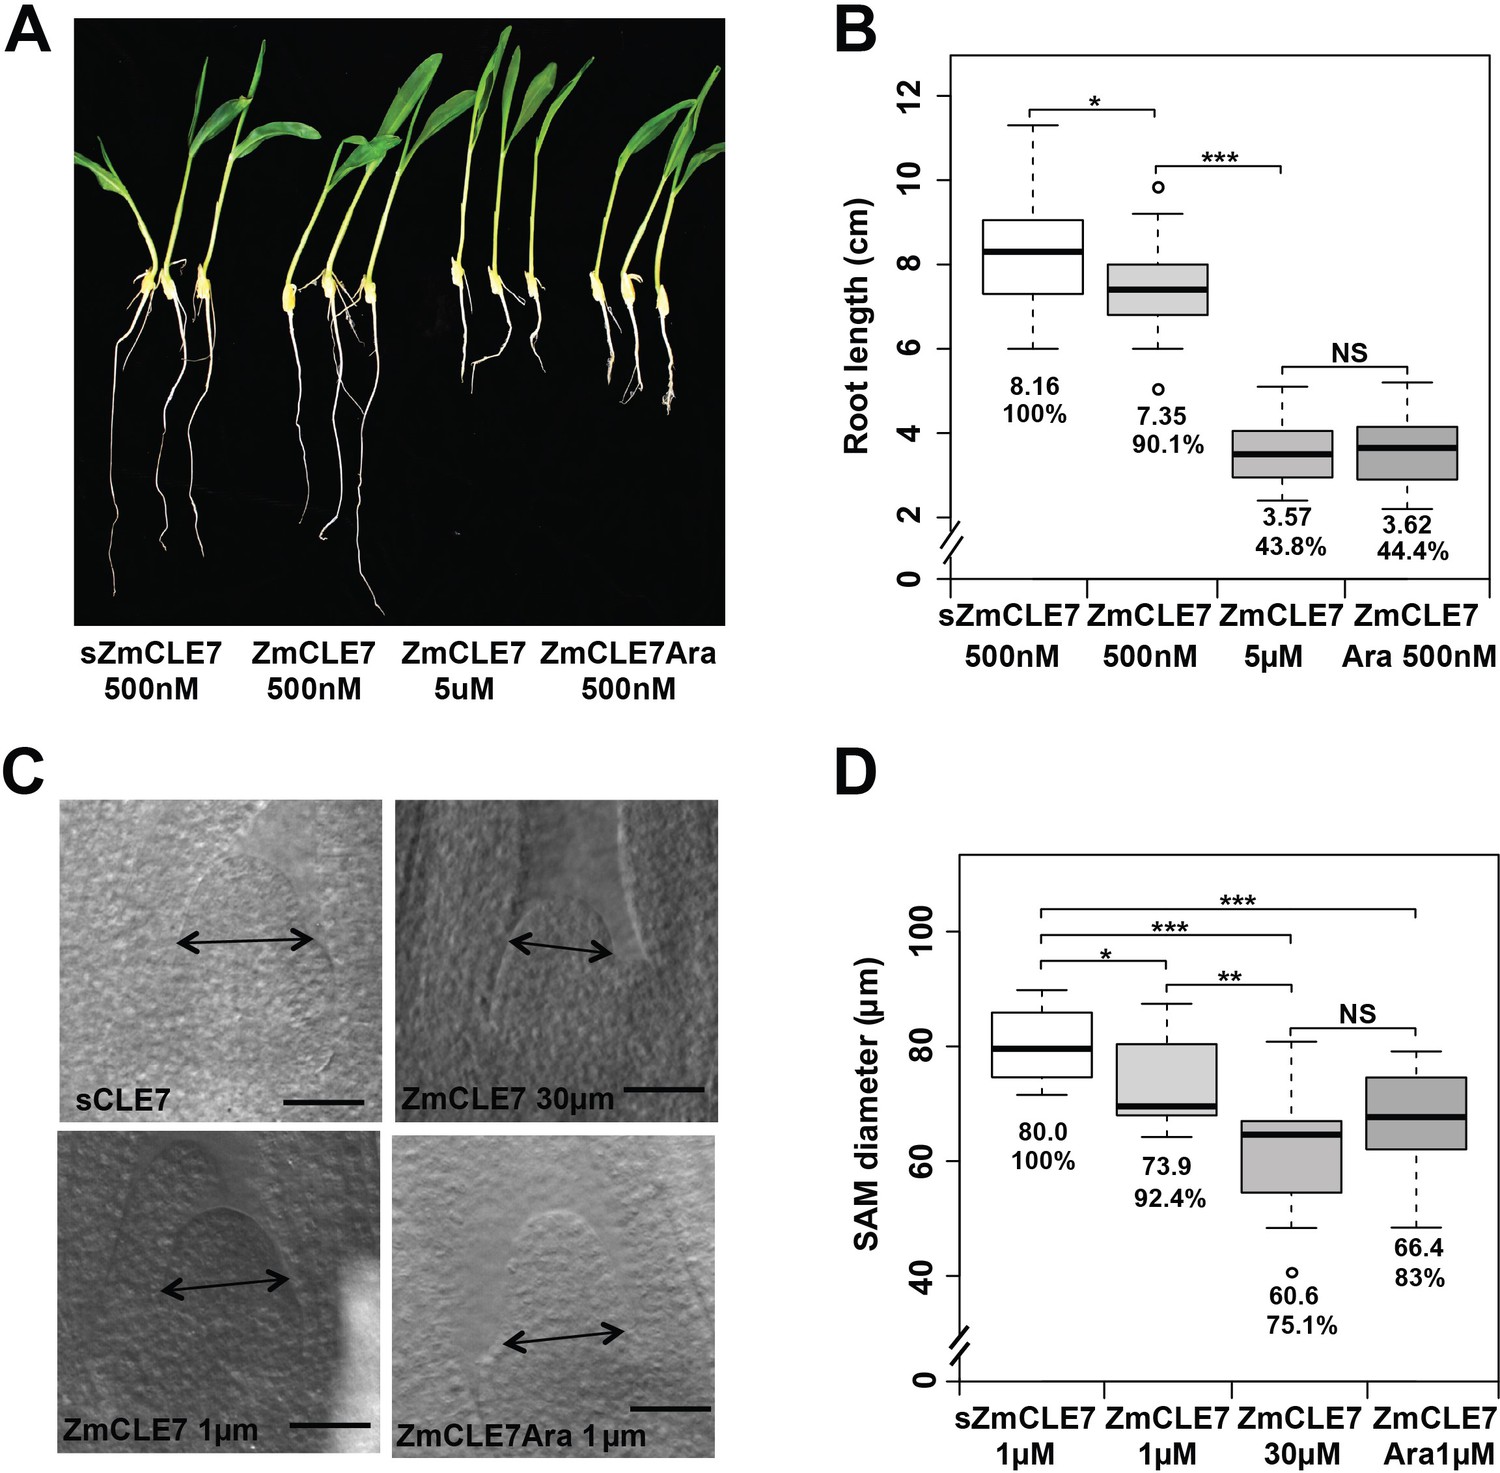
Triarabinosylated ZmCLE7 peptide is more potent.
Germinating maize seedling roots or embryos were treated with non-modified or triarabinose modified ZmCLE7 peptide at the concentrations indicated. In each case, the modified peptide was significantly more potent than the non-modified form. Data in B and D are shown by box plots. The mean values as well as the relative % to the control scrambled peptide (sZmCLE7) treatment are listed. ‘*': P value < 0.05, ‘**': P value < 0.01, ‘***': P value < 0.001, ‘NS’: not significant, two-tailed, two-sample t test.
-
Figure 5—figure supplement 2—source data 1
ZmCLE7-Arabinosylated peptide embryo assay.
- https://doi.org/10.7554/eLife.35673.022
Figure 6 with 1 supplement
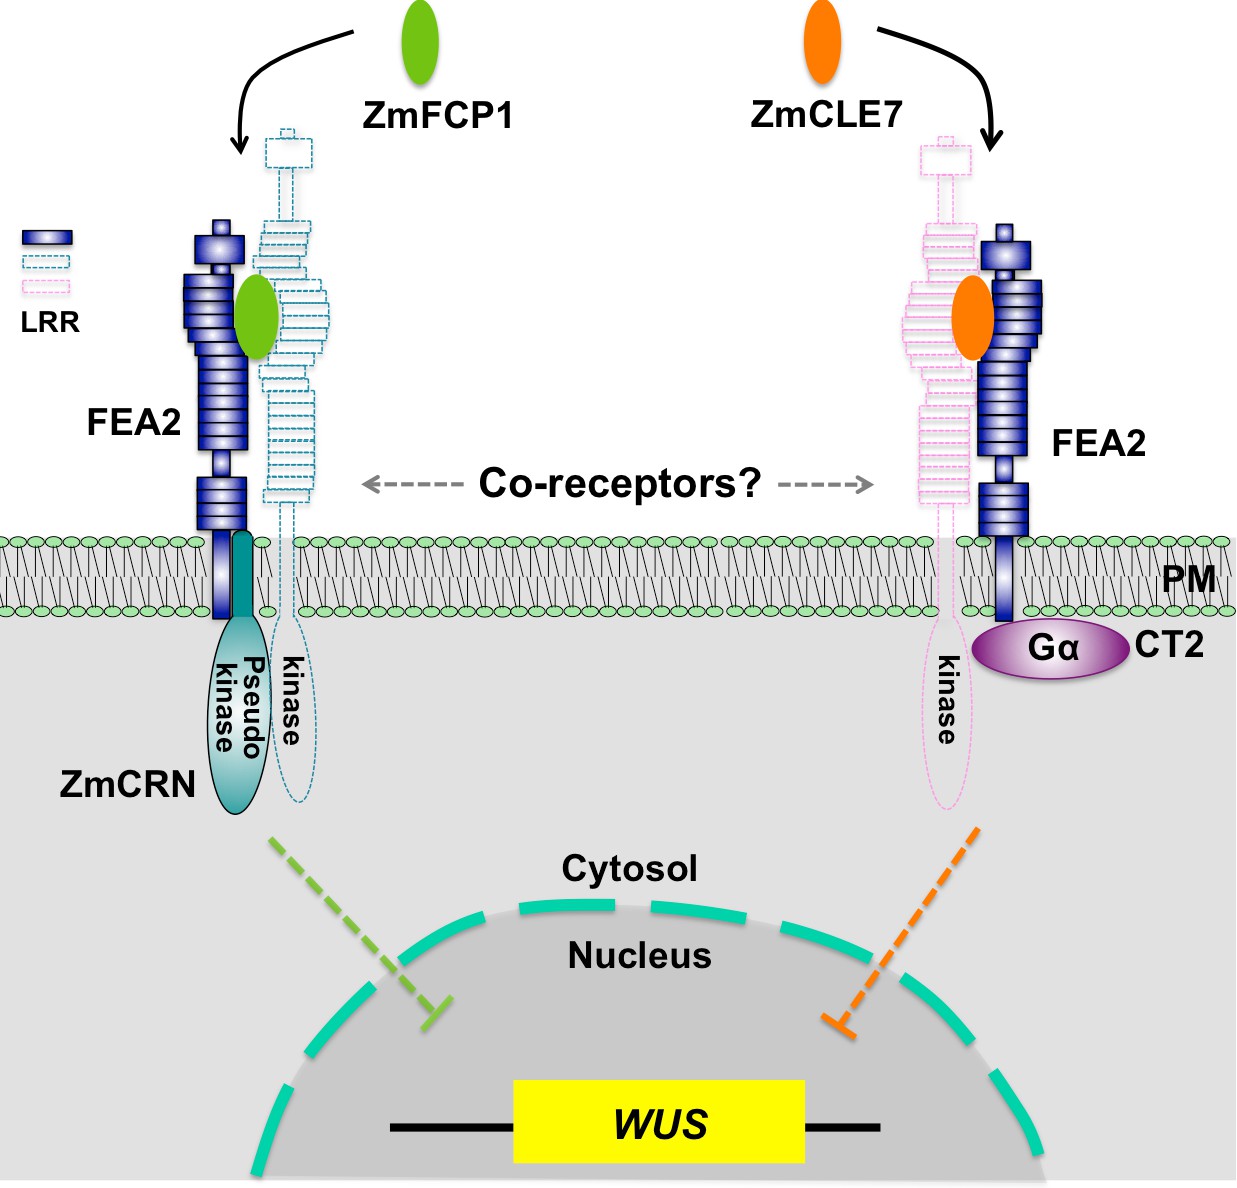
Hypothetical model for FEA2 signaling through two different pathways.
Two different peptides, ZmFCP1 and ZmCLE7, are proposed to bind to two separate FEA2 receptor complexes, and the two signals are differentially transmitted to downstream components; with the ZmCLE7 signal passing through CT2, and the ZmFCP1 signal passing through ZmCRN.
Figure 6—figure supplement 1
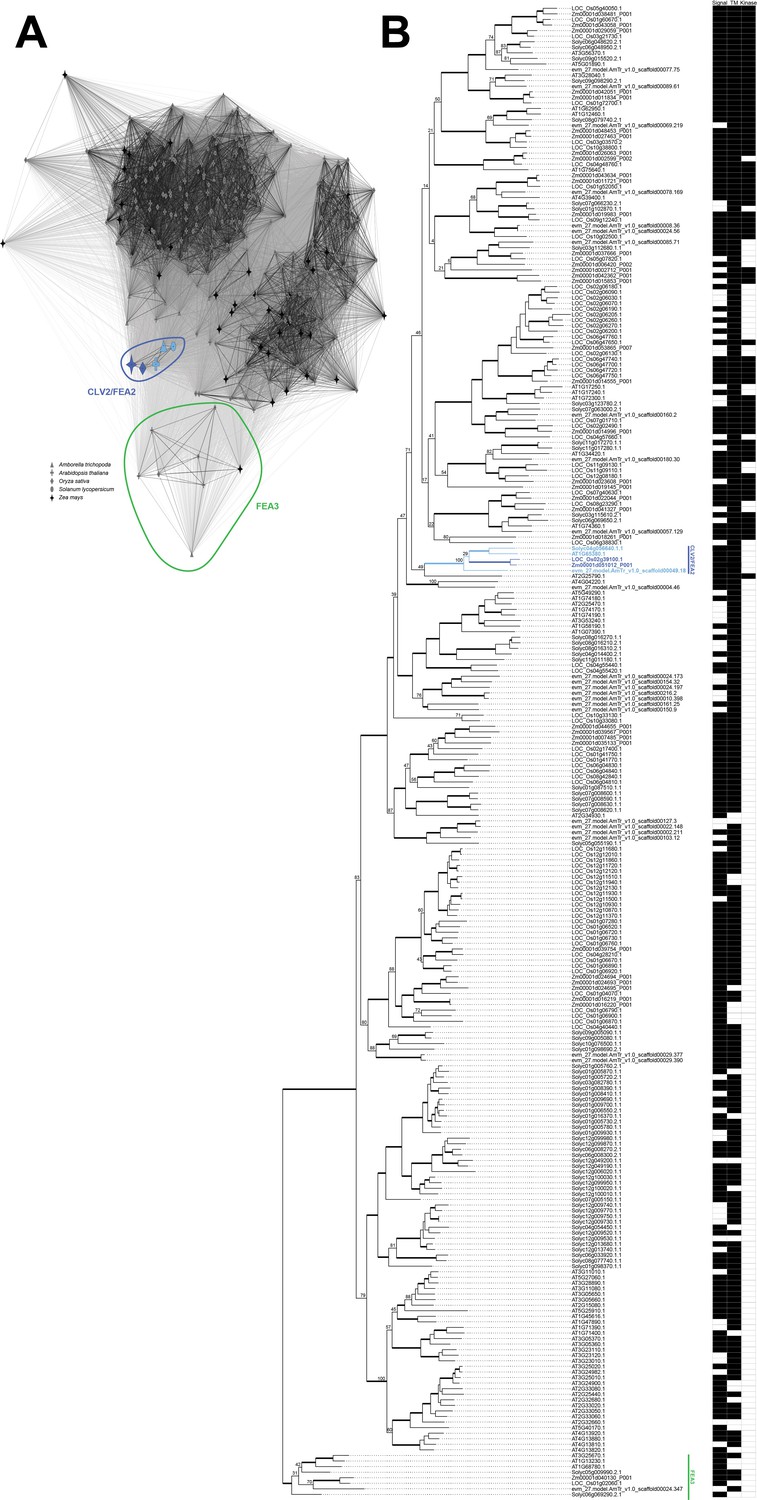
Clustering, phylogenetic tree, and functional annotations of CLV2/FEA2 genes and their close homologs from five species.
CLANS clustering of CLV2/FEA2 and closely related homologs representing pairwise similarity (A). The clusters containing CLV2/FEA2 and FEA3 are circled in blue and green, respectively. The CLV2/FEA2 genes cluster separately from the remainder of the genes in the network. Maximum-likelihood phylogenetic tree of CLV2/FEA2 and the same closely related homologs as represented in the clustering, with functional annotations (B). Node values are bootstrap supports. The diagram shows which genes showed presence of a signal peptide domain (‘signal’) and a transmembrane domain (‘TM’), as predicted by Phobius, and which genes showed the presence of a kinase domain (‘Kinase’), as predicted by HMMER3; CLV2/FEA2 and FEA3 are colored the same as in (A). Thickened lines represent 90% or higher bootstrap support values.
Additional files
-
Supplementary file 1
table 1. P-values of the association between ZmCRN SNPs with kernel row number in multiple environments.
- https://doi.org/10.7554/eLife.35673.026
-
Supplementary file 2
table 2. List of Primers.
- https://doi.org/10.7554/eLife.35673.027
-
Transparent reporting form
- https://doi.org/10.7554/eLife.35673.028
Download links
A two-part list of links to download the article, or parts of the article, in various formats.
Downloads (link to download the article as PDF)
Open citations (links to open the citations from this article in various online reference manager services)
Cite this article (links to download the citations from this article in formats compatible with various reference manager tools)
The CLAVATA receptor FASCIATED EAR2 responds to distinct CLE peptides by signaling through two downstream effectors
eLife 7:e35673.
https://doi.org/10.7554/eLife.35673


