Deficiency of parkin and PINK1 impairs age-dependent mitophagy in Drosophila
- Department of Neurosciences, Belgium
- KU Leuven, Belgium
- VIB-KU Leuven Center for Brain & Disease Research, Belgium
- VIB-KU Leuven Center for Brain and Disease Research, KU Leuven, Belgium
- University Hospitals Leuven, Belgium
Figures
Figure 1
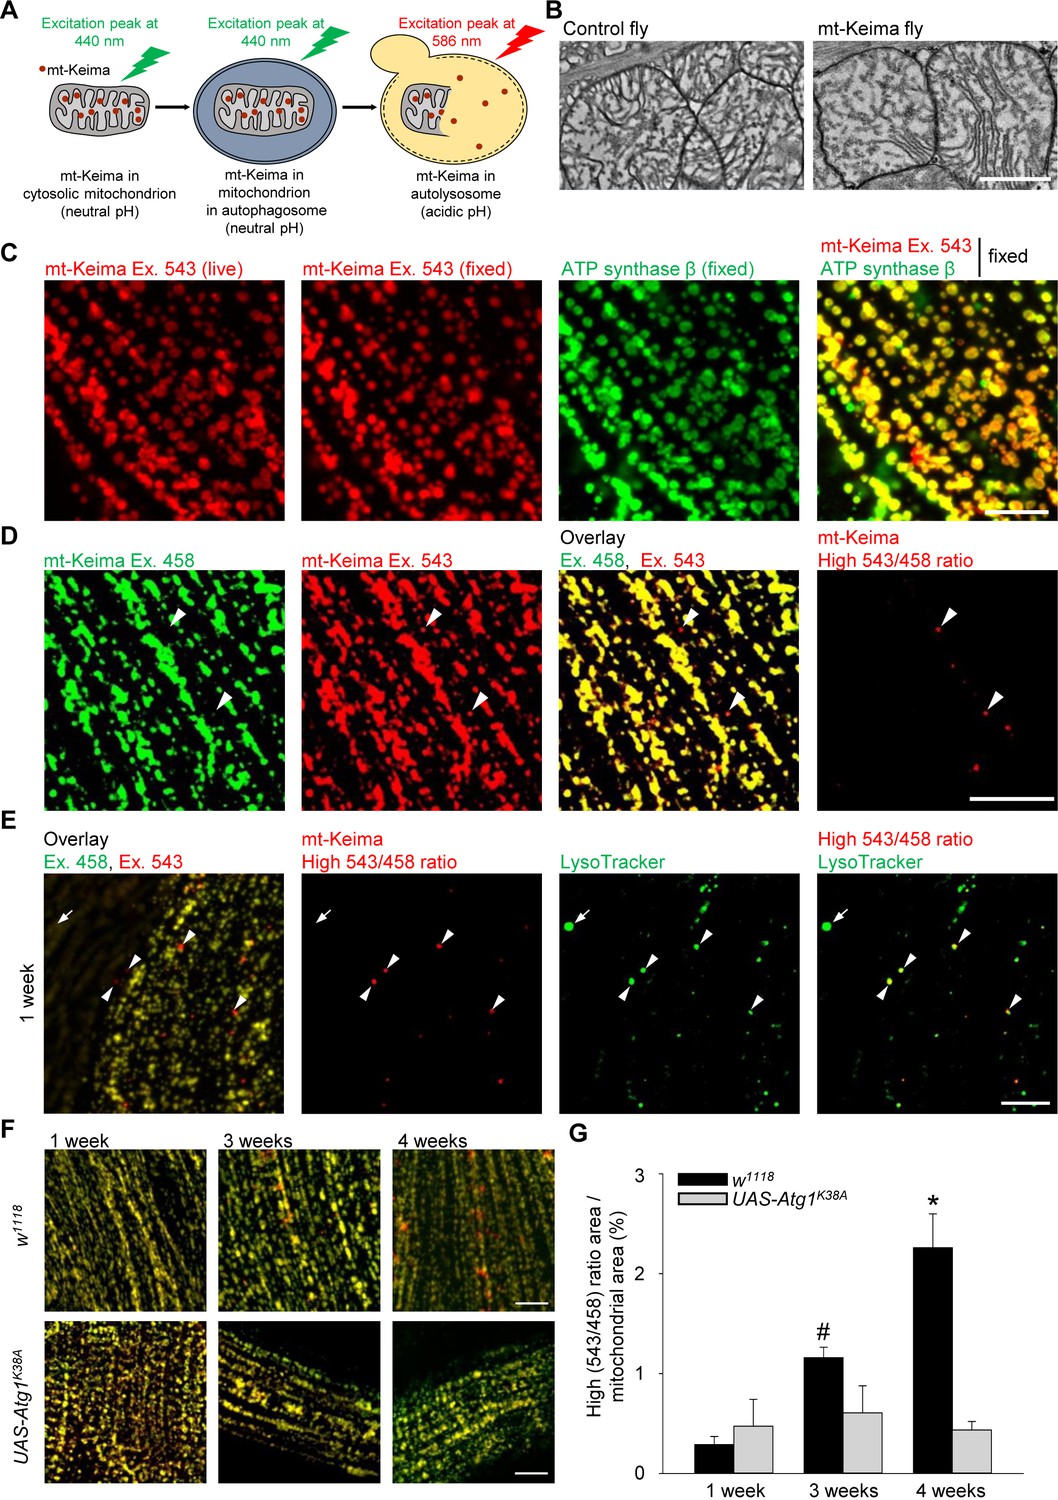
Mitophagy in Drosophila flight muscle increases with aging.
(A) Schematic of mt-Keima imaging. The fluorescent mt-Keima protein is targeted to the mitochondrial matrix and exhibits pH-dependent excitation. The excitation peak of mt-Keima shifts from 440 nm to 586 nm when mitochondria are delivered to acidic lysosomes, where it resists degradation by lysosomal proteases. (B) Transmission electron micrographic images of mitochondria from control (w1118;;) and mt-Keima-expressing indirect flight muscle cells under control of the mef-2-GAL4 driver (w1118;; UAS-mt-Keima, mef-2-GAL4/+). Scale bar, 1 µm. (C) Confocal images of 1-week-old indirect flight muscle expressing mt-Keima under control of the mef-2-GAL4 driver (w1118;; UAS-mt-Keima, mef-2-GAL4/+). Images show mt-Keima emission at 543 nm excitation (Ex.) before and after fixation, immunostaining for ATP synthase β after fixation, and overlay. Scale bar, 10 µm. (D) Images of 1-week-old indirect flight muscle expressing mt-Keima under control of the mef-2-GAL4 driver (w1118;; UAS-mt-Keima, mef-2-GAL4/+). Images show live mt-Keima emission at 458 and 543 nm Ex., overlay of mt-Keima emissions at 458 and 543 nm Ex., and puncta with high 543 nm/458 nm ratio values. Arrowheads indicate examples of ‘acidic’ mt-Keima puncta. Scale bar, 10 µm. (E) Confocal images of mt-Keima-expressing indirect flight muscle labeled with LysoTracker (100 nM), showing colocalization of ‘acidic’ mt-Keima puncta with lysosomes (arrowheads). Arrow indicates an example of a lysosome devoid of mt-Keima signal. Scale bar, 10 µm. (F) Overlay of mt-Keima emission at Ex. 458 (green) and 543 nm (red) in w1118 or Atg1K38A-overexpressing (w1118;; UAS-mt-Keima, mef-2-GAL4/UAS-Atg1K38A) indirect flight muscle of 1-, 3- and 4-week-old flies. Scale bar, 10 µm. (G) High (543/458) ratio area/total mitochondrial area was quantified as an index of mitophagy (n = 4–6 flies per condition). In each fly, 7 random 2500 μm2 fields were analyzed. *p=0.02 compared with all other conditions; # p=0.02 compared with 1-week-old w1118 flies.
-
Figure 1—source data 1
Quantification of mitophagy (high [543/458] ratio area/total mitochondrial area) in indirect flight muscle of w1118 or Atg1K38A-overexpressing flies at 1, 3 and 4 weeks.
- https://doi.org/10.7554/eLife.35878.004
Figure 2
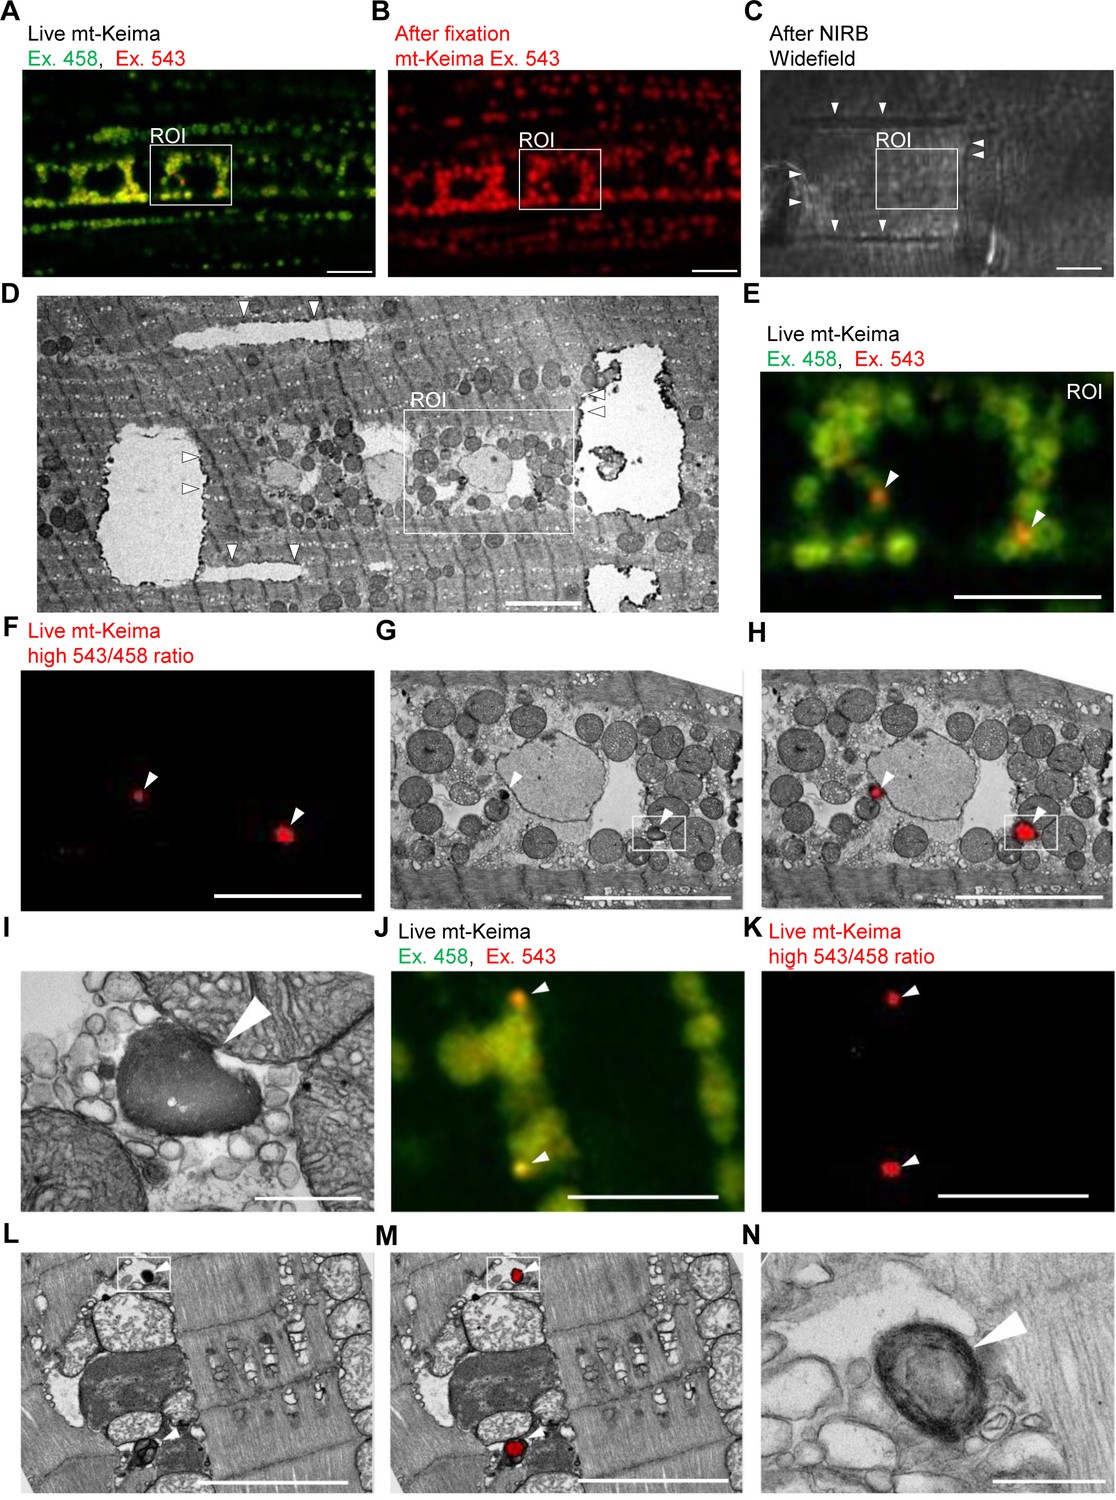
Correlative light and electron microscopy (CLEM) reveals the ultrastructure of ‘acidic’ mt-Keima puncta.
(A–D) Overview of the CLEM procedure from live mt-Keima imaging to EM. (A) Overlay of live mt-Keima emission at 458 (green) and 543 nm (red) excitation (Ex.) in indirect flight muscle tissue of a 2-week-old control fly (w1118;; UAS-mt-Keima, mef-2-GAL4/+). Boxed area shows the region of interest (ROI) containing two high 543/458 ratio (‘acidic’) mt-Keima dots. (B) After fixation the same ROI as in (A) is re-identified based on muscle fiber morphology (mt-Keima emission at Ex. 543 nm). (C) Widefield image after near-infrared branding (NIRB) around the ROI (laser marks indicated by arrowheads). (D) EM image of the same ROI as in (A–C), surrounded by NIRB marks (indicated by arrowheads). (E–H) Magnification of the same ROI shown in (A–D). Arrowheads in (E–H) indicate ‘acidic’ mt-Keima dots that colocalize with lysosomes on EM. (E) Overlay of live mt-Keima emission at 458 (green) and 543 nm (red) Ex. (F) High 543/458 ratio dots. (G) EM. (H) Overlay of EM and high 543/458 ratio mt-Keima image. (I) Further magnification of the boxed region in (G–H). (J–N) Additional CLEM example in muscle tissue of a 1-week-old control fly (w1118;; UAS-mt-Keima, mef-2-GAL4/+). Arrowheads in (J–M) indicate ‘acidic’ mt-Keima dots that colocalize with lysosomes on EM. (J) Live mt-Keima emission at 458 (green) and 543 nm (red) Ex. in muscle. (K) High 543/458 ratio dots. (L) EM. (M) Overlay of EM and high 543/458 ratio mt-Keima image. (N) Further magnification of the boxed region in (L–M). Scale bars in (I) and (N), 500 nm. All other scale bars, 5 µm.
Figure 3
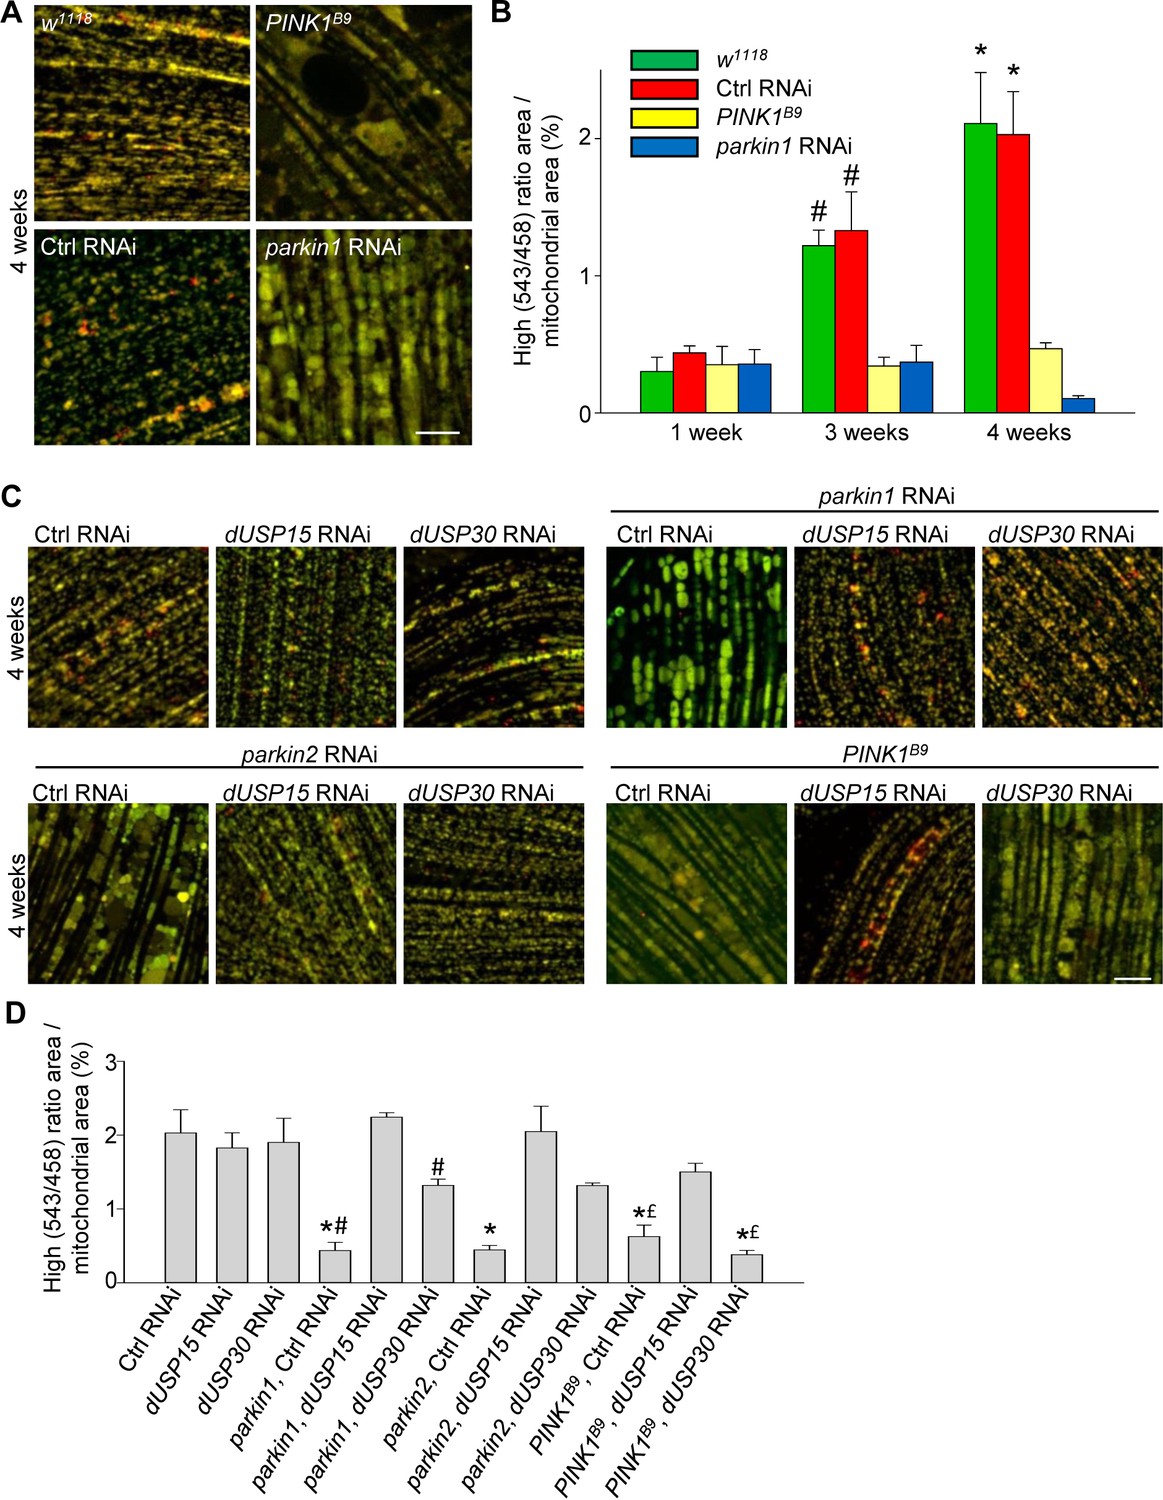
Deficiency of parkin and PINK1 impairs mitophagy in Drosophila flight muscle.
(A) Overlay of live mt-Keima emission at 458 (green) and 543 nm (red) excitation in indirect flight muscle from 4-week-old w1118 (w1118;; UAS-mt-Keima, mef-2-GAL4/+), control (Ctrl) RNAi (w1118; UAS-Ctrl RNAi/+; UAS-mt-Keima, mef-2-GAL4/+), PINK1B9 (PINK1B9/+;; UAS-mt-Keima, mef-2-GAL4/+) and parkin1 RNAi (w1118; UAS-parkin1 RNAi/+; UAS-mt-Keima, mef-2-GAL4/+) flies. (B) High (543/458) ratio area/total mitochondrial area was quantified as an index of mitophagy in 1-, 3- and 4-week-old flies (n = 3–6 flies per condition). In each fly, 7 random 2500 μm2 fields were analyzed. *p=0.02 compared with 4-week-old parkin1 RNAi and PINK1B9 flies. # p=0.03 compared with 3-week-old parkin1 RNAi and PINK1B9 flies. (C) Overlay of live mt-Keima emission at 458 (green) and 543 nm (red) excitation in indirect flight muscle from 4-week-old Ctrl RNAi (w1118; UAS-Ctrl RNAi/+; UAS-mt-Keima, mef-2-GAL4/+), dUSP15 RNAi (w1118;; UAS-mt-Keima, mef-2-GAL4/UAS-CG8334 RNAi), dUSP30 RNAi (w1118; UAS-CG3016 RNAi/+; UAS-mt-Keima, mef-2-GAL4/+), parkin1 +Ctrl RNAi (w1118; UAS-parkin1 RNAi/UAS-Ctrl RNAi; UAS-mt-Keima, mef-2-GAL4/+), parkin1 +dUSP15 RNAi (w1118; UAS-parkin1 RNAi/+; UAS-mt-Keima, mef-2-GAL4/UAS-CG8334 RNAi), parkin1 +dUSP30 RNAi (w1118; UAS-parkin1 RNAi/UAS-CG3016 RNAi; UAS-mt-Keima, mef-2-GAL4/+), parkin2 +Ctrl RNAi (w1118; UAS-parkin2 RNAi/UAS-Ctrl RNAi; UAS-mt-Keima, mef-2-GAL4/+), parkin2 +dUSP15 RNAi (w1118; UAS-parkin2 RNAi/+; UAS-mt-Keima, mef-2-GAL4/UAS-CG8334 RNAi), parkin2 +dUSP30 RNAi (w1118; UAS-parkin2 RNAi/UAS-CG3016 RNAi; UAS-mt-Keima, mef-2-GAL4/+), PINK1B9B9Ctrl RNAi (PINK1B9/+; UAS-Ctrl RNAi/+; UAS-mt-Keima, mef-2-GAL4/+), PINK1B9 + dUSP15 RNAi (PINK1B9/+;; UAS-mt-Keima, mef-2-GAL4/UAS-CG8334 RNAi), and PINK1B9 + dUSP30 RNAi (PINK1B9/+; UAS-CG3016 RNAi/+; UAS-mt-Keima, mef-2-GAL4/+) flies. (D) High (543/458) ratio area/total mitochondrial area was quantified as an index of mitophagy (n = 3–4 flies per condition). *p<0.001 compared with Ctrl RNAi flies. # p<0.03 compared with parkin1 +dUSP15 RNAi flies. £ p<0.03 compared with PINK1B9 + dUSP15 RNAi flies. Scale bars, 10 µm.
-
Figure 3—source data 1
Quantification of mitophagy (high [543/458] ratio area/total mitochondrial area) in indirect flight muscle of w1118, control RNAi, PINK1B9 and parkin1 RNAi flies at 1, 3 and 4 weeks.
- https://doi.org/10.7554/eLife.35878.007
-
Figure 3—source data 2
Quantification of mitophagy (high [543/458] ratio area/total mitochondrial area) in indirect flight muscle of 4-week-old control RNAi, dUSP15 RNAi, dUSP30 RNAi, parkin1 + control RNAi, parkin1 + dUSP15 RNAi, parkin1 + dUSP30 RNAi, parkin2 + control RNAi, parkin2 + dUSP15 RNAi, parkin2 + dUSP30 RNAi, PINK1B9 +control RNAi, PINK1B9 + dUSP15 RNAi, and PINK1B9 + dUSP30 RNAi flies.
- https://doi.org/10.7554/eLife.35878.008
Figure 4
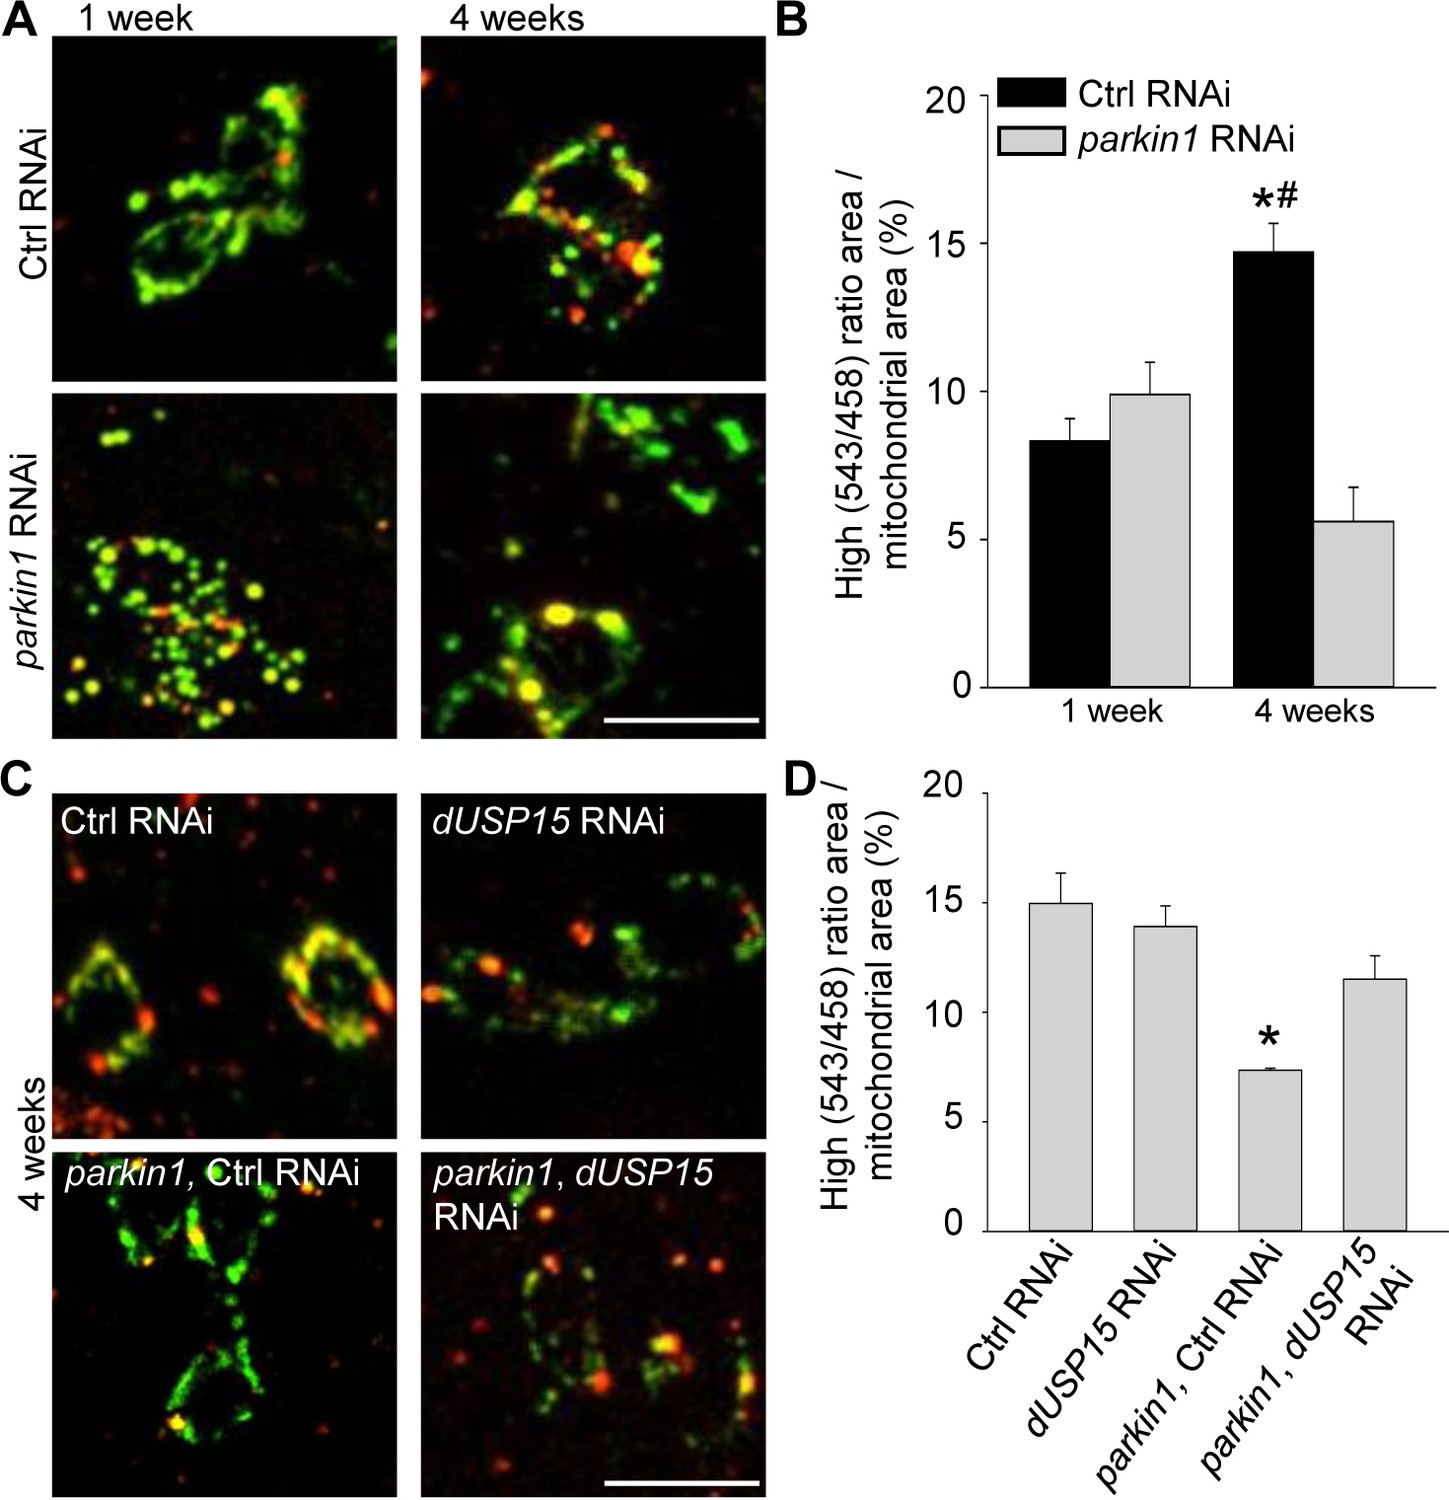
Parkin deficiency impairs mitophagy in dopaminergic neurons.
(A) Overlay of live mt-Keima emission at 458 (green) and 543 nm (red) excitation in PPL1 dopaminergic neurons from 1- and 4-week-old control (Ctrl) RNAi (w1118; UAS-Ctrl RNAi/+; UAS-mt-Keima, TH-GAL4/+) and parkin1 RNAi (w1118; UAS-parkin1 RNAi/+; UAS-mt-Keima, TH-GAL4/+) flies. (B) High (543/458) ratio area/total mitochondrial area was quantified as an index of mitophagy (n = 4 flies per condition). In each fly, 10 dopaminergic neurons were analyzed. *p=0.001 compared with 4-week-old parkin RNAi flies. # p=0.004 compared with 1-week-old Ctrl RNAi flies. (C) Overlay of live mt-Keima emission at 458 (green) and 543 nm (red) excitation in PPL1 dopaminergic neurons from 4-week-old Ctrl RNAi (w1118; UAS-Ctrl RNAi/+; UAS-mt-Keima, TH-GAL4/+), dUSP15 RNAi (w1118;; UAS-mt-Keima, TH-GAL4/UAS-CG8334 RNAi), parkin1 +Ctrl RNAi (w1118; UAS-parkin1 RNAi/UAS-Ctrl RNAi; UAS-mt-Keima, TH-GAL4/+), and parkin1 +dUSP15 RNAi (w1118; UAS-parkin1 RNAi/+; UAS-mt-Keima, mef-2-GAL4/UAS-CG8334 RNAi) flies. (D) High (543/458) ratio area/total mitochondrial area in 4-week-old flies was quantified as an index of mitophagy (n = 3–4 flies per condition). *p<0.05 compared with all other conditions. Scale bars, 10 µm.
-
Figure 4—source data 1
Quantification of mitophagy (high [543/458] ratio area/total mitochondrial area) in PPL1 dopaminergic neurons from control RNAi and parkin1 RNAi flies at 1 and 4 weeks.
- https://doi.org/10.7554/eLife.35878.010
-
Figure 4—source data 2
Quantification of mitophagy (high [543/458] ratio area/total mitochondrial area) in PPL1 dopaminergic neurons from 4-week-old control RNAi, dUSP15 RNAi, parkin1 +control RNAi, and parkin1 +dUSP15 RNAi flies.
- https://doi.org/10.7554/eLife.35878.011
Tables
Key resources table
| Reagent type (species) or resource | Designation | Source or reference | Identifiers | Additional information |
|---|---|---|---|---|
| Strain (D. melanogaster) | parkin KK RNAi | VDRC | 107919 RRID:FlyBase_FBst0476221 | Named parkin2 RNAi in this paper |
| Strain (D. melanogaster) | dUSP15 RNAi | VDRC | 18981 RRID:BDSC_61871 | |
| Strain (D. melanogaster) | dUSP30 RNAi | NIG-Fly Stock Center | 3016 R-2 | |
| Strain (D. melanogaster) | control TRiP RNAi | BDSC | 31603 RRID:BDSC_31603 | |
| Strain (D. melanogaster) | parkin TRiP RNAi | BDSC | 37509 RRID:BDSC_37509 | Named parkin1 RNAi in this paper |
| Strain (D. melanogaster) | mef-2-GAL4 | BDSC | 27390 RRID:BDSC_27390 | |
| Strain (D. melanogaster) | TH-GAL4 | BDSC | 8848 RRID:BDSC_8848 | |
| Strain (D. melanogaster) | PINK1B9 | BDSC | 34749 RRID:BDSC_34749 | |
| Strain (D. melanogaster) | Atg1K38A | BDSC | 60736 RRID:BDSC_60736 | |
| Strain (D. melanogaster) | VK20 | BDSC | 9738 RRID:BDSC_9738 | |
| Strain (D. melanogaster) | mt-Keima | This paper | mt-Keima cDNA was cloned into the NotI and Xba1 sites of pUAS-attB and inserted in integration site VK20 after in-house injection | |
| Antibody | ATP synthase β | Abcam | ab14730 RRID:AB_301438 | 1:500 |
| Recombinant DNA reagent | mt/mKeima/pIND(SP1) | Katayama et al. (2011) | Gift from Dr. A. Miyawaki (RIKEN Brain Science Institute, Japan) |
Additional files
-
Transparent reporting form
- https://doi.org/10.7554/eLife.35878.012
Download links
A two-part list of links to download the article, or parts of the article, in various formats.
Downloads (link to download the article as PDF)
Open citations (links to open the citations from this article in various online reference manager services)
Cite this article (links to download the citations from this article in formats compatible with various reference manager tools)
Deficiency of parkin and PINK1 impairs age-dependent mitophagy in Drosophila
eLife 7:e35878.
https://doi.org/10.7554/eLife.35878


