NPAS4 recruits CCK basket cell synapses and enhances cannabinoid-sensitive inhibition in the mouse hippocampus
- University of California San Diego, United States
Figures
Figure 1 with 1 supplement
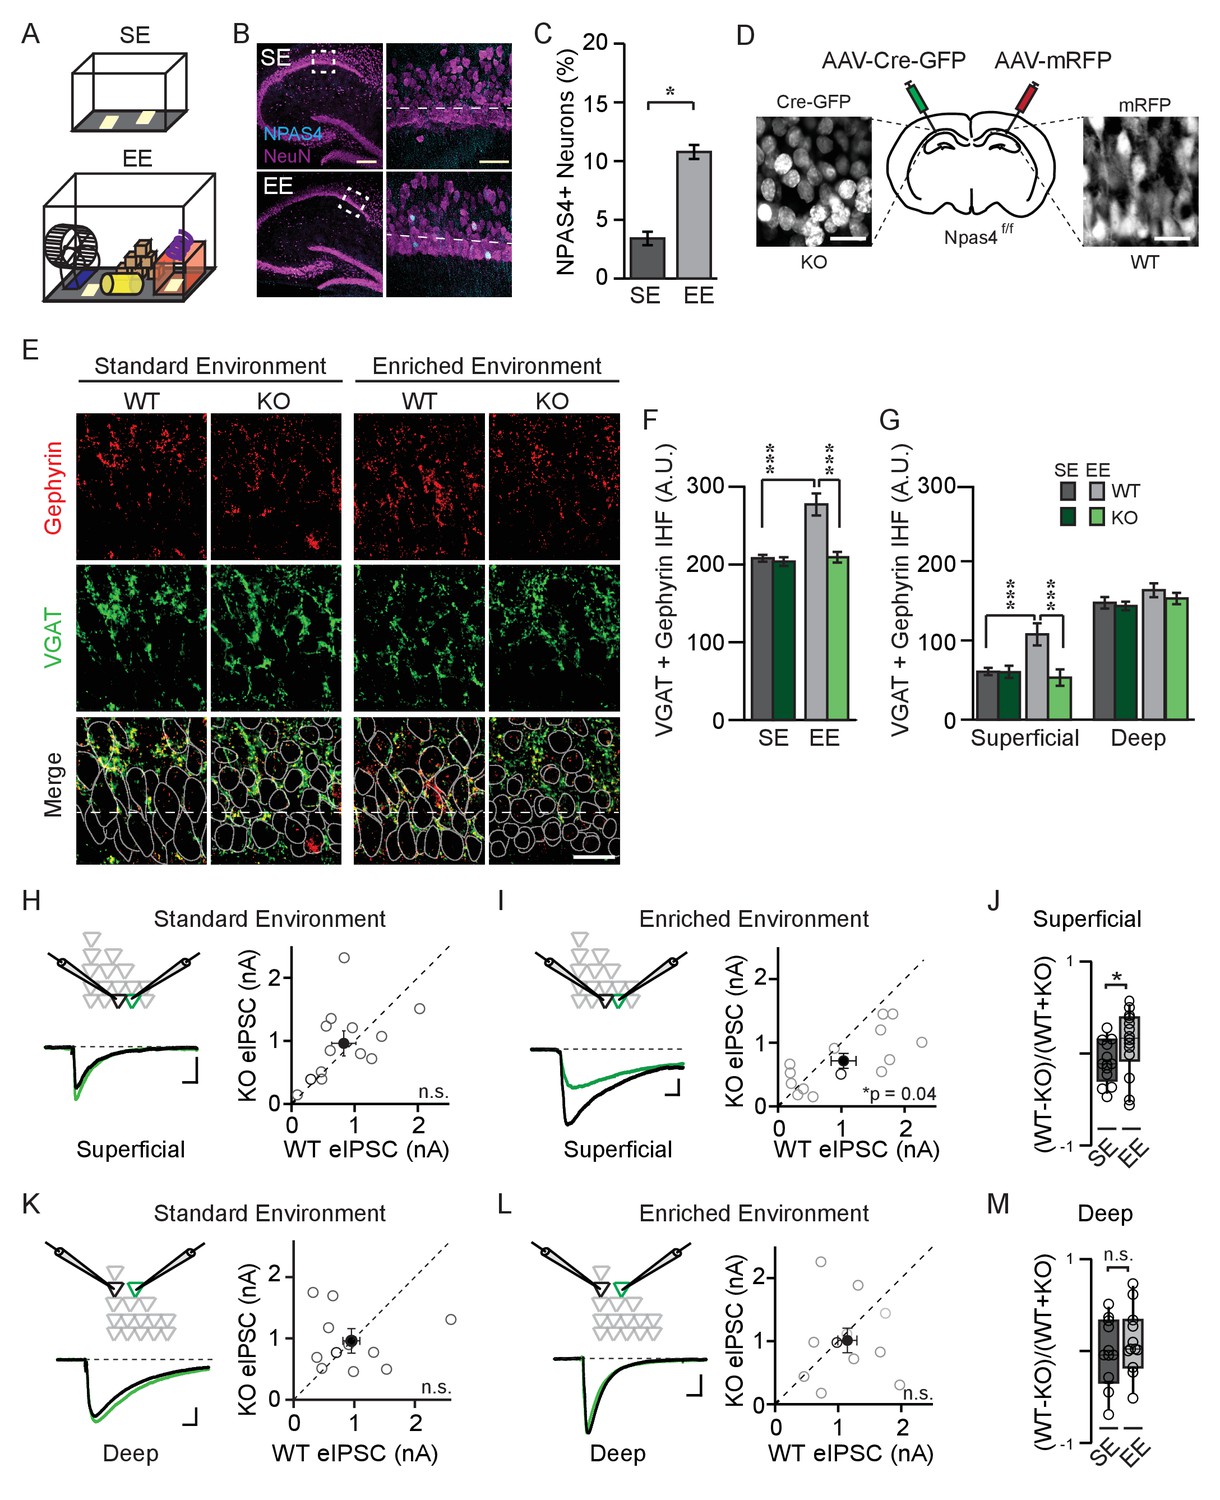
NPAS4 enhances somatic inhibition onto superficial CA1 pyramidal neurons.
(A) Cartoon of standard environment (SE) and enriched environment (EE). (B) Confocal images of mouse hippocampi from SE (top) and EE (bottom) stained with antibodies recognizing NPAS4 (cyan) and NeuN (magenta). Left: box indicates the region imaged at high magnification and quantified for NPAS4-positive neurons. Scale bar = 200 µm. Right: higher magnification of the boxed regions shown in the images on the left. Dashed lines indicate the boundary of superficial CA1 (25 μm from edge of pyramidal cell layer). Scale bar = 50 μm. (C) Quantification of NPAS4-positive neurons in CA1 in mice from SE and EE (n = 10 sections over 3 mice per condition). * indicates p<0.05. (D) Schematic of stereotaxic adeno-associated virus (AAV) infection of CA1 in Npas4f/f mice. The hemispheres of each mouse were randomly assigned to control or knock-out (KO) conditions and hippocampi were infected accordingly with AAV-Cre-GFP (left) and AAV-RFP (right) in the contralateral hemisphere. (E) Representative images stained with antibodies recognising gephyrin (red) or presynaptic vesicular GABA transporter (VGAT) (green) and merged immunohistochemistry (IHC) from WT and Npas4 KO hemispheres from mice housed in SE and EE. Gray dotted lines in merged images represent cell body outlines in the WT condition (mRFP expression) or in cell nuclei in the Npas4 KO condition (Cre-GFP expression). Scale bar = 20 μm. (F) Quantification of inhibitory synapses (overlap of VGAT and gephyrin immunofluorescence) in WT and Npas4 KO hemispheres from mice housed in SE and EE (SE: n = 10–11 sections from a total of 5 mice; EE: n = 9–11 sections from a total of 6 mice). *** indicates p<0.001. (G) Quantification of inhibitory synapses (overlap of gephyrin and VGAT immunofluorescence in superficial and deep sublayers of CA1 in WT and Npas4 KO hemispheres from mice housed in SE and EE (SE: n = 7 sections from a total of 3 mice, EE: n = 4–6 sections from a total of 3 mice). *** indicates p<0.001. (H) Standard environment: example eIPSC from WT (black) and KO (green) PNs in superficial CA1 (left). Pairwise comparison of eIPSCs recorded in neighboring WT and Npas4 KO neurons (gray, right, n = 11 pairs). (I) Enriched environment: example eIPSC from WT (black) and KO (green) PNs in superficial CA1 (left). Pairwise comparison of eIPSCs recorded in neighboring WT and Npas4 KO neurons from mice housed in EE (gray, right, n = 14 pairs). (J) Normalized eIPSCs recorded from WT and KO pairs across SE and EE for superficial CA1. * indicates p<0.05. (K) Standard environment: example eIPSC from WT (black) and KO (green) PNs in deep CA1 (left). Pairwise comparison of eIPSCs recorded from neighboring deep WT and Npas4 KO PNs (right, n = 11 pairs). (L) Enriched environment: example eIPSC from WT (black) and KO (green) PNs in deep CA1 (left). Pairwise comparison of eIPSCs recorded from neighboring deep WT and Npas4 KO PNs (right, n = 11 pairs). In (H–I) and (K–L), open circles indicate individual pairs, the darker circle is the example trace, and the filled circle indicates the mean ± SEM. (M) Normalized eIPSCs recorded from WT and KO pairs across SE and EE for deep CA1.
-
Figure 1—source data 1
NPAS4 enhances somatic inhibition onto superficial CA1 PNs.
- https://doi.org/10.7554/eLife.35927.005
Figure 1—figure supplement 1
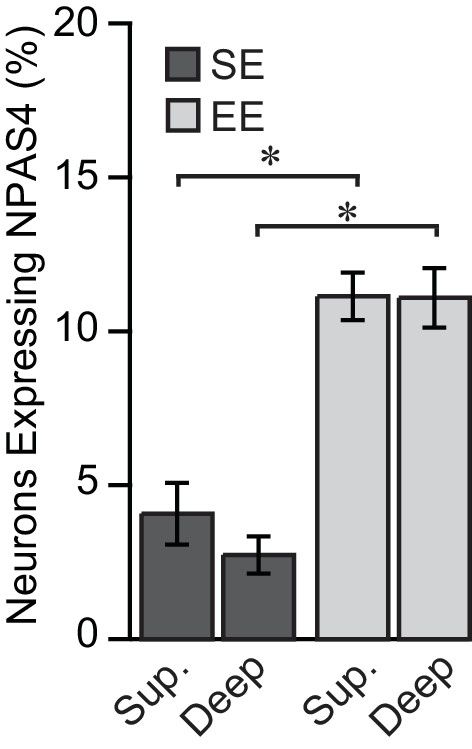
Superficial and deep CA1 PNs express NPAS4 equivalently after exploration of an EE.
Quantification of NPAS4-positive neurons in superficial and deep CA1 PNs in mice from SE and EE (n = 10 sections from a total of 3 mice per condition). * indicates p<0.05.
-
Figure 1—figure supplement 1—source data 1
NPAS4 expression in superficial and deep CA1.
- https://doi.org/10.7554/eLife.35927.004
Figure 2 with 1 supplement
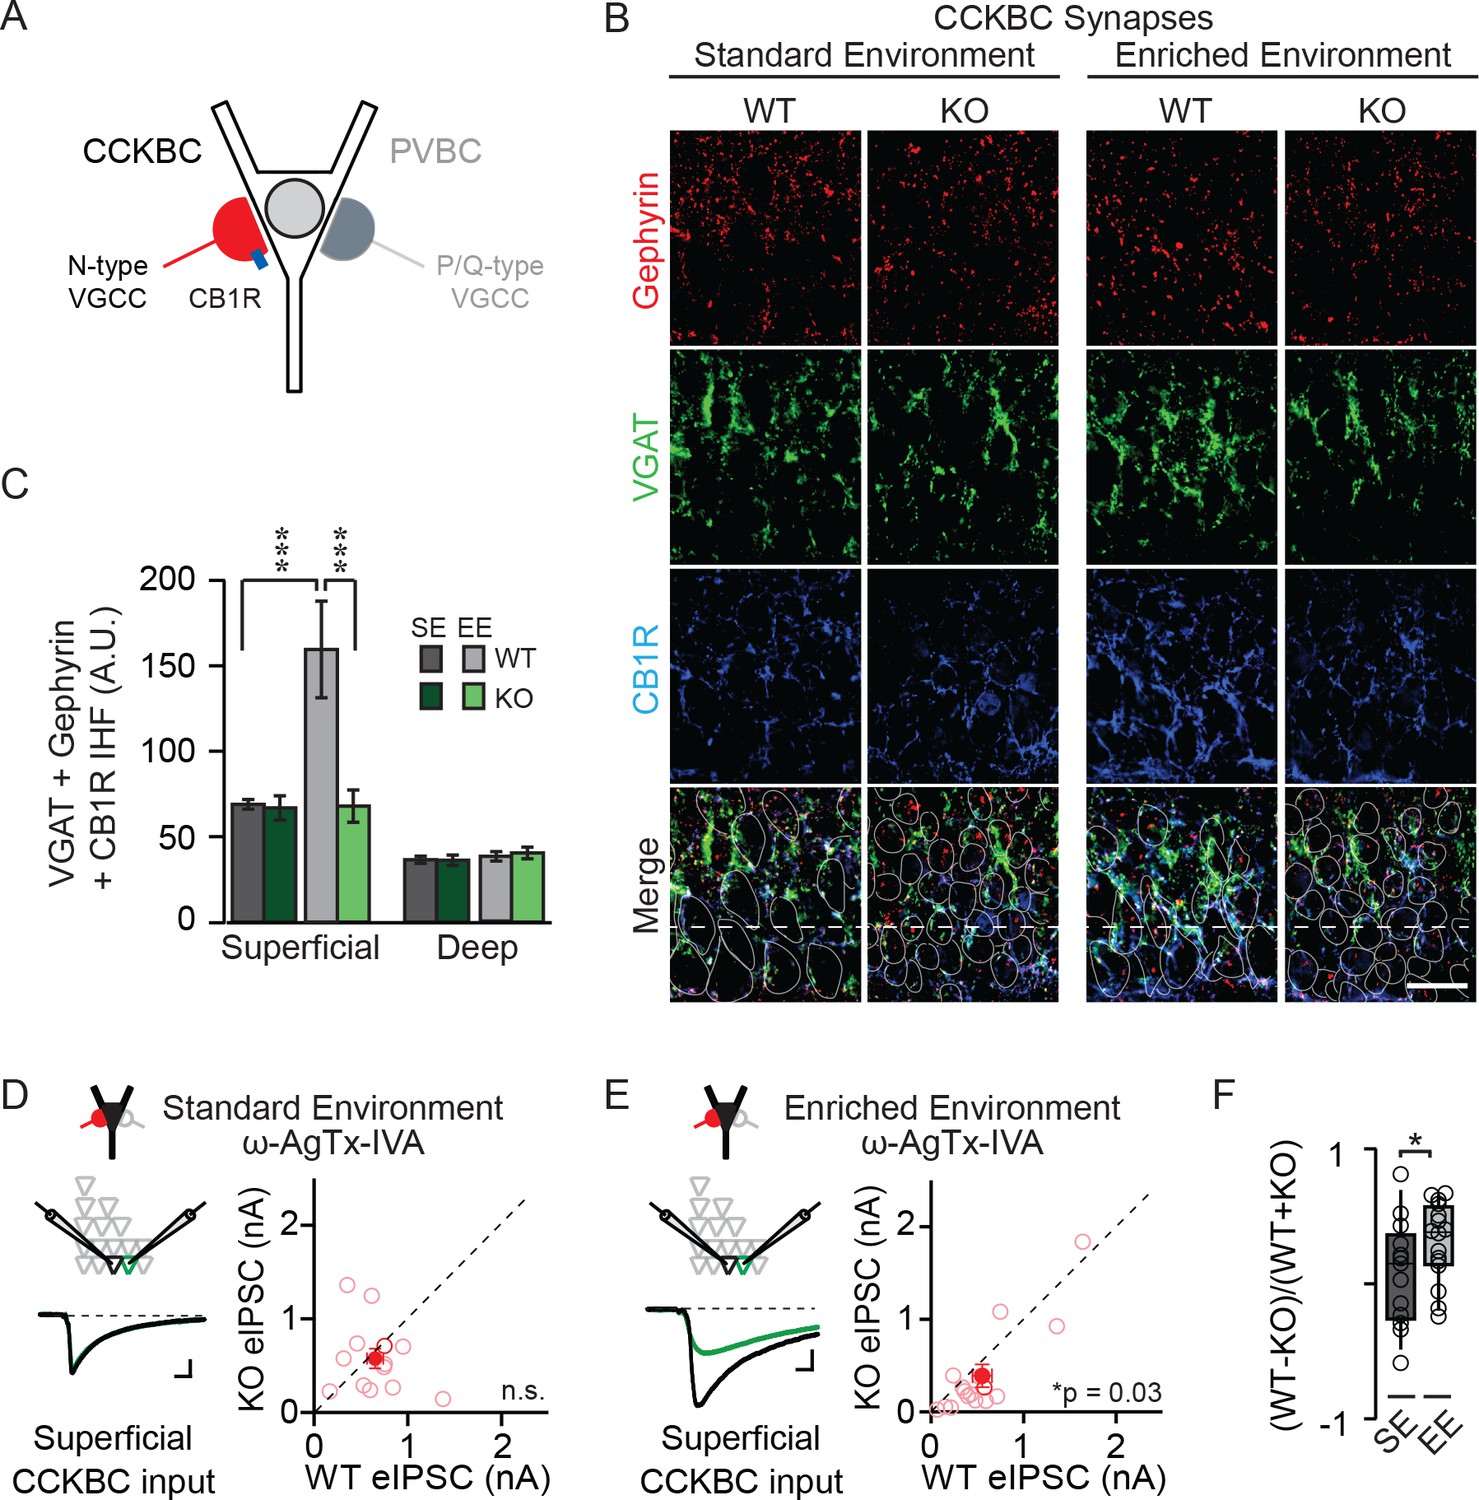
NPAS4 regulates CCKBC input onto PNs in superficial CA1.
(A) Schematic representation of PN with CCKBC and PVBC synaptic input. CCKBC boutons contain CB1Rs (blue) and utilize N-type VGCCs for neurotransmission. (B) Representative images of tissues stained with antibodies against gephyrin (red), VGAT (green) or CB1R (blue) and merged IHC from WT and Npas4 KO hemispheres from mice housed in SE and EE. Gray dotted lines in merged images represent cell body outlines in the WT condition (mRFP expression) or cell nuclei in the Npas4 KO condition (Cre-GFP expression). (C) Quantification of CCKBC synapses (overlap of gephyrin, VGAT, and CB1R) in superficial and deep CA1 of WT and Npas4 KO hemispheres from mice housed in SE and EE (SE: n = 7 sections from a total of 3 mice, EE: n = 4–6 sections from a total of 3 mice). *** indicates p<0.001. (D) ω-AgTx-IVA (0.3 μM) is used to isolate synaptic release from CCKBCs. Example eIPSCs from WT (black) and Npas4 KO (green) PNs in superficial CA1 (left) of mice housed in SE. Pairwise comparison of eIPSCs recorded in neighboring WT and Npas4 KO neurons (right, n = 13 pairs). (E) As in (D) but from mice housed in EE. Pairwise comparison of eIPSCs recorded in neighboring WT and Npas4 KO neurons (right, n = 16 pairs). (F) Normalized CCKBC eIPSCs recorded from WT and KO pairs across SE and EE for superficial CA1. * indicates p<0.05.
-
Figure 2—source data 1
NPAS4 regulates CCKBC input onto PNs in superficial CA1.
- https://doi.org/10.7554/eLife.35927.009
Figure 2—figure supplement 1
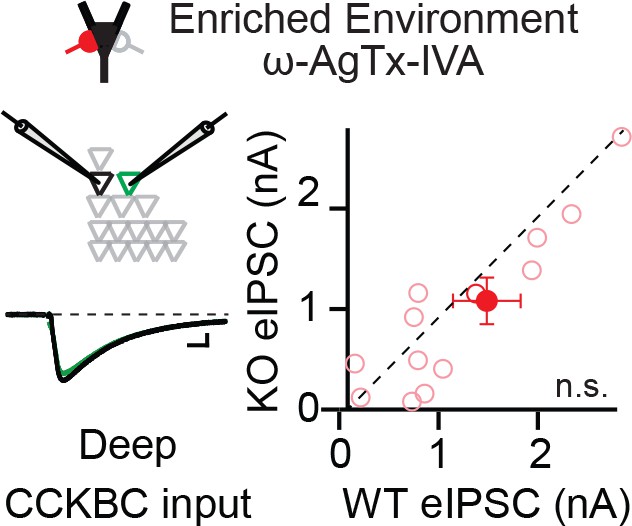
Experience-induced Npas4 does not affect CCKBC input onto deep CA1 PNs.
ω-AgTx-IVA (0.3 μM) is used to isolate synaptic release from CCKBCs. Example eIPSCs from WT (black) and Npas4 KO (green) PNs in deep CA1 (left) of mice housed in EE. Pairwise comparison of eIPSCs recorded in neighboring WT and Npas4 KO neurons (right, n = 13 pairs).
-
Figure 2—figure supplement 1—source data 1
Experience-induced Npas4 does not affect CCKBC input onto deep CA1 PNs.
- https://doi.org/10.7554/eLife.35927.008
Figure 3 with 1 supplement
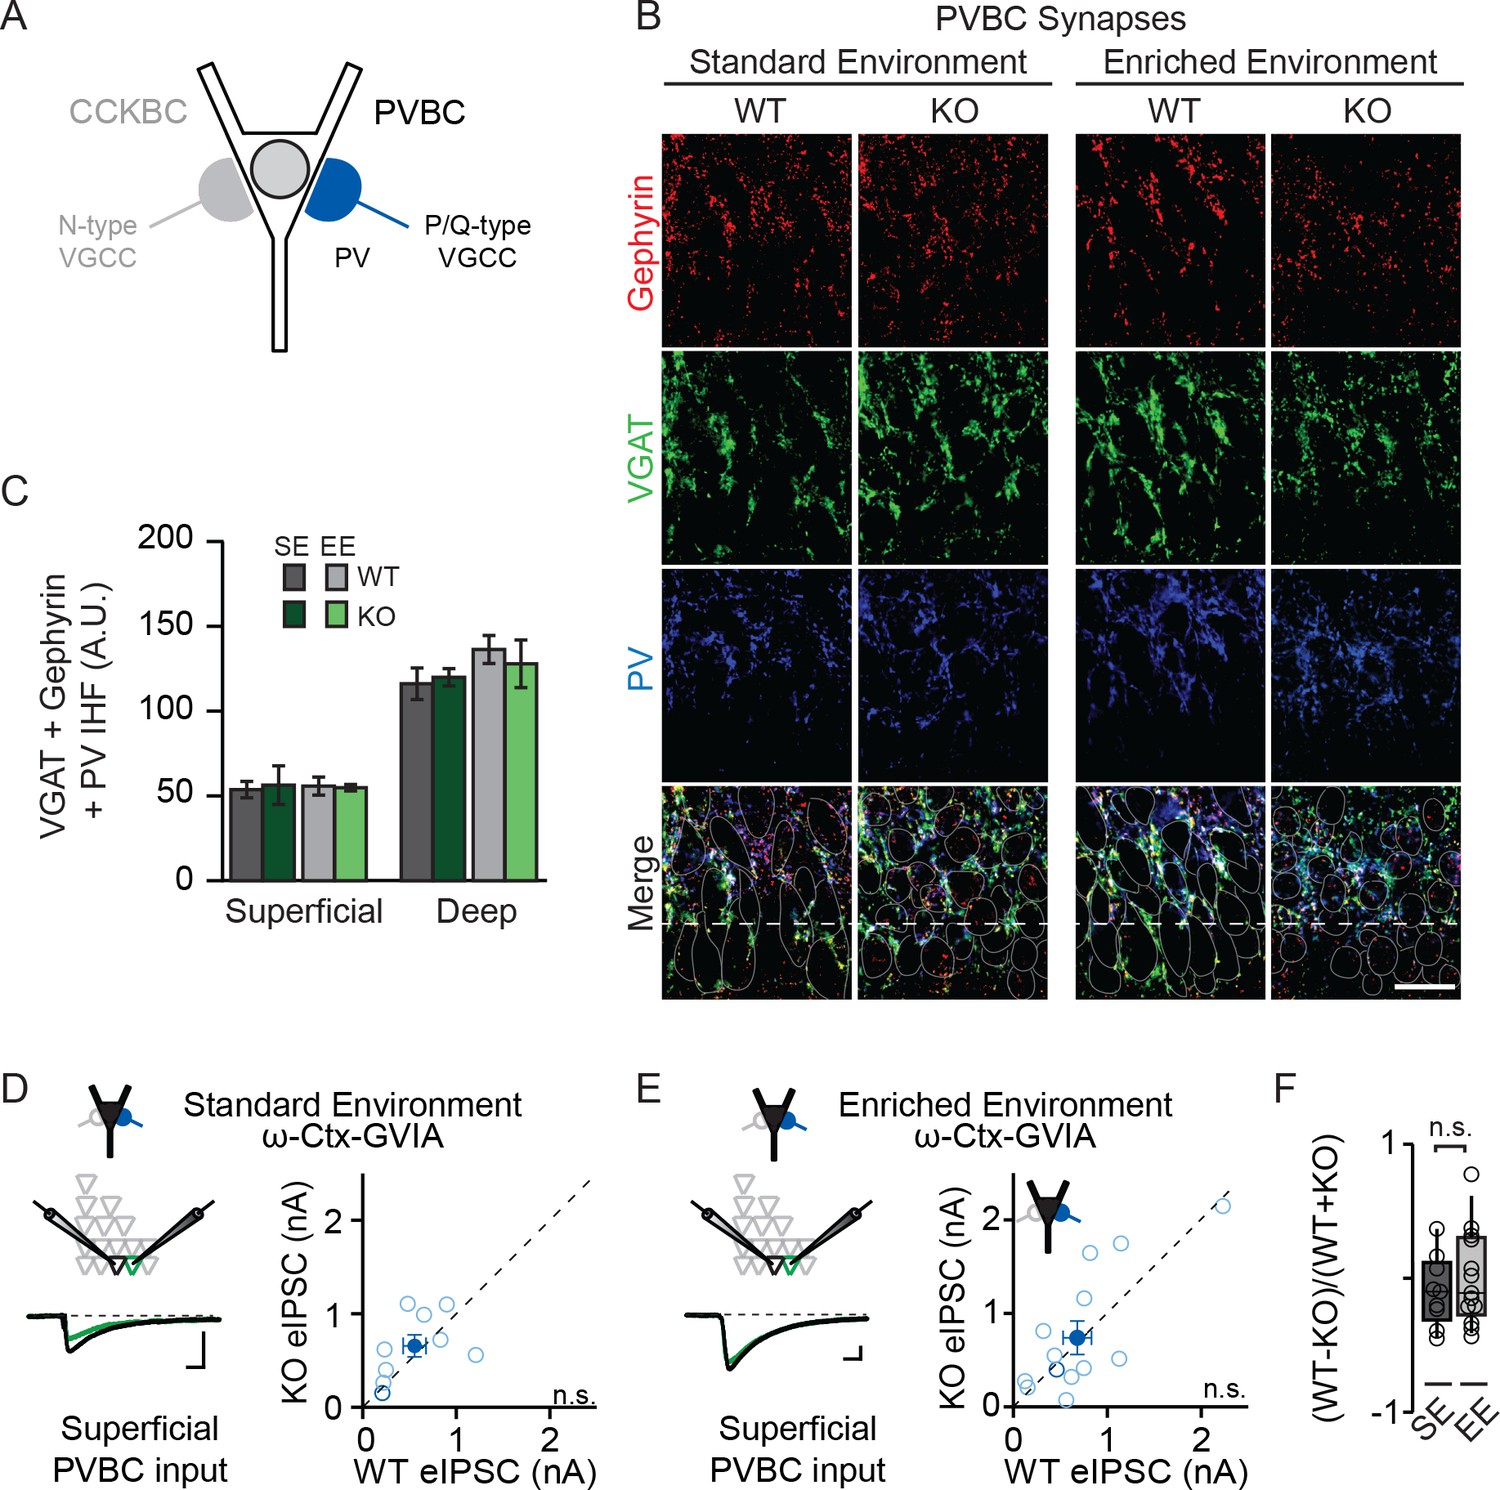
NPAS4 does not regulate PVBC input onto PNs in CA1.
(A) Schematic representation of PN with CCKBC and PVBC synaptic input. PVBCs express PV (blue) and utilize P/Q-type VGCCs for neurotransmission. (B) Representative images of tissues stained with antibodies against gephyrin (red), VGAT (green) or PV (blue) and merged IHC from WT and Npas4 KO hemispheres from mice housed in SE and EE. Gray dotted lines in merged images represent cell body outlines in the WT condition (mRFP expression) or cell nuclei in the Npas4 KO condition (Cre-GFP expression). Scale bar = 20 μm. (C) Quantification of PVBC synapses (overlap of gephyrin, VGAT, and PV) in superficial and deep CA1 of WT and Npas4 KO hemispheres from mice housed in SE and EE (SE: n = 3–4 sections per condition from a total of 3 mice; EE: n = 5 sections per condition from a total of 3 mice). (D) ω-Ctx-GVIA (1 μM) is used to isolate synaptic release from PVBCs. Example eIPSCs from WT (black) and Npas4 KO PNs (green) in superficial CA1 (left) of mice housed in SE. Pairwise comparison of eIPSCs recorded in neighboring WT and Npas4 KO neurons (right, n = 9 pairs). (E) As in (D) but from mice housed in EE. Pairwise comparison of eIPSCs recorded in neighboring WT and Npas4 KO neurons (right, n = 13 pairs). (F) Normalized PVBC eIPSCs recorded from WT and KO pairs across SE and EE for deep CA1.
-
Figure 3—source data 1
NPAS4 does not regulate PVBC input onto PNs in CA1.
- https://doi.org/10.7554/eLife.35927.013
Figure 3—figure supplement 1

Experience-induced NPAS4 does not affect PVBC input onto deep CA1 PNs.
ω-Ctx-GVIA (1 μM) is used to isolate synaptic release from PVBCs. Example eIPSCs from WT (black) and Npas4 KO (green) PNs in deep CA1 (left) of mice housed in EE. Pairwise comparison of eIPSCs recorded in neighboring WT and Npas4 KO neurons (right, n = 11 pairs).
-
Figure 3—figure supplement 1—source data 1
Experience-induced NPAS4 does not affect PVBC input onto deep CA1 PNs.
- https://doi.org/10.7554/eLife.35927.012
Figure 4 with 1 supplement

Enriched environment increases inhibition of CA1 PNs by CCKBCs but not PVBCs.
(A–C) Electrophysiological characteristics of PV inhibitory neurons (INs) and CCK INs: (A) example spike trains (scale bar = 50 ms, 10 mV), (B) AP FWHM) n=17 for PV INs, n=20 for CCK INs), *** indicates p<0.001, and (C) AP frequency adaptation over time (n=17 for PV INs, n=19 for CCK INs). (D) Schematic of recording from synaptically connected PVBC and WT PN pairs for panels (E–F). Whole-cell patch clamp recordings were established from PVBCs and synaptically connected WT PNs in mice from SE or EE. (E) Examples of PVBC APs (top) and PN uIPSCs (bottom) recorded from mice in SE (light blue) and EE (dark blue). Scale bars: top = 50 ms, 10 mV, bottom = 50 ms, 100 pA. (F) Average uIPSC amplitudes measured from PVBC-WT PN pairs from mice in SE (light blue) and EE (dark blue) (SE: n = 14 pairs, EE: n = 10 pairs). Open circles represent individual data points. (G) Schematic of recording from synaptically connected CCKBC and WT PN pairs for panels (H–I). Whole-cell patch clamp recordings were established from CCKBCs and synaptically connected WT PNs in mice from SE or EE. (H) Examples of CCKBC APs (top) and PN uIPSCs (bottom) recorded from mice in SE (pink) and EE (red). Scale bars: top = 50 ms, 10 mV, bottom = 50 ms, 100 pA. (I) Average uIPSC amplitudes recorded from CCKBC–PN pairs from mice in SE (pink) and EE (red) (SE: n = 10 pairs, EE: n = 12 pairs).
-
Figure 4—source data 1
Distinguishing CCKBCs from CCK SCA interneurons.
- https://doi.org/10.7554/eLife.35927.016
Figure 4—figure supplement 1
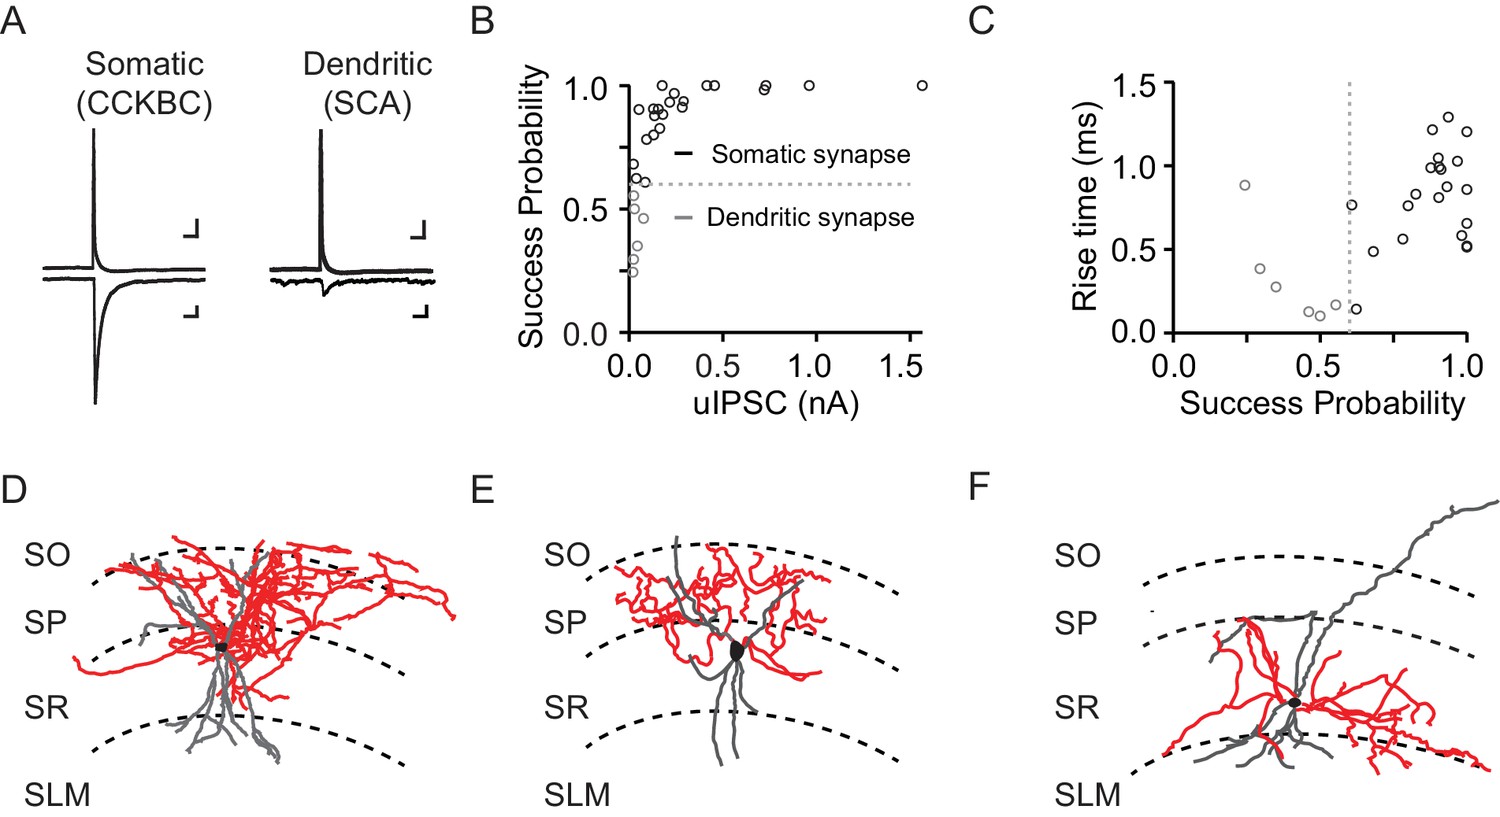
CCKBCs were differentiated from dendritic Schaffer collateral-associated (SCA) interneurons by synaptic properties and morphology.
(A) Examples of presynaptic APs (top) and postsynaptic uIPSCs (bottom) recorded from somatic (left) and dendritic-targeting (right) INs and PNs, respectively. Scale bar = 25 ms, 50 pA. (B) uIPSC amplitudes vs. success probability for pairs of somatic and dendritic-targeting CCK INs and PNs. Dotted line represents the cut off for somatic vs. dendritic synapses (Success probability=0.6). (C) Success probability vs. uIPSC 10–90% rise times (ms) for somatic and dendritic-targeting CCK INs. (D–F) Biocytin reconstructions of CCK INs, including CCKBCs (D–E) and a SCA neuron (F), showing axon (red) and dendrites (gray).
Figure 5 with 1 supplement
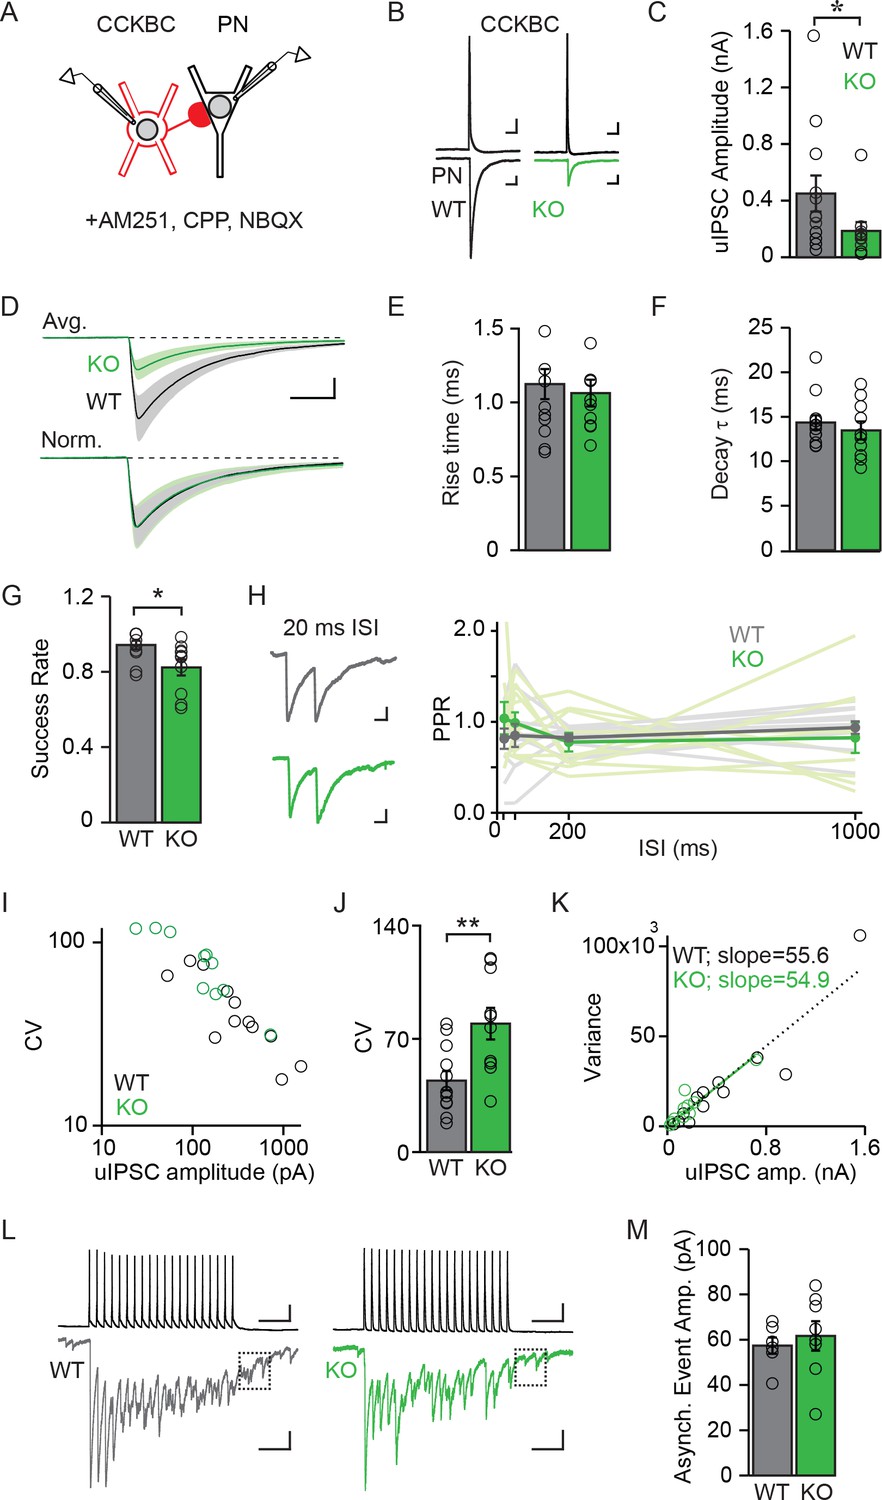
NPAS4 regulates the number of CCKBC synapses onto PNs but does not alter synaptic properties.
(A) Schematic of recording from synaptically connected CCKBC and WT or Npas4 KO PN pairs. (B) Examples of CCKBC APs (top) and PN uIPSCs (bottom) recorded from WT and Npas4 KO PNs. Scale bars: top = 25 ms, 10 mV; bottom = 25 ms, 50 pA. (C) Average uIPSC amplitudes recorded from CCKBC–PN pairs for WT and Npas4 KO PNs. (D) Average uIPSC amplitudes recorded from CCKBC–PN pairs for WT and Npas4 KO PNs (top) and normalized by amplitude (bottom). Scale bars = 10 ms, 100 pA. (E) 10–90% uIPSC rise times from CCKBC–PN pairs with WT and Npas4 KO PNs. (F) Decay time constants (τ) from CCKBC–PN pairs with WT and Npas4 KO PNs. (G) Success rate for CCKBC-PN pairs between WT and Npas4 KO PNs. Open circles represent individual data points. (H) Left: example paired-pulse uIPSCs from WT (black) and Npas4 KO (green) PNs recorded from CCKBC–PN pairs with a 20 ms inter-spike interval (ISI). Scale bar = 10 ms, 50 pA. Right: paired-pulse ratios (PPRs) for ISIs of 20 ms, 50 ms, 200 ms, and 1000 ms between CCKBC–PN pairs with WT and Npas4 KO PNs. (I) uIPSC amplitude versus coefficient of variation (CV) for CCKBC–PN pairs with WT and Npas4 KO PNs. (J) Average CV of the uIPSC recorded in WT and Npas4 KO PNs. (K) uIPSC amplitude and variance of amplitude for CCKBC–PN pairs with WT (black) and Npas4 KO (green) PNs. The dotted black line indicates best linear fit for WT (R2 = 0.89) and the solid green line indicates best linear fit for Npas4 KO (R2 = 0.84) data. (L) Example traces of 20 APs at 40 Hz and the resulting uIPSC trains for CCKBC–PN pairs with WT (black) and Npas4 KO (green) PNs. The dashed box indicates the window analyzed for asynchronous release (100 ms after the end of the AP train). Scale bars = 100 ms, 10 mV (top) and 100 ms, 100 pA (bottom). (M) Asynchronous event amplitude measured during the 100 ms following the end of CCKBC AP firing for CCKBC–PN pairs with WT and Npas4 KO PNs. (C–K) WT: n=12 pairs, KO: n=10 pairs; (M) WT: n=6; KO: n=8. For all panels, data from WT PNs are shown in black/gray; data from KO PNs are shown in green. Data are shown as mean ± SEM. *p<0.05; **p<0.01.
-
Figure 5—source data 1
Properties of CCKBC synapses made onto WT and Npas4 KO PNs.
- https://doi.org/10.7554/eLife.35927.020
Figure 5—figure supplement 1

CCKBC–PN pairs with WT and KO PNs have similar uIPSC onset times.
Latency to uIPSC onset between CCKBC–PN pairs with WT and Npas4 KO PNs (WT: n=12 pairs, KO: n=10 pairs). Example AP from a CCKBC (black) and average uIPSCs from WT (gray) and Npas4 KO (green) PNs. Average onset times and standard errors are shown above traces for WT (gray) and Npas4 KO (green) PNs.
-
Figure 5—figure supplement 1—source data 1
uIPSC onset times.
- https://doi.org/10.7554/eLife.35927.019
Figure 6
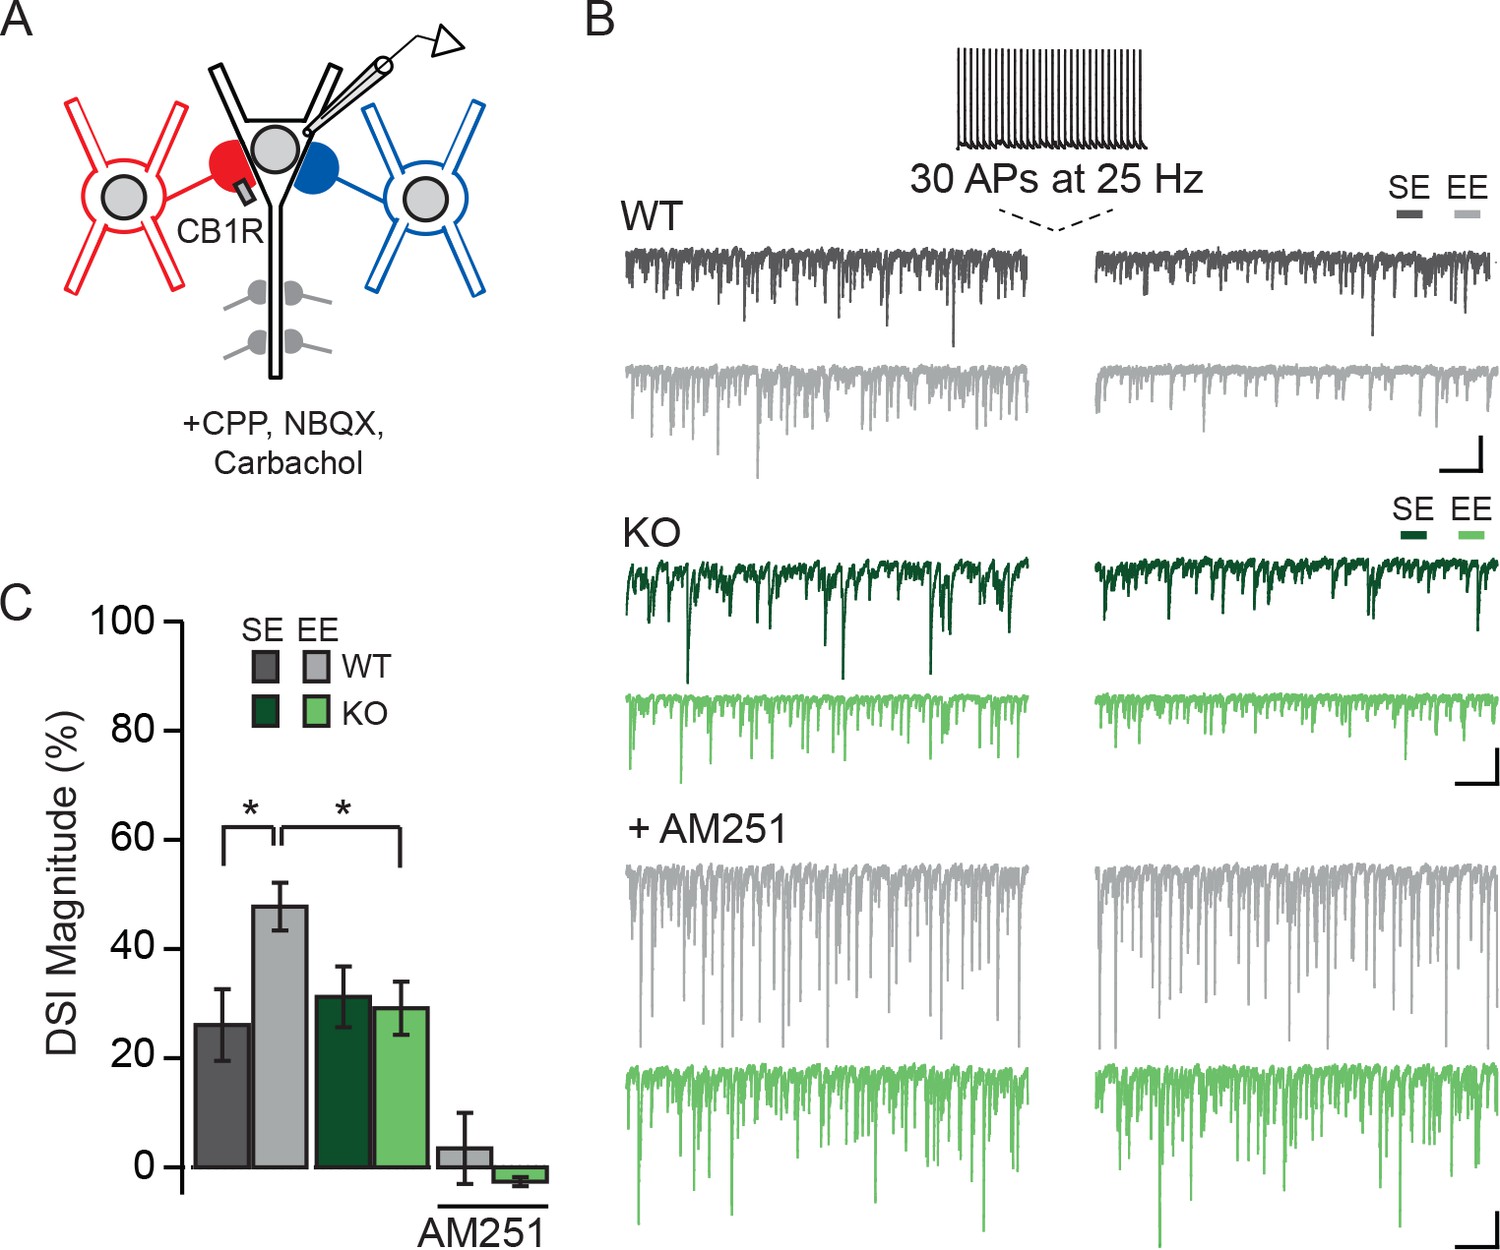
Experience-driven NPAS4 expression enhances the magnitude of DSI in PNs.
(A) Schematic of recording configuration; somatic and dendritic inhibitory inputs are represented. Whole-cell patch clamp recordings were obtained from WT (shown) or Npas4 KO PNs. Spontaneous IPSCs were recorded before and after inducing DSI by firing 30 APs at 25 Hz in PN. (B) Example traces from the experiment described in (A) from WT (gray) and Npas4 KO (green) PNs recorded in slices from mice in SE, EE, and EE in the presence of the CB1R antagonist AM251 (5 μM). (C) DSI magnitude (% reduction in charge after DSI induction) in WT and KO PNs from mice taken from SE, EE, and EE recorded in the presence of AM251 (SE: n=15 WT and 14 KO PNs, EE: n = 14 WT and 13 KO PNs, EE with AM251: n = 11 WT and 11 KO PNs). All scale bars = 500 ms, 200 pA. Data are shown as mean ± SEM. *p<0.05.
-
Figure 6—source data 1
DSI in WT and Npas4 KO PNs.
- https://doi.org/10.7554/eLife.35927.022
Tables
Key resources table
| Reagent type (species) or resource | Designation | Source or reference | Identifiers | Additional information |
|---|---|---|---|---|
| Gene (Mus musculus) | Npas4 | NA | Gene ID: 225872 | |
| Genetic reagent (Mus musculus) | Npas4f/f | Michael Greenberg (HMS) | ||
| Genetic reagent (Adeno-associated virus) | Cre-GFP | Penn Vector Core | AAV1.hSyn.HI.eGFP- Cre.WPRE.SV40 | |
| Genetic reagent (Adeno-associated virus) | mRFP | Penn Vector Core | AAV1.hSyn.TurboRFP.WPRE.rBG | |
| Antibody | anti-Npas4 | Michael Greenberg (HMS) | 1 to 1000 | |
| Antibody | anti-Gephyrin | Synaptic Systems | RRID:AB_2619834 | 1 to 200 |
| Antibody | anti-VGAT | Synaptic Systems | RRID:AB_887873 | 1 to 350 |
| Antibody | anti-CB1R | Synaptic Systems | RRID: AB_2619970 | 1 to 500 |
| Antibody | anti-parvalbumin | Abcam | RRID:AB_298032 | 1 to 1000 |
| Antibody | anti-NeuN | Synaptic Systems | RRID:AB_2619988 | 1 to 1000 |
Additional files
-
Transparent reporting form
- https://doi.org/10.7554/eLife.35927.023
Download links
A two-part list of links to download the article, or parts of the article, in various formats.
Downloads (link to download the article as PDF)
Open citations (links to open the citations from this article in various online reference manager services)
Cite this article (links to download the citations from this article in formats compatible with various reference manager tools)
NPAS4 recruits CCK basket cell synapses and enhances cannabinoid-sensitive inhibition in the mouse hippocampus
eLife 7:e35927.
https://doi.org/10.7554/eLife.35927


