Non-rhythmic head-direction cells in the parahippocampal region are not constrained by attractor network dynamics
- Medical Faculty of Heidelberg University and German Cancer Research Center, Germany
Figures
Figure 1 with 2 supplements
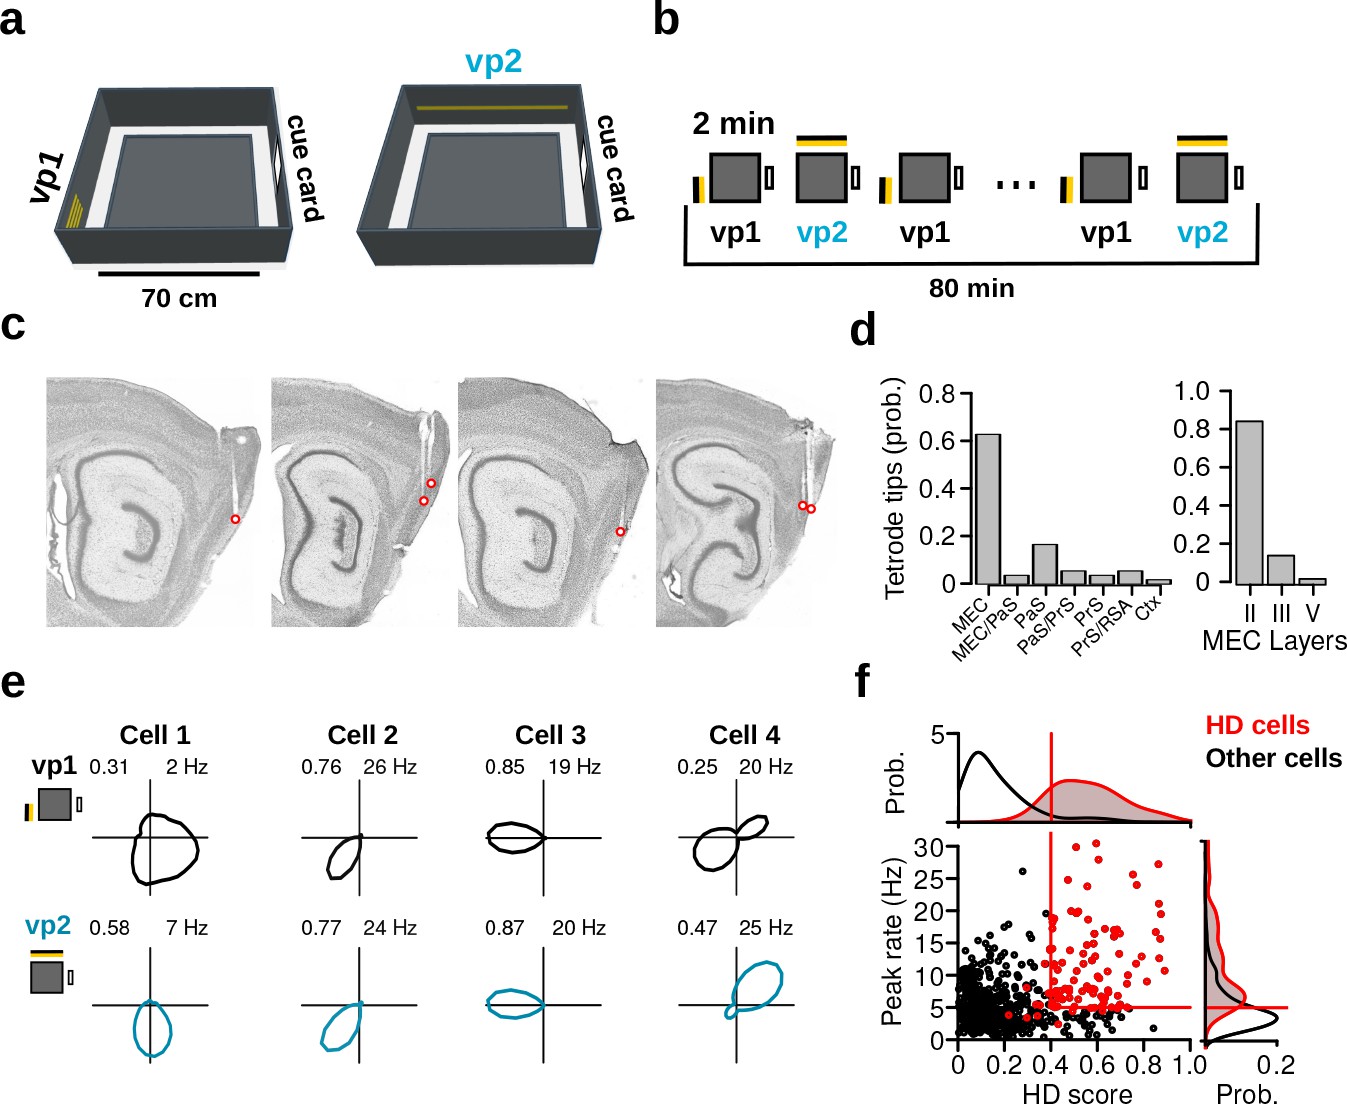
Recording protocol, histological results and examples of HD cells.
(a) The recording environment was an elevated square platform surrounded by four walls. Two distinct visual patterns (vp1 and vp2) made of LED strips were attached to two adjacent walls. A standard paper cue card was attached to a third wall. (b) Recording sessions comprised a sequence of forty 2-min trials that alternated between vp1 and vp2 trials. (c) Sagittal brain sections showing representative recording sites in the MEC and PaS. Red circles indicate tetrode tips. (d) Distribution of tetrode tips across brain regions and different layers. MEC: medial entorhinal cortex, PaS: parasubiculum, PrS: Presubiculum, RSA: retrosplenial agranular cortex, Ctx: cortex. (e) HD firing rate polar plots for four HD cells recorded during the two light conditions (numbers indicate HD score and peak firing rate). (f) Scatter plot showing HD scores and peak firing rates of all neurons during vp2 trials. Each dot represents one cell. Lines indicate thresholds for HD cells identification. Red dots are HD cells.
Figure 1—figure supplement 1
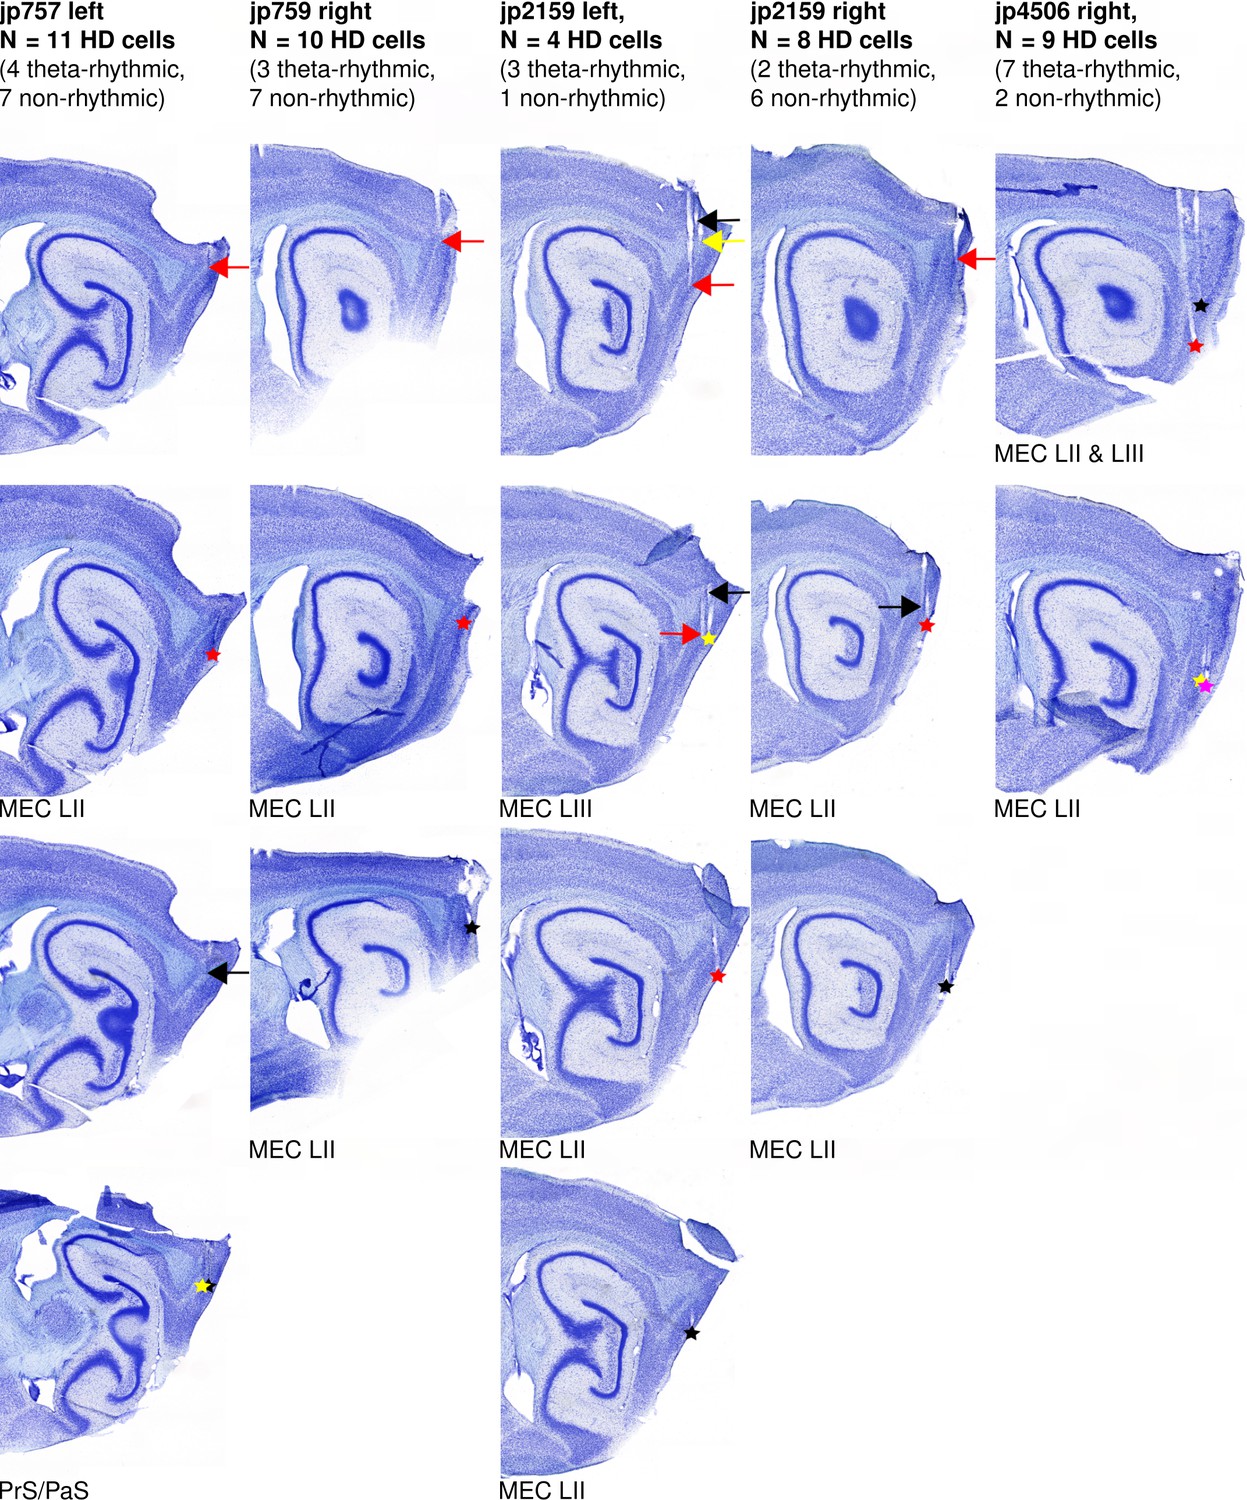
Examples of recording sites.
Each column shows sagittal brain sections from one hemisphere. Arrows point to the tetrode tracks and asterisks show the location of the tetrode tips at the end of the experiment. For each hemisphere, a different color was assigned to each tetrode. The brain regions in which the tetrode tips were found are indicated below each section.
Figure 1—figure supplement 2
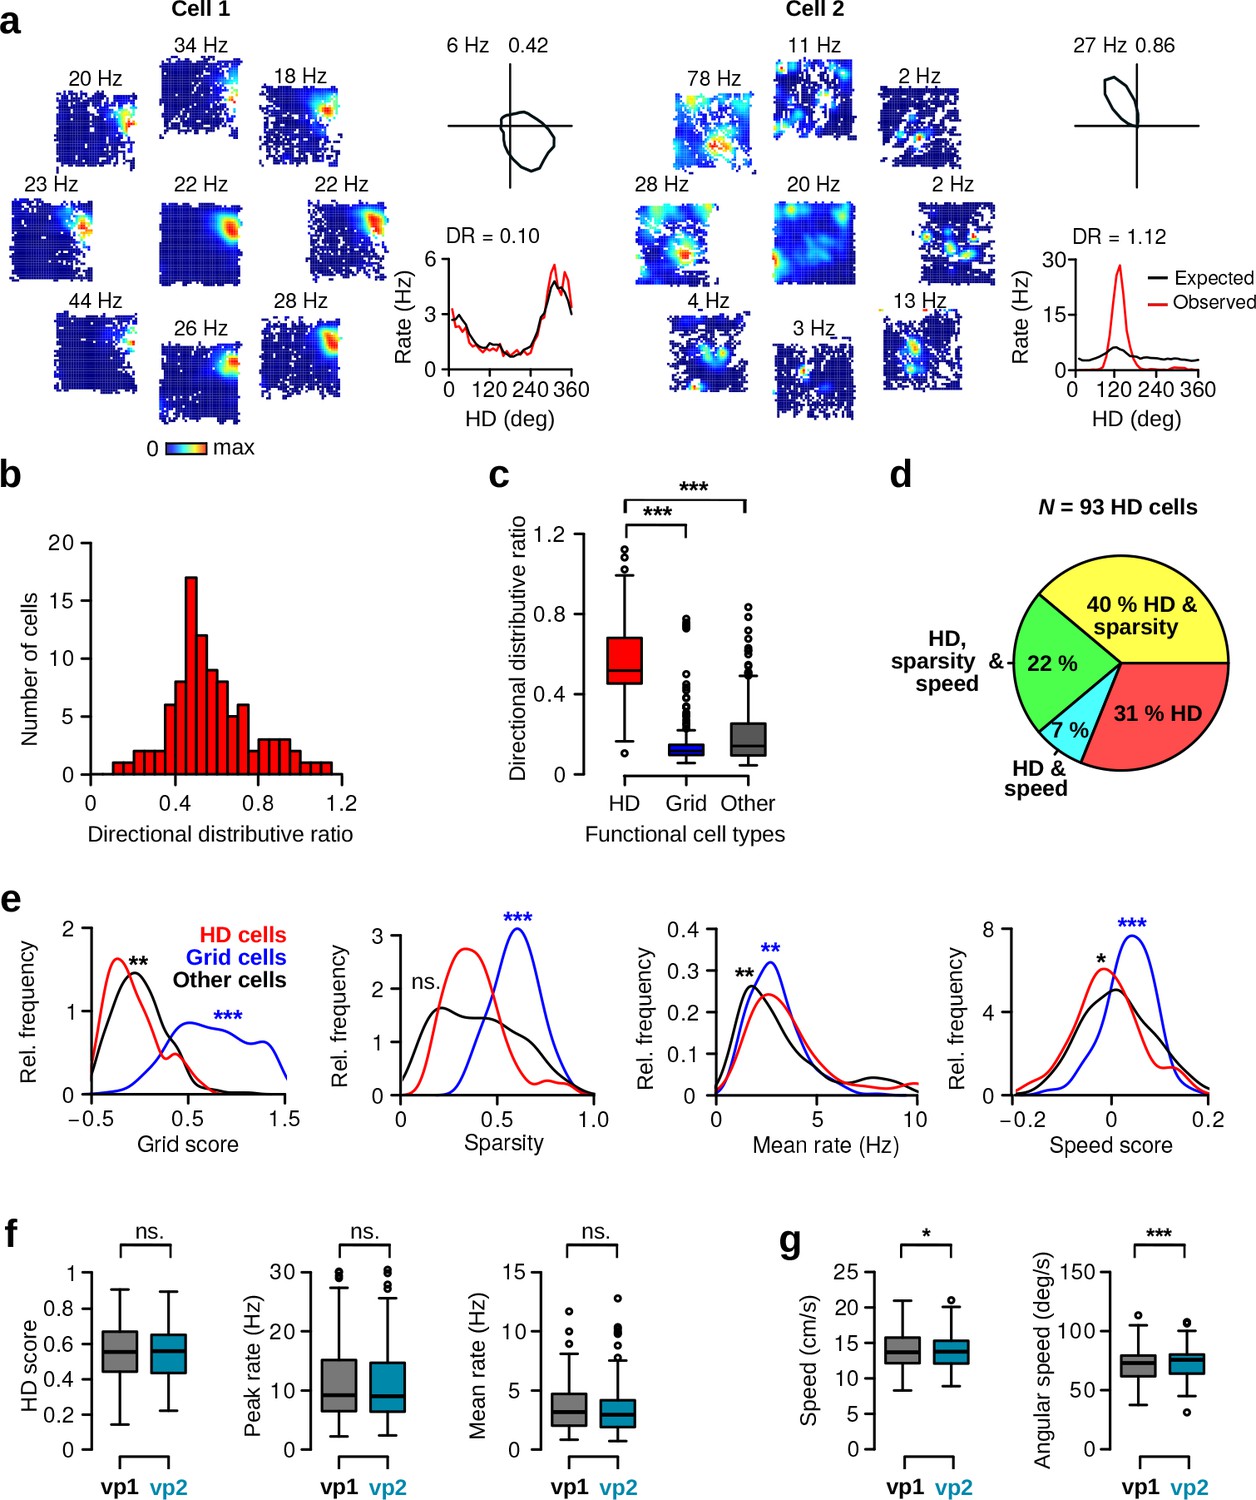
Directional distributive ratio, HD cell properties and behavior during vp1 and vp2 trials.
(a) Directional distributive ratio (DR) for two representative HD cells with low (Cell 1) and high DR (Cell 2). Left: HD dependent spatial firing rate maps. The central rate map is direction independent. Surrounding maps show firing rate maps for specific HDs in 45 deg bins. Top right: polar plot showing the HD tuning curve of the neuron. Numbers indicate peak firing rates and HD scores. Bottom right: Observed (red lines). Expected firing rate (black lines) as a function of HD, together with corresponding DR scores. A DR near 0 indicates that the observed tuning curve of a neuron can be explained by its spatial selectivity and biased HD sampling. (b) Distribution of DR for all putative HD cells. (c) Box-and-whisker plots showing DR across different functional cell types: HD cells (HD), grid cells (Grid, N = 219), and other low firing rate cells (other, firing rate 10 Hz, N = 335). DR was computed during vp1 trials. HD cells had significantly higher DR compared to other functional cell types (Wilcoxon rank-sum test, HD vs. grid cells, w = 20085, p , HD vs. other cells w = 29717, p ). (d) Pie chart illustrates the fractions of HD cells with significant spatial sparsity or speed scores. (e) Distributions of grid scores, sparsity scores, mean firing rates and speed scores for HD cells (red lines), grid cells (blue lines), and other cells (black lines). Asterisks indicate significant difference in scores between HD and grid cells (blue), and HD and other cells (black). (f) HD scores, peak rates and mean firing rates of HD cells during vp1 and vp2 trials (paired Wilcoxon signed-rank test, N = 93, HD score: v = 2015, p=0.52; peak firing rate: v = 2267, p=0.76; mean firing rate: it v = 2234, p=0.85). (g) Average running speed (left) and average head angular velocity (right). The magnitude of changes between the two trial types was small (paired Wilcoxon signed-rank test, N = 68 recording sessions containing HD cells, median running speed, vp1: 13.7 cm/s, vp2: 13.8 cm/s, v = 788, p=0.02; median head angularspeed, vp1: 73.0 deg/s, vp2: 75.7 deg/s, v = 522, p ). ns.: not significant, *: p 0.05, **: p 0.01, ***: p 0.001.
Figure 2
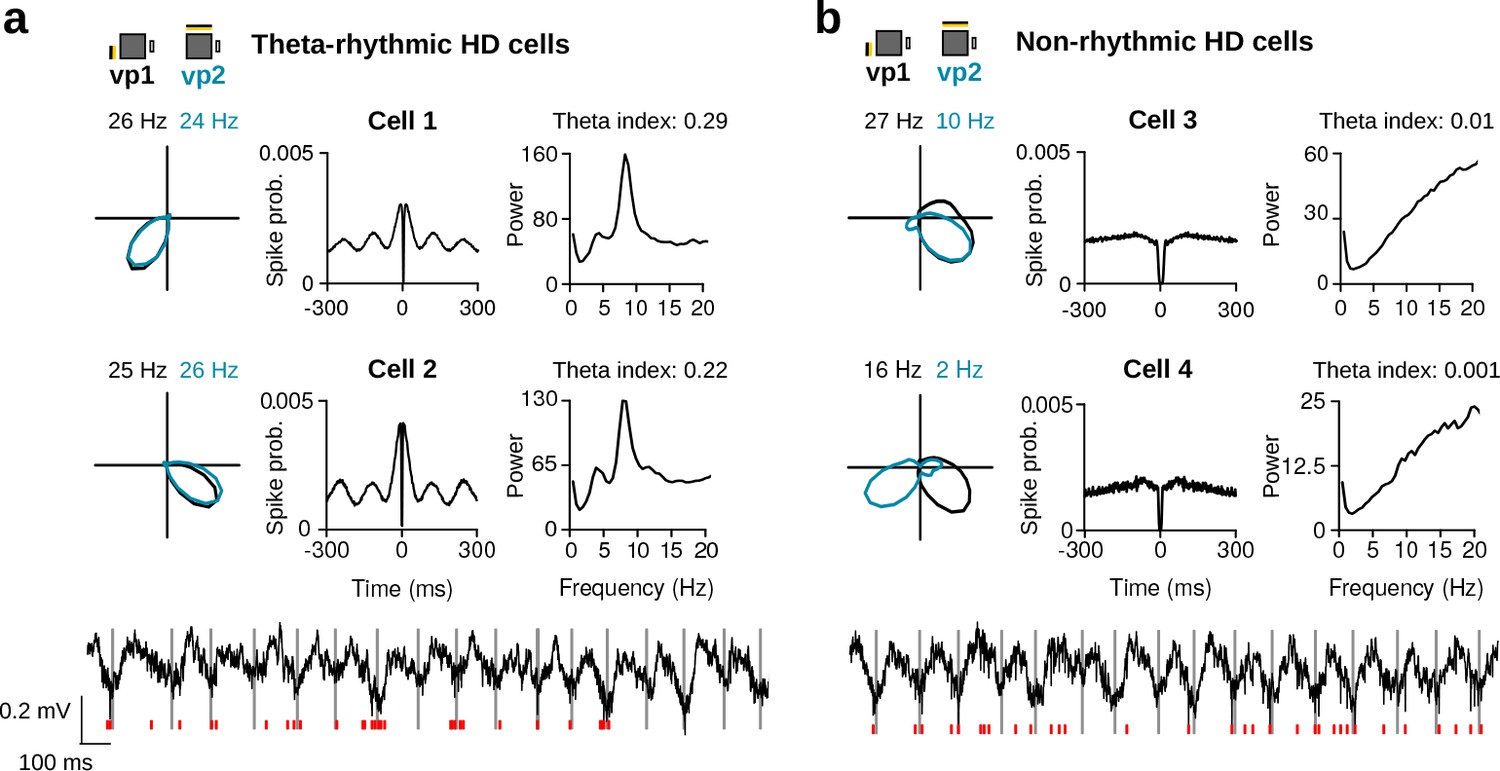
Variability in theta rhythmic activity of HD cells.
(a) Examples of two theta-rhythmic HD cells (Cell 1 and Cell 2) and (b) two non-rhythmic HD cells (Cell 3 and Cell 4). From left to right for each cell: HD tuning curves during vp1 and vp2 trials (numbers indicate peak firing rates), spike-time autocorrelation, and power spectrum of the instantaneous firing rate. Bottom: raw signals with spike times (red vertical tics) of Cell 2 and Cell 4 shown above. Vertical gray lines are aligned to the troughs of theta cycles.
Figure 3 with 2 supplements

Theta rhythmic activity identifies two populations of HD cells.
(a) Distribution of theta indices of all HD cells. The two populations were identified with a Gaussian finite mixture model. Red: non-rhythmic cells, gray: theta-rhythmic cells. (b) Preferred theta phase and phase locking of HD cells to the LFP theta oscillations. Left: Polar plot showing the preferred theta phase and theta phase modulation of HD cells. Non-rhythmic and theta-rhythmic HD cells are depicted in red and gray, respectively. Right: Mean firing probability as a function of theta phase of non-rhythmic (red) and theta-rhythmic (black) HD cells, the 90 phase represents the trough of the theta cycle (dashed line). (c) HD scores and mean firing rates of non-rhythmic (NR, red) and theta-rhythmic (TR, gray) HD cells during vp1 trials. (d) Relative recording sessions during which non-rhythmic and theta-rhythmic HD cells were recorded. A score of 0 and 1 indicate that the cell was recorded on the first and last recording session of an animal, respectively. (e) Tetrode tracks from a mouse perfused immediately after recording two non-rhythmic HD cells. The tetrode tips were located in the most dorsal portion of the MEC. The HD tuning curve during vp1 and vp2 trials and the spike-time autocorrelation are shown for each cell. (f) Mean spike waveform (left), trough-to-peak duration (middle), and peak amplitude asymmetry (right) of non-rhythmic and theta-rhythmic HD cells. Cells which had inverted spike waveforms (N = 4 non-rhythmic and 7 theta-rhythmic) were excluded from this analysis. ns.: not significant, **: p 0.01, ***: p 0.001.
Figure 3—figure supplement 1
Properties of theta-rhythmic and non-rhythmic HD cells.
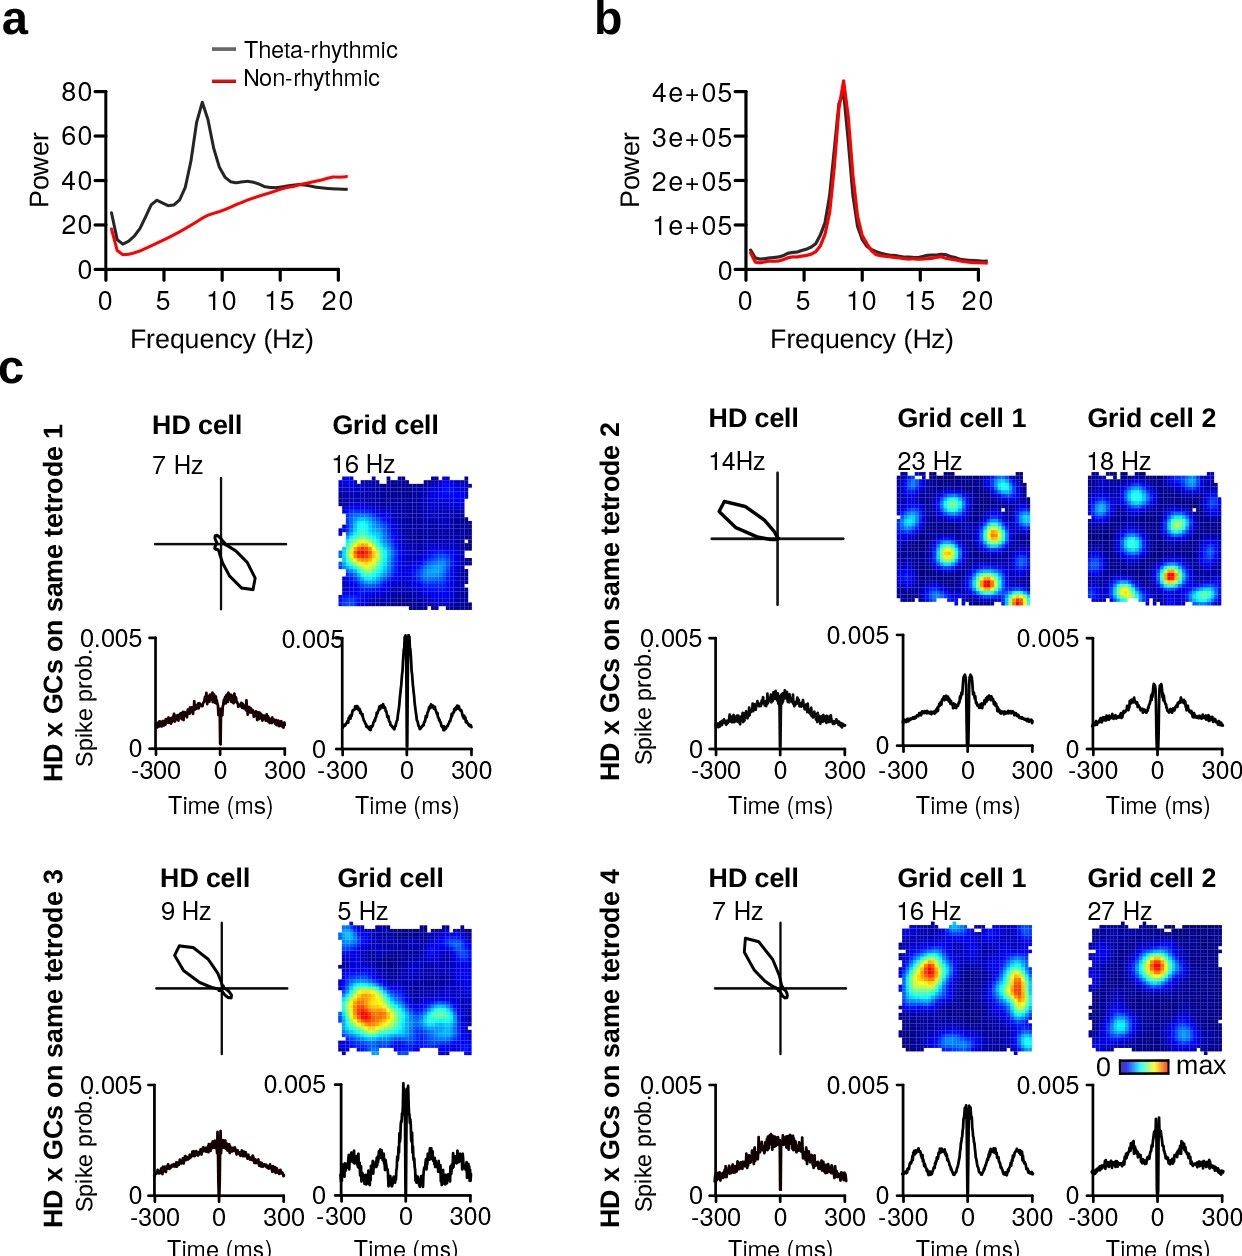
(a) Average instantaneous firing rate power spectra of theta-rhythmic (gray lines) and non-rhythmic HD cells (red lines). (b) Average local field potential power spectra of theta-rhythmic (gray lines) and non-rhythmic HD cells (red lines). (c) Four examples of non-rhythmic HD cells simultaneously recorded on the same tetrode as grid cells (GCs). For each HD cell: top row shows the tuning curve of the cell and the spatial firing rate maps of simultaneously recorded grid cells. Bottom row shows spike-time autocorrelations of the same cells. Polar plots and firing rate maps are based on data from vp1 trials.
Figure 3—figure supplement 2
Non-rhythmic HD cells of the parahippocampal formation.
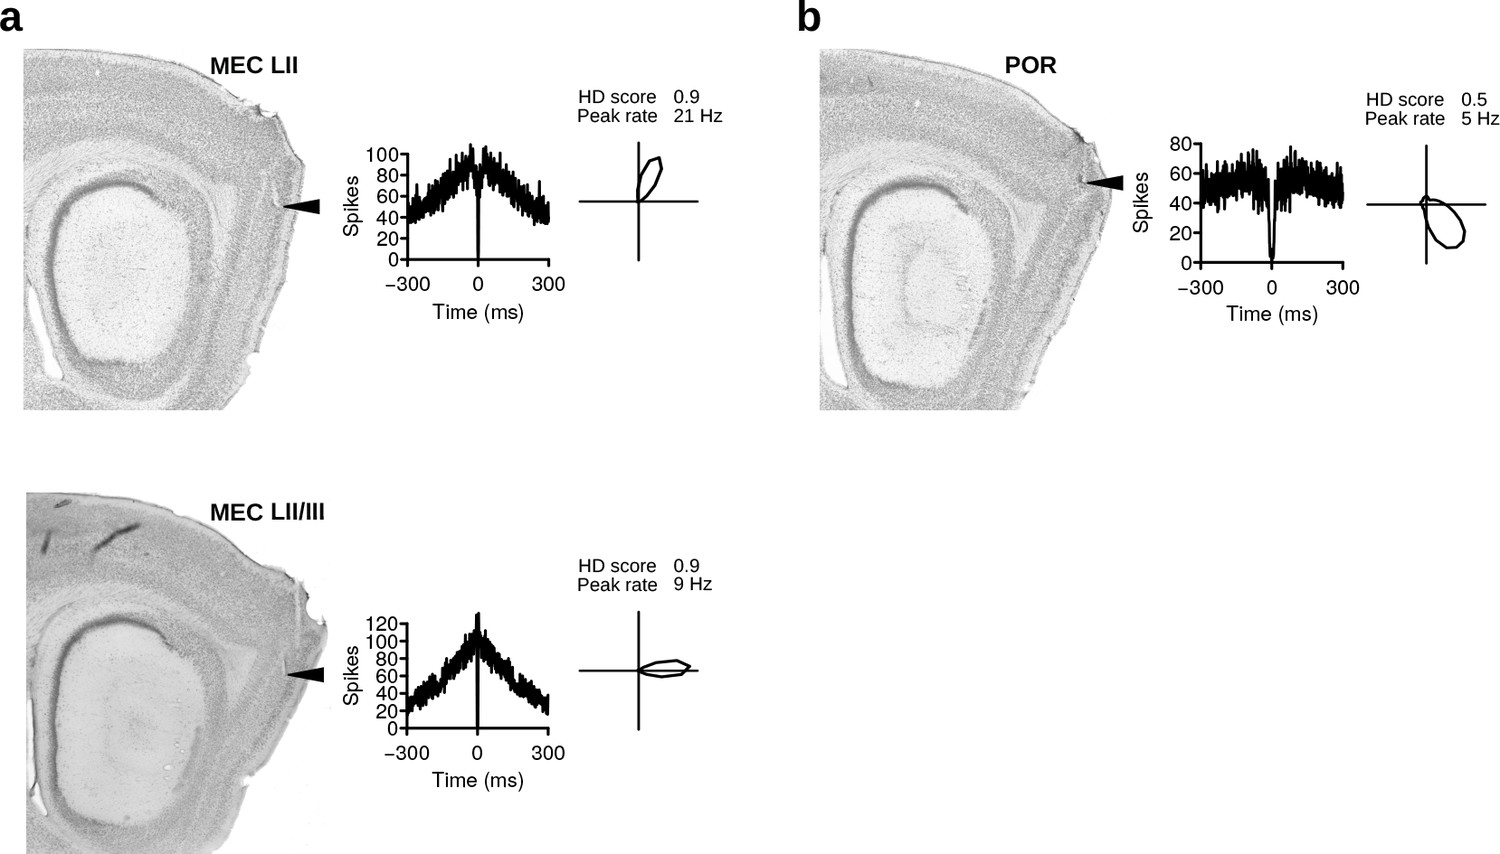
(a) Two examples of non-rhythmic HD cells recorded in the MEC. (b) Non-rhythmic HD cell recorded in the postrhinal cortex. From left to right: sagittal brain sections with arrows pointing at the locations where HD cells were recorded, spike-time autocorrelations, and HD polar plots during vp1 trials.
Figure 4 with 2 supplements
Alteration of preferred HD and HD selectivity following visual landmark manipulation.
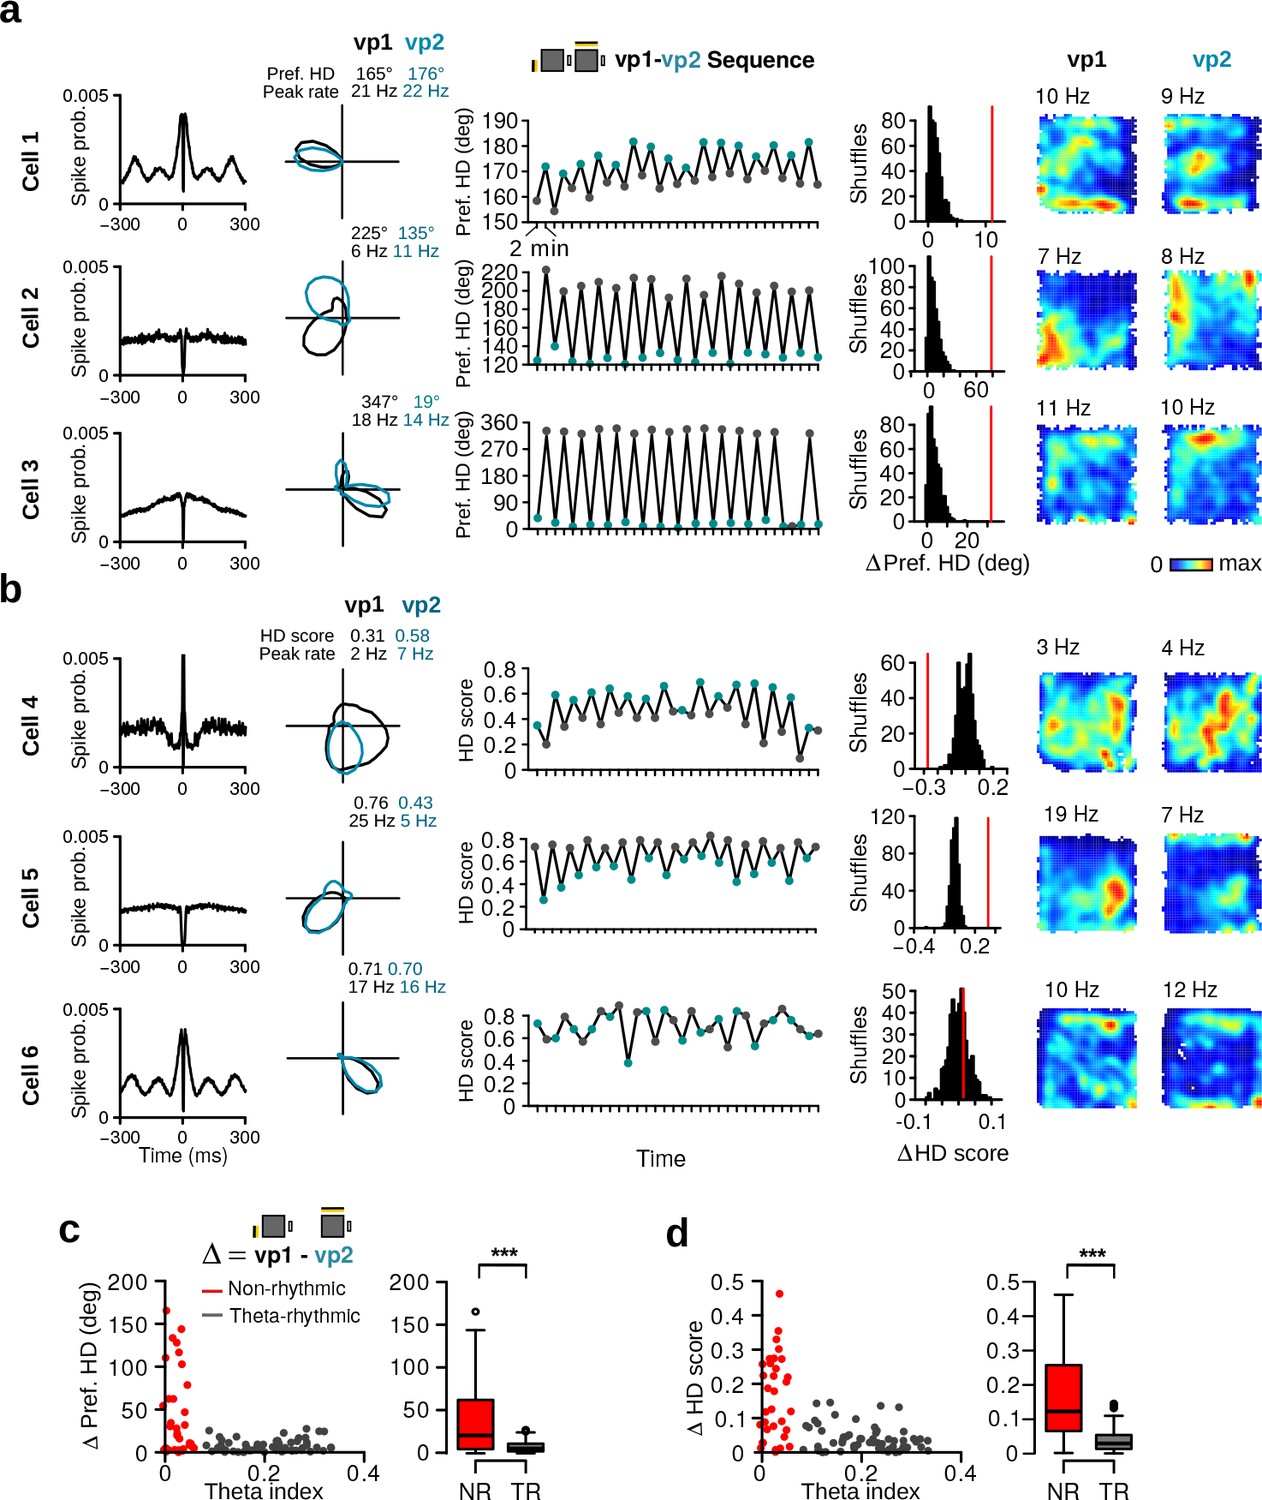
(a) Examples of three HD cells that changed their preferred direction between vp1 and vp2 trials. One cell per row. From left to right: Spike-time autocorrelation, HD tuning curves during vp1 (black) and vp2 (blue) trials, preferred HD during individual 2-min trials, observed change in preferred HD between vp1 and vp2 trials (red line) with distribution of preferred HD changes when trial labels were reassigned randomly, and firing rate maps during vp1 and vp2 trials. Numbers above the firing rate maps are peak firing rates. (b) Examples of three HD cells with different HD selectivity during vp1 and vp2 trials. From left to right: Same as in a) but the third and forth columns show HD scores instead of preferred directions. (c) Left: Scatter plot of the theta index of each HD cell against its change in preferred HD. Right: Change in preferred HD between vp1 and vp2 trials for non-rhythmic and theta-rhythmic cells. (d) Same as (c) but for HD scores. ***: p 0.001.
Figure 4—figure supplement 1
Distribution of changes in HD tuning.
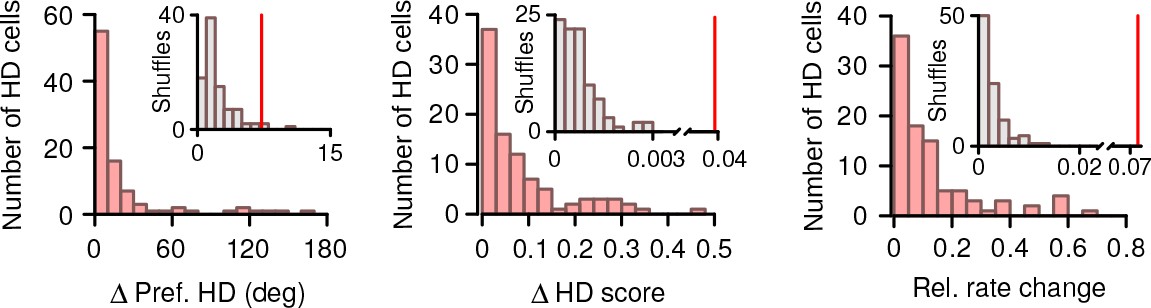
Distribution of shifts in HD preference, change in HD score and change in firing rate between vp1 and vp2 trials for all HD cells (red, N = 93). Inset: the median of observed shifts (red line) with the distribution expected by chance (gray).
Figure 4—figure supplement 2
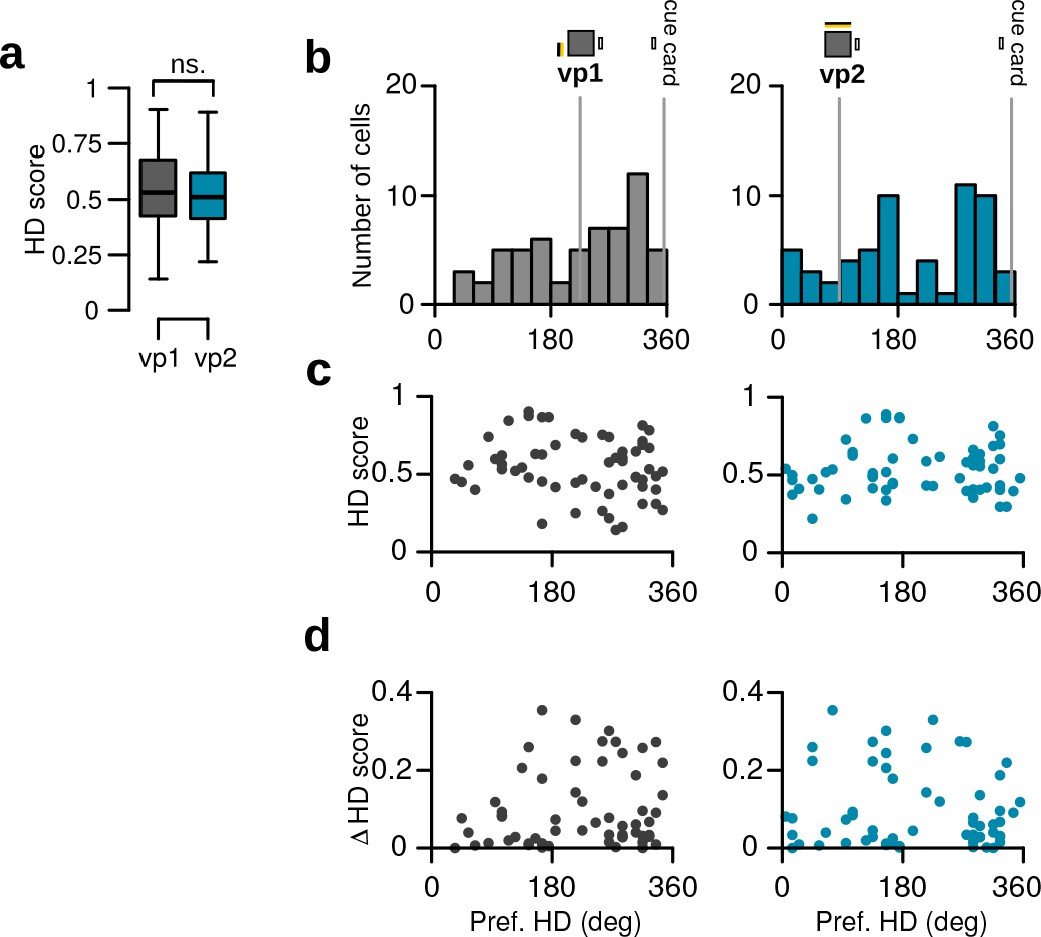
Properties of HD cells changing their preferred HD between vp1 and vp2 trials (N = 59 cells).
(a) HD scores during vp1 and vp2 trials (paired Wilcoxon signed-rank test for HD score, N = 59, v = 995, p=0.41). (b) Distributions of preferred direction during vp1 (left, Rayleigh test of uniformity, vp1: test statistic = 0.2303, p=0.0437, mean resultant length = 0.23) and vp2 trials (right, vp2: test statistic = 0.1116, p=0.4798, mean resultant length = 0.11). Gray lines indicate the location of the cue card and the two visual patterns. (c) HD scores as a function of preferred direction (linear-circular correlation vp1: r = 0.07, p=0.02; vp2: r = 0.09, p=0.005). (d) Changes in HD score as a function of preferred direction (vp1: r = 0.06, p=0.03, vp2: r = 0.035, p=0.13).
Figure 5 with 1 supplement
Firing rate changes induced by visual landmark manipulation.
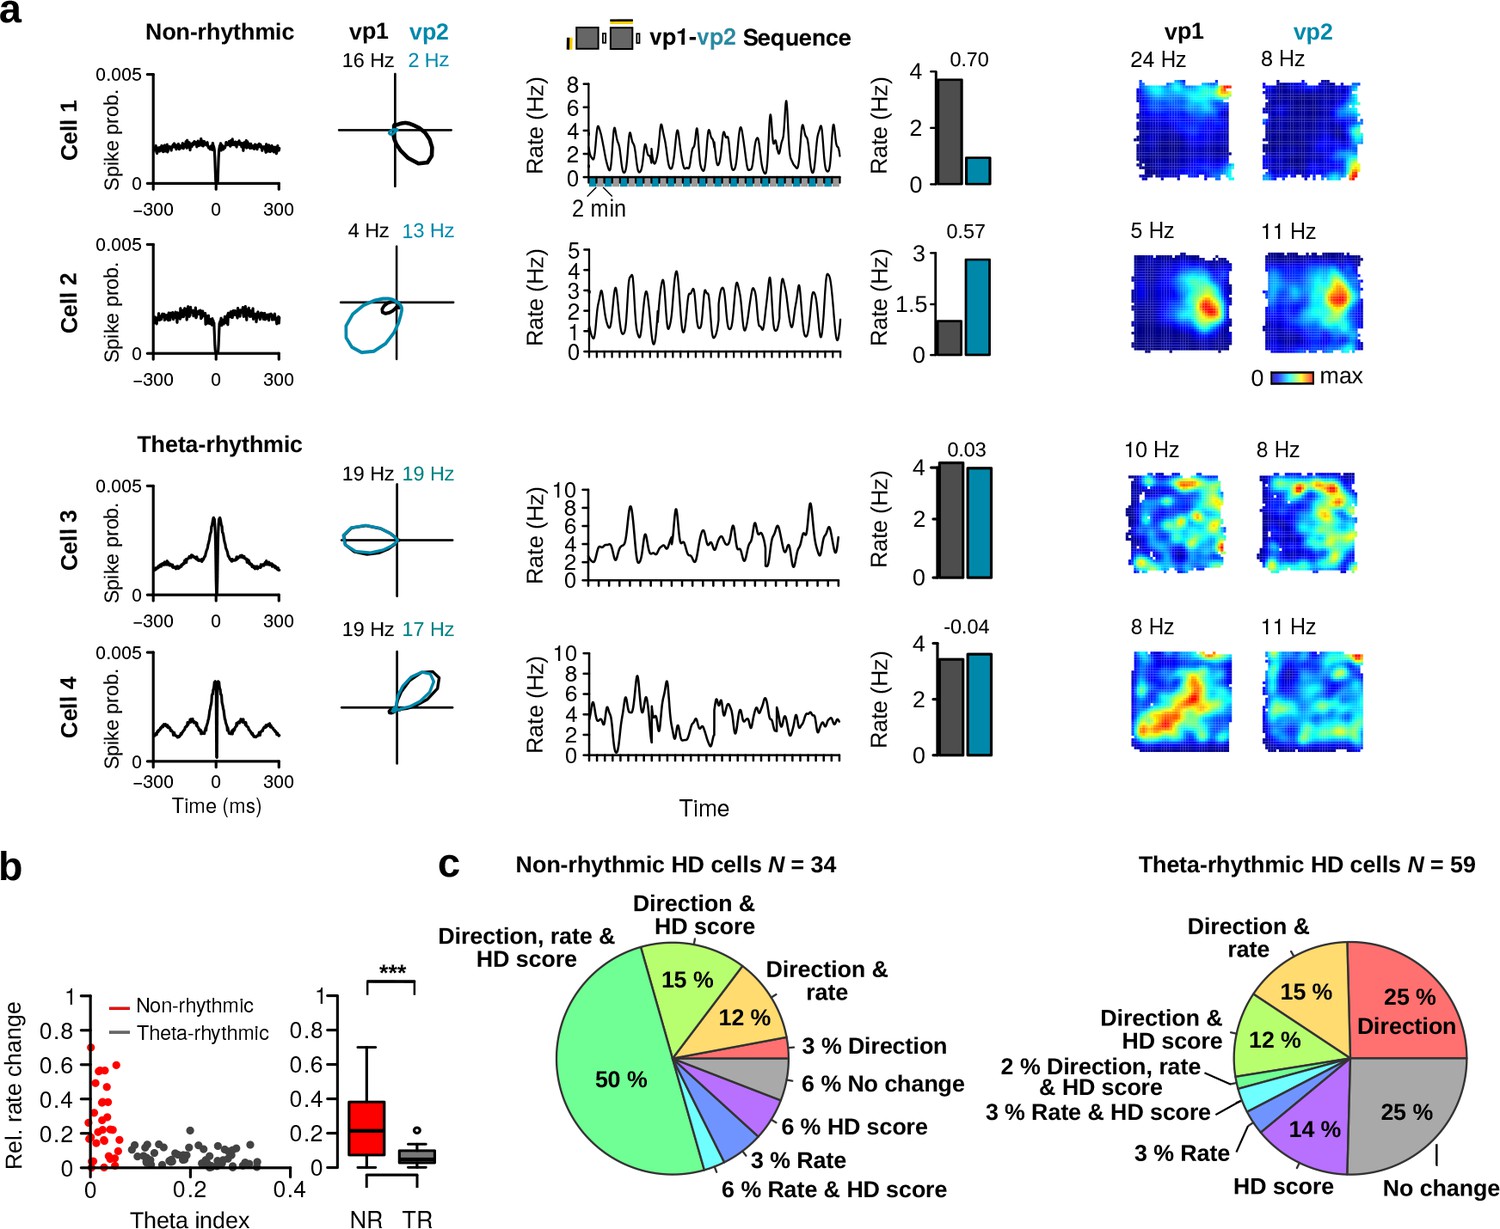
(a) For each cell from left to right: Spike-time autocorrelation, HD tuning curves during vp1 (black) and vp2 (blue) trials, instantaneous firing rates (standard deviation Gaussian kernel 25 s, window size 1 s) as a function of time, mean firing rate during vp1 and vp2 trials, and firing rate maps during vp1 and vp2 trials. Numbers above the histograms indicate the relative change in rate. Numbers above the firing rate maps are peak firing rates. (b) Left: Scatter plot of the theta index of each HD cell against its relative firing rate change across trial types. Right: Relative firing rate change between vp1 and vp2 trials for non-rhythmic and theta-rhythmic HD cells. (c) Pie charts illustrating the percentages of non-rhythmic (left) and theta-rhythmic (right) HD cells with significant changes in preferred direction, HD score or mean firing rate. ***: P 0.001.
Figure 5—figure supplement 1
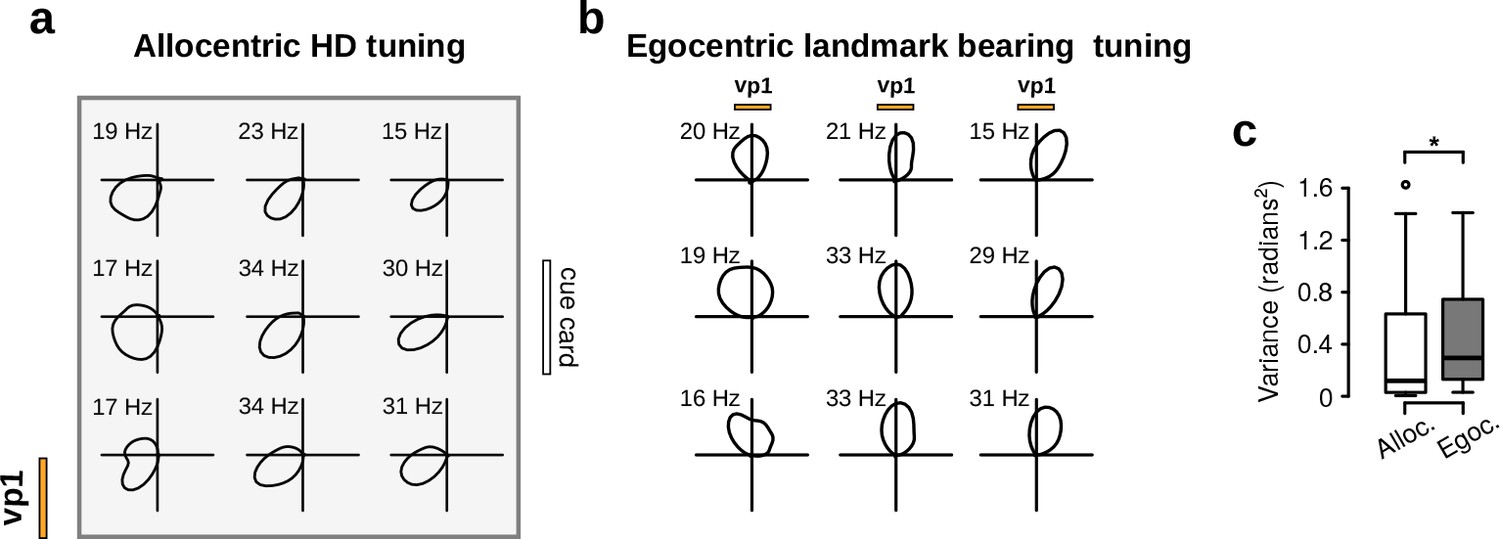
Non-rhythmic HD cells appear to encode allocentric HD rather than egocentric landmark bearing.
(a) Allocentric HD tuning curves of a HD cell measured across nine different quadrants within the arena during vp1 trials. Numbers above polar plots show peak firing rates. The location of the visual landmark (vp1) and the cue card are indicated. (b) Egocentric landmark bearing tuning curves relative to the landmark of the same cell. These curves display the firing rate of the cell as a function of the angular position of the landmark in the animal’s field of view. The üp’ direction of these plots corresponds to the animal’s head pointing directly at the landmark. Here, egocentric tuning curves changed as a function of position as expected from an allocentric HD cell. (c) Variance in allocentric and egocentric preferred direction across the nine quadrants for all non-rhythmic HD cells (paired Wilcoxon rank-sum test, N = 34, v = 166, p=0.02). This figure panel shows that allocentric HD tuning was more constant than egocentric tuning and suggests that non-rhythmic HD cells appear to encode allocentric HD rather than egocentric landmark bearing. *: p 0.05.
Figure 6 with 1 supplement
HD cells with bidirectional tuning curves.
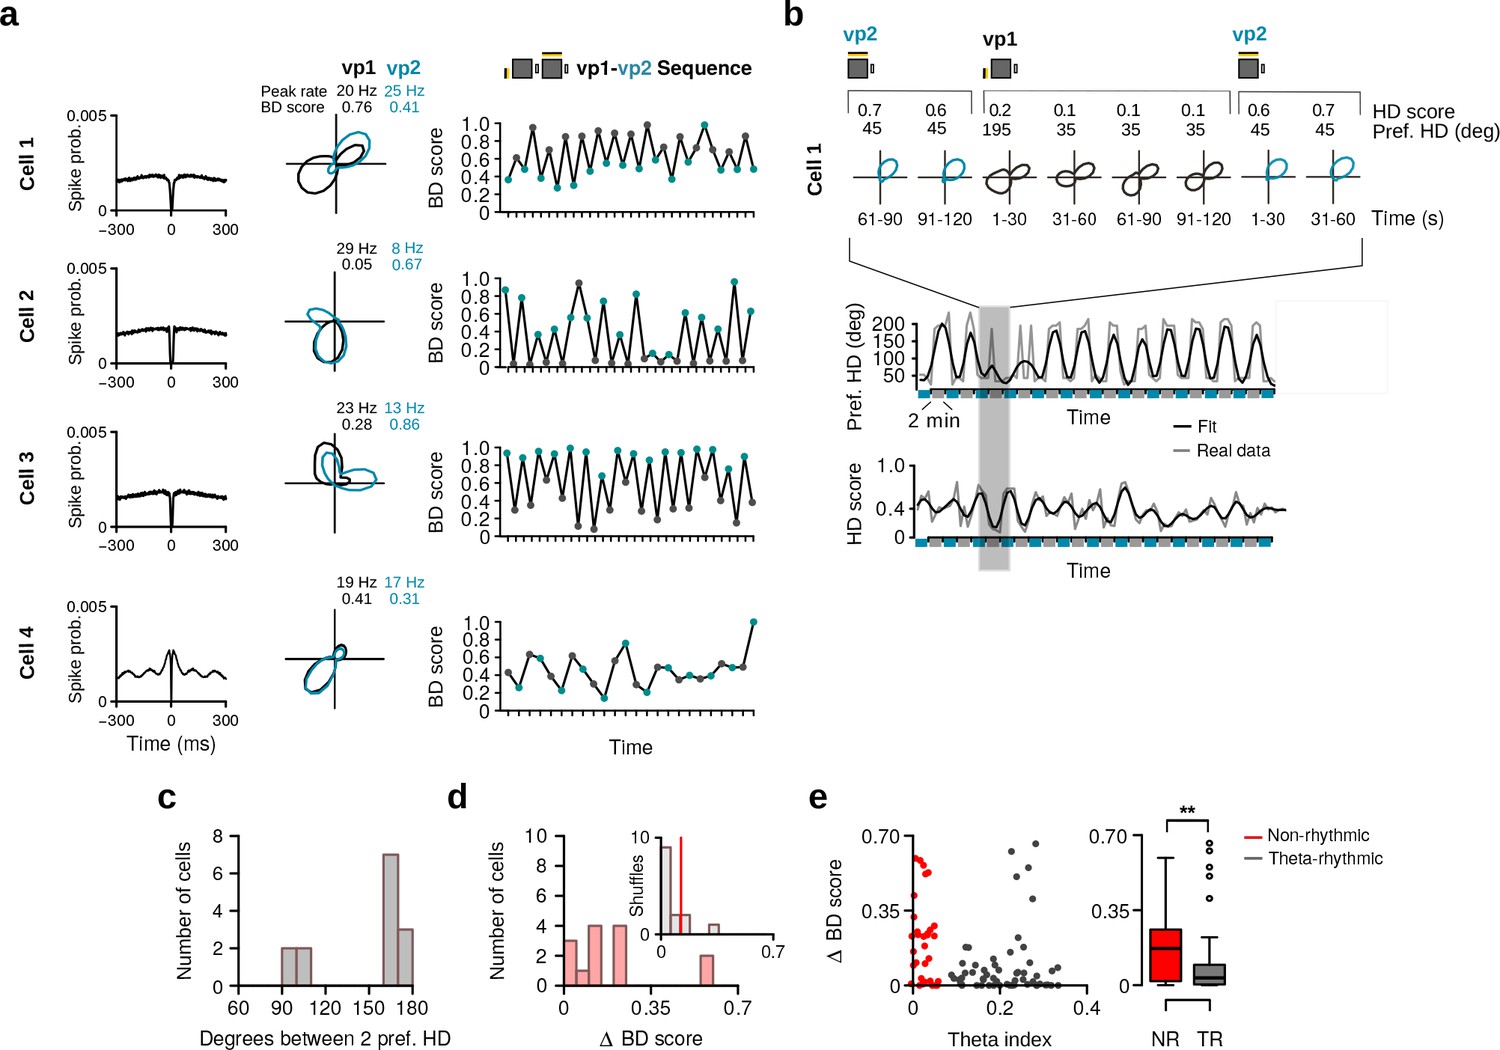
(a) Four HD cells with bidirectional HD tuning curves showing changes with the two trial types. From left to right: spike-time autocorrelations, tuning curves during vp1 and vp2 trials, with numbers indicating the peak firing rates and bidirectionality (BD) scores during vp1 and vp2 trials, and evolution of the BD score during the recording session. (b) Example of a bidirectional HD cell during the transition from vp2 to vp1 trials at a shorter time scale. Top panel: polar plots during 30 s blocks showing that the two preferred directions were expressed within a single vp1 trial. Bottom panel: preferred HD and HD score of the cell over time. (c) Distribution of angles between the two preferred HDs of bidirectional HD cells. (d) Distribution of change in BD score between vp1 and vp2 trials for HD cells with a bidirectional HD tuning curve (red, N = 14). Inset: the median of observed changes in BD score (red line) with the distribution expected by chance (gray). (e) Left: Scatter plot of the theta index against the change in BD score of each HD cell. Right: Change in BD score between vp1 and vp2 trials for non-rhythmic and theta-rhythmic cells. **: p 0.01.
Figure 6—figure supplement 1
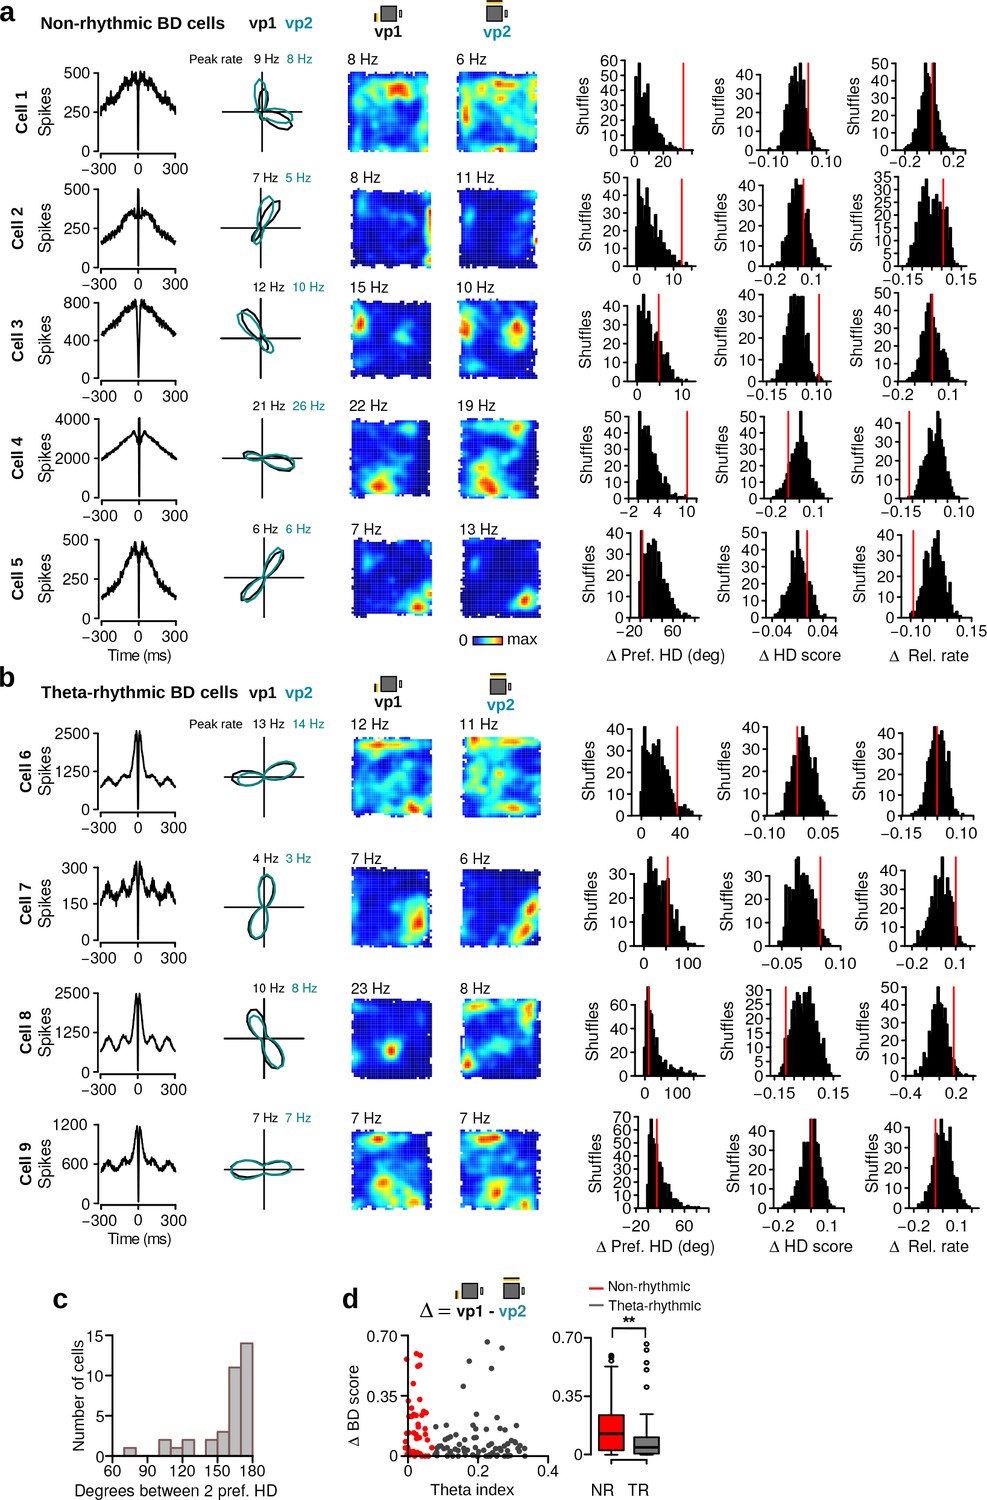
Cells with bidirectional HD tuning curves that were not classified as HD cells (N = 36).
(a–b) Examples of non-rhythmic BD cells and theta-rhythmic BD cells. One cell per row. From left to right: spike-time autocorrelation, HD tuning curves during vp1 (black) and vp2 (blue) trials, firing rate maps during vp1 and vp2 trials, observed changes in preferred HD, HD score and relative firing rate changes between vp1 and vp2 trials (red lines) with distributions of changes when trial labels were reassigned randomly. Numbers above the firing rate maps are peak firing rates. (c) Distribution of angles between the two preferred HDs of bidirectional cells. (d) Left: scatter plot of the theta index against the change in BD score of all directional cells (HD cells and cells with bidirectional tuning curves that were not classified as HD cells, N = 129). Right: change in BD score between vp1 and vp2 trials (Wilcoxon rank-sum test, N = 129, w = 2565, p=0.003) for non-rhythmic and theta-rhythmic directional cells. **: p 0.01.
Figure 7
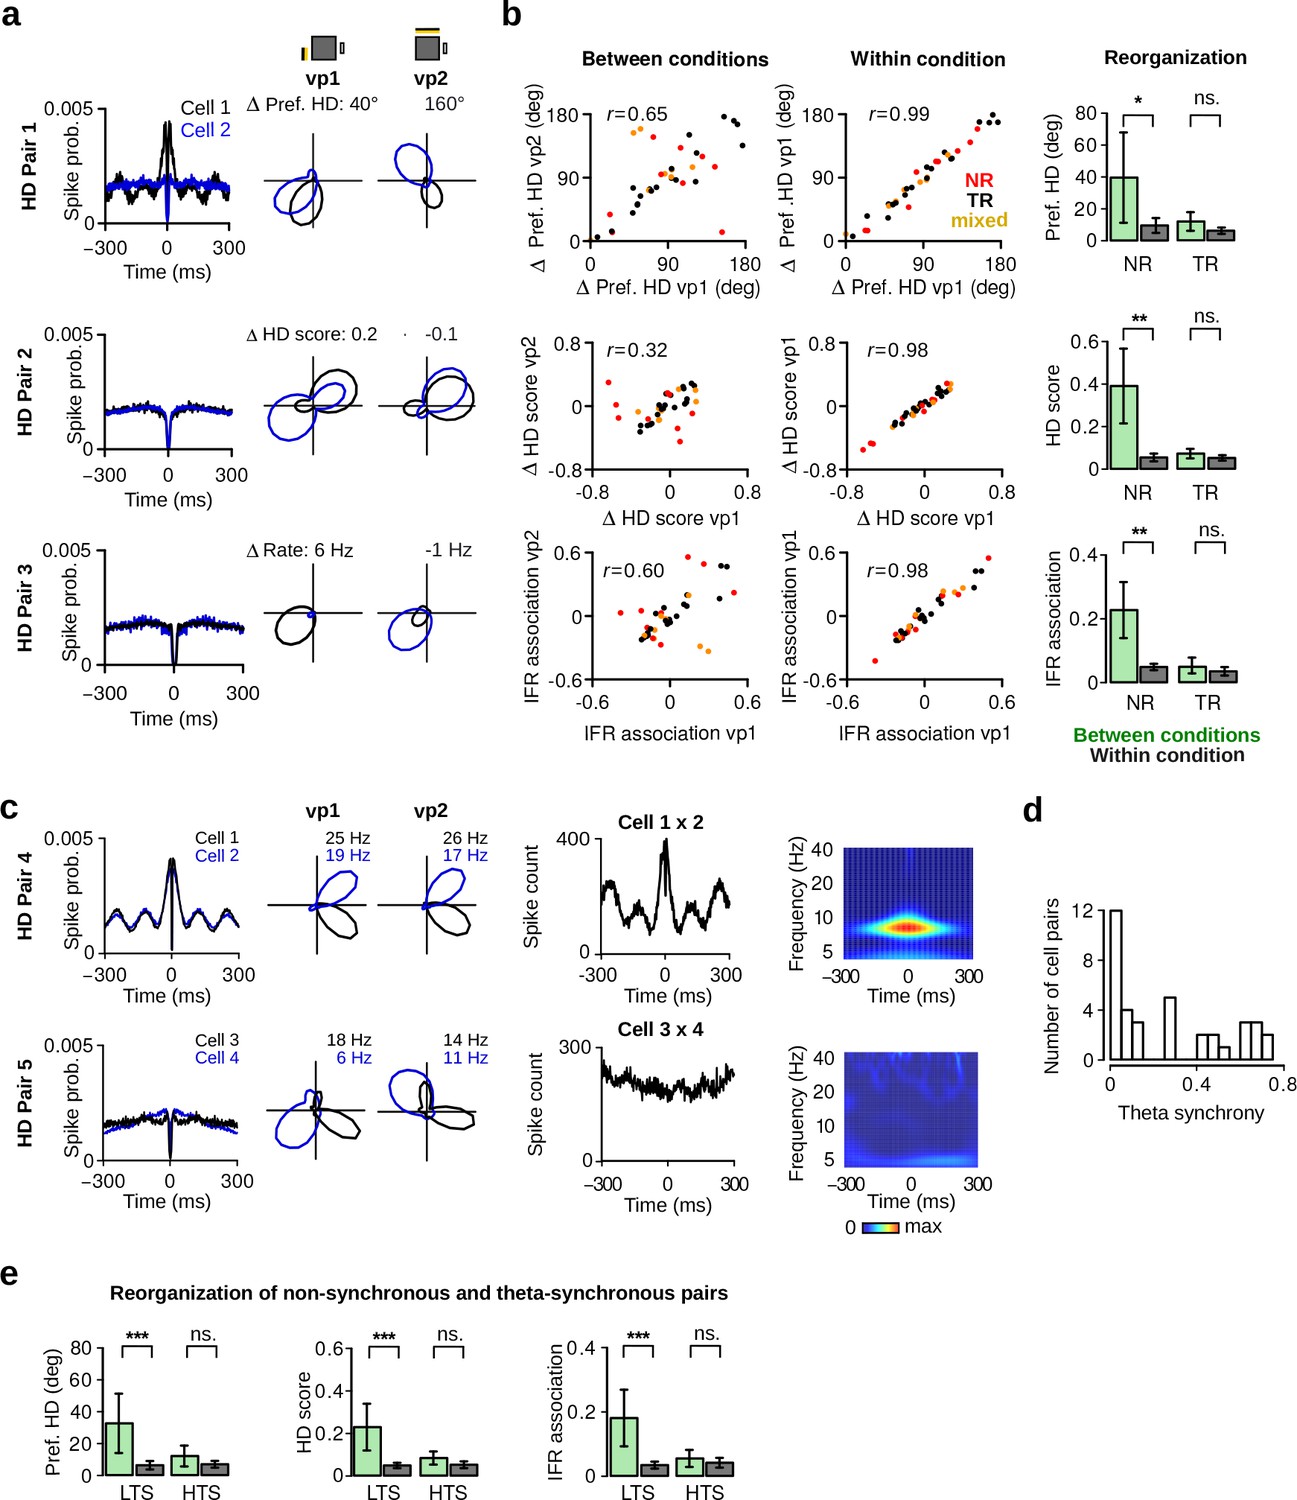
Reorganization of HD cells caused by changes in visual landmarks.
(a) Three pairs of HD cells recorded simultaneously showing non-coherent changes. From left to right: Spike-time autocorrelations, HD polar plots of HD cell pairs during vp1 and vp2 trials. Numbers above the polar plots indicate the difference in preferred HD (HD Pair 1), in HD score (HD Pair 2) or in mean firing rate (HD Pair 3). (b) Left: correlation between the differences in preferred HD, in HD score and in instantaneous firing rate (IFR) association of HD cell pairs for trials with the same or different visual patterns. Data are shown for vp1 and vp2 trials (left, between conditions) or for two mutually exclusive subsets of vp1 trials (right, within condition). r values are correlation coefficients. Red, black and yellow data points represent non-rhythmic, theta-rhythmic and mixed cell pairs, respectively. Right: reorganization of preferred HD, HD score and IFR association of non-rhythmic (NR) and theta-rhythmic (TR) HD cell pairs between conditions or within condition. Plots show mean 95% confidence intervals. (c) From left to right: spike-time autocorrelations, polar plots, spike-time crosscorrelations and wavelet transforms of the z-score-based spike-time crosscorrelations. Both wavelet transforms were normalized to the same scale from minimal power (dark blue) to maximal power (dark red). Wavelet transforms reveal high theta frequency synchronization for one of the HD cell pairs (HD Pair 4). (d) Distribution of theta synchrony scores for all HD cell pairs. (e) Reorganization for HD cell pairs with low (LTS) or high (HTS) theta synchrony. ns.: not significant, *: p 0.05, **: p 0.01, ***: p 0.001.
Figure 8 with 1 supplement
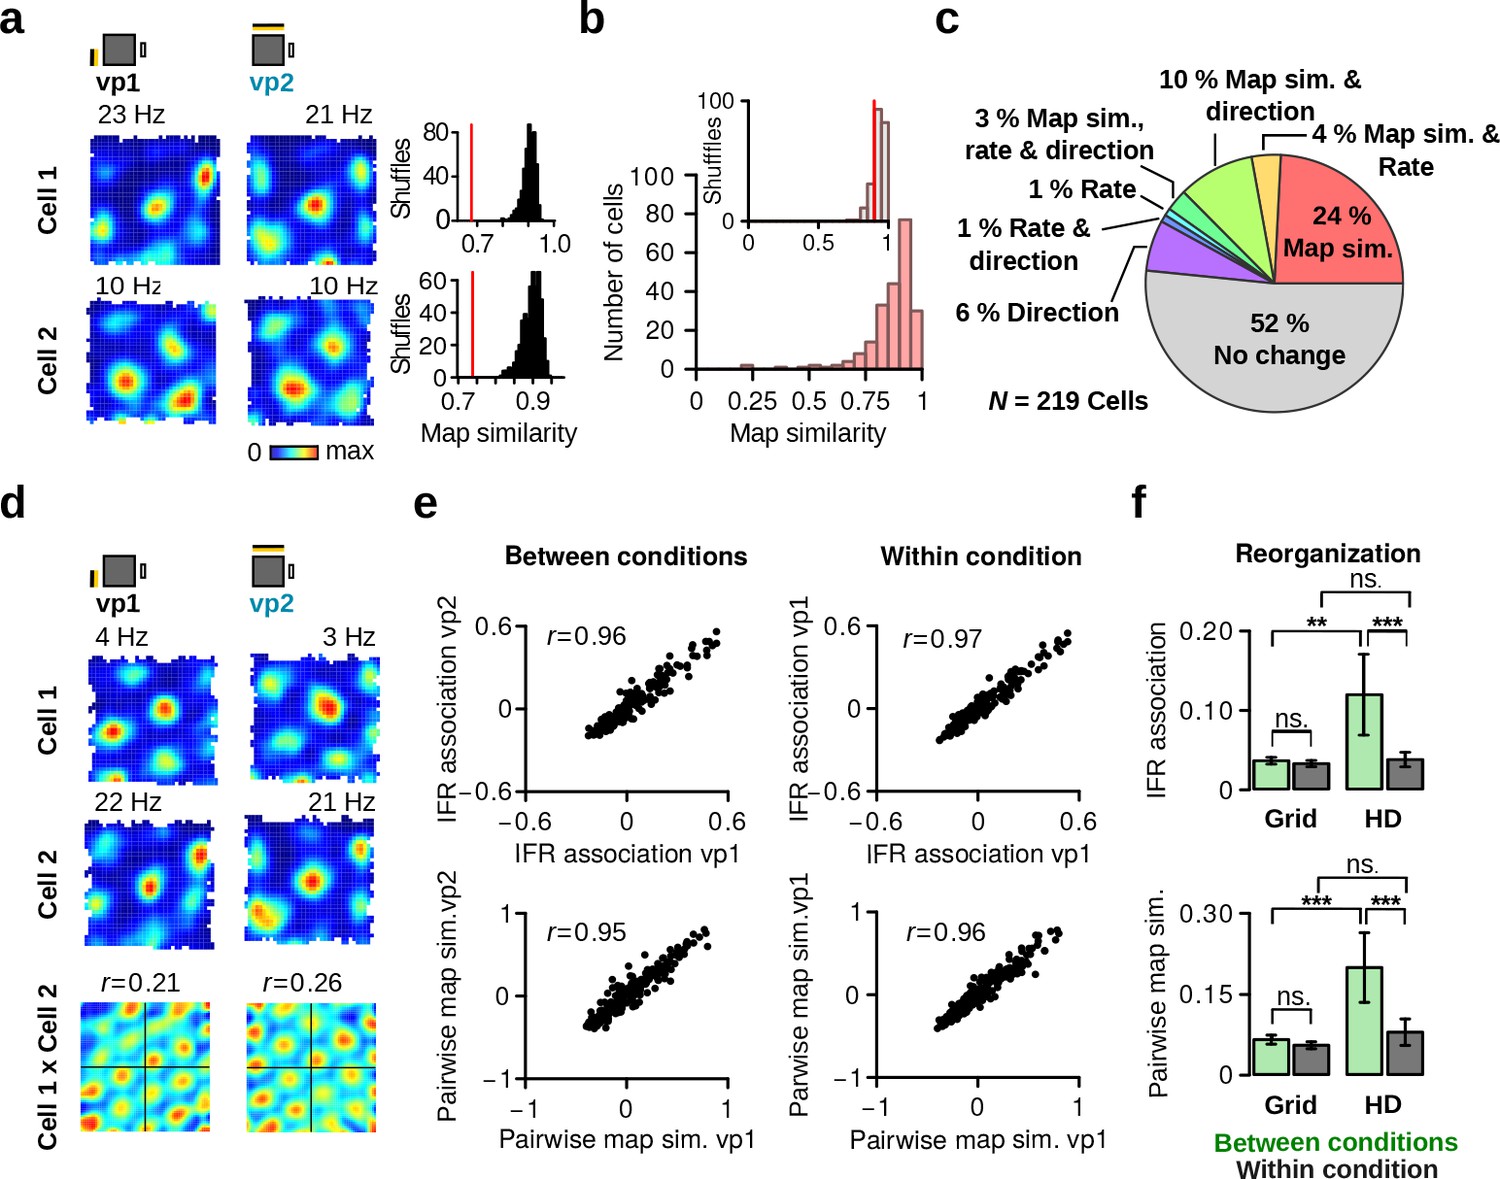
Grid cells retain stable firing associations.
(a) Left: firing rate maps of two representative grid cells during vp1 (left) and vp2 (right) trials. Right: observed map similarity between vp1 and vp2 trials (red line) and distribution of map similarity when trial labels were reassigned randomly. (b) Distribution of map similarity for all grid cells (red). Inset: the median of observed map similarity (red line) with the distribution expected by chance (gray). (c) Pie chart illustrating the percentages of grid cells with a significant change in map similarity, average firing rate or preferred HD. (d) Firing rate maps of two simultaneously recorded grid cells and their spatial crosscorrelation. r values are correlation coefficients representing pairwise map similarity of two cells during each trial type. (e) Comparison of instantaneous firing rate (IFR) associations (top) and pairwise map similarity (bottom) of grid cell pairs during vp1 and vp2 trials (left, between conditions) or for two subsets of vp1 trials (right, within condition). (f) Reorganization of IFR associations (top) and pairwise map similarity (bottom) between conditions (vp1 vs. vp2) or within condition. Reorganization is shown separately for pairs of grid cells and pairs of HD cells. Plots show mean 95% confidence intervals. ns.: not significant, **: p 0.01, ***: p 0.001.
Figure 8—figure supplement 1
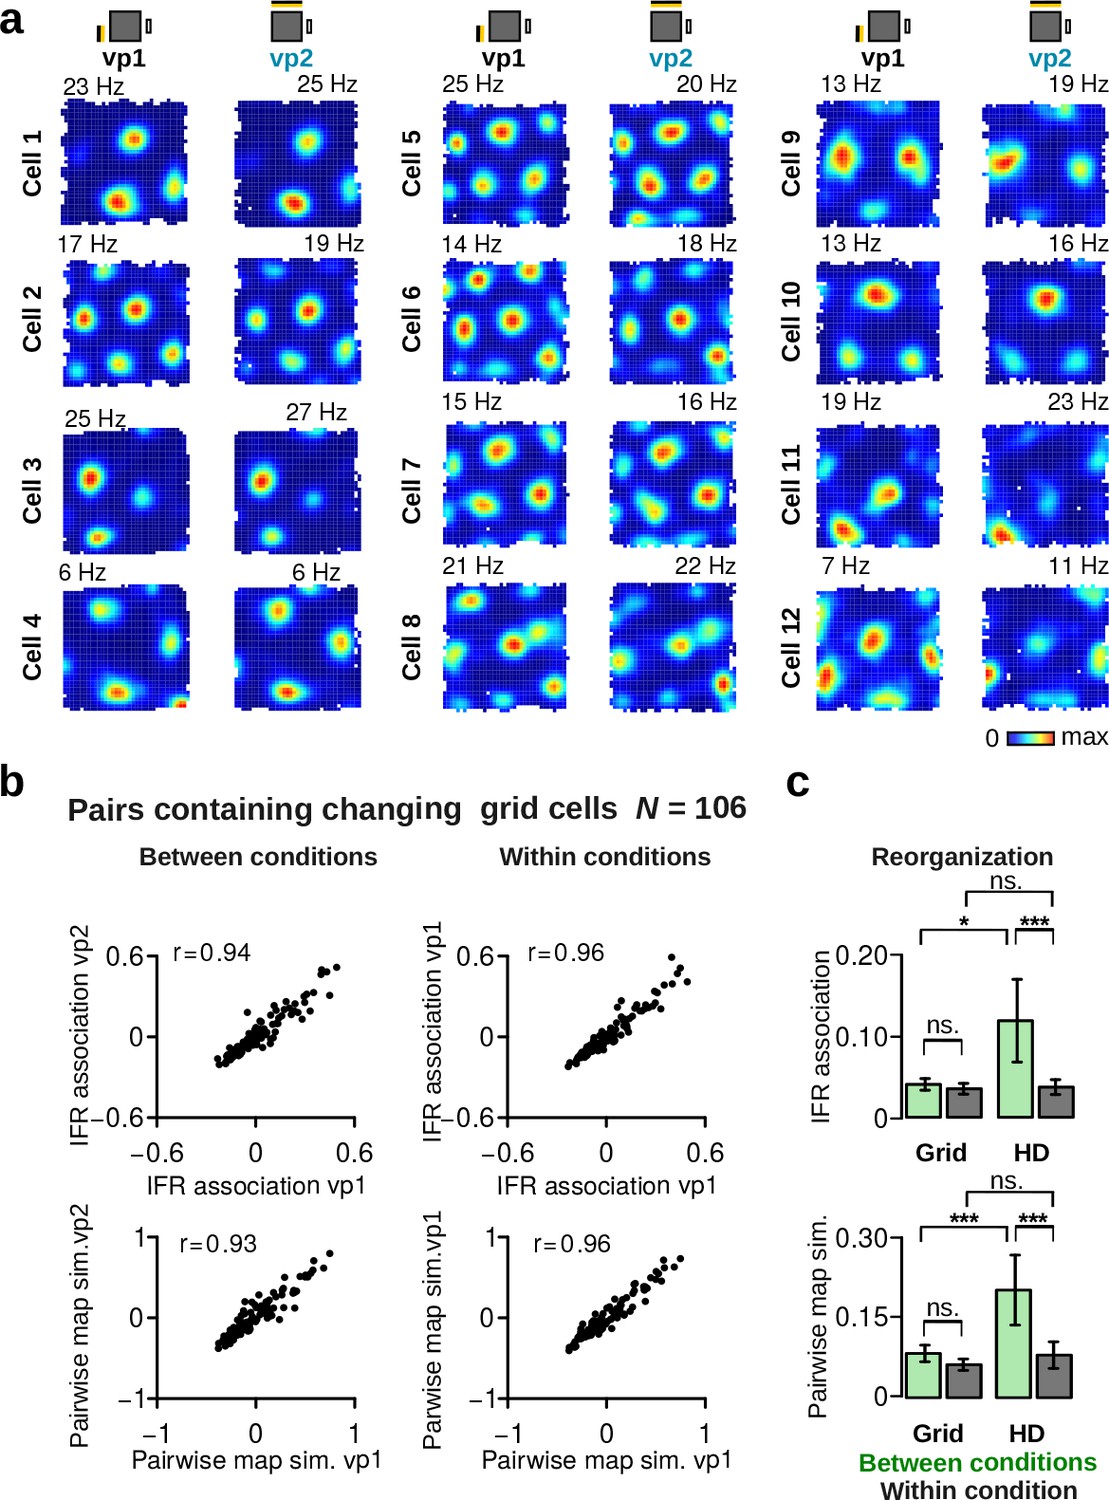
Grid cell firing rate map examples and grid cell pairs with significant visually driven changes.
(a) Examples of grid cell maps during vp1 and vp2 trials. (b) Comparison of instantaneous firing rate (IFR) associations (top) and pairwise map similarity of grid cell pairs for vp1 and vp2 trials (left) or for two mutually exclusive subsets of vp1 trials (right). r values are correlation coefficients. The analysis includes only grid cell pairs with at least one grid cell showing significant visually driven changes. (c) Reorganization scores of grid cell pairs and HD cell pairs between conditions (vp1 and vp2, gray) or within condition (green). Grid cells significantly changing their map similarity or average firing rate between vp1 and vp2 trials showed no reorganization in their IFR association (top) or pairwise map similarity between conditions (bottom). ns.: not significant, *: p 0.05, ***: p 0.001. Plots show mean 95% confidence intervals.
Author response image 1
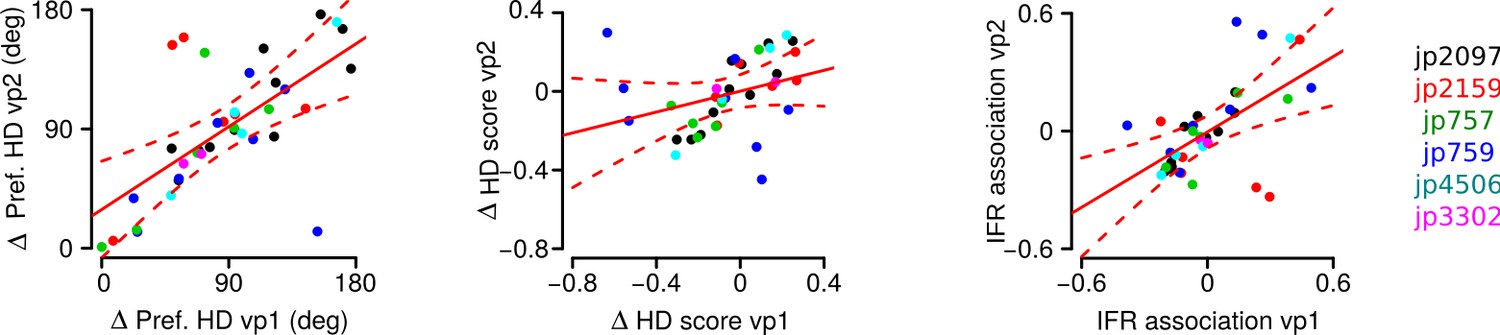
Correlation between the differences in preferred HD, in HD score and in instantaneous firing rate (IFR) association of HD cell pairs during vp1 and vp2 trials.
A unique color is used for each mouse. Solid red lines are regression lines and dashed red lines represent confidence intervals.
Additional files
-
Supplementary file 1
Histological results.
Location of the tetrode tips and number of HD cells (theta-rhythmic and non-rhythmic) and grid cells recorded in each hemisphere.
- https://doi.org/10.7554/eLife.35949.019
-
Transparent reporting form
- https://doi.org/10.7554/eLife.35949.020
Download links
A two-part list of links to download the article, or parts of the article, in various formats.
Downloads (link to download the article as PDF)
Open citations (links to open the citations from this article in various online reference manager services)
Cite this article (links to download the citations from this article in formats compatible with various reference manager tools)
Non-rhythmic head-direction cells in the parahippocampal region are not constrained by attractor network dynamics
eLife 7:e35949.
https://doi.org/10.7554/eLife.35949


