TALE factors use two distinct functional modes to control an essential zebrafish gene expression program
- University of Massachusetts Medical School, United States
- University of Manchester, United Kingdom
Figures
Figure 1 with 1 supplement
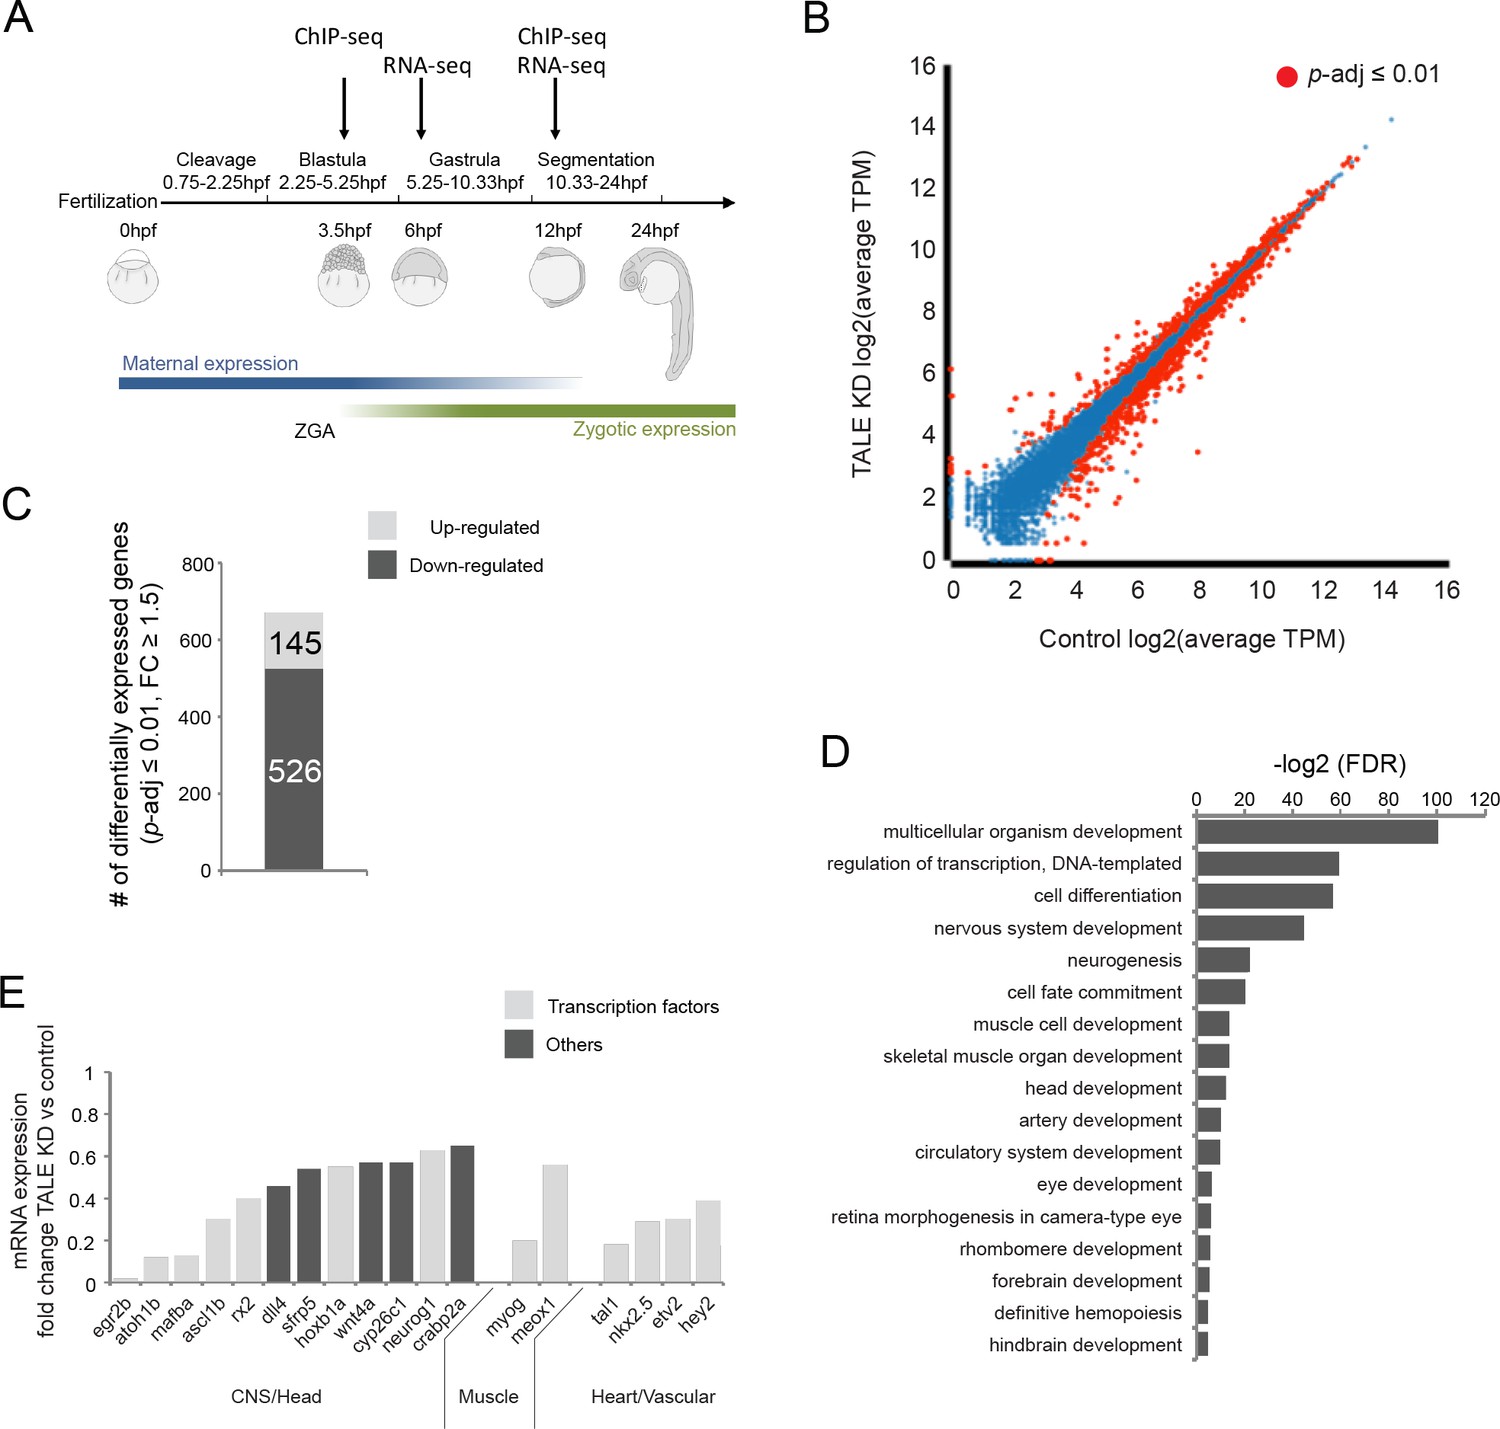
TALE factors control a gene network regulating formation of anterior embryonic structures.
See also Figure 1—figure supplement 1. (A) Schematic of zebrafish embryogenesis indicating time points used for RNA-seq and ChIP-seq analyses. The 3.5hpf time point represents a stage prior to robust zygotic gene expression, while 12hpf corresponds to the time when tissue morphogenesis is initiated. The 6hpf time point for RNA-seq was selected to capture changes in gene expression occuring shortly after ZGA. ZGA = zygotic genome activation; hpf = hours post-fertlization. (B) Scatter plot showing average TPM gene expression as identified by RNA-seq in control vs TALE KD 12hpf embryos. Genes with significant expression variation (p-adj ≤0.01) are highlighted in red. Statistical test = Wald test in DeSeq2. (C) Graph showing the number of genes up/downregulated (p-adj ≤0.01, fold-change ≥1.5) in 12hpf TALE KD samples vs control. (D) DAVID analysis of genes downregulated (p-adj ≤0.01, fold-change ≥1.5) in 12hpf TALE KD samples vs control. Note that only select categories are presented, a full list of GO terms is available in Supplementary file 3. FDR = Benjamini multiple testing False Discovery Rate. (E) Expression fold-change of select genes significantly downregulated in 12hpf TALE KD samples compared to control. Genes were selected based on their role in regulation of relevant embryonic structures.
Figure 1—figure supplement 1
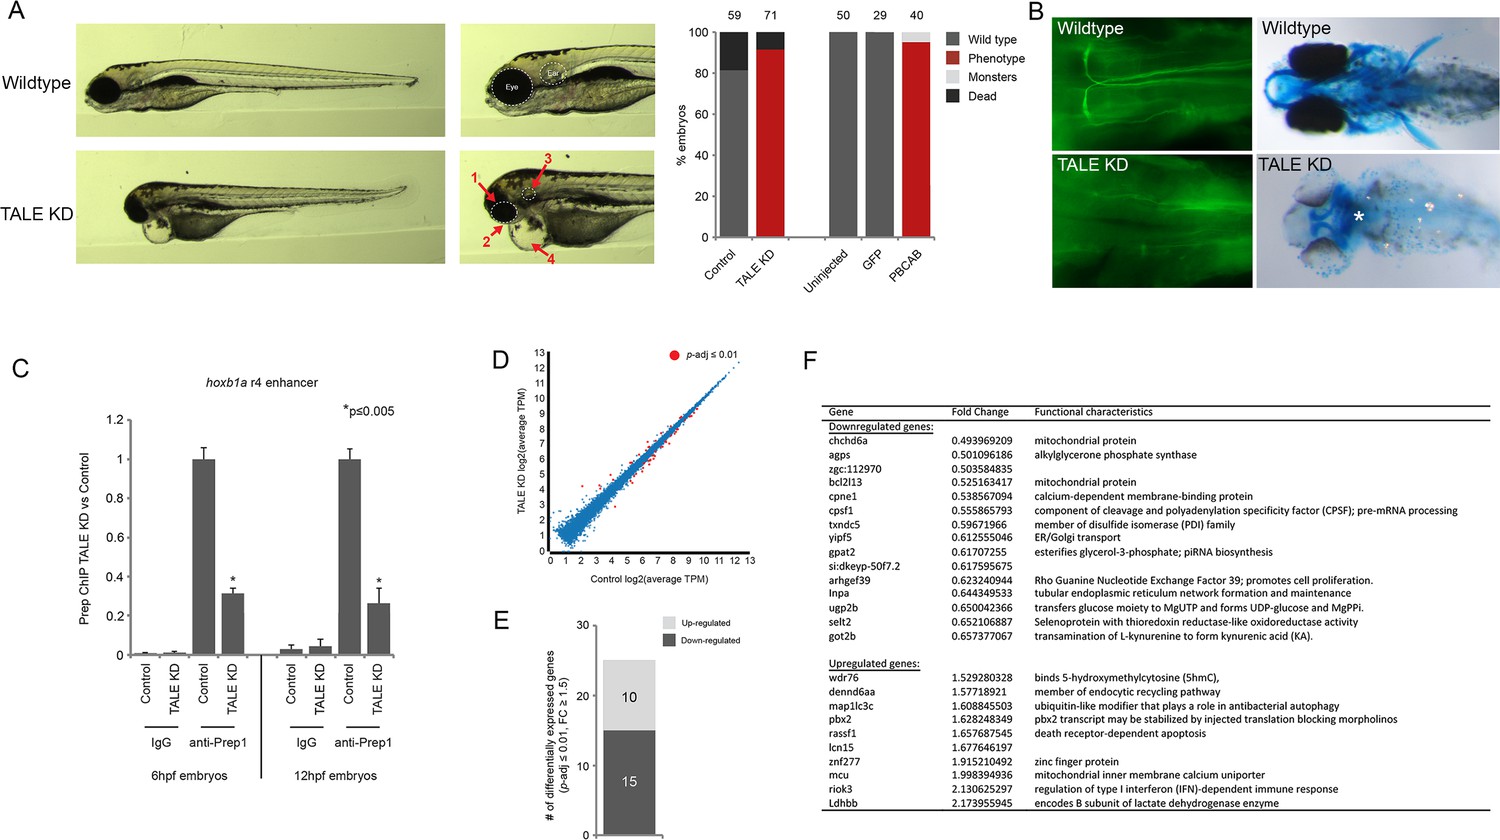
Characterization of the TALE KD phenotype.
(A) Left panels; images of 4 days post-fertilization (dpf) zebrafish following TALE knockdown (TALE KD). Middle panels; views of the anterior region at higher magnification. The TALE KD phenotype is characterized by an overall small head with under-developed eyes (1), jaw (2) and otic vesicles (3), as well as cardiac edema (4). Right bar graphs; quantification of the phenotype for TALE KD zebrafish and zebrafish injected with mRNA encoding a dominant negative TALE protein (PBCAB [Choe et al., 2009]). Note that both strategies for TALE disruption produce similar results, showing the specificity of the phenotype. Numbers above bars indicate the total number of embryos analyzed in each condition. (B) Left panels; wildtype (top) and TALE KD (bottom) 48hpf embryos stained with 3A10 antibody to detect hindbrain Mauthner neurons (images show only the hindbrain and are in dorsal view with anterior to the left). Right panels; wildtype (top) and TALE KD (bottom) 5dpf embryos stained with alcian blue to detect cartilage (images are ventral views with anterior to the left). Asterisk indicates loss of cartilage in TALE KD embryos. Also note the absence of pectoral fins in TALE KD embryos. (C) ChIP-qPCR showing Prep binding at the hoxb1a r4 enhancer in TALE KD vs control embryos at 6hpf and 12hpf. Note that TALE KD disrupts genomic Prep occupancy. Three independent biological replicates are presented as mean fold-change ± SEM of Prep IP in TALE KD vs control samples. Statistical test: unpaired t-test. (D) Scatter plot showing average TPM gene expression as identified by RNA-seq in TALE KD embryos vs control at 6hpf. Genes with significant expression variation (p-adj ≤0.01) are colored in red. Statistical test = Wald test in DeSeq2. (E) Graph showing the number of genes up/downregulated (p-adj ≤0.01, fold-change ≥1.5) in 6hpf TALE KD embryos vs control. (F) Table listing all genes up/downregulated at 6hpf in TALE KD embryos relative to control.
Figure 2 with 1 supplement
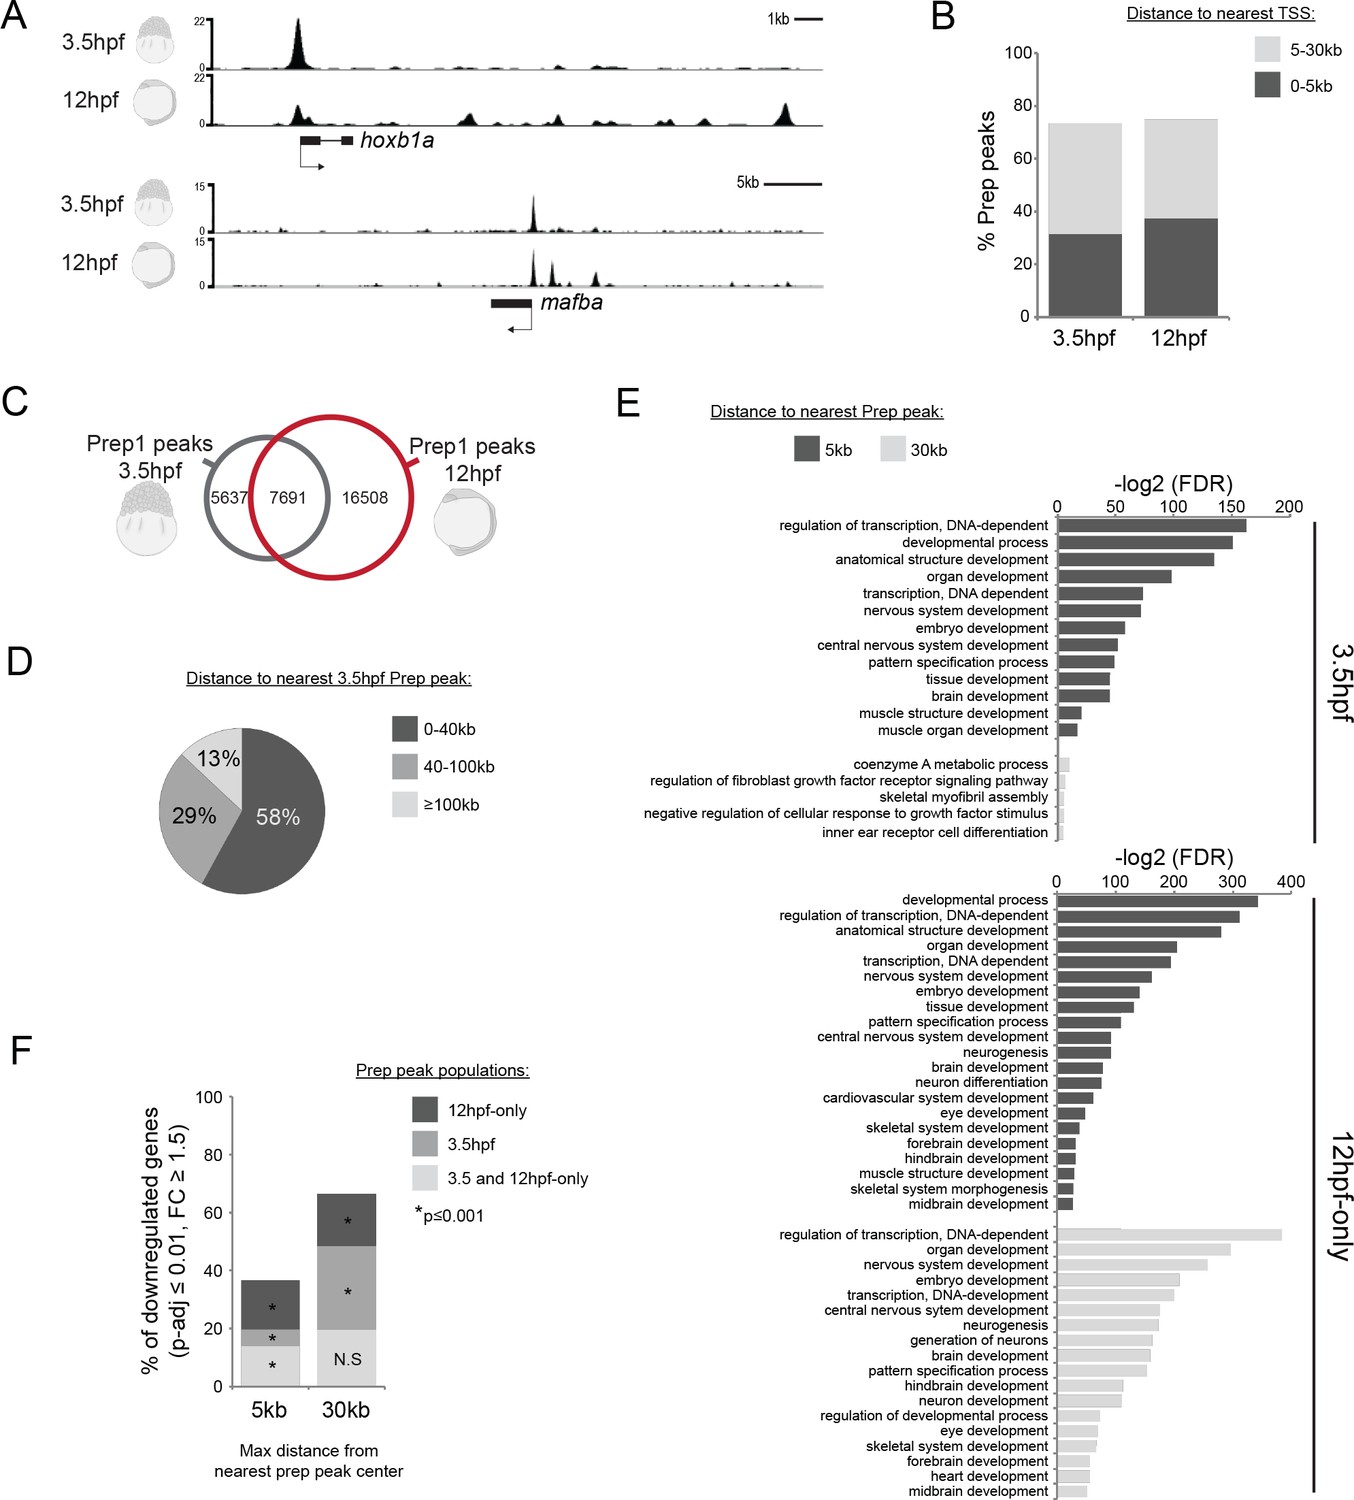
Genomic TALE occupancy is continuously and dynamically associated with the TALE GRN during embryogenesis.
See also Figure 2—figure supplement 1. (A) Representative UCSC browser tracks illustrating Prep binding at the hoxb1a and mafba loci in 3.5 and 12hpf embryos. (B) Graph showing the distribution of Prep3.5hpf and Prep12hpf binding sites relative to TSSs. (C) Venn diagram illustrating co-localization of Prep peaks in 3.5hpf and 12hpf embryos. Two peaks are considered to co-localize if their summits are within 50 bp. (D) Chart illustrating percent of Prep12hpf-only peaks found at various distances from Prep3.5hpf peaks. (E) GO term enrichment for Prep3.5hpf and Prep12hpf-only peaks identified by GREAT using the nearest gene within 5 or 30 kb association rule. In the case of GO terms associated with genes within 30 kb, only select categories are presented, a full list of GO terms is available in Supplementary file 3. FDR = Binomial False Discovery Rate. (F) Graph showing percent of TALE GRN genes (p-adj ≤0.01, fold-change ≥1.5) associated (≤5 or 30 kb) with Prep3.5hpf and Prep12hpf-only peaks. p-values for enrichment above a random set of genes were calculated using the Pearson correlation test.
Figure 2—figure supplement 1
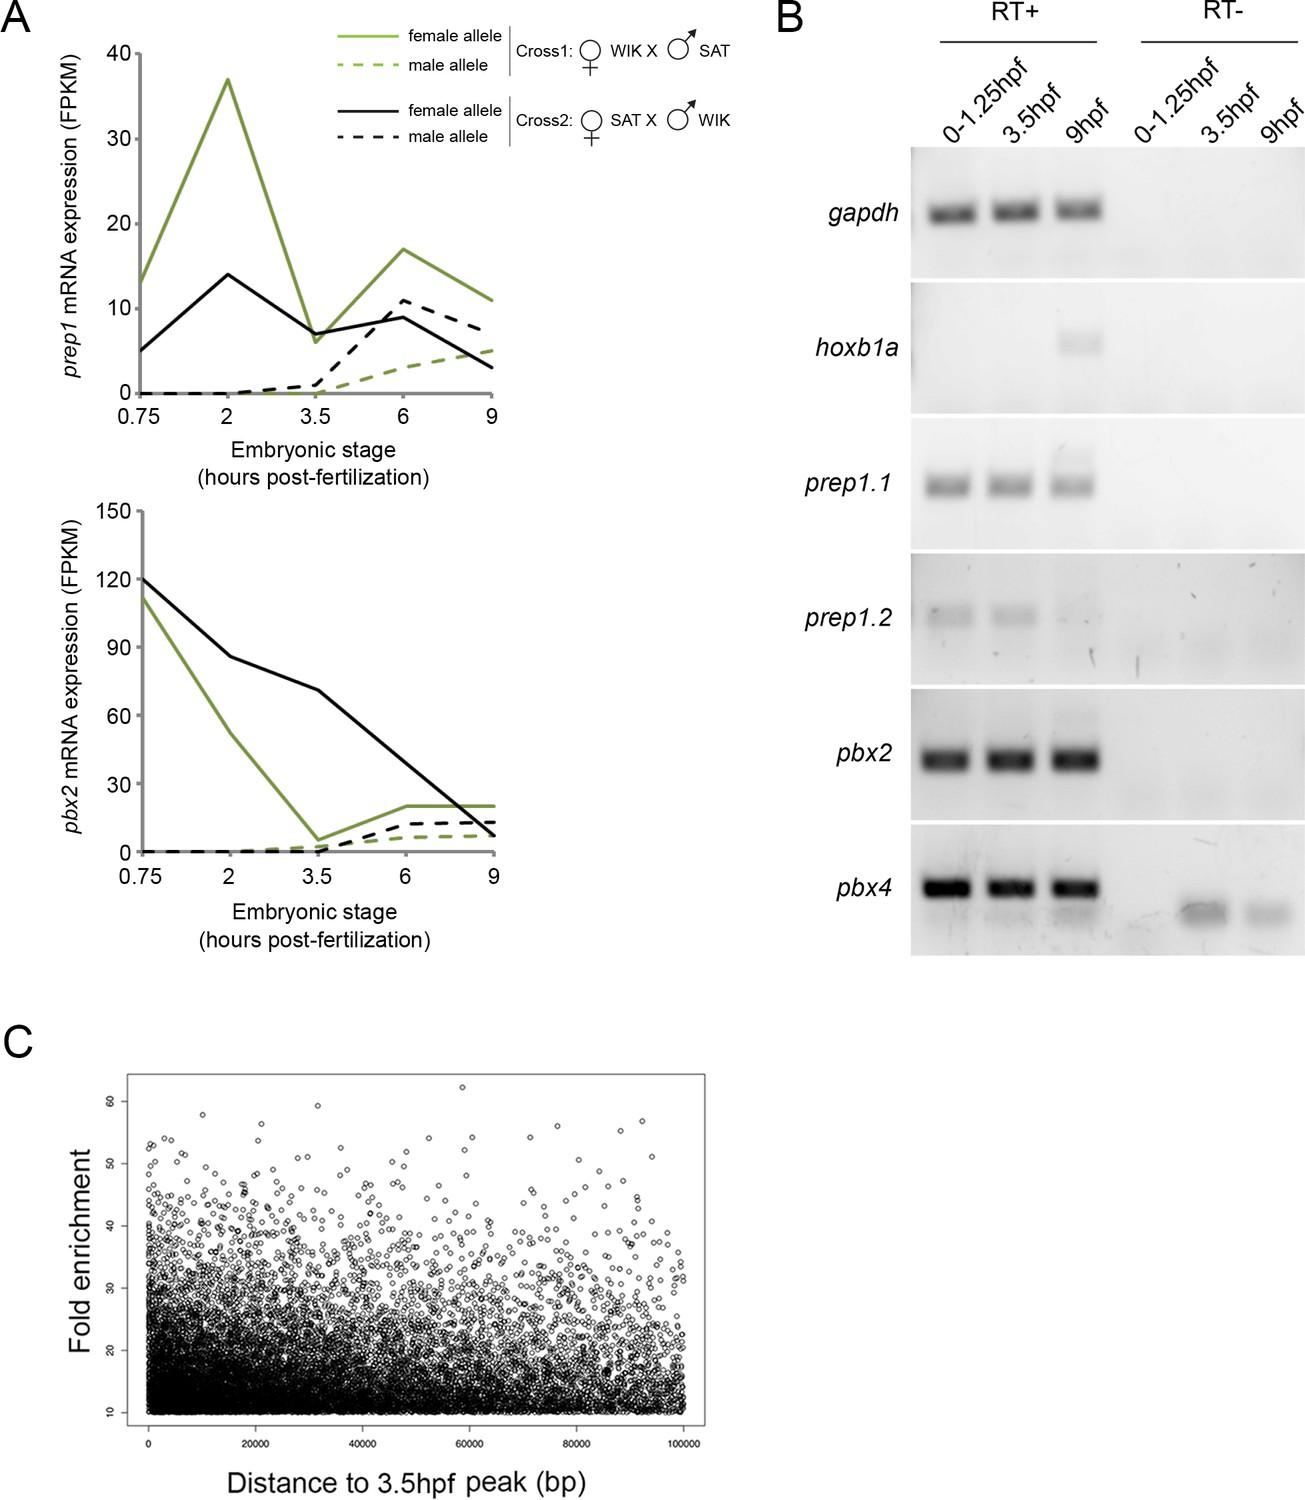
Analysis of TALE binding in zebrafish embryos.
(A) Expression levels of maternal and paternal prep1 and pbx2 transcripts during early zebrafish embryogenesis (from [Harvey et al., 2013]). Until 3.5hpf, transcripts from the paternal allele (which requires zygotic activation) are not detected, demonstrating that only maternal prep and pbx transcripts are present prior to this time point. (B) RT-PCR analysis on 0–1.25hpf, 3.5hpf and 9hpf zebrafish embryos demonstrating that prep1.1, prep1.2, pbx2 and pbx4 transcripts are maternally deposited. (C) Density plot illustrating the distance between each Prep12hpf-only peak and its nearest Prep3.5hpf peak. Peaks located >100 kb from a Prep3.5hpf peak are not shown (of 16,500 Prep12hpf-only peaks, 2,138 [13%] are located at >100 kb). p=1.85 E-11 (Chi-square comparison to shuffled peaks).
Figure 3
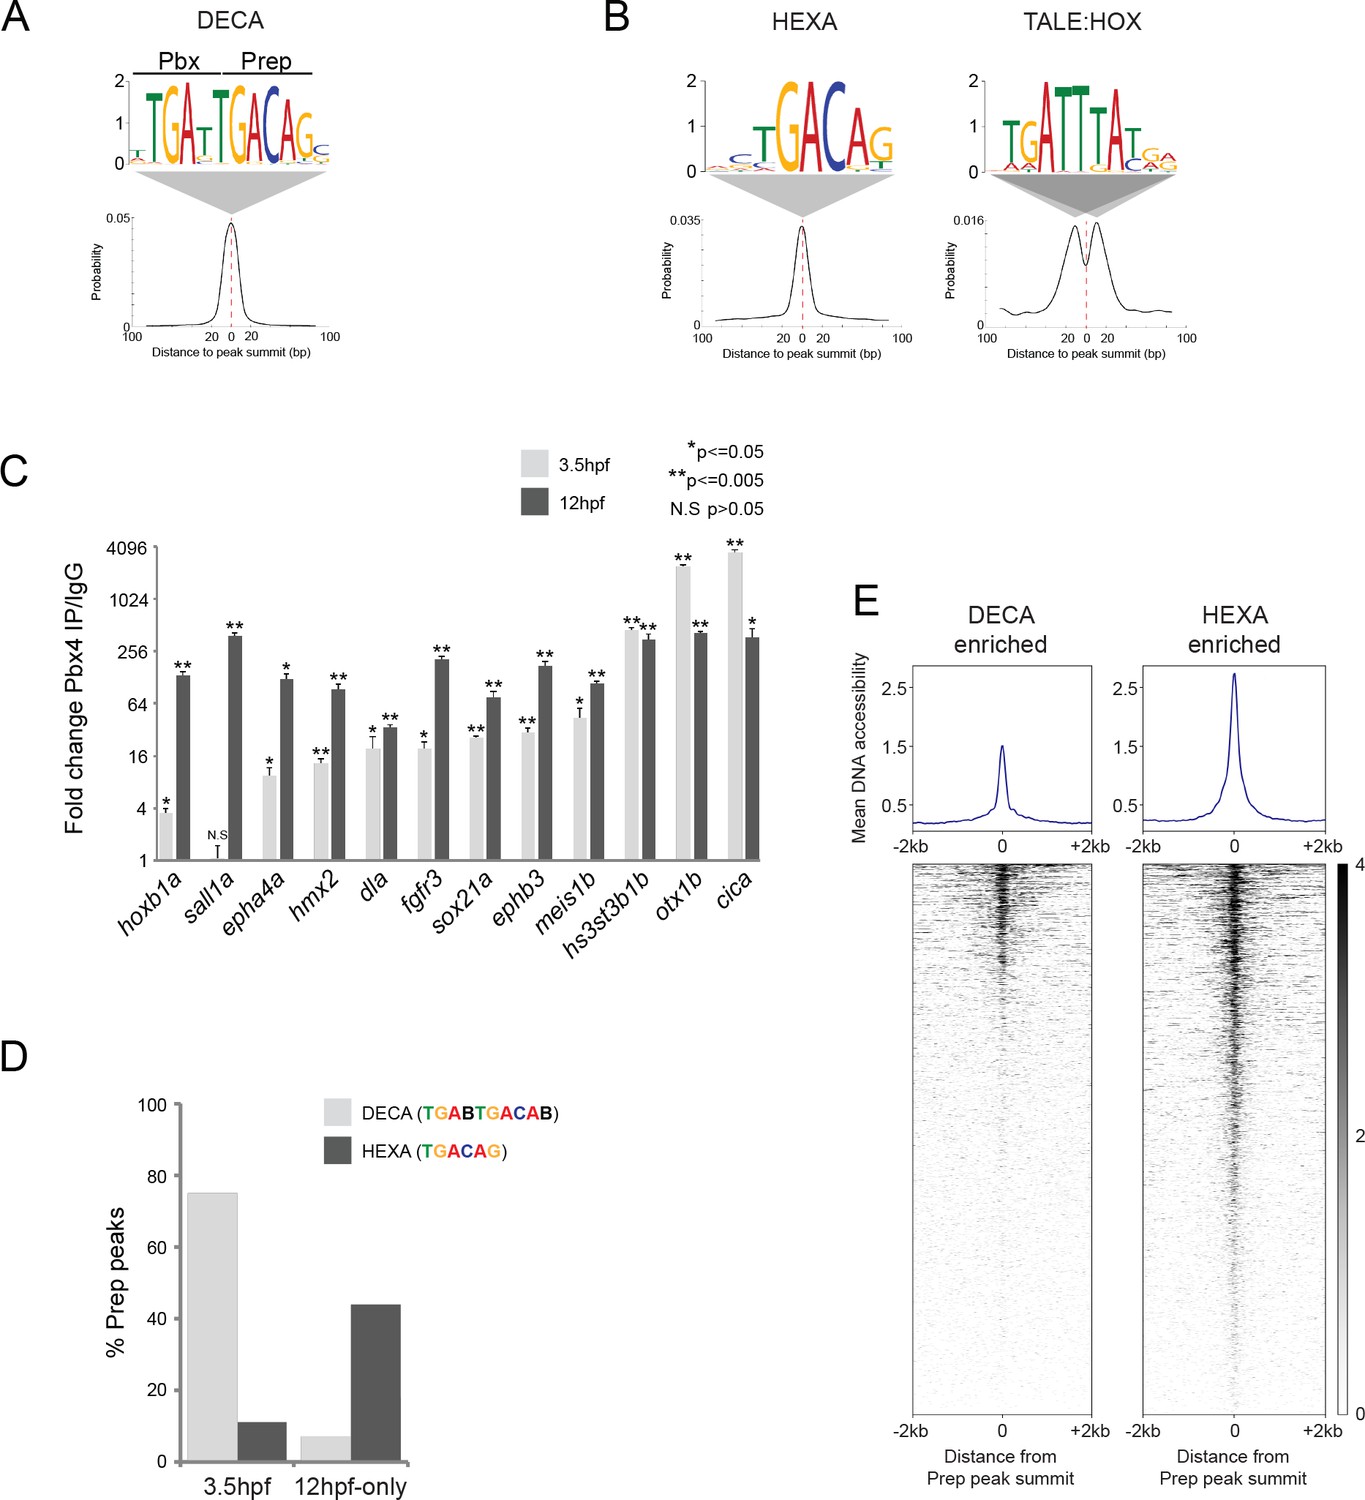
TALE factors utilize distinct binding motifs at early versus late stages of embryogenesis.
(A) Sequence logo and localization relative to Prep peak summits of sequence motifs identified by MEME at Prep3.5hpf peaks. (B) Sequence logo and localization relative to Prep peak summits of sequence motifs identified by MEME at Prep12hpf-only peaks. (C) ChIP-qPCR showing Pbx4 binding at Prep-occupied DECA sites at 3.5hpf and 12hpf, labeled with the name of the nearest gene. Data of three independent biological replicates are presented as mean fold change ± SEM of Pbx4 IP vs control IgG. Statistical test: unpaired t-test. (D) Graph showing percent of Prep3.5hpf and Prep12hpf-only peaks that contain DECA or HEXA motifs. (E) Heatmaps displaying chromatin accessibility at 4hpf (derived from ATAC-seq data [Kaaij et al., 2016]) at DECA (left panel) and HEXA (right panel) enriched peaks. (Prep3.5hpf and Prep12hpf-only peaks were used as a source of DECA- and HEXA-enriched sites, respectively.).
-
Figure 3—source data 1
Input sequences.
- https://doi.org/10.7554/eLife.36144.007
Figure 4 with 2 supplements
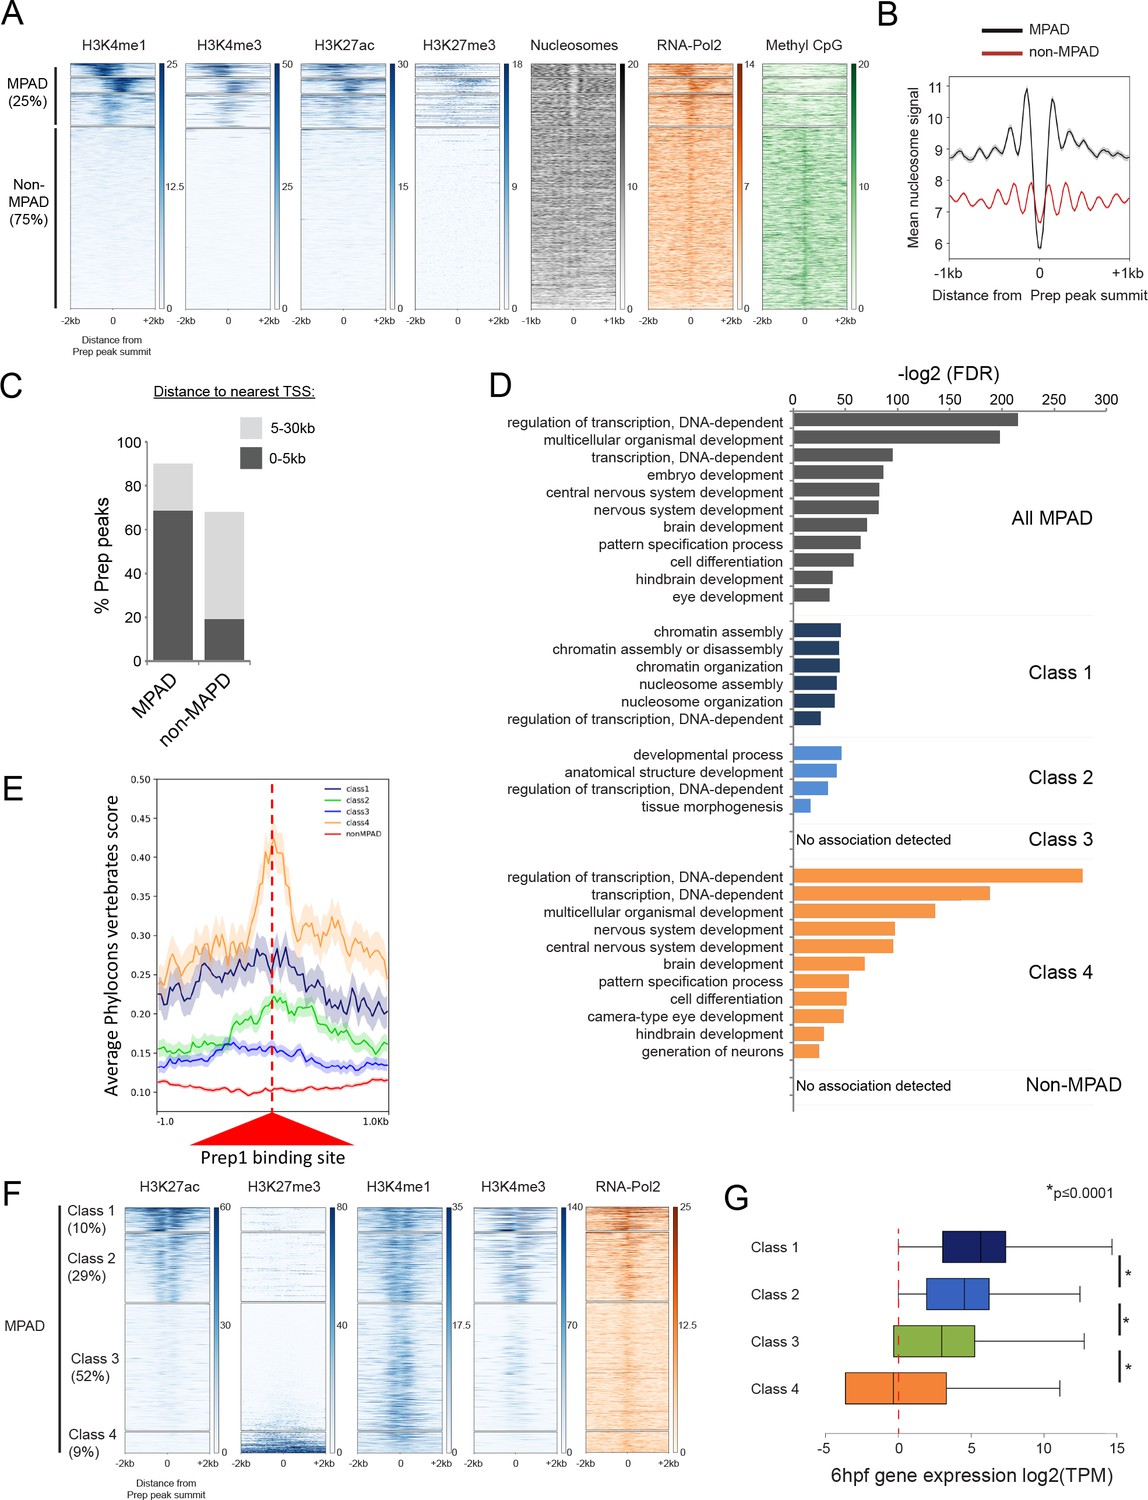
Some TALE-occupied sites are associated with chromatin marks at blastula stages and developmental control genes are enriched near MPADs displaying repressive histone modifications.
See also Figure 4—figure supplements 1 and 2. (A) Heatmaps displaying chromatin features at genomic regions occupied by Prep at 3.5hpf. H3K4me1 signals at Prep-occupied elements was analyzed by K-mean (k = 4) clustering (left panel). H3K4me3, H3K27ac, H3K27me3, nucleosome, RNA-pol2 subunit RPB1 and Methyl CpG signals are displayed based on the H3K4me1 clustering order. (B) Average nucleosome signal at MPADs and non-MPADs (as defined in A). (C) Distribution of MPADs and non-MPADs relative to TSSs. (D) GO term enrichment for MPADs and non-MPADs identified by GREAT (nearest gene within 30 kb). Note that genes associated with Class 3 MPADs or non-MPADS are not enriched for GO terms. Only select categories are presented, a full list of GO terms is available in Supplementary file 2. FDR = Binomial False Discovery Rate. (E) Conservation of 3.5hpf Prep-occupied sites among vertebrates generated using PhastCons vertebrate 8-way comparison. The score shown is the probability (0 ≤ p ≤ 1) that each nucleotide belongs to a conserved genomic element. (F) Heatmaps displaying chromatin features at MPADs. H3K27ac and H3K27me3 signals at MPADs were analyzed by K-mean (k = 4) clustering. H3K4me1, H3K4me3, nucleosome and RBP1 signals are displayed based on the H3K27ac/me3 clustering order. (G) Box plots showing average expression of genes near (≤30 kb) each of the four MPAD classes, as determined by RNA-seq on 6hpf embryos. Data are presented as log2 of mean TPM (transcripts per million) values from three biological replicates. Statistical test: pairwise comparison with Kruskal-Wallis followed by Dunn's post-hoc test.
Figure 4—figure supplement 1
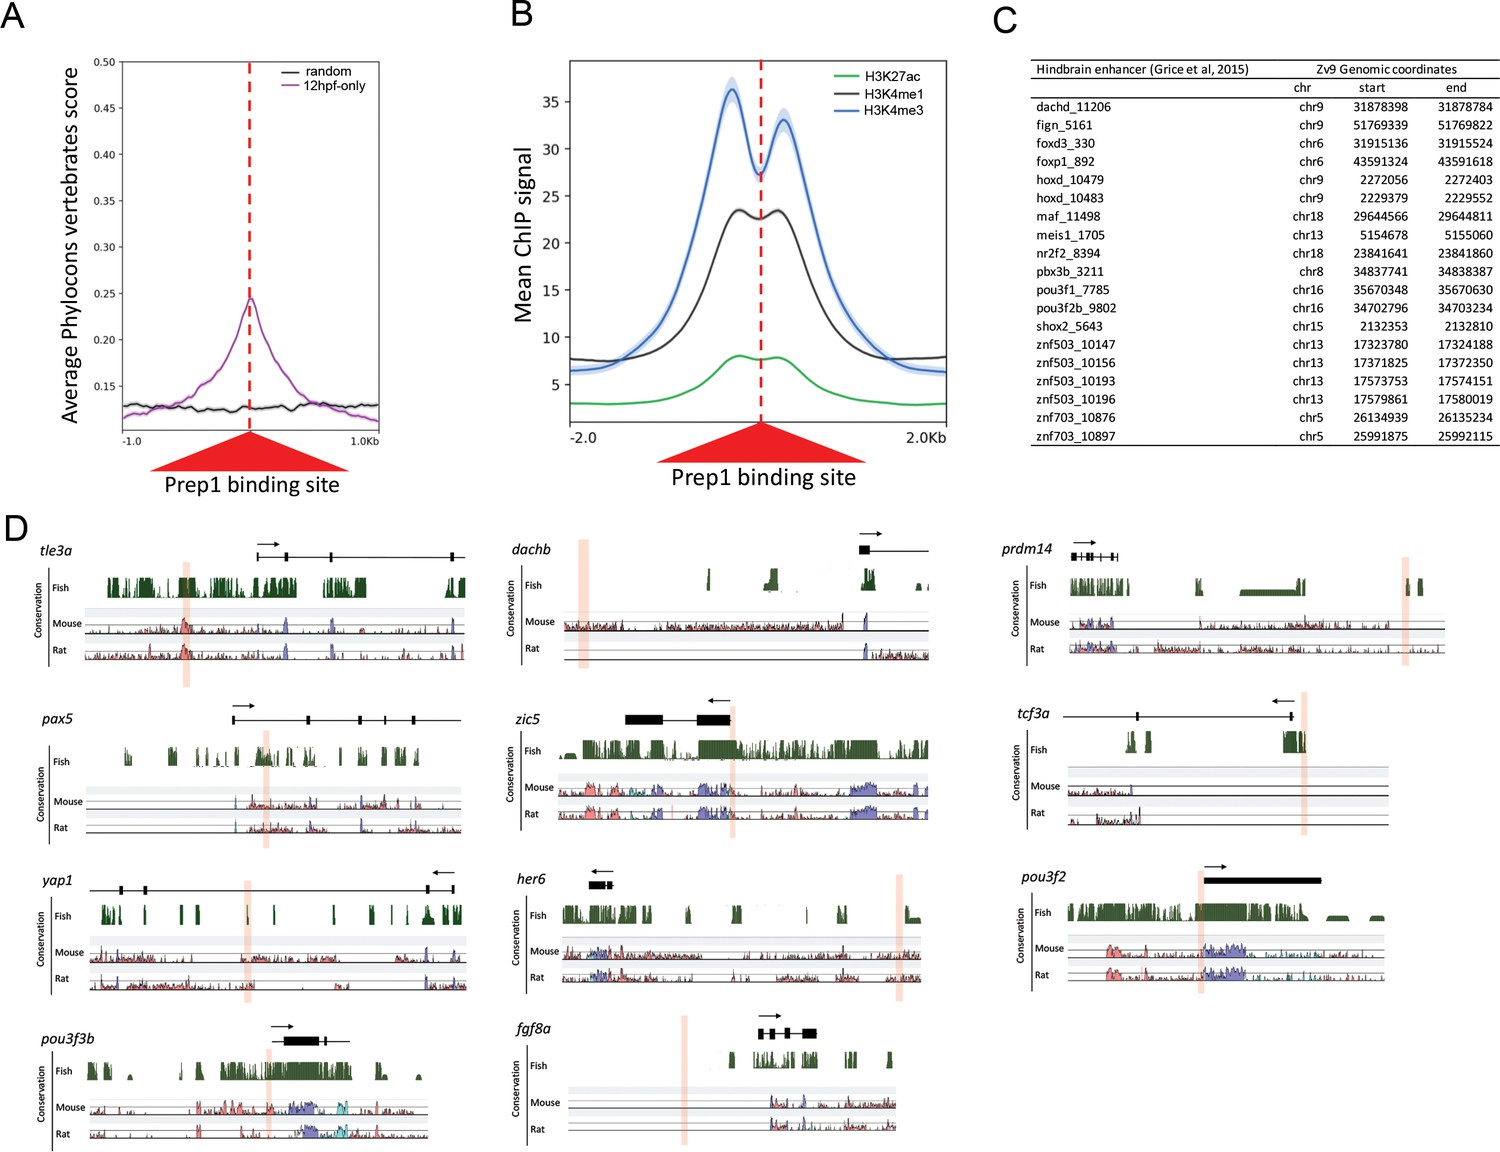
Comparison of early and late Prep-occupied sites.
(A) Conservation of Prep12hpf-only-occupied sites among vertebrates plotted using PhastCons vertebrate 8-way comparison. The score shown is the probability (0 ≤ p ≤ 1) that each nucleotide belongs to a conserved genomic element. (B) Average ChIP-seq signal for H3K27ac, H3K4me1 and H3K4me3 at Prep12hpf-only-occupied sites. (C) Table listing hindbrain enhancers (identified in [Grice et al., 2015]) that overlap with a Prep12hpf-only-occupied site by 50 bp. (D) Assessment of sequence conservation for eleven Prep3.5hpf-occupied sites. Browser shots of conservation among fish (displayed as PhastCons plots in the UCSC browser), mouse and rat (displayed in VISTA plots) were aligned based on the exon/intron structure of the nearest gene.
Figure 4—figure supplement 2
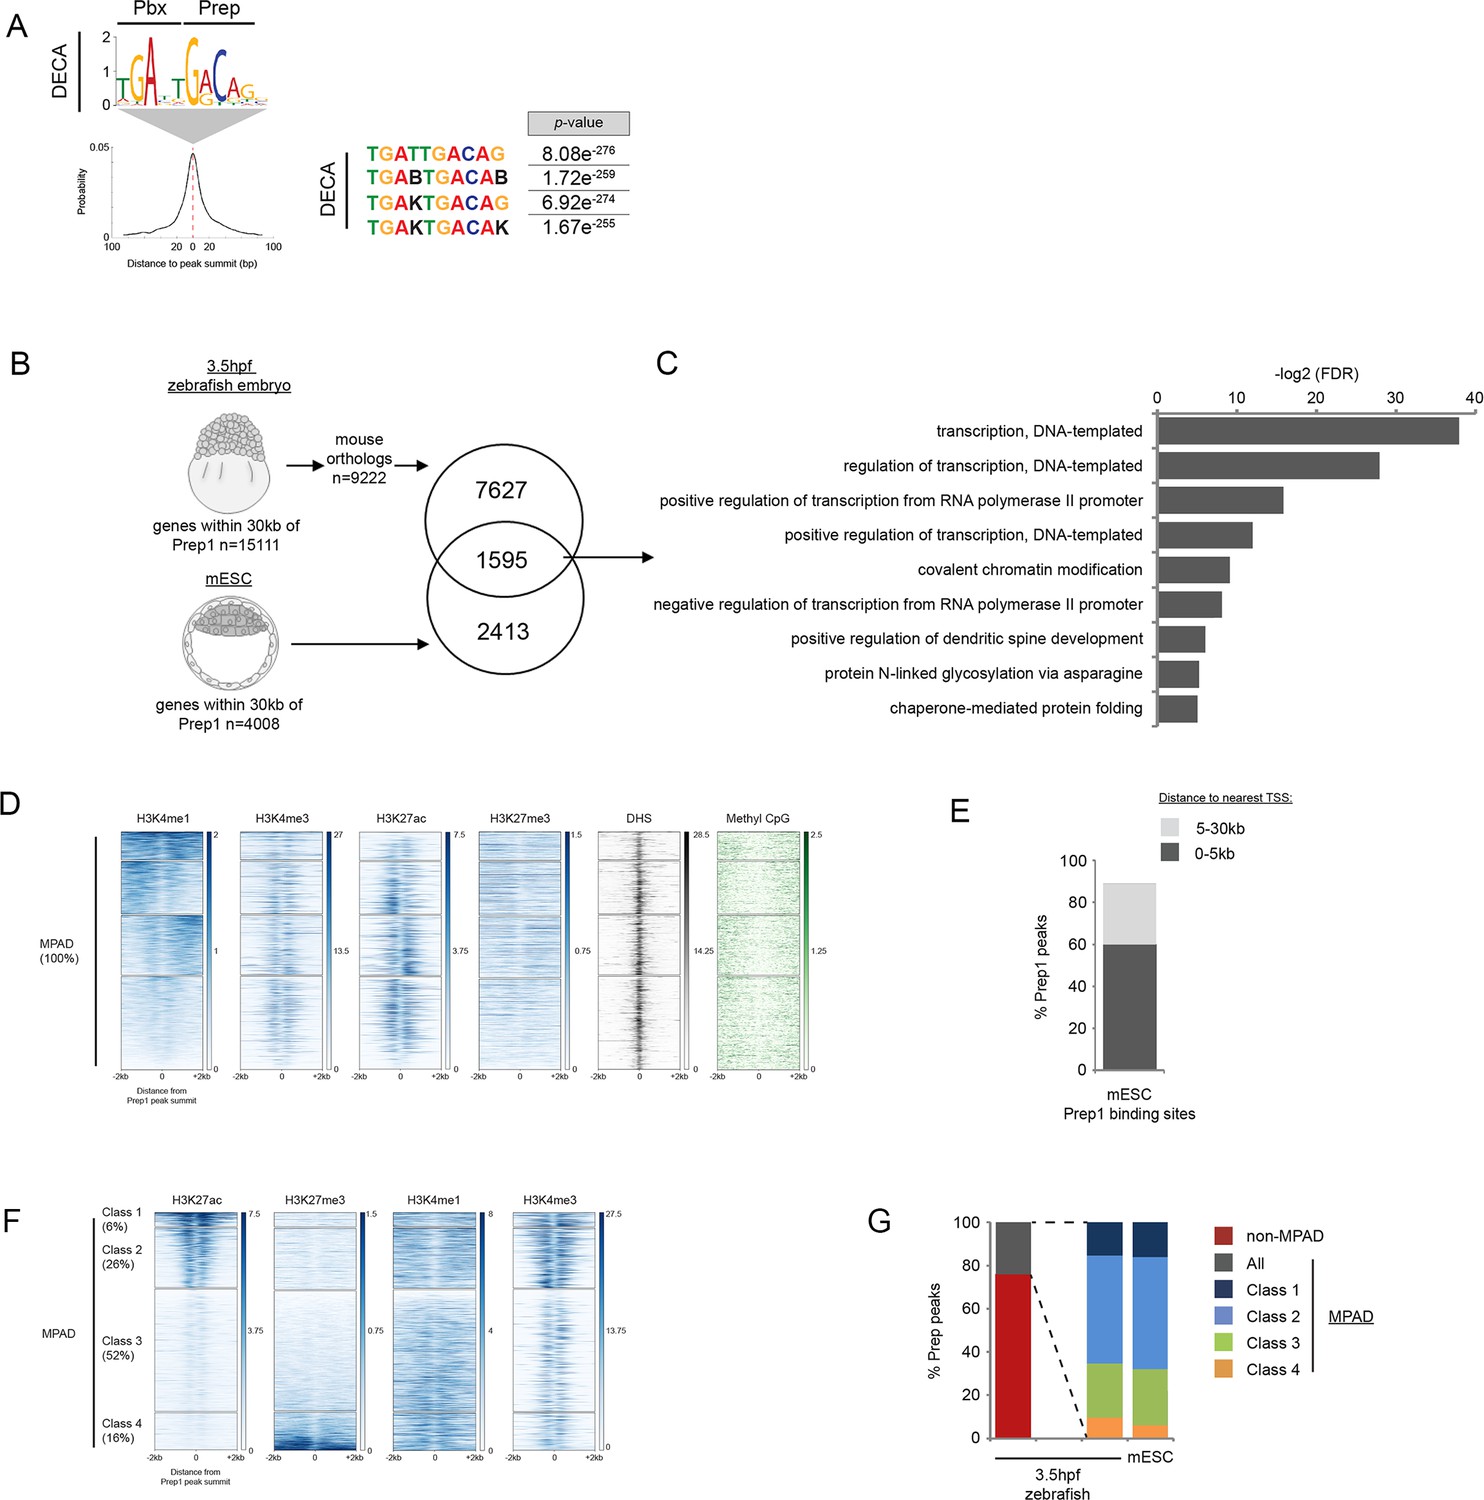
TALE occupancy in mESCs is associated with chromatin profiles similar to 3.5hpf zebrafish embryos.
(A) Sequence logo, enrichment and localization relative to Prep1 peak summit of the DECA motif in mESCs (using data from [Laurent et al., 2015]). p-values for enrichment above random occurrence were calculated using the ranksum test in AME. Motifs are shown in IUPAC code (B = C, G or T; K = T or G). (B) Identification of genes bound by Prep in 3.5hpf zebrafish embryos and mESC. 1595 genes are associated with (within 30 kb) Prep binding in 3.5hpf zebrafish embryos and mESCs. (C) DAVID analysis of the 1,595 Prep-associated genes common to 3.5hpf embryos and mESCs identified in Figure 4—figure supplement 2B. Note that only select categories are presented and that a full list of GO terms is available in Supplementary file 3. FDR = Benjamini multiple testing False Discovery Rate. (D) Heatmaps displaying chromatin features at genomic regions occupied by Prep1 in mESCs. H3K4me1 signal at Prep-occupied elements was analyzed by K-mean (k = 4) clustering (left panel). H3K4me3, H3K27ac, H3K27me3, DNAse Hypersensitivity Sites (DHS), and methyl CpG signals are displayed based on the H3K4me1 clustering order. (E) Distribution of mESC MPADs relative to TSSs. (F) Heatmaps displaying chromatin features at mESC MPADs. H3K27ac and H3K27me3 signals at MPADs were analyzed by K-mean (k = 4) clustering. H3K4me1, H3K4me3 signals are displayed based on the H3K27ac/me3 clustering order. (G) Graph showing the percent of Prep binding in each category (MPAD, non-MPAD and MPAD classes) in 3.5hpf zebrafish embryos and mESCs.
Figure 5 with 1 supplement
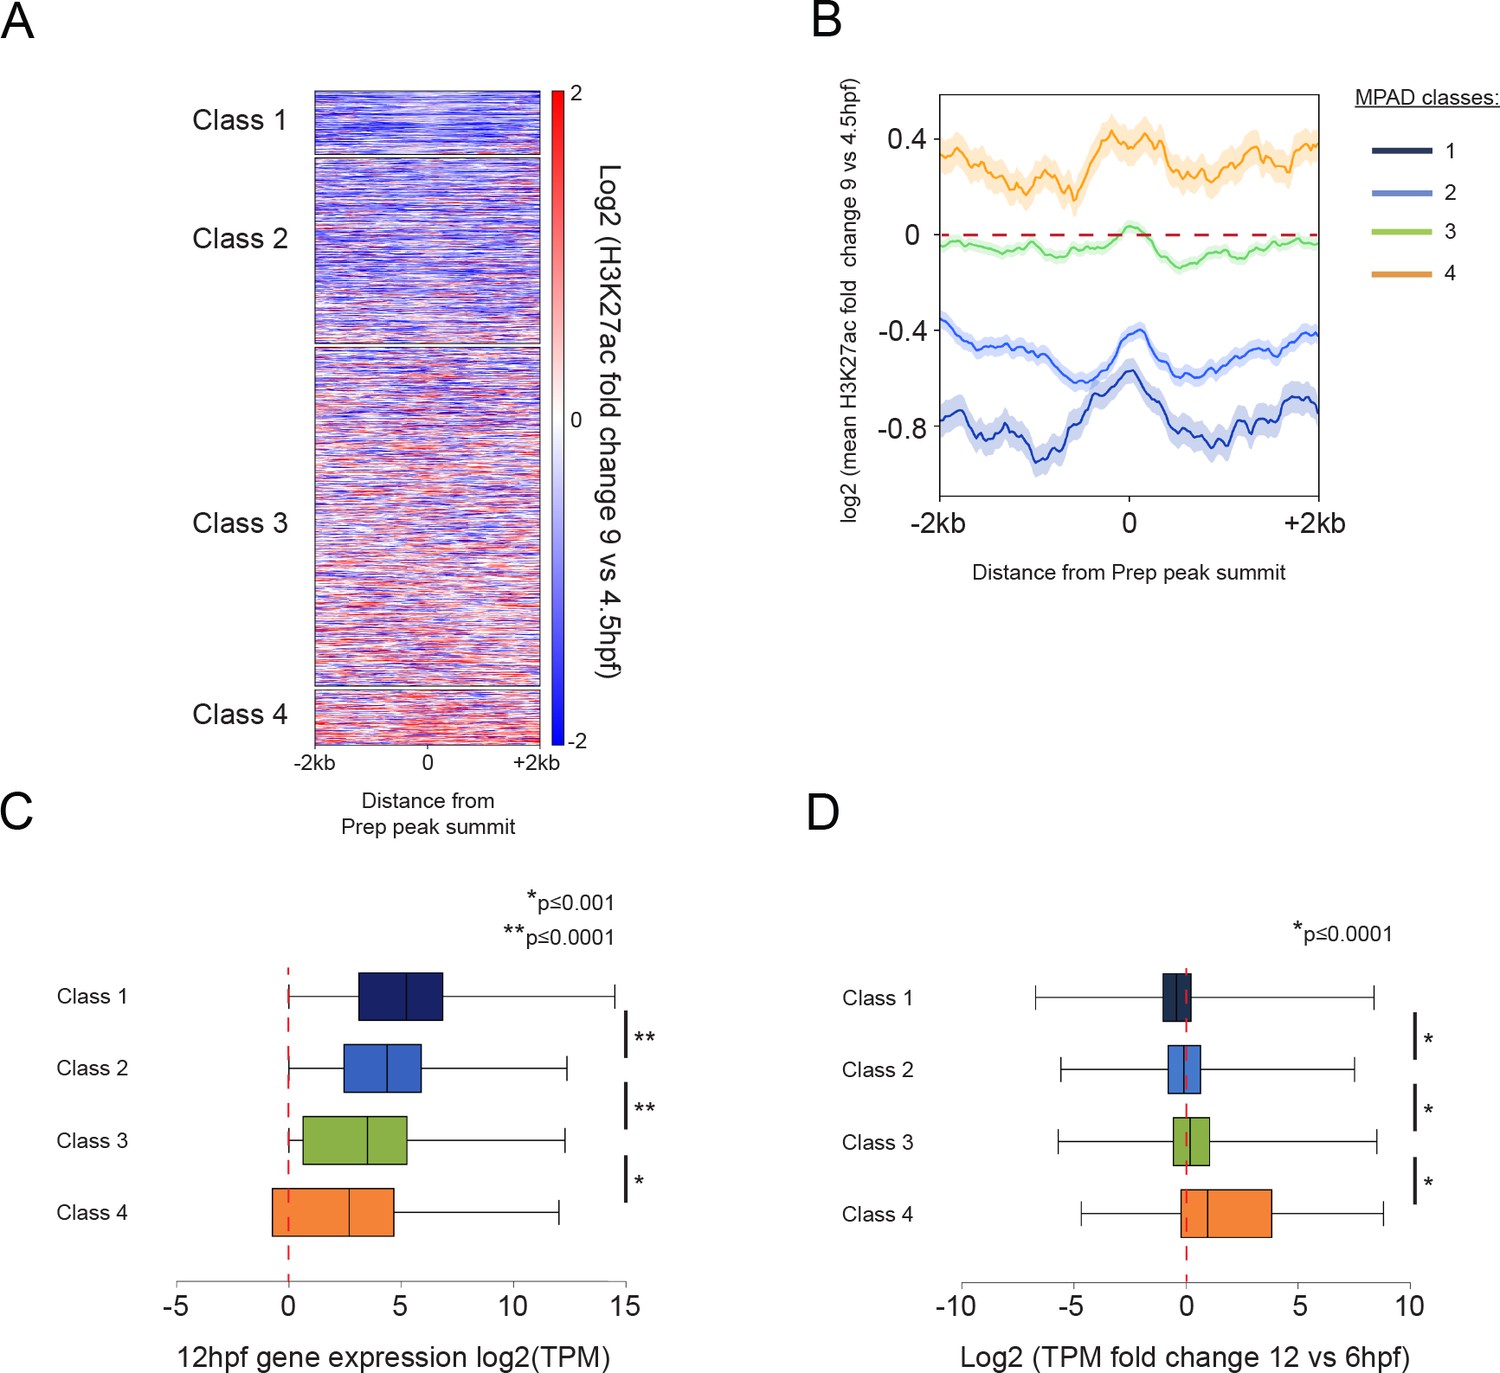
Class 4 MPADs transition to an active chromatin state during embryogenesis.
See also Figure 5—figure supplement 1. (A) Heatmap displaying the change in H3K27ac signal (log2 of fold-change) at MPADs between 4.5 and 9hpf of zebrafish embryogenesis. Ranking of MPADs is the same as in Figure 4F. (B) Average change in H3K27ac signal between 4.5hpf and 9hpf (log2 of fold-change) at MPADs. (C, D) Box plots showing expression of genes associated (≤30 kb) with each of the four MPAD classes, as determined by RNA-seq on 6hpf and 12hpf embryos. Data are presented as log2 of mean TPM values at 12hpf (C) or as log2 of mean TPM fold-change between 12hpf and 6hpf (D). Statistical test: pairwise comparison with Kruskal-Wallis followed by Dunn's post-hoc test.
Figure 5—figure supplement 1
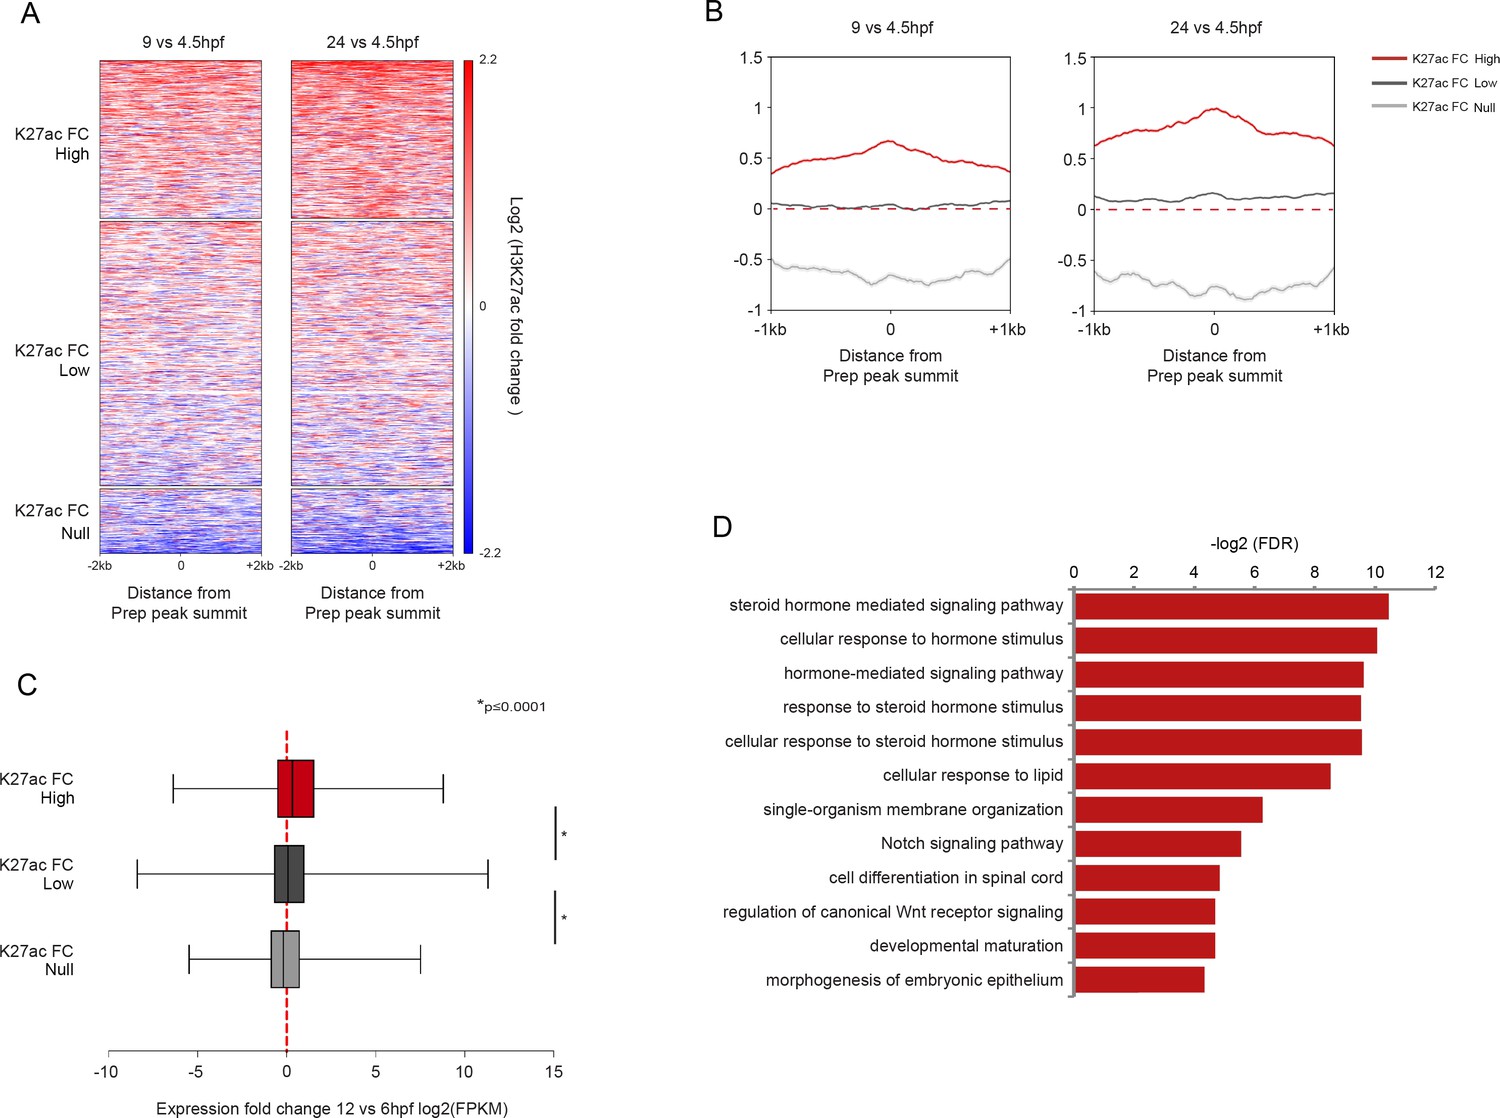
Non-MPADs undergo changes in chromatin state during embryogenesis.
(A) Heatmaps displaying the change in H3K27ac signal at non-MPAD Prep binding sites during zebrafish embryogenesis. H3K27ac signal log2 fold-change (9hpf vs 4.5hpf and 24hpf vs 4.5hpf) at non-MPAD elements was analyzed by K-mean (k = 3) clustering. Clustering identifies three non-MPAD categories with high (K27acFC-High), low (K27acFC-Low) or null/negative (K27acFC-Null) H3K27ac fold-change during embryonic development. (B) Average change in H3K27ac signal (log2 of fold-change) between 4.5hpf and 9hpf (left panel) or 4.5hpf and 24hpf (right panel) at non-MPAD categories from Figure 5—figure supplement 1A. (C) Box plot showing the expression change of genes near (≤30 kb) each of the three non-MPAD K27acFC categories, as determined by RNA-seq on 6hpf and 12hpf zebrafish embryos. Data are presented as log2 of mean TPM (transcripts per million) fold-change between 12hpf and 6hpf. Statistical test: pairwise comparison with Kruskal-Wallis followed by Dunn's post-hoc test. (D) GO term enrichment for non-MPAD regions highly acetylated (K27acFC-High) during gastrulation/segmentation as identified by GREAT using the nearest gene within 30 kb association rule. Note that only select categories are presented and that a full list of GO terms is available in Supplementary file 3. FDR = Binomial False Discovery Rate.
Figure 6
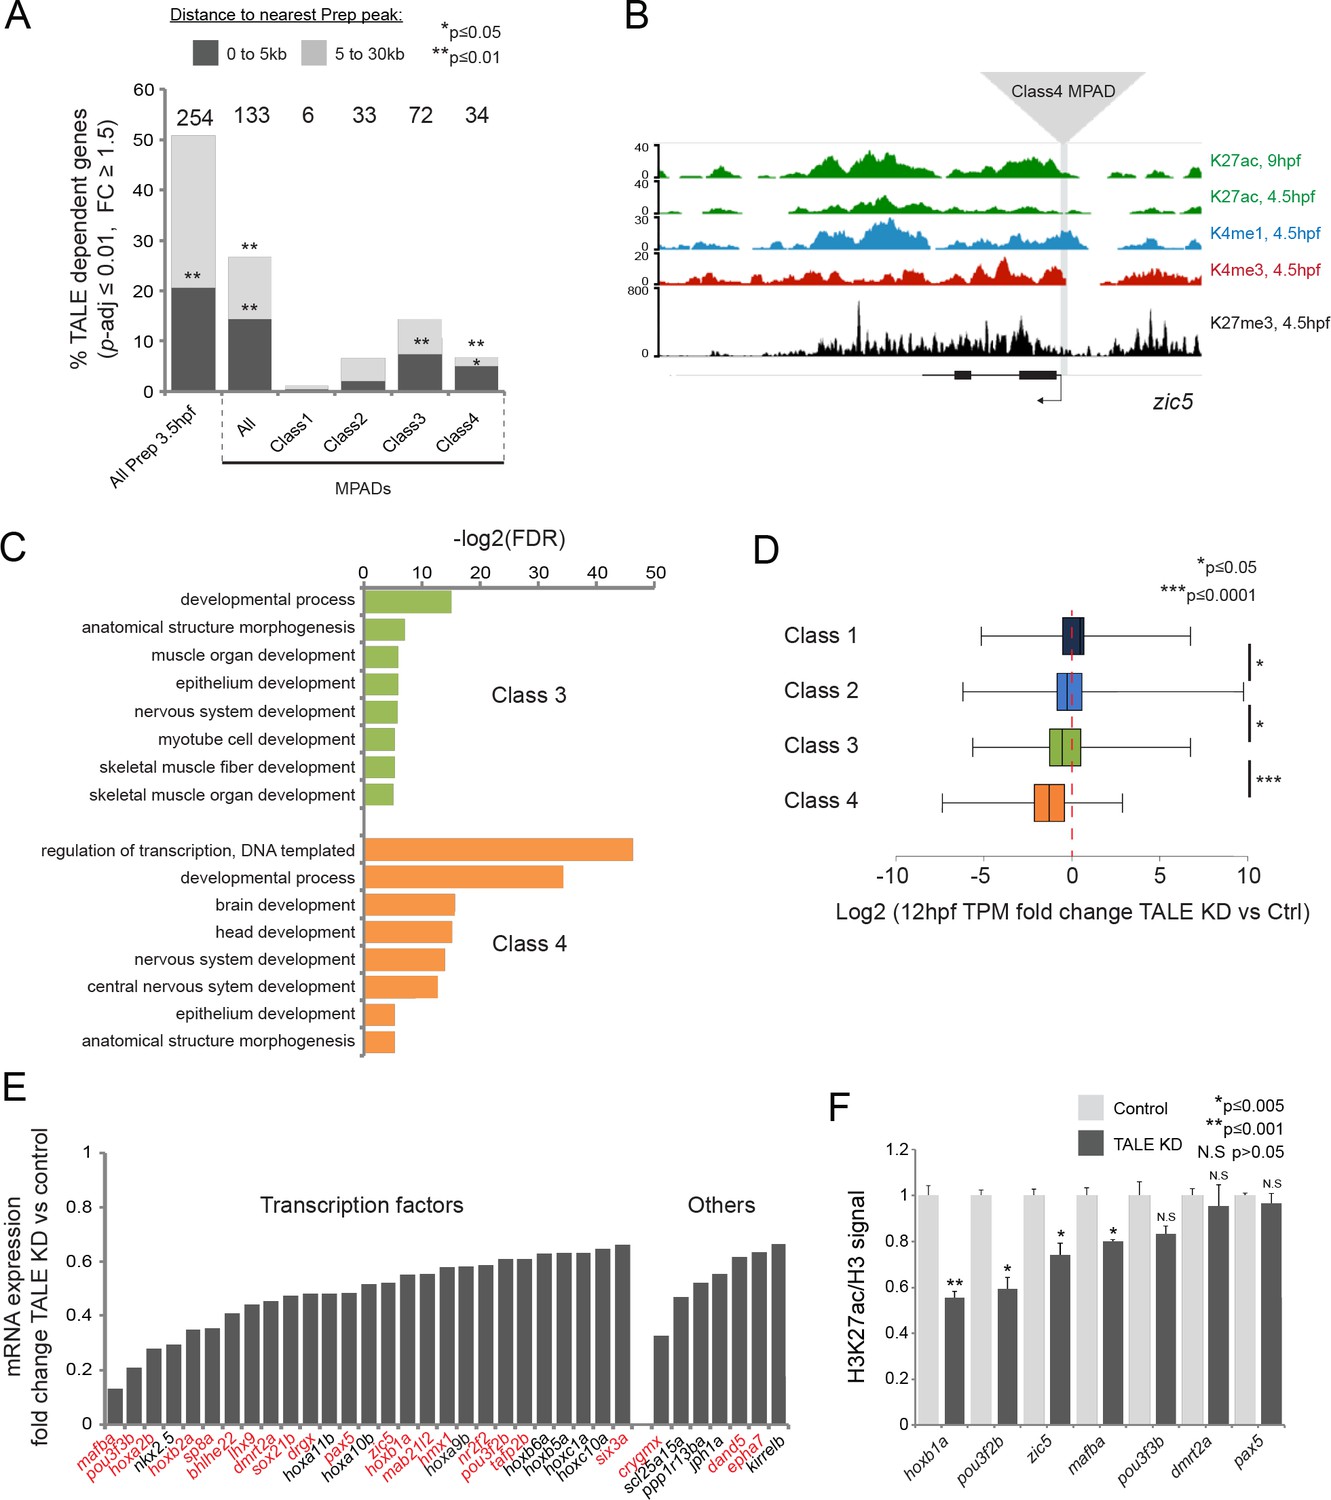
TALE factors control the chromatin state at Class 4 MPADs associated with the TALE GRN.
(A) Localization of TALE KD downregulated genes (p-adj ≤0.01, fold-change ≥1.5) relative to MPADs. The number of TALE-dependent genes within 30 kb of MPADs is indicated above each bar. p-values for enrichment above a random set of genes were calculated using the Pearson correlation test. (B) Representative UCSC browser tracks of the zic5 locus illustrating the position of a Class 4 MPAD and histone modifications in 4.5hpf and 9hpf embryos. (C) DAVID analysis of TALE KD downregulated genes (p-adj ≤0.01, fold-change ≥1.5) near Class 3 and 4 MPADs. Note that only select categories are presented, a full list of GO terms is available in Supplementary file 3. FDR = Benjamini multiple testing False Discovery Rate. (D) Box plots showing change in expression of genes near (≤30 kb) each of the four MPAD classes, as determined by RNA-seq at 12hpf. Data are presented as log2 of mean TPM fold-change between TALE KD and control. Statistical test: pairwise comparison with Kruskal-Wallis followed by Dunn's post-hoc test. (E) Graph showing the TPM expression fold-change in TALE KD vs control 12hpf embryos for all TALE dependent genes (n = 34) near (≤30 kb) Class 4 MPADs. Genes in red control the formation of structures affected by TALE KD (see Supplementary file 4). (F) H3K27ac/Histone H3 signal ratio at Class 4 MPADs as determined by ChIP-qPCR in 9hpf control vs TALE KD embryos. MPADs are labeled with the name of the nearest TALE-dependent gene. Data of three independent biological replicates are presented as mean fold change ± SEM of TALE KD vs control. Statistical test: unpaired t-test.
Figure 7 with 1 supplement
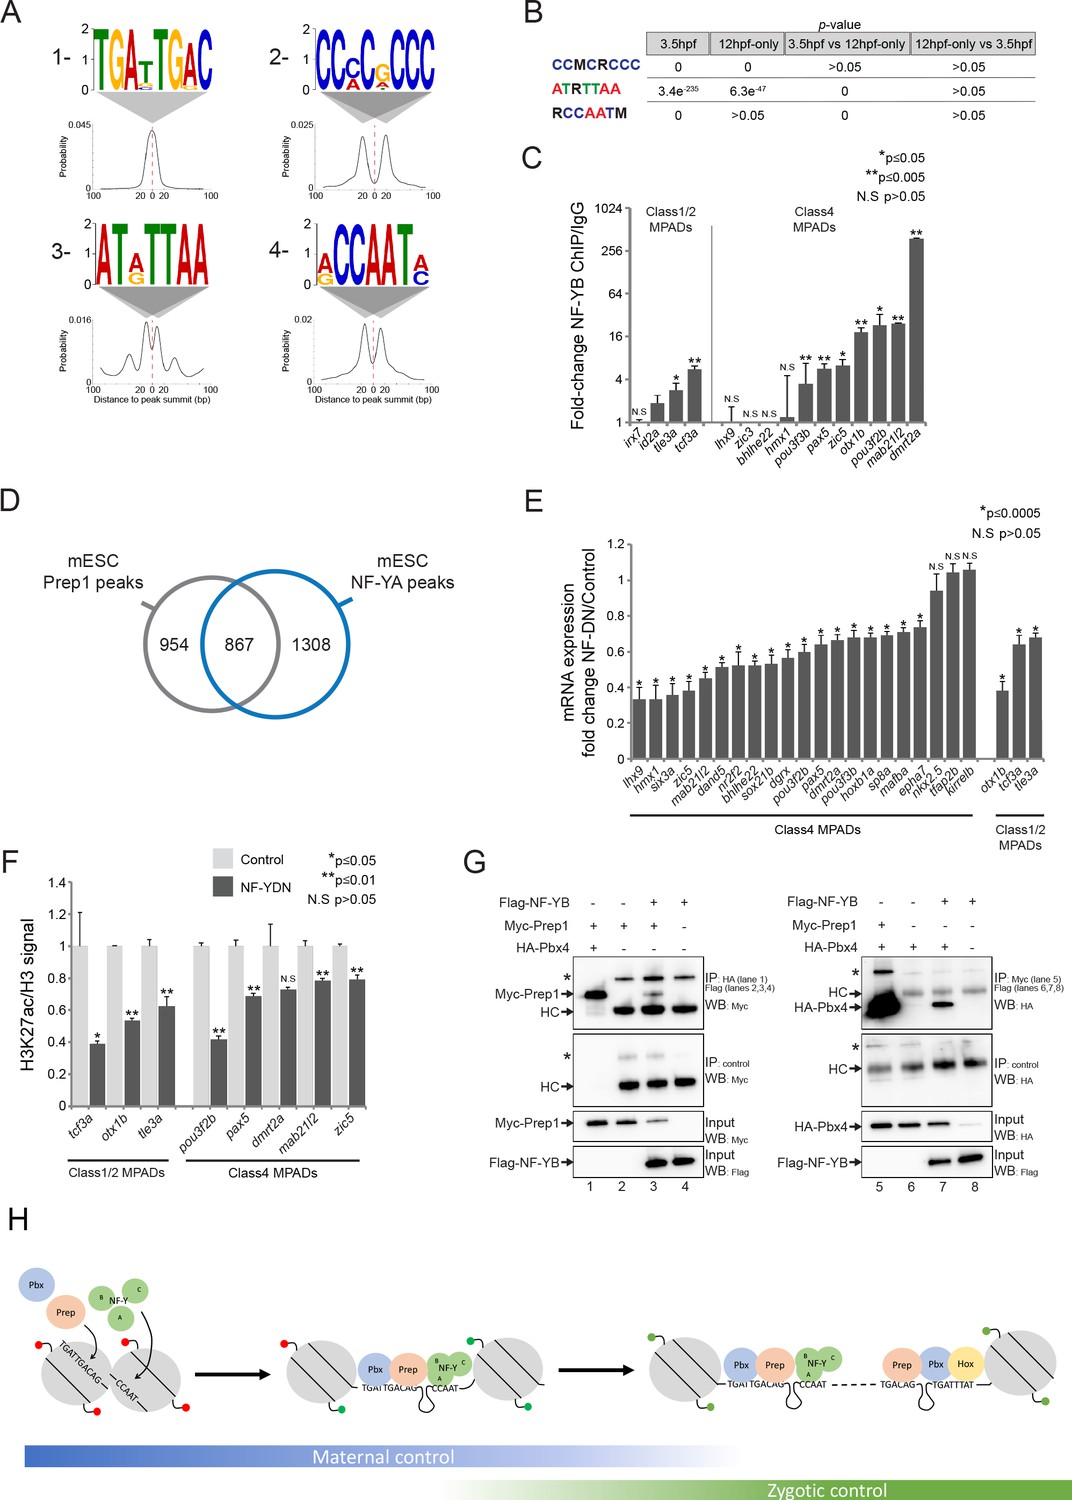
NF-Y proteins regulate TALE GRN expression and form complexes with TALE factors.
See also Figure 7—figure supplement 1. (A) Sequence logo and localization relative to Prep peak summits of motifs identified by DREME at Prep3.5hpf peaks. (B) Enrichment of motifs in Prep3.5hpf and Prep12hpf-only peaks as defined by AME. p-values for enrichment above random occurrence (3.5hpf and 12hpf-only columns) or between two Prep peak populations (3.5hpf vs 12hpf-only and 12hpf-only vs 3.5hpf columns) were calculated using the ranksum test in AME. Motifs are represented in IUPAC code (M = A or C; R = A or G). (C) ChIP-qPCR showing NF-YB binding at CCAAT motif-containing MPADs in 9hpf embryos. MPADs are labeled with the name of the nearest gene. Data of three independent biological replicates are presented as mean fold change ± SEM of NF-YB IP vs control IgG. Statistical test: unpaired t-test. (D) Venn diagram illustrating the overlap of Prep and NF-YB peaks in mESCs. Two peaks are considered to overlap if their summits are within 500 bp. (E) RT-qPCR analysis of gene expression in 12hpf NF-YDN injected embryos. Results are shown as gene expression fold-change in NF-YDN vs control for select TALE-dependent genes. Data of three independent experiments are presented as mean fold change ± SEM of NF-YDN injected vs control embryos. Statistical test = unpaired t-test. (F) H3K27ac/Histone H3 signal ratio at MPADs (labeled with the name of the nearest gene) as determined by ChIP-qPCR in 9hpf control vs NF-YDN injected embryos. Data of three independent biological replicates are presented as mean fold change ± SEM of NF-YDN vs control. Statistical test: unpaired t-test. (G) Co-IP experiments showing interaction of Myc-Prep (left panels) and HA-Pbx4 (right panels) with Flag-NF-YB in transfected HEK293 cells. HC = Ig heavy chain. Asterisks indicate non-specific signal. (H) Model diagram. At blastula stages (left side) TALE binds DECA motifs (TGATTGACAG) near NF-Y motifs (CCAAT). At this stage, most binding sites are occupied by nucleosomes and those associated with developmental control genes are marked by H3K27me3 (red lollipops). Binding of TALE and NF-Y leads to deposition of H3K27ac (green lollipops) and improved accessibility. At segmentation stages (right side), TALE continues to bind DECA motifs near NF-Y motifs, but Prep also binds HEXA motifs (TGACAG) near PBX:HOX motifs (TGATTTAT). Most of the HEXA motifs lack nucleosomes and are found within 40 kb of a DECA/NF-Y site (indicated by dashed connecting line). At this stage, developmental control genes are marked by H3K27ac and are expressed.
Figure 7—figure supplement 1
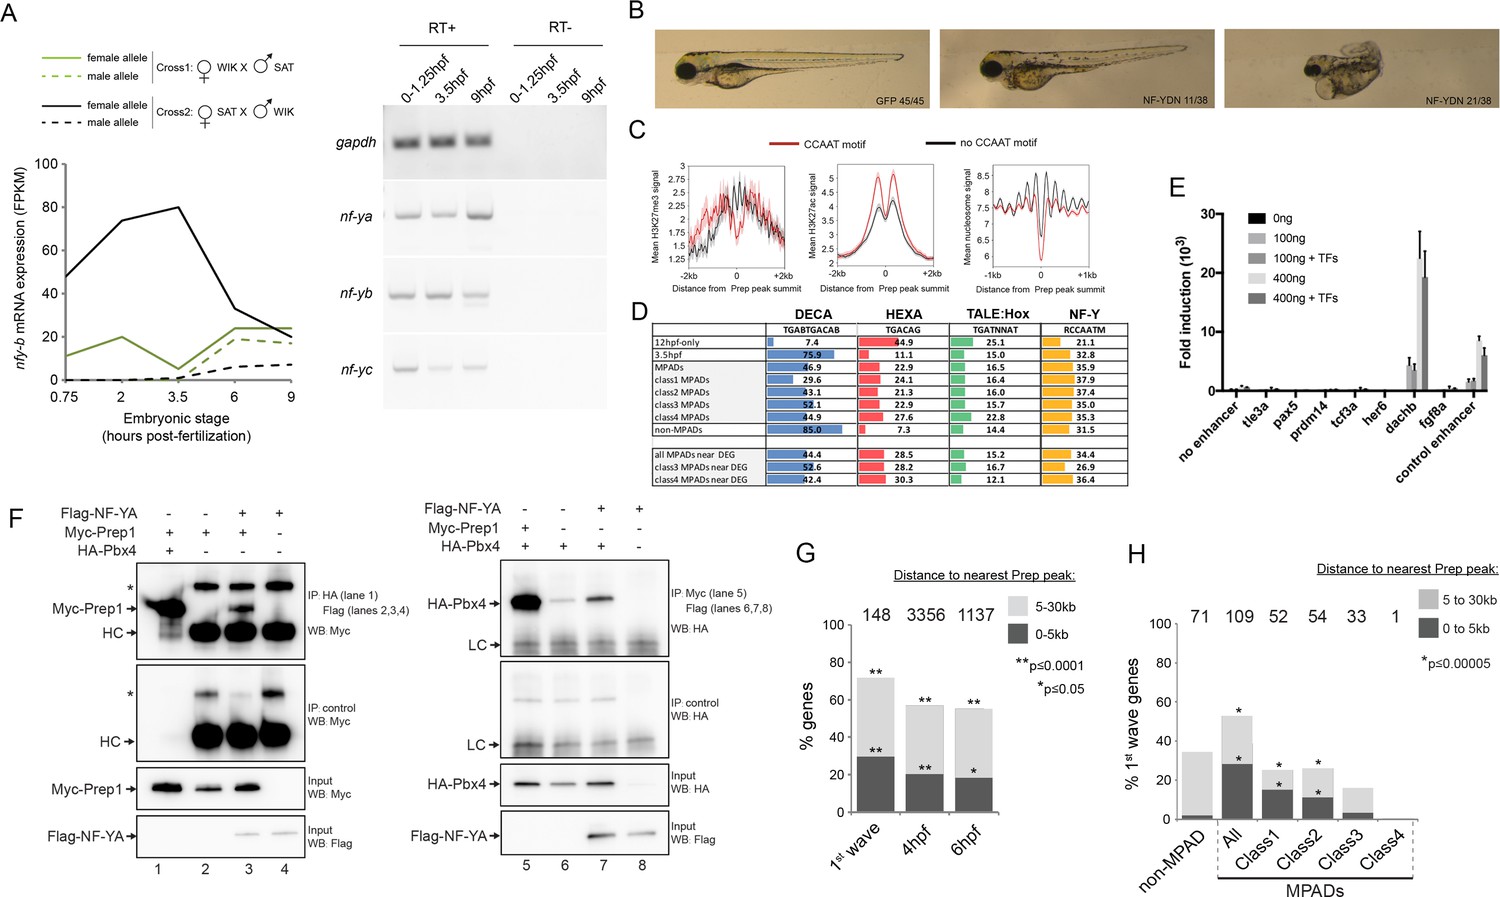
NF-Y TF regulates anterior embryonic structures and interacts with Prep and Pbx.
(A) Left panel: Expression levels of maternal and paternal nf-yb transcripts during early zebrafish embryogenesis (using data from [Harvey et al., 2013]). At 3.5hpf, transcripts from the paternal allele (which requires zygotic activation) are not detected, demonstrating that only maternal nf-yb transcripts are present at this time point. Right panel: RT-PCR analysis on 0–1.25hpf, 3.5hpf and 9hpf zebrafish embryos demonstrating that nf-ya, nf-yb and nf-yc transcripts are maternally deposited. (B) Images of 4 dpf zebrafish following injection with mRNA encoding a NF-Y dominant negative construct (NFY-DN). Control gfp mRNA injected fish show normal wild type morphology, while 21/38 and 11/38 NF-YDN injected fish have severe or mild developmental defects, respectively. Six NF-YDN injected embryos died. Note that some developmental defects are shared with TALE KD injected embryos; for example smaller head, eyes and cardiac edema (see Figure 1—figure supplement 1A). (C) Average H3K27ac, H3K27me3 and nucleosome signal at TALE sites with (red line) or without (black line) adjacent NF-Y (CCAAT) motifs. (D) Distribution of the various binding motifs (DECA, HEXA, TALE:Hox, NF-Y) at 12hpf-only and 3.5hpf Prep-occupied sites (3.5hpf sites are further broken down into MPAD classes), as well as at Prep-occupied sites associated with TALE-GRN genes (DEG = differentially expressed genes identified by RNA-seq after TALE-KD). Numbers in boxes indicate percent of all sequences in each class that contain each of the motifs. (E) Reporter assays in HEK293 cells testing enhancer activity. Each element was tested in triplicate using two concentrations (100 and 400 ng) of reporter plasmid in the presence (+TF) or absence (-TF) of co-transfected TALE and NF-Y factors. Data is presented as mean ± SD fold induction over control plasmid. (F) Co-IP experiments showing interaction of Myc-Prep (left panels) and HA-Pbx4 (right panels) with Flag-NF-YA in transfected HEK293 cells. HC = Ig heavy chain. Asterisks indicate non-specific signal. (G) Localization of early zygotic genes (Lee et al., 2013) relative to Prep ChIP-seq peak summits. The number of genes within 30 kb of Prep binding sites is indicated above each bar. p-values for enrichment above a random set of genes were calculated using the Pearson correlation test. (H) Localization of first-wave zygotic genes relative to MPADs and non-MPADs. Numbers above bars indicate the number of genes within 30 kb of each type of Prep binding site. p-values for enrichment above a random set of genes were calculated using the Pearson correlation test.
Tables
Key resources table
| Reagent type or resources | Designation | Source or reference | Identifier | Additional information |
|---|---|---|---|---|
| Antibody | Rabbit polyclonal anti-Prep | (Choe et al., 2014) | N/A | |
| Antibody | Rabbit polyclonal anti-Pbx4 | (Choe et al., 2014) | N/A | |
| Antibody | Rabbit polyclonal anti-NF-YB | Santa-Cruz | sc13045 | RRID:AB_2152107 |
| Antibody | Rabbit polyclonal anti-H3K27ac | Abcam | ab4729 | RRID:AB_2118291 |
| Antibody | Rabbit polyclonal anti-Histone H3 | Abcam | ab1791 | RRID:AB_302613 |
| Antibody | Mouse monoclonal anti-Myc | Roche | 11667149001 | RRID:AB_390912 |
| Antibody | Mouse monoclonal anti-Flag | Sigma-Aldrich | F3165 | RRID:AB_259529 |
| Antibody | Rabbit polyclonal anti-HA | Abcam | ab9110 | RRID:AB_307019 |
| Antibody | Rabbit polyclonal anti-IgG control | Abcam | ab46540 | RRID:AB_2614925 |
| Antibody | Mouse polyclonal anti-IgG control | Millipore | 12-371b | RRID:AB_2617156 |
| Antibody | Anti-mouse IgG, HRP-linked secondary antibody | GE healthcare | LNA91V/AG | |
| Antibody | Anti-mouse IgG, Alexa Fluor 488 conjugated secondary antibody | Molecular Probes | A11001 | RRID:AB_2534069 |
| Antibody | Mouse monoclonal 3A10 | Developmental Studies Hybridoma bank | 531874 | RRID:AB_531874 |
| Antibody | Anti-rabbit IgG, HRP-linked secondary antibody | Jackson Laboratories | 211-032-171 | RRID:AB_2339149 |
| Antibody | Lipofectamine 2000 | Invitrogen | 52887 | |
| Strain, strain background (E. coli) | Subcloning Efficiency DH5α Competent Cells | ThermoFisher Scientific | 18265017 | |
| Chemical compound, drug | 4-Thiouridine | Santa-Cruz | sc204628 | |
| Chemical compound, drug | EZ-Link HPDP-Biotin | Pierce | 21341 | |
| peptide, recombinant protein | Dynabeads MyOne Streptavidin C1 | ThermoFisher Scientific | 65001 | |
| peptide, recombinant protein | Protein-A Dynabeads | ThermoFisher Scientific | 10001D | |
| Commercial assay or kit | TruSeq ChIP Library Preparation Kit | Illumina | IP-202–1012 | |
| Commercial assay or kit | TruSeq Stranded mRNA LT sample prep Kit | Illumina | RS-122–2101 | |
| Commercial assay or kit | mMESSAGE mMACHINE SP6 Transcription Kit | ThermoFisher Scientific | AM1340 | |
| Commercial assay or kit | Q5 Site-Directed Mutagenesis Kit | New England Biolabs | E0554S | |
| Other | Prep ChIP-seq and Inputs in 3.5hpf zebrafish embryos | This paper | GEO | Deposited data |
| Other | Prep ChIP-seq and Inputs in 12hpf zebrafish embryos | This paper | GEO | Deposited data |
| Other | TALE knock-down and control RNA-seq in 6hpf zebrafish embryos | This paper | GSE102662 | Deposited data |
| Other | TALE knock-down and control RNA-seq in 12hpf zebrafish embryos | This paper | GSE102662 | Deposited data |
| Other | Prep1 ChIP-seq and Inputs in mESCs, WIG files | (Laurent et al., 2015) | GSM1545025 and GSM1545026 | Deposited data |
| Other | ATAC-seq in 4hpf zebrafish embryos, fastq files | (Kaaij et al., 2016) | SRR2747531 | Deposited data |
| Other | H3K4me1 ChIP-seq in 4.5hpf zebrafish embryos, WIG files | (Bogdanovic et al., 2012) | GSM915193 | Deposited data |
| Other | H3K4me3 ChIP-seq in 4.5hpf zebrafish embryos, WIG files | (Bogdanovic et al., 2012) | GSM915189 | Deposited data |
| Other | H3K27ac ChIP-seq in 4.5hpf zebrafish embryos, WIG files | (Bogdanovic et al., 2012) | GSM915197 | Deposited data |
| Other | H3K27ac ChIP-seq in 9hpf zebrafish embryos, WIG files | (Bogdanovic et al., 2012) | GSM915198 | Deposited data |
| Other | H3K27ac ChIP-seq in 24hpf zebrafish embryos, WIG files | (Bogdanovic et al., 2012) | GSM915199 | Deposited data |
| Other | H3K27me3 ChIP-seq in 4.5hpf zebrafish embryos, WIG files | (Zhang et al., 2014) | GSM1081557 | Deposited data |
| Other | MNase-seq in 4.5hpf zebrafish embryos, WIG files | (Zhang et al., 2014) | GSM1081554 | Deposited data |
| Other | RNA-Pol2 ChIP-seq in 4.5hpf zebrafish embryos, WIG files | (Zhang et al., 2014) | GSM1081560 | Deposited data |
| Other | MeDIP-seq (Methyl CpG) in 4.5hpf zebrafish embryos, BedGraph files | (Lee et al., 2015) | GSM1274386 | Deposited data |
| Other | NF-YA ChIP-seq in mESCs | (Oldfield et al., 2014) | GSM1370111 | Deposited data |
| Other | H3K4me1 in mESCs, BigWig files | ENCODE www.encodeproject.org | GSM1000121 | Deposited data |
| Other | H3K4me3 in mESCs, BigWig files | ENCODE www.encodeproject.org | GSM1000124 | Deposited data |
| Other | H3K27ac in mESCs, BigWig files | ENCODE www.encodeproject.org | GSM1000126 | Deposited data |
| Other | H3K27me3 in mESCs, BigWig files | ENCODE www.encodeproject.org | GSM1000089 | Deposited data |
| Other | DNase-seq in mESCs, BigWig files | ENCODE www.encodeproject.org | GSM1014154 | Deposited data |
| Other | MeDIP-seq (Methyl CpG) in mESCs | (C.-C. Chen et al., 2013) | GSM859494 | Deposited data |
| Cell line (Human) | HEK-293T cells | ATCC | ATCC CRL-3216 | RRID:CVCL_0063 |
| Strain, strain background (Zebrafish) | strain EKW | Ekkwill breeders | http://www.ekkwill.com/ | |
| Other | Oligonucleotides | See Supplementary file 5 | ||
| Recombinant DNA | 6xMyc-Prep1.1 in PCS2 + MT | (Choe et al., 2002) | N/A | |
| Recombinant DNA | HA-Pbx4 in PCS2+ | (Choe et al., 2009) | N/A | |
| Recombinant DNA | Flag-NF-YA in PCS2+ | This Paper | N/A | |
| Recombinant DNA | Flag-NF-YB in PCS2+ | This Paper | N/A | |
| Recombinant DNA | NF-YDN in PCS2+ | This paper | N/A | |
| Recombinant DNA | pGL3-Promoter vector | Promega | E1761 | |
| Recombinant DNA | Tle3 element in pGL3 Promoter vector | This paper | N/A | |
| Recombinant DNA | Pax5 element in pGL3 Promoter vector | This paper | N/A | |
| Recombinant DNA | Prdm14 element in pGL3 Promoter vector | This paper | N/A | |
| Recombinant DNA | Tcf3a element in pGL3 Promoter vector | This paper | N/A | |
| Recombinant DNA | Her6 element in pGL3 Promoter vector | This paper | N/A | |
| Recombinant DNA | Dachb element in pGL3 Promoter vector | This paper | N/A | |
| Recombinant DNA | Fgf8 element in pGL3 Promoter vector | This paper | N/A | |
| Recombinant DNA | pGL3-Control vector | Promega | E1741 | |
| Software, algorithm | FastQC | Babraham Institute | https://www.bioinformatics.babraham.ac.uk/projects/fastqc/ | RRID:SCR_014583 |
| Software, algorithm | FastQ Screen | Babraham Institute | https://www.bioinformatics.babraham.ac.uk/projects/fastq_screen/ | RRID:SCR_000141 |
| Software, algorithm | Trimmomatic 0.32 | (Bolger et al., 2014) | https://github.com/timflutre/trimmomatic | RRID:SCR_011848 |
| Software, algorithm | Bowtie 2.2.3 | (Langmead and Salzberg, 2012) | https://github.com/BenLangmead/bowtie2 | RRID:SCR_005476 |
| Software, algorithm | SAMtools 0.1.19 | (Li et al., 2009) | https://github.com/samtools/samtools | RRID:SCR_002105 |
| Software, algorithm | MACS 2.1.0.20140616 | (Zhang et al., 2008) | https://github.com/taoliu/MACS | |
| Software, algorithm | RSEM 1.2.28 in the Dolphin interface of University of Massachuetts Worcester Biocore | (Li and Dewey, 2011) | http://www.umassmed.edu/biocore/introducing-dolphin/ | RRID:SCR_013027 |
| Software, algorithm | DESeq2 in the Dolphin interface of University of Massachuetts Worcester Biocore | (Anders and Huber, 2010) | http://www.umassmed.edu/biocore/introducing-dolphin/ | RRID:SCR_015687 |
| Software, algorithm | Galaxy web interface | (Goecks et al., 2010) | https://usegalaxy.org | RRID:SCR_006281 |
| Software, algorithm | BedTools in galaxy | (Quinlan and Hall, 2010) | https://usegalaxy.org | RRID:SCR_006646 |
| Software, algorithm | DeepTools in galaxy | (Ramírez et al., 2014) | https://usegalaxy.org | |
| Software, algorithm | MEME-ChIP | (Machanick and Bailey, 2011; Bailey et al., 2009) | http://meme-suite.org/tools/meme-chip | RRID:SCR_001783 |
| Software, algorithm | DAVID 6.8 | (Huang et al., 2009b, 2009a) | https://david.ncifcrf.gov/ | RRID:SCR_001881 |
| Software, algorithm | GREAT 3.0.0 | (McLean et al., 2010; Hiller et al., 2013) | http://bejerano.stanford.edu/great/public/html | RRID:SCR_005807 |
| Other | anti-Prep1.1 morpholino oligonucleotide | Gene Tools, LLC | N/A | |
| Other | 5'-TGGACACAGACTGGGCAG CCATCAT-3'Fluorescein | (Deflorian et al., 2004) | ||
| Other | anti-Pbx2 morpholino oligonucleotide | Gene Tools, LLC | N/A | |
| Other | 5'-CCGTTGCCTGTGATG GGCTGCTGCG-3' | (Erickson et al., 2007) | ||
| Other | anti-Pbx4 morpholino oligonucleotide | Gene Tools, LLC | N/A | |
| Other | 5'-AATACTTTTGAGCCGA ATCTCTCCG-3' | (Erickson et al., 2007) |
Additional files
-
Source code 1
moth.py (Motif Occurrence for TALE and Hox factors) file.
This module identifies transcription factor motifs (for TALE, Hox and NF-Y) in input sequences. The input sequences are provided as Figure 3—source data 1.
- https://doi.org/10.7554/eLife.36144.016
-
Source code 2
randCoord.py file.
This module generates a set of random chromosome intervals of specified length from an input genome sequence. The input sequence used was the full zv11 zebrafish genome sequence.
- https://doi.org/10.7554/eLife.36144.017
-
Supplementary file 1
ChIP-seq statistics.
Related to Figure 2. Prep ChIP-seq experiments were performed on 3.5hpf and 12hpf zebrafish embryos. Biological replicates (n = 2) for each condition show a high degree of reproducibility as shown by the percent of peaks found in both replicates (replicate overlap). Peaks with Fold Enrichment (FE) ≥ 10 were used for subsequent analysis.
- https://doi.org/10.7554/eLife.36144.018
-
Supplementary file 2
GO terms associated with Prep MPAD populations.
Related to Figure 4D. GREAT analysis (association rule = single nearest gene within 30 kb) was used to identify GO-terms for each MPAD population. Significant GO terms (FDR ≤ 0.05; -log2FDR ≤ 4.32) associated with any MPAD population were then merged using the ‘join two files’ tool in Galaxy to produce a list of 231 GO-terms associated with a –log2 (FDR) value for each MPAD population. Finally, GO terms and their corresponding –log2 (FDR) values were grouped (1-8) based on their association with the various MPAD populations. Note that Class 4 MPADs are enriched near genes involved in embryonic development, including processes related to the TALE loss-of-function phenotype (nervous system, eye and heart development; Group 5). N.S. = not significant.
- https://doi.org/10.7554/eLife.36144.019
-
Supplementary file 3
GO-term enrichment analysis.
Related to Figures 1, 2 and 6, Figure 4—figure supplement 2 and Figure 5—figure supplement 1. Figures 1D, 2E and 6C, Figure 4—figure supplement 2C and Figure 5—figure supplement 1D show only a representative set of GO-terms for each analysis. This table lists all GO-terms identified by each GREAT or DAVID analysis in this study. Details of each analysis can be found in the first tab of the table.
- https://doi.org/10.7554/eLife.36144.020
-
Supplementary file 4
Information on TALE GRN genes associated with Class 4 MPADs.
Related to Figure 6.
- https://doi.org/10.7554/eLife.36144.021
-
Supplementary file 5
Primer sequences used in this study.
- https://doi.org/10.7554/eLife.36144.022
-
Transparent reporting form
- https://doi.org/10.7554/eLife.36144.023
Download links
A two-part list of links to download the article, or parts of the article, in various formats.
Downloads (link to download the article as PDF)
Open citations (links to open the citations from this article in various online reference manager services)
Cite this article (links to download the citations from this article in formats compatible with various reference manager tools)
TALE factors use two distinct functional modes to control an essential zebrafish gene expression program
eLife 7:e36144.
https://doi.org/10.7554/eLife.36144


