Insights into the ubiquitin transfer cascade catalyzed by the Legionella effector SidC
- Cornell University, United States
Figures
Figure 1
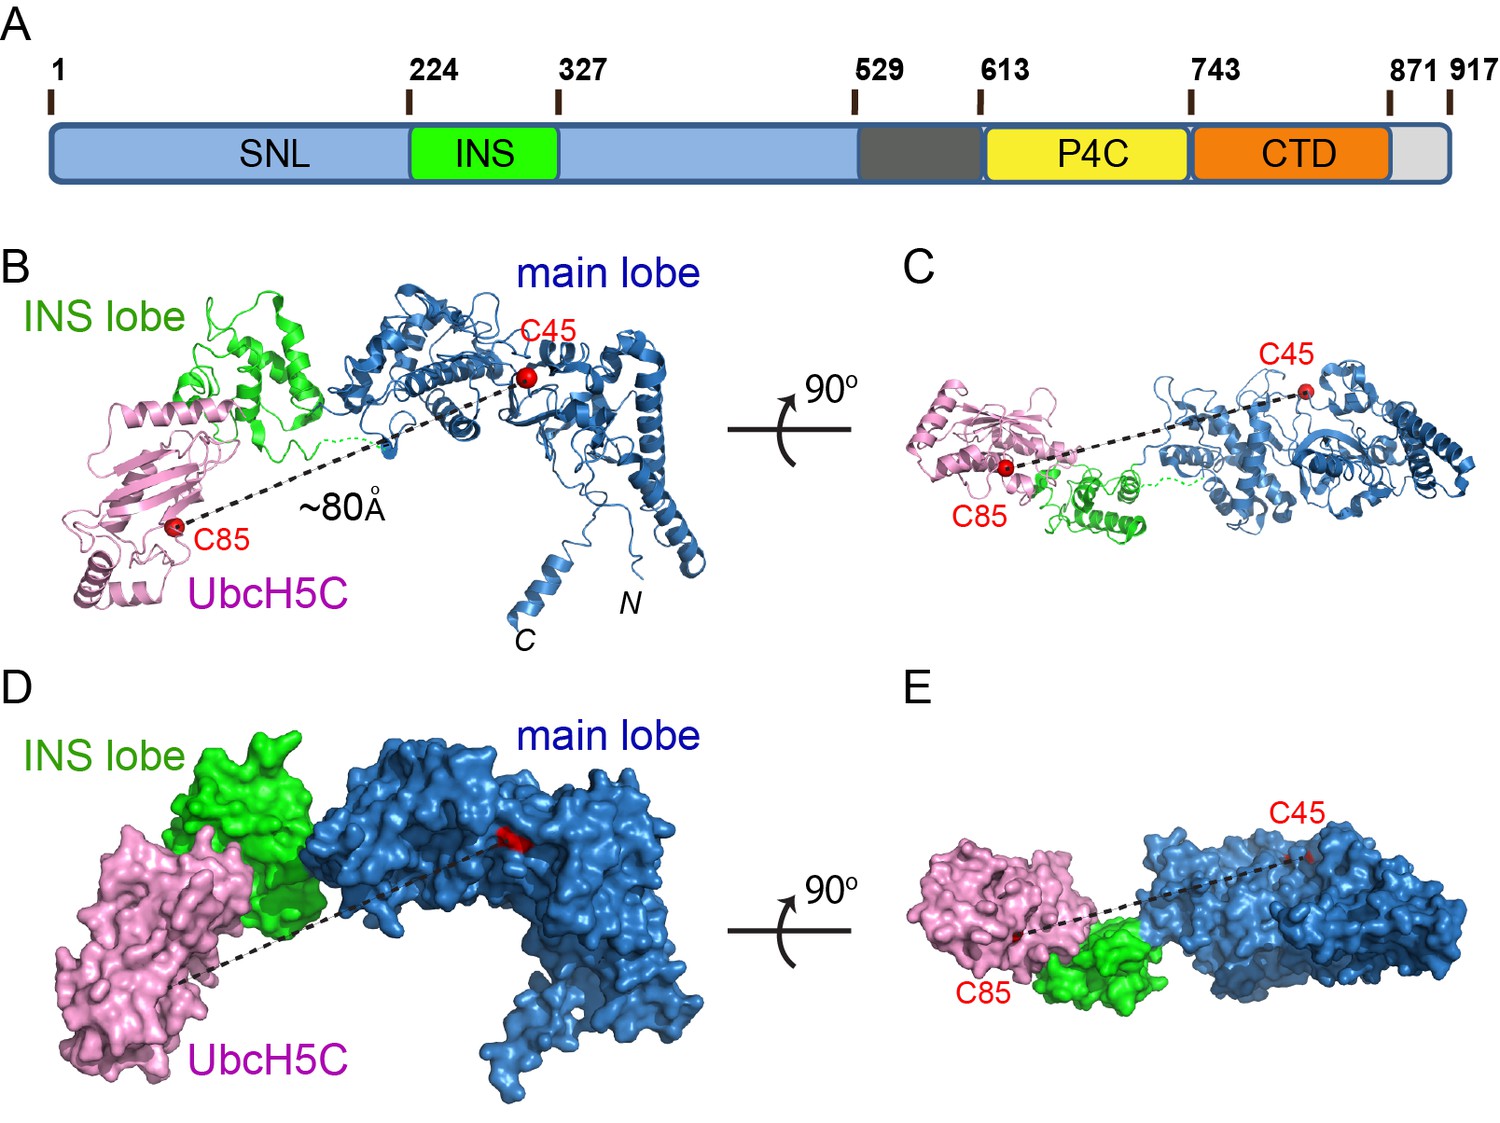
Crystal structure of the SdcA-UbcH5C binary complex.
(A) Domain architecture of a member of the SidC family of Ub E3 ligase. (SNL: SidC N-terminal Ub E3 ligase; INS: insertion lobe; P4C: PI(4)P binding of SidC; CTD: C-terminal domain.) (B–C) Two orthogonal views of a ribbon diagram of the SNL domain of SdcA (blue: main lobe; green: INS lobe domain) in complex with UbcH5C (pink). The catalytic cysteines of both SdcA (C45) and UbcH5C are shown as red spheres. Note that the distance between the two cysteines is about ~80 Å. (D–E) Two orthogonal views of the SdcA-UbcH5C complex presented in surface.
Figure 2
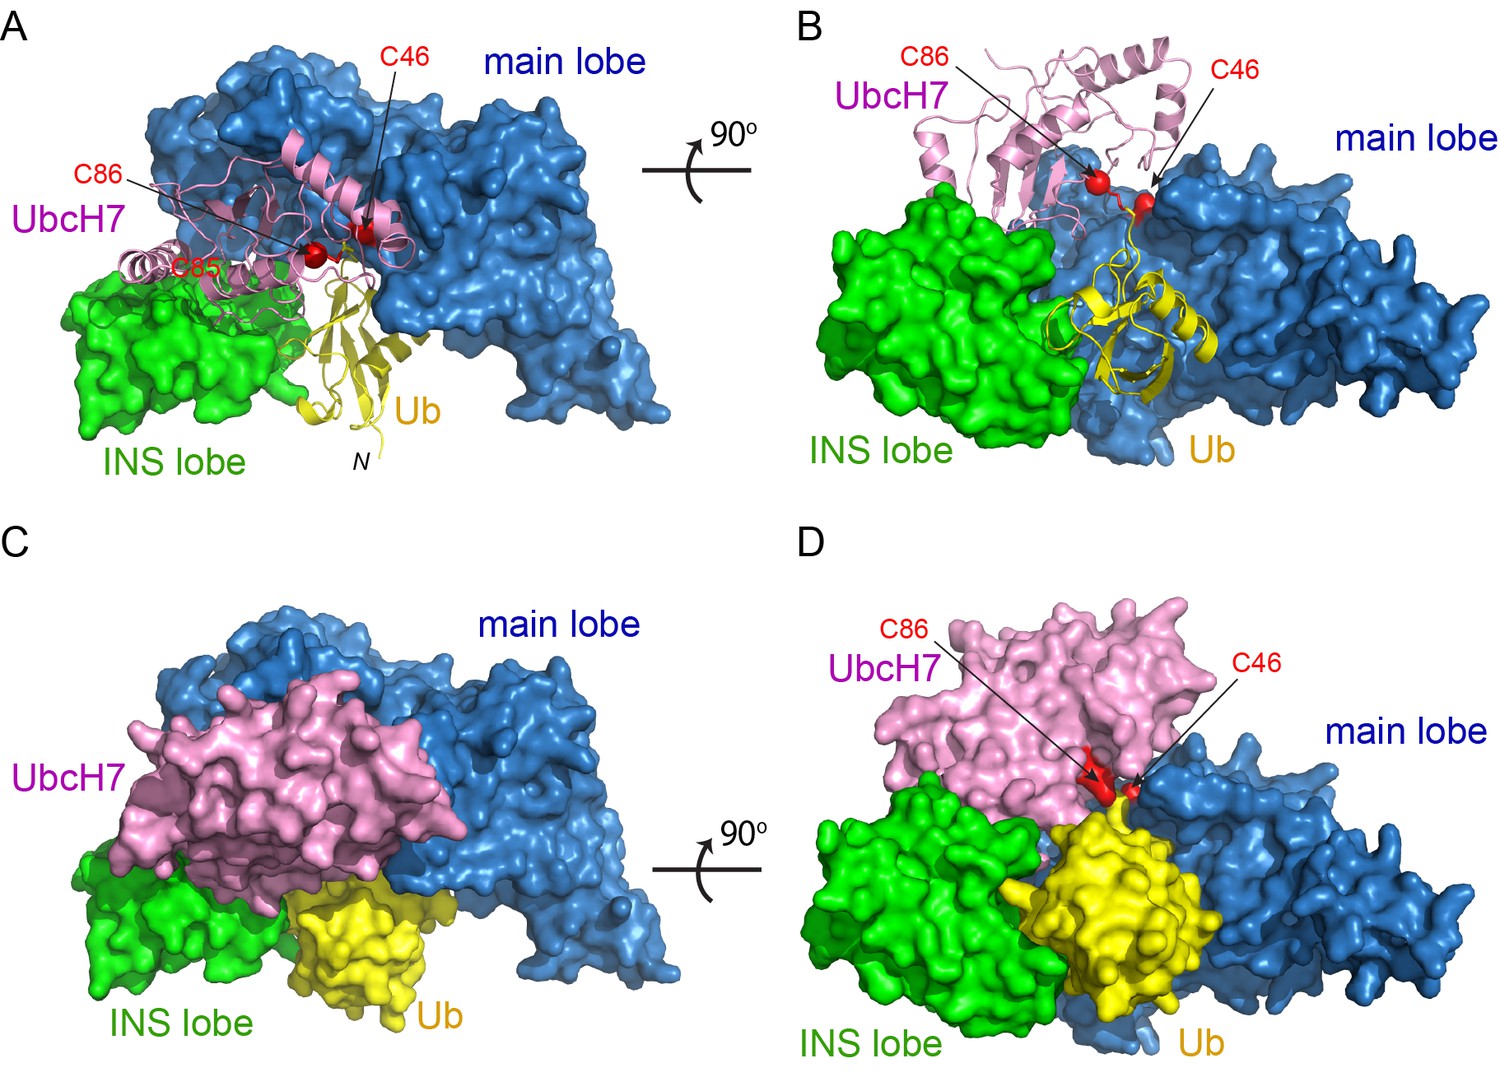
Crystal structure of the SidC-UbcH7~Ub ternary complex.
(A–B) Two orthogonal views of the SidC-UbcH7~Ub complex structure. The SNL domain of SidC is shown in surface with the main lobe colored in blue and INS lobe in green. UbcH7 (pink) and the donor Ub (yellow) are shown in ribbon. The catalytic cysteines of both SidC (C46) and UbcH7 (C86) are shown in red. (C–D) Two orthogonal views of the SidC-UbcH7~Ub ternary complex in surface representation.
Figure 3 with 1 supplement
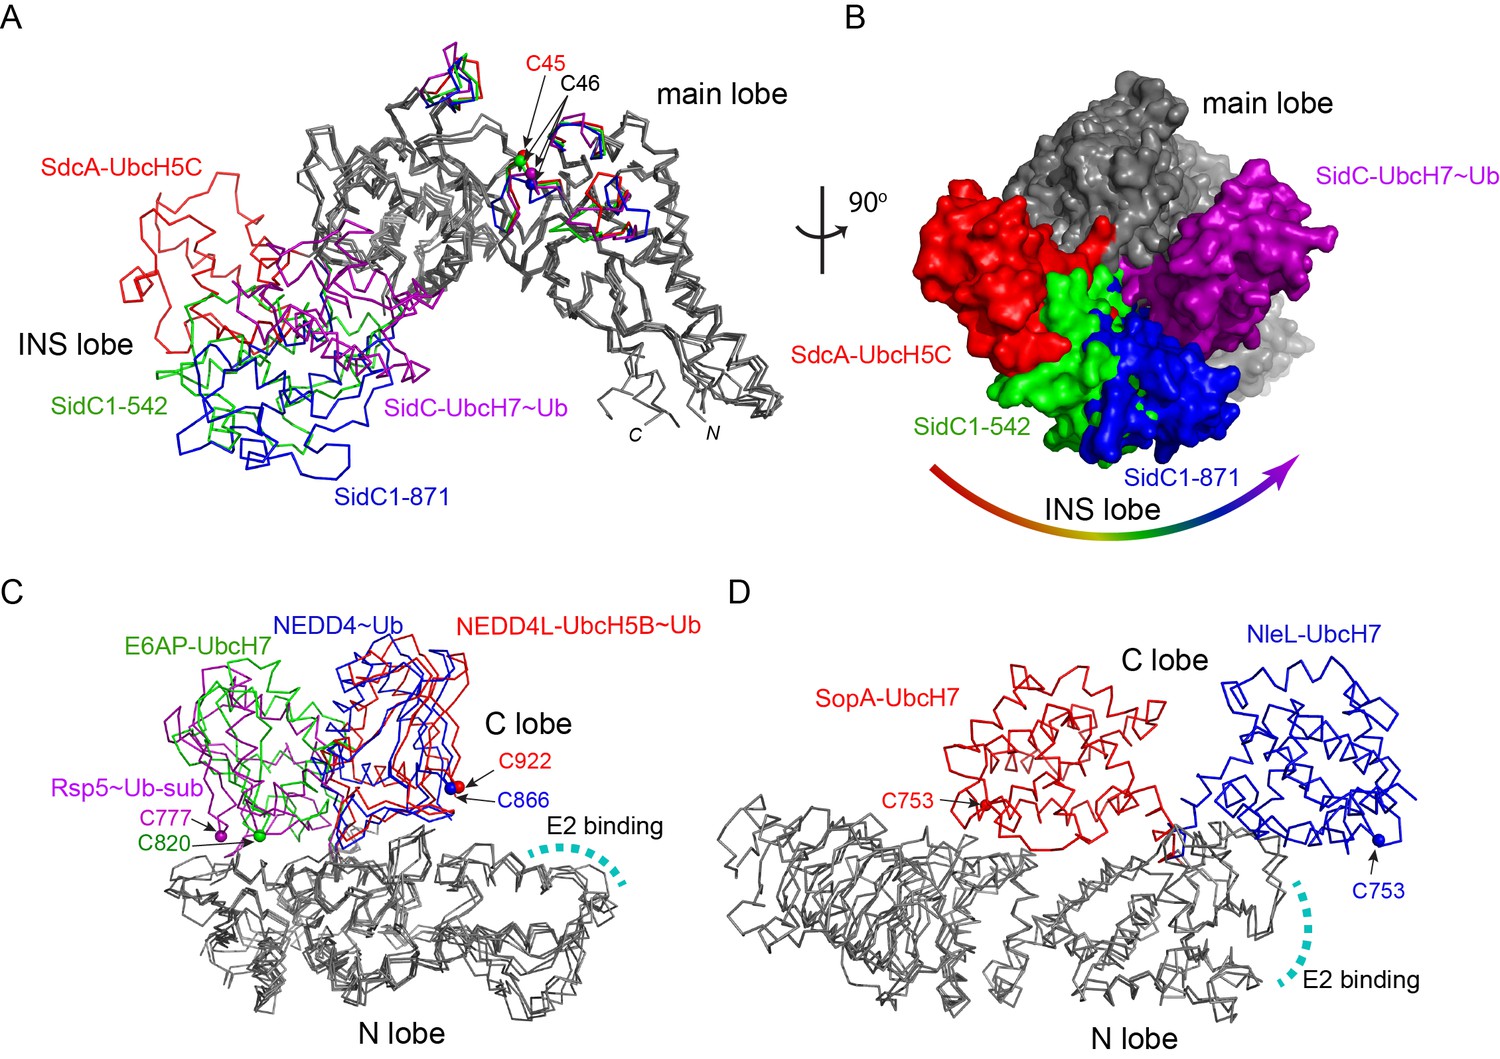
Conformational flexibility of the E2-binding INS lobe.
(A) Overlay of structures of the SNL domains of SidC/SdcA. Four structures were superimposed based on the Cα atoms of the main lobe. The INS lobes adopt a wide range of conformations relative to the main lobe and are colored in red (SdcA-UbcH5C complex), green (SidC 1–542, PDB ID 4TRG), blue (SidC 1–871, PDB ID 4ZUZ), and purple (SidC-UbcH7~Ub), respectively. (B) An orthogonal view of the four superimposed structures shown in surface. The INS lobes are colored with the same scheme as in (A). (C) Structural overlay of HECT domains with their N-lobes superimposed. The C-lobes are colored red (NEDD4L-UbcH5B~Ub, PDB 3JW0), blue (NEDD4~Ub, PDB 4BBN), green (E6AP-UbcH7, PDB 1D5F), and purple (Rsp5~Ub sub, PDB 4LCD), respectively. The E2 binding site is indicated by a curved dashed line. (D) Structural overlay of two HECT-like bacterial E3s. The E2-binding N-lobe is superimposed. The mobile C-lobe is colored in red (SopA-UbcH7, PDB 3SY2) and blue (NleL-UbcH7, PDB 3SQV), respectively.
Figure 3—figure supplement 1
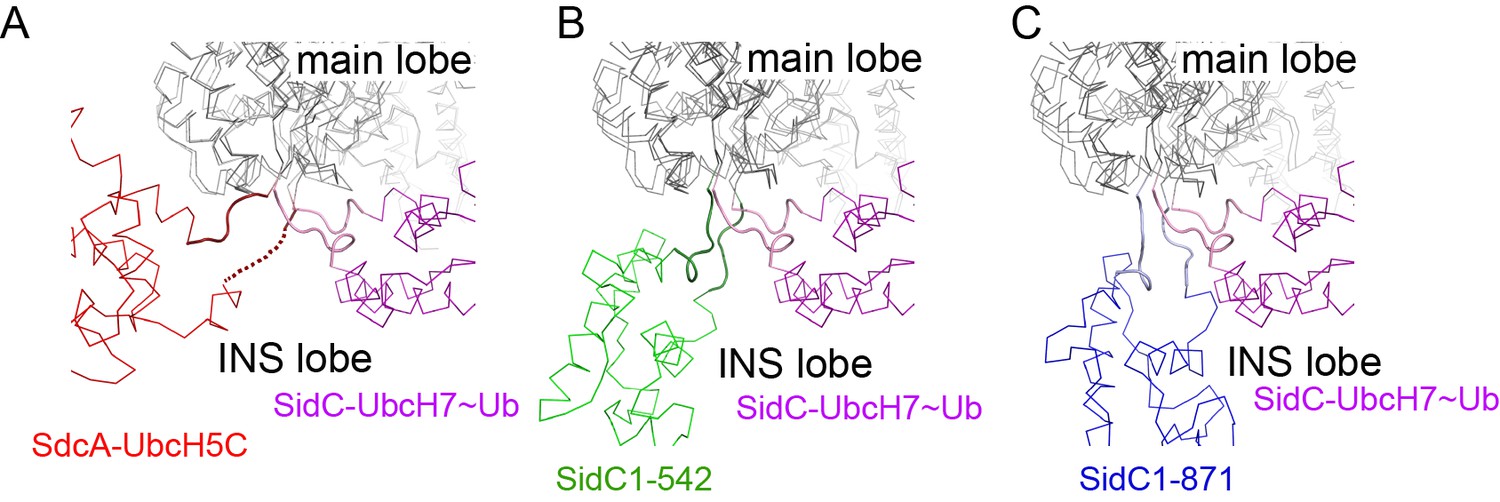
A zoomed-in view of the flexible connecting loop region between the main lobe and INS lobe.
(A) A comparison of the connecting loops between the INS and main lobe in the SdcA-UbcH5C binary complex and the SidC-UbcH7~Ub ternary complex. (B) A comparison of the same connecting loops in SidC542 apo enzyme and the SidC-UbcH7~Ub ternary complex. (C) A comparison of the same connecting loops in the SidC871 apo enzyme and the SidC-UbcH7~Ub ternary complex. Note: In all three panels, the SidC-UbcH7~Ub ternary complex has the same orientation. The other structure was superimposed onto the SidC-UbcH7~Ub ternary complex structure based on the Cα atoms of the main lobe.
Figure 4 with 3 supplements
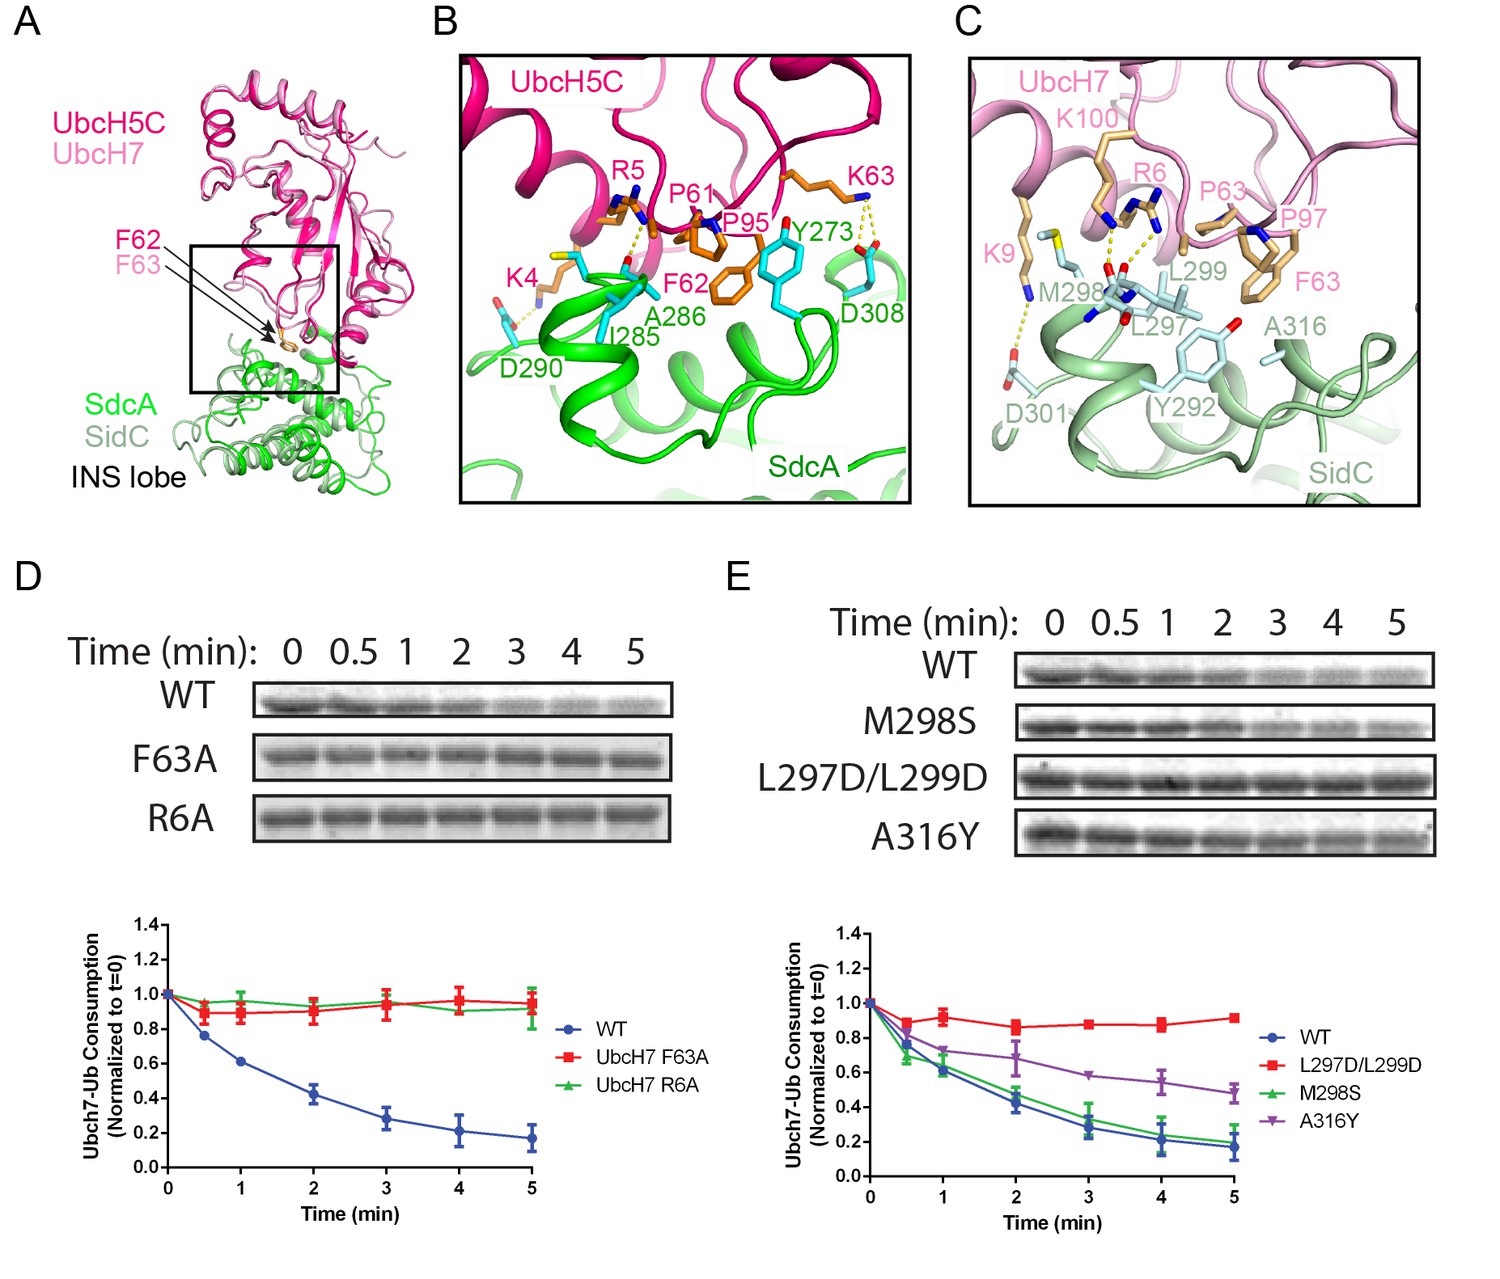
E2 recognition by the INS lobe of SidC/SdcA.
(A) Structural superposition of the INS lobe of SdcA (green) and its bound E2 UbcH5C (pink) with the INS lobe of SidC (light green) and its bound UbcH7 (light pink). (B) Zoomed-in view of SdcA/UbcH5C interface. (C) Detailed interactions at the interface of SidC/UbcH7. (D) Single turnover activity assays of UbcH7 mutants at the SidC/UbcH7 interface. Top panel: representative SDS-gel of UbcH7~Ub complex remaining at the indicated time points. Bottom panel: Quantified intensity of UbcH7~Ub at the indicated time points. The error bar represents the standard deviation of three independent experiments. (E) Single turnover activity assays of SidC mutants at its E2 binding interface.
Figure 4—figure supplement 1
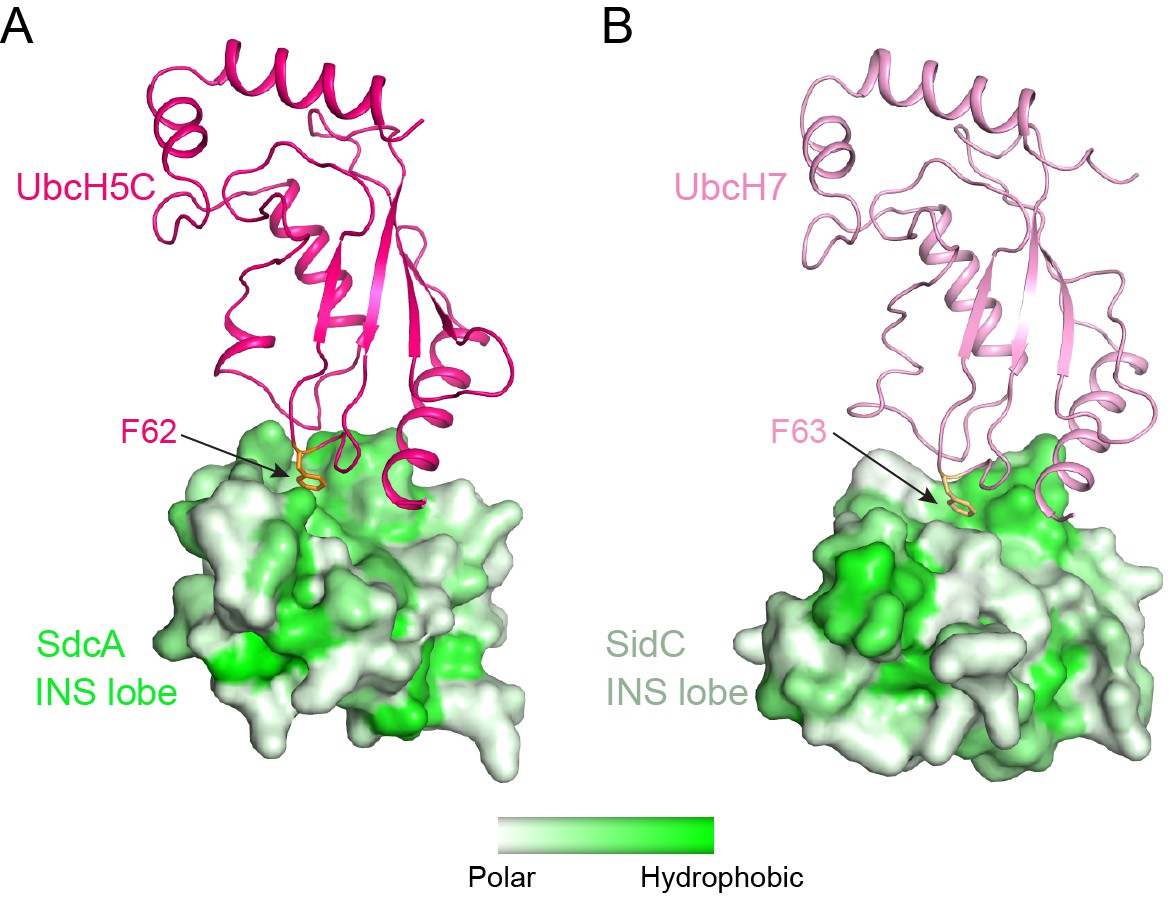
Surface hydrophobicity analysis of the INS lobes.
(A) The interaction between UbcH5C (shown in pink ribbon) and the INS lobe (shown in surface) of SdcA. The INS lobe is colored based on the hydrophobicity of surface residues with the most polar residues in white and most hydrophobic residues in green. Note that the canonical E3-interacting F62 of UbcH5C is accommodated in a hydrophobic pocket on the INS domain. (B) The interaction between UbcH7 (shown in light pink ribbon) and the INS lobe (shown in surface) of SidC.
Figure 4—figure supplement 2
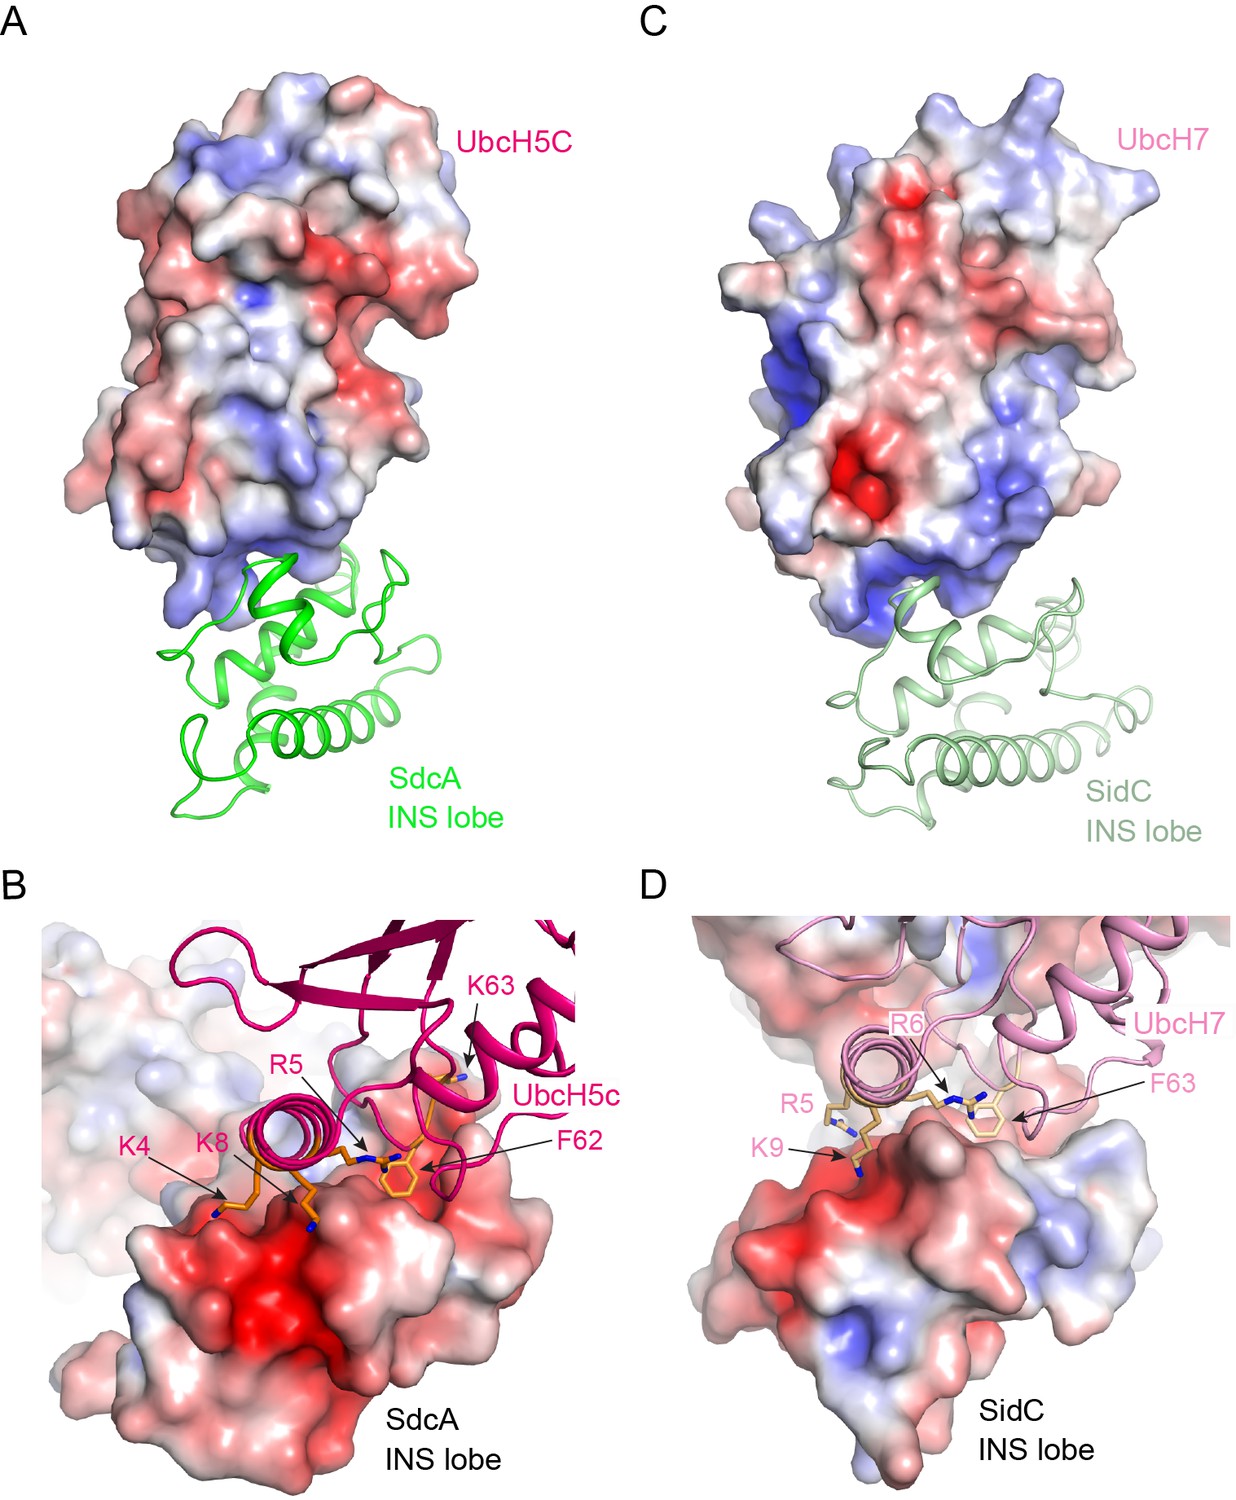
Analysis of the surface electrostatic potential at the interface between the E2 and the INS lobe.
(A) The interaction between UbcH5C (shown in surface) and the INS lobe (shown in ribbon) of SdcA. Note that the surface area on UbcH5C mediated the binding with the SdcA INS lobe is positively charged. (B) Same interface as shown in (A). UbcH5C is shown in ribbon, while the INS lobe is shown in surface. Note that the E2-binding area is highly negatively charged. (C) and (D) Surface and ribbon representations of the interface between UbcH7 and the INS lobe of SidC. Note that similar to SdcA-UbcH5C, the interface on UbcH7 is positively charged (C) while the interface on the INS lobe of SidC is negatively charged (D). The surface is colored based on electrostatic potential with positively charged regions in blue (+5 kcal/electron) and negatively charged surface in red (−5 kcal/electron).
Figure 4—figure supplement 3

Single turnover activity assays of SdcA and UbcH5C mutants at the SdcA/UbcH5C interface.
(A) Representative SDS-gel of ester bond-linked UbcH5C~Ub complex remaining at the indicated time points. (B) Quantified intensity of UbcH5C~Ub at the indicated time points. The error bar represents the standard deviation of three independent experiments.
Figure 5
The C-terminal tail of the donor Ub is locked on the main lobe.
(A) Overall view of the interaction of the donor Ub with the SNL domain of SidC. (B) Detailed interactions of the C-terminal tail of the donor Ub at the main lobe active site. (C) Single turnover activity assays of SidC mutants of residues that interact with the Ub C-terminal tail.
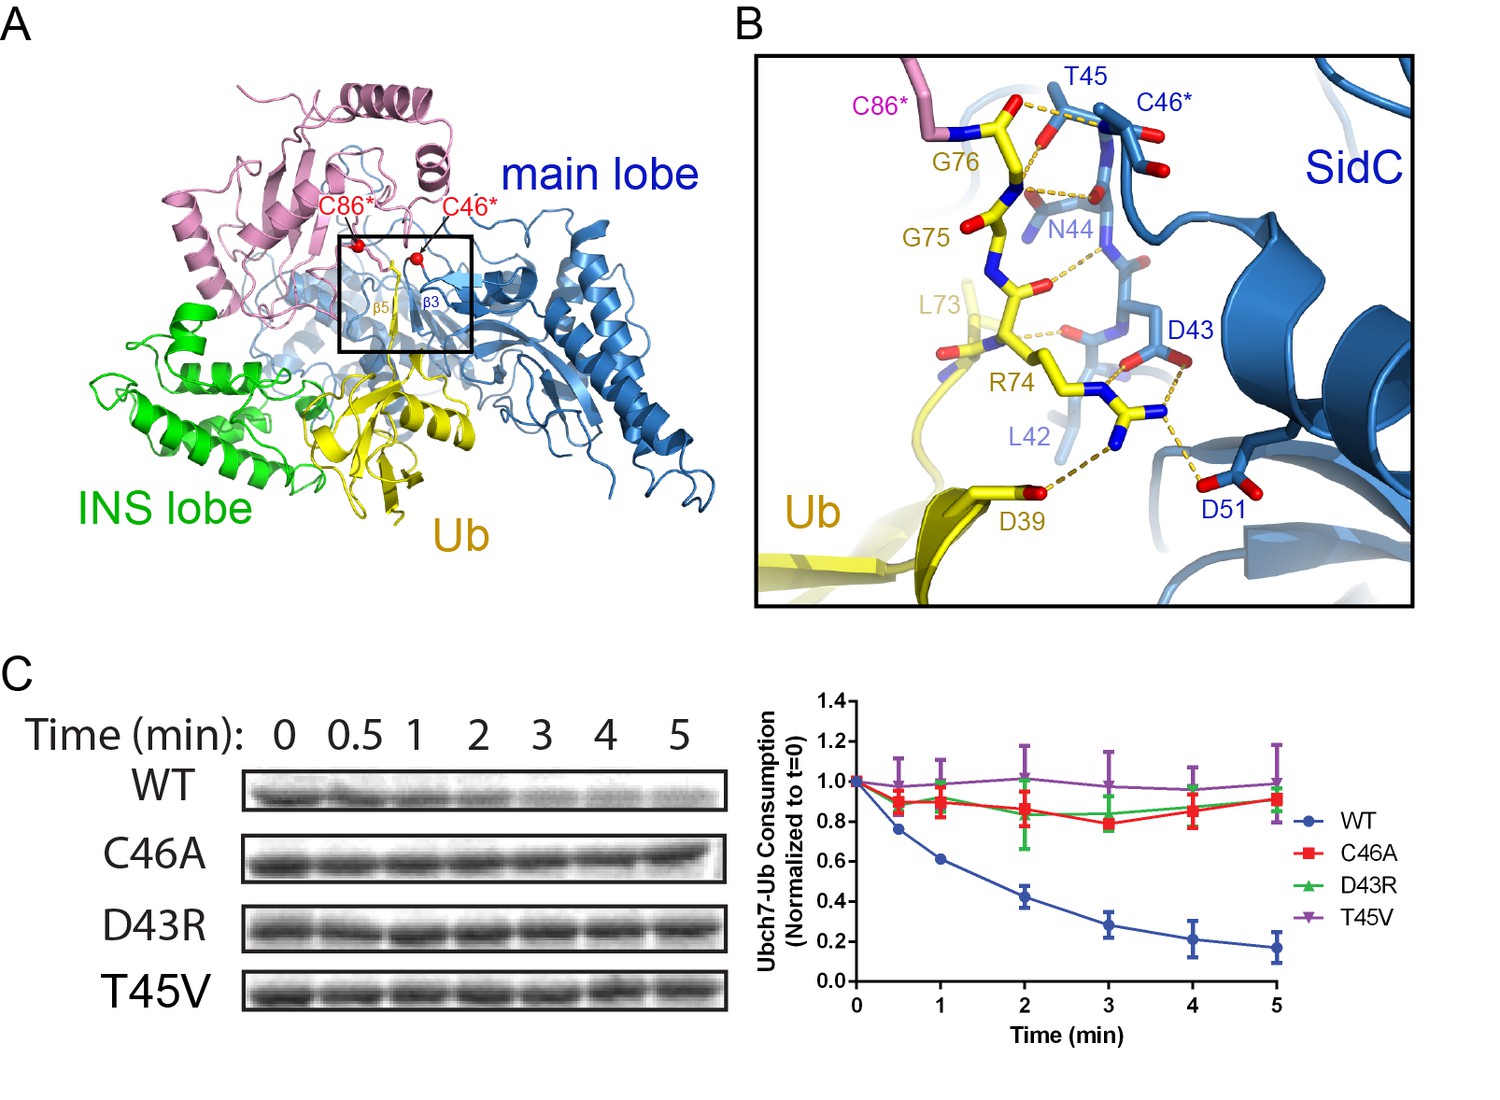
Figure 6 with 2 supplements
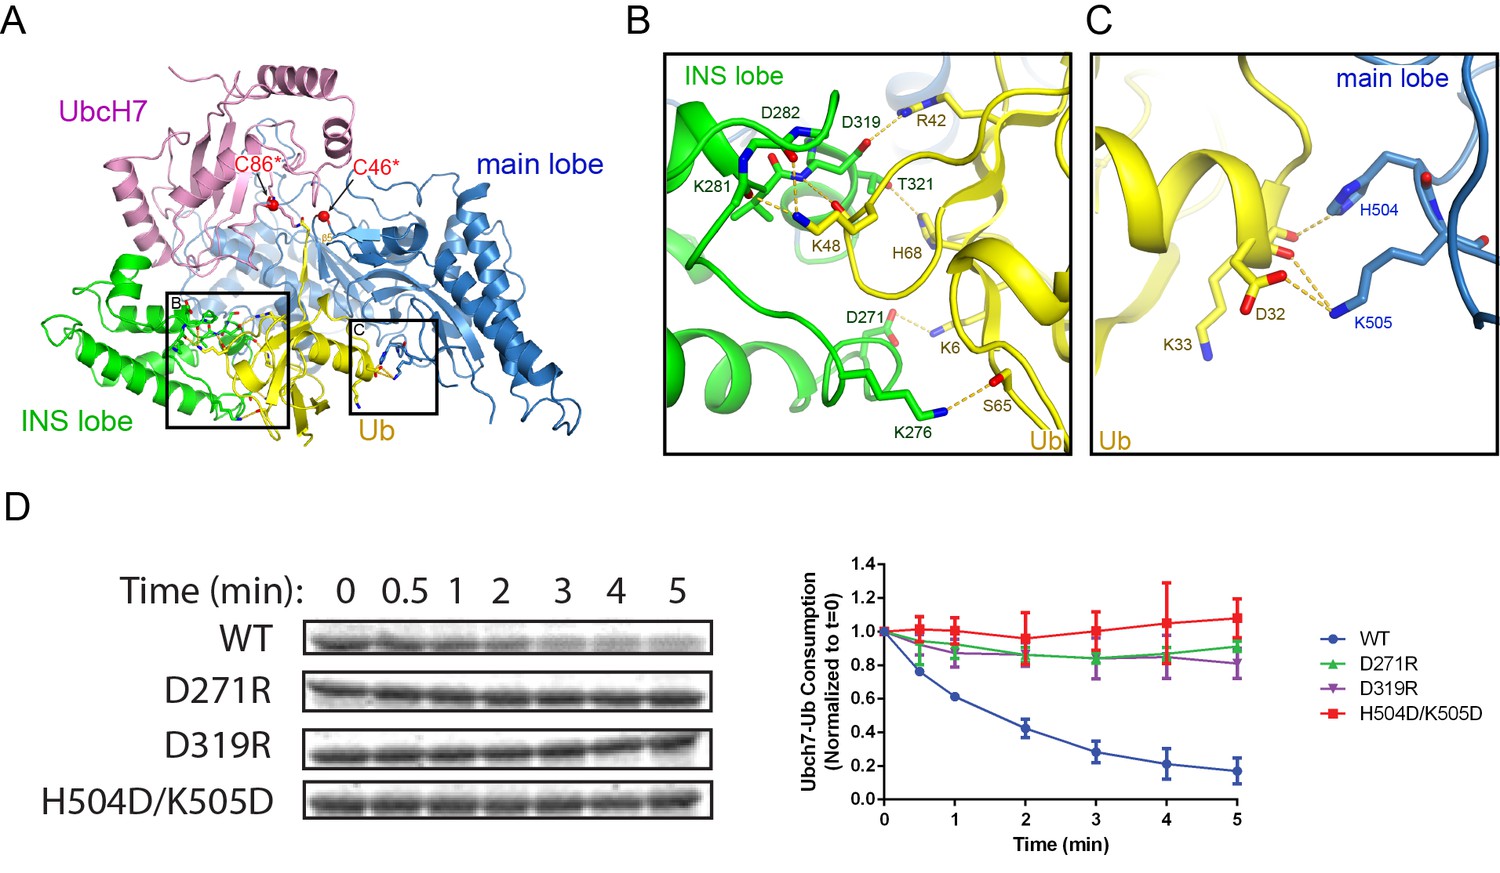
The donor Ub is tightly bound between the INS and main lobes of the SNL domain.
(A) Overall view of the donor Ub bound on the SNL domain of SidC. (B) Detailed network of interactions between the donor Ub and the INS lobe. H-bonds are illustrated with dashed lines. (C) Zoomed-in view of the interaction between the main lobe and the carboxyl end of the first α-helix of Ub. (D) Single turnover activity assays of SidC mutants of selected residues at the interface between the donor Ub and the SNL domain.
Figure 6—figure supplement 1
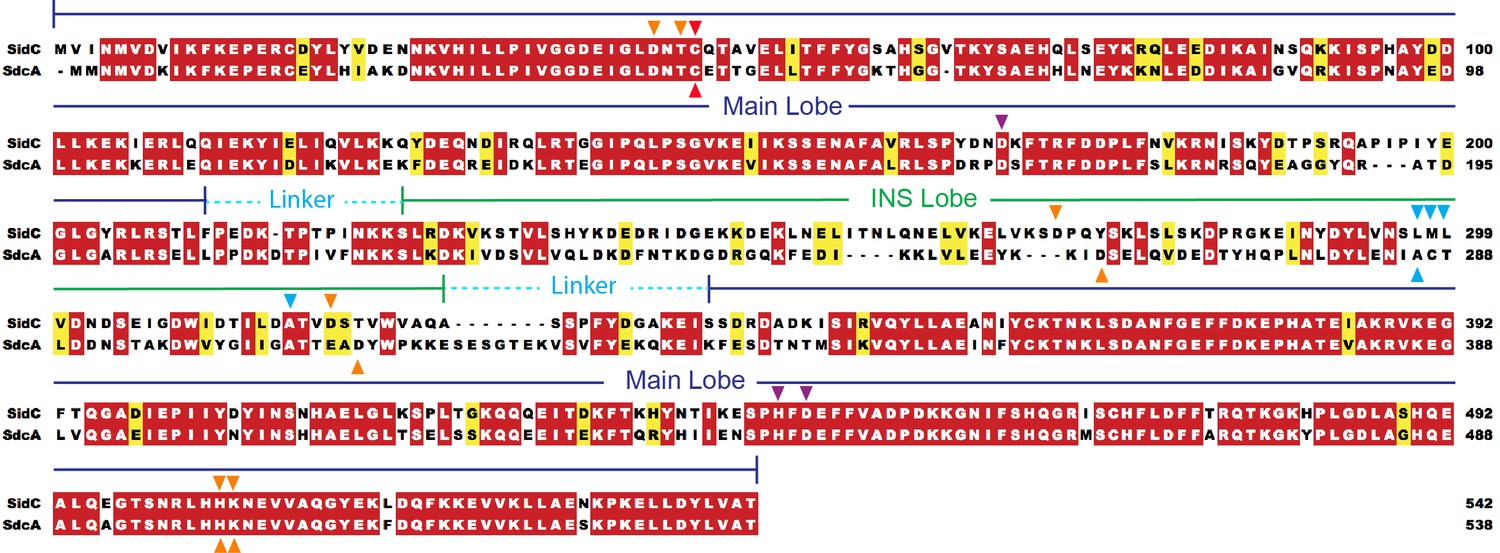
Sequence alignment of the SNL domain region of SidC and SdcA.
The sequence alignment was calculated by Clustal Omega and colored by the Multiple Align Show online server. The INS and main lobes and the two linker peptides between the two lobes are labeled on the top of the sequences. Residues in either SidC or SdcA selected for mutagenesis and used in the enzymatic assays are labeled with red (catalytic residue), blue (at the E2 interface), gold (involved in Ub binding), or purple (forms the acidic patch near the catalytic site) triangles. Entrez database accession numbers are as follows: SidC, GI: 40792743; SdcA, GI: 52629829.
Figure 6—figure supplement 2
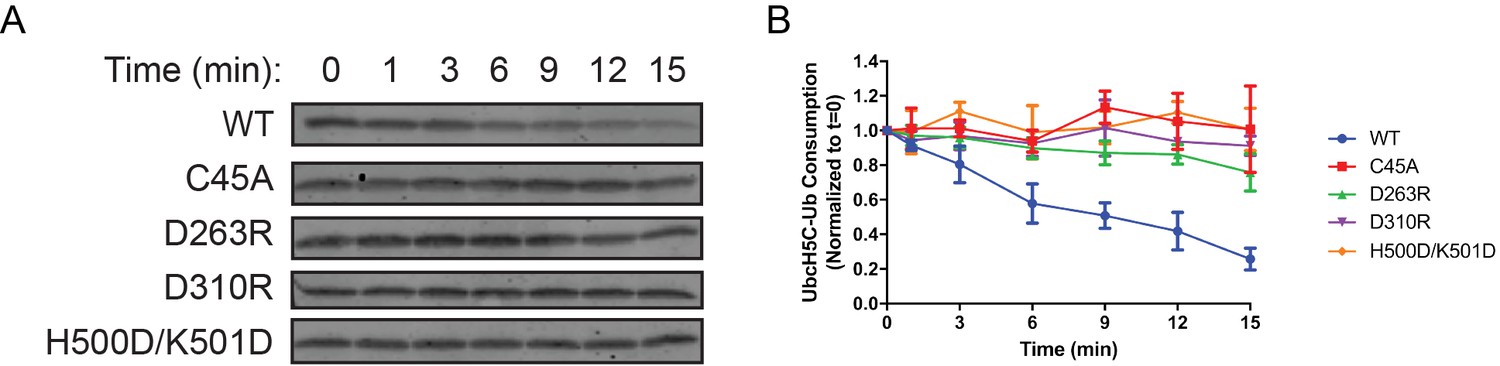
Single turnover activity assays of SdcA mutants of selected residues at the interface between the donor Ub and the SNL domain.
(A) Representative SDS-gel of ester bond-linked UbcH5C~Ub complex remaining at the indicated time points. (B) Quantified intensity of UbcH5C~Ub at the indicated time points. The error bar represents the standard deviation of three independent experiments.
Figure 7 with 1 supplement
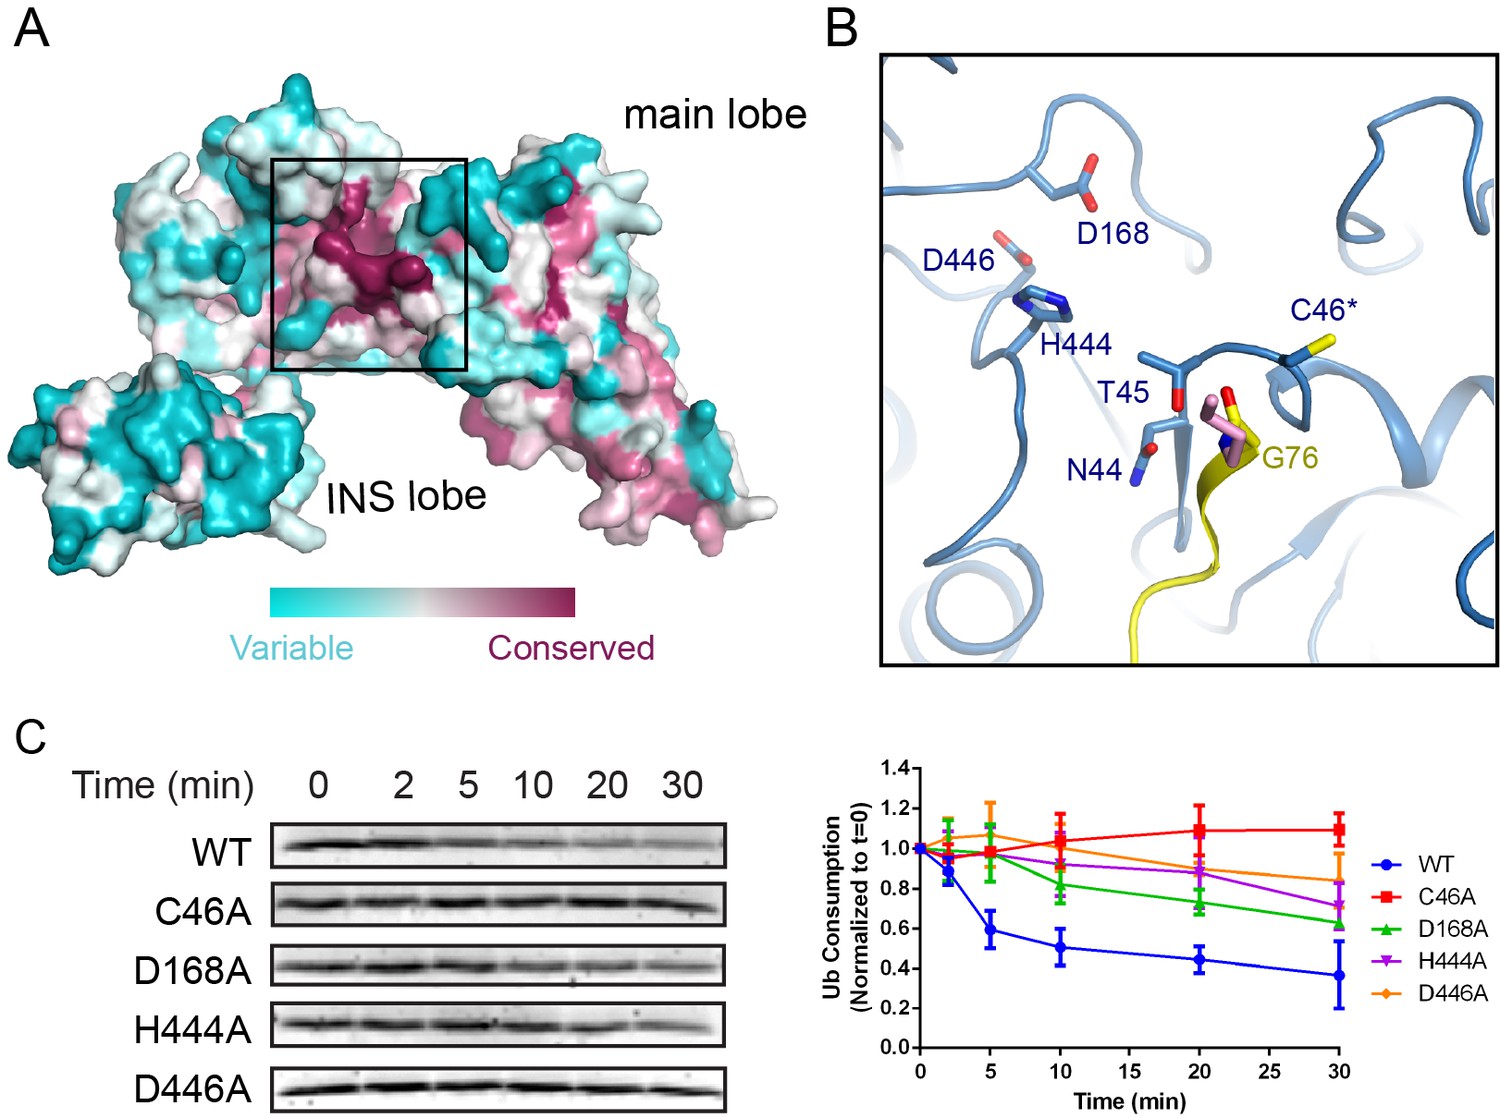
Conserved acidic residues near the SNL domain catalytic site.
(A) Surface conservation analysis of the SNL domain. The conservation was calculated from all SidC homologous sequences from all Legionella species with available genomic sequences using the ConSurf server, with the most conserved residues colored in purple and the least conserved residues in cyan. Note that the catalytic site of the SNL domain is concentrated with the most conserved residues. (B) A zoomed-in view of the most conserved residues at the catalytic site, including H444 and two acidic residues, D168 and D446. (C) Multiple turnover ubiquitination activity assays of SidC mutants of the conserved residues near the SidC active site monitored by the consumption of Ub. Left panel: representative SDS-gel of Ub remaining by the ubiquitination reaction at the indicated time points. Right panel: Quantified intensity of the remaining Ub at the indicated time points. The error bar represents the standard deviation of three independent experiments.
Figure 7—figure supplement 1
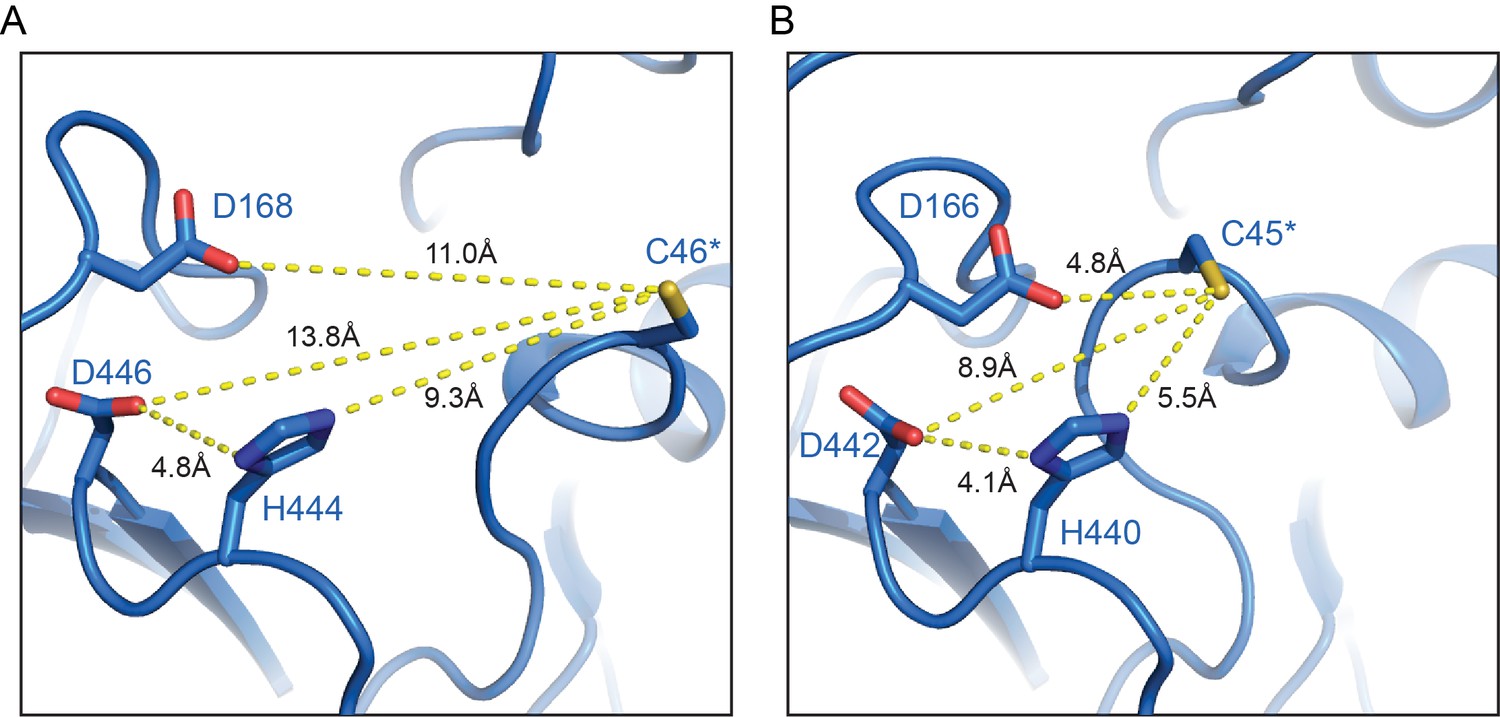
Conformational flexibility of the SidC and SdcA active sites.
(A) Active site of SidC in the SidC-UbcH7~Ub ternary complex. (B) Active site of SdcA in SdcA-UbcH5C binary complex. The flexibility of the loop harboring the catalytic cysteine allows the catalytic cysteine to come inclose proximity to the conserved acidic patch.
Tables
Table 1
Data collection and refinement statistics.
https://doi.org/10.7554/eLife.36154.003| UbcH7 ~ Ub SidC SNL (PDB ID: 6CP2) | UbcH5C-SdcA SNL (PDB ID: 6CP0) | |
|---|---|---|
| Data collection | ||
| Space group | P6522 | C2221 |
| Cell dimensions | ||
| a, b, c (Å) | 101.522, 101.522, 352.302 | 135.550, 142.202, 118.333 |
| a, b, g (°) | 90.0, 90.0, 120.0 | 90.0, 90.0, 90.0 |
| Resolution (Å)* | 50.0–2.90 (2.95–2.90) | 50.00–2.90 (2.95–2.90) |
| Rsym† (%) | 14.0 (80.2) | 12.5 (95.3) |
| I/σ(I) | 30.3 (16.6) | 8.8 (2.7) |
| Completeness (%) | 99.9 (99.9) | 96.4 (91.5) |
| Redundancy | 13.8 (14.6) | 4.0 (3.7) |
| Refinement | ||
| Resolution (Å) | 2.9 | 3.0 |
| No. reflections | 27,387 | 23,102 |
| Rwork/Rfree‡ (%) | 21.7/28.3 | 20.3/27.1 |
| R.m.s. deviations | ||
| Bond lengths (Å) | 0.0113 | 0.0106 |
| Bond angles (°) | 1.4734 | 1.4619 |
| Ramachandran Plot | ||
| Preferred (%) | 96.84 | 96.94 |
| Allowed (%) | 3.16 | 3.06 |
| Disallowed (%) | 0 | 0 |
-
*Values in parentheses are for highest-resolution shell.
†Rsym = ΣhΣi|II(h) −<I(h)|/ΣhΣiII(h).
-
‡Rcrys = Σ(|Fobs|−k|Fcal|)/Σ|Fobs|. Rfree was calculated for 5% of reflections randomly excluded from the refinement.
Additional files
-
Transparent reporting form
- https://doi.org/10.7554/eLife.36154.017
Download links
A two-part list of links to download the article, or parts of the article, in various formats.
Downloads (link to download the article as PDF)
Open citations (links to open the citations from this article in various online reference manager services)
Cite this article (links to download the citations from this article in formats compatible with various reference manager tools)
Insights into the ubiquitin transfer cascade catalyzed by the Legionella effector SidC
eLife 7:e36154.
https://doi.org/10.7554/eLife.36154


