Neural circuitry of a polycystin-mediated hydrodynamic startle response for predator avoidance
- University of Exeter, United Kingdom
- Max Planck Institute for Developmental Biology, Germany
- Technical University of Denmark, Kingdom of Denmark
Figures
Figure 1 with 1 supplement
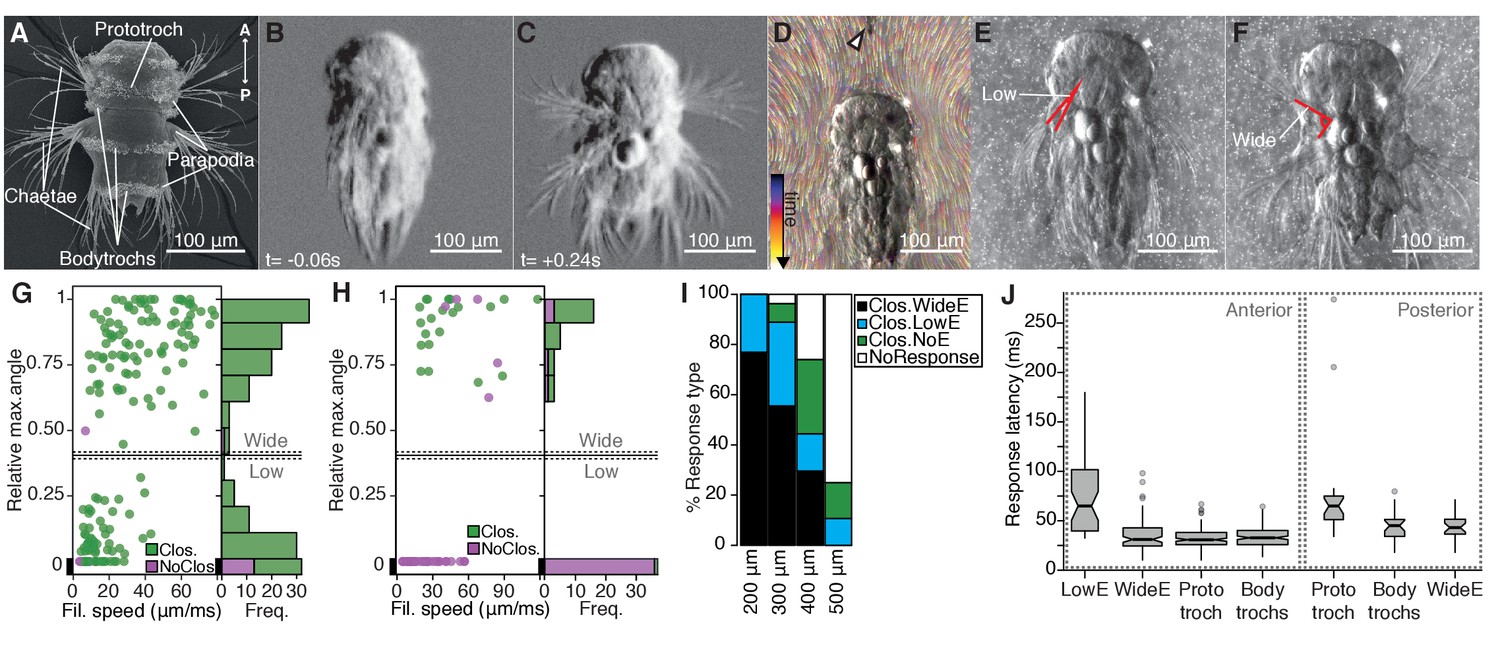
The startle response in Platynereis larvae is driven by hydrodynamic disturbances.
(A) SEM micrograph of a 3-day-old nectochaete larva, dorsal view. (B–C) Snapshots of Video 1 60 ms before (B) and 240 ms after (C) a vibration stimulus. (D) Trunk-tethered larva (arrowhead points to the filament used for stimulation) engaging in (fictive) swimming. Fluorescent beads are colour coded by frame. (E–F) Examples of low-angle (E) or wide-angle (F) parapodial elevation upon anterior stimulation (angles measured are outlined in red). (G–H) Relative parapodial elevation angle (0, no elevation; 1, maximum elevation) as a function of filament speed. The stimulation filament was placed 100 μm from the head (G) or pygidium (H). Dots are colour coded by ciliary band (prototroch) closure. A stacked histogram is shown to the right of each scatter plot. A finite Mixture Model-based cut off (0.4, solid horizontal lines) splits the two main populations of the histogram in G. Dashed horizontal lines: 95% CI. (I) Stacked bar plot of startle response profiles upon stimulation with a filament placed at varying distances from the head. (J) Latency distributions for the onset of each response upon anterior (left) or posterior (right) stimulation. Notch in boxplots displays the 95% CI around the median. Box width proportional to. n = 9 larvae in panels G) to J), each tested multiple times.
-
Figure 1—source data 1
Source data of startle kinematics experiments.
- https://doi.org/10.7554/eLife.36262.005
Figure 1—figure supplement 1
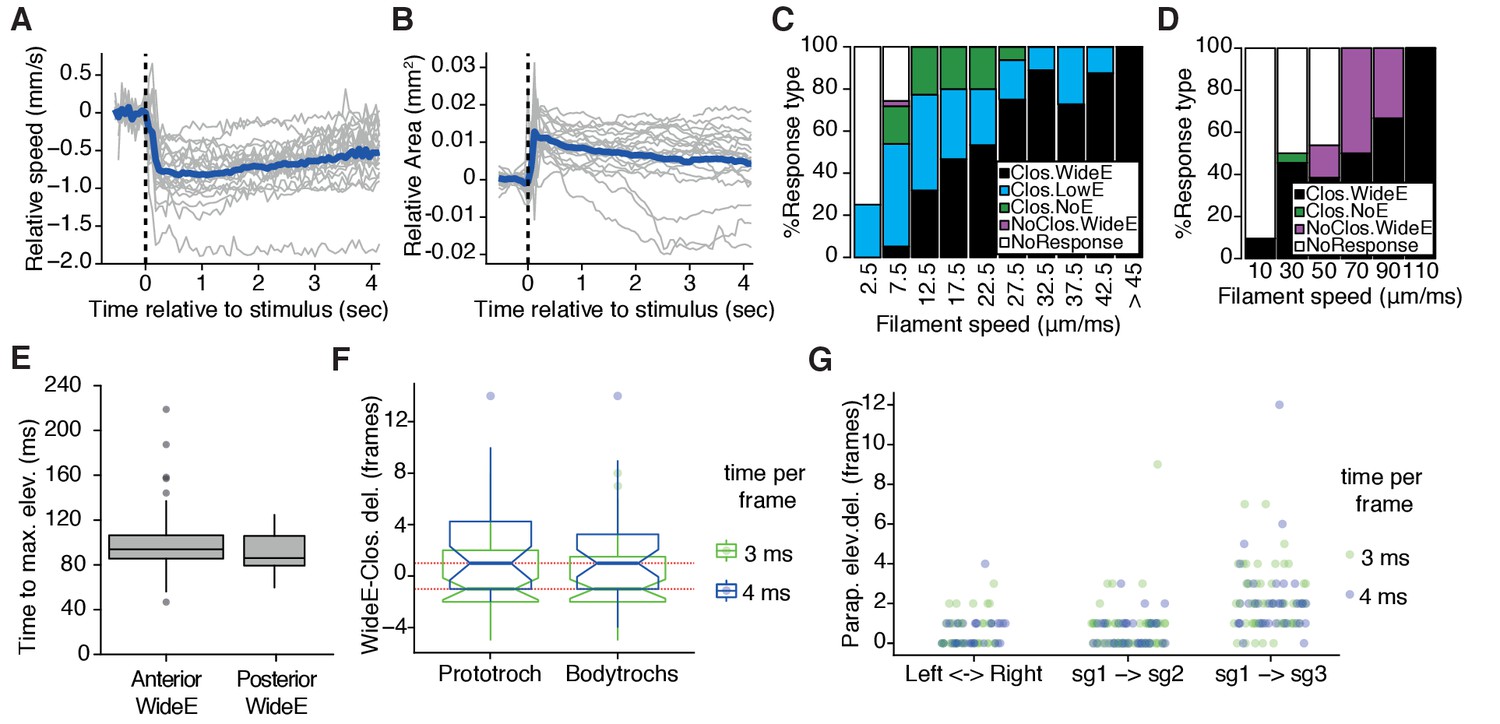
Descriptive statistics of the startle response in freely-swimming and tethered larvae.
(A–B) Change in larval speed (A) or in area (B) upon vibration stimulus. Each value was normalized to average speed or average area prior to the stimulus. Blue lines represent the mean values and grey lines the individual values of 21 larvae measured from 3 batches. (C–D) Stacked barplot of startle response profiles upon head stimulation with a filament placed at 100 μm from the head (C) or pygidium (D). Midpoint values for each bin are shown in the abscissa. (E) Tukey boxplots of time from onset to maximum parapodial elevation for head and pygidial WideE responses. (F) Tukey boxplots of onset of WideE responses relative to prototroch or bodytroch ciliary arrests (i.e. WideE to closure delay) upon anterior stimulation. Red dashed lines mark the 1/-1 frame difference. (G) Frame difference between onset of left and right parapodial elevation in the 1st segment (LeftRight), or the difference of the 1st relative to the 2nd parapodium, (sg1sg2), or to the 3rd parapodia (sg1sg3) on the same body side upon anterior stimulation. Notch in boxplots in F displays the 95% confidence interval around the median. Boxwidth in E and F is proportional to. Measurements in F and G are coloured by recording speed. n = 9 larvae in panels C-G, each tested multiple times (same as data shown in Figure 1).
-
Figure 1—figure supplement 1—source data 1
Normalized speed and area values of startle responses in freely swimming larvae.
- https://doi.org/10.7554/eLife.36262.004
Figure 2 with 2 supplements
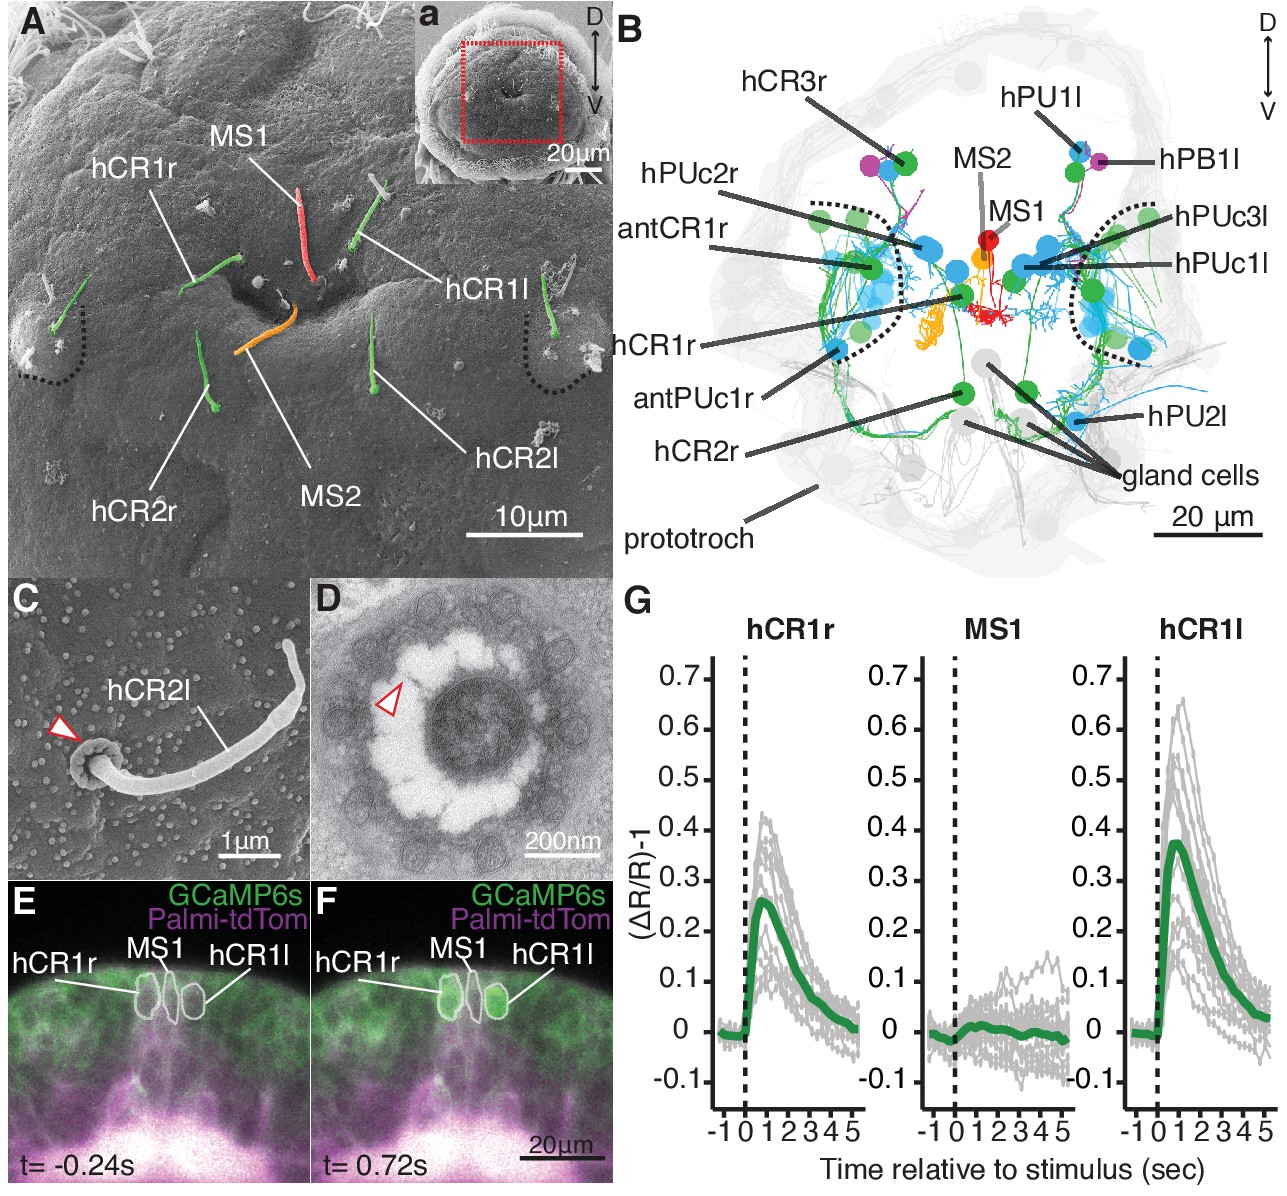
Head CR neurons are hydrodynamic receptors.
(A) Close-up view of the head of a nectochaete larva (region outlined in a). Developing antennae with a CR cilium (green) are outlined in blue. (B) Reconstruction of penetrating ciliated sensory neurons in the head from a serial transmission electron microscopy volume. Colour code as in (A). Additional penetrating uniciliated (PUc and PU) or biciliated (PB) neurons are shown in blue and magenta, respectively. One of each bilateral pair is labelled. Cells not fully penetrating the cuticle are shown in semi-transparent colors. (C) SEM of a CR sensory cilium (hCR2l), collar of microvilli protrudes out of the cuticle (arrowhead). (D) TEM cross-section of a CR sensory cilium with a collar of 10 thick microvilli and fibres connecting the cilium and the microvilli (arrowhead). (E, F) Snapshots from Video 5 showing a larva injected with Palmi-tdTomato-P2A-GCaMP6s mRNA 0.24 s prior (E) or 0.72 s after (F) stimulation with a vibrating filament (ventral view). The ROIs used for fluorescence quantification are outlined in white. (G) Mean ratiometric fluorescence changes (green traces) of hCR1l, hCR1r and MS1 neurons upon stimulation with a vibrating filament placed 50 µm anterior to the head. 15 (hCR1r), 18 (MS1) and 16 (hCR1l) measurements (grey traces) from five animals are shown. The traces were aligned relative to the stimulus start (t = 0).
-
Figure 2—source data 1
Source data of calcium imaging experiments.
- https://doi.org/10.7554/eLife.36262.012
-
Figure 2—source data 2
Sequence and map of plasmid construct used to synthesize Palmi-tdTomato-P2A-GCaMP6s mRNA.
- https://doi.org/10.7554/eLife.36262.013
Figure 2—figure supplement 1
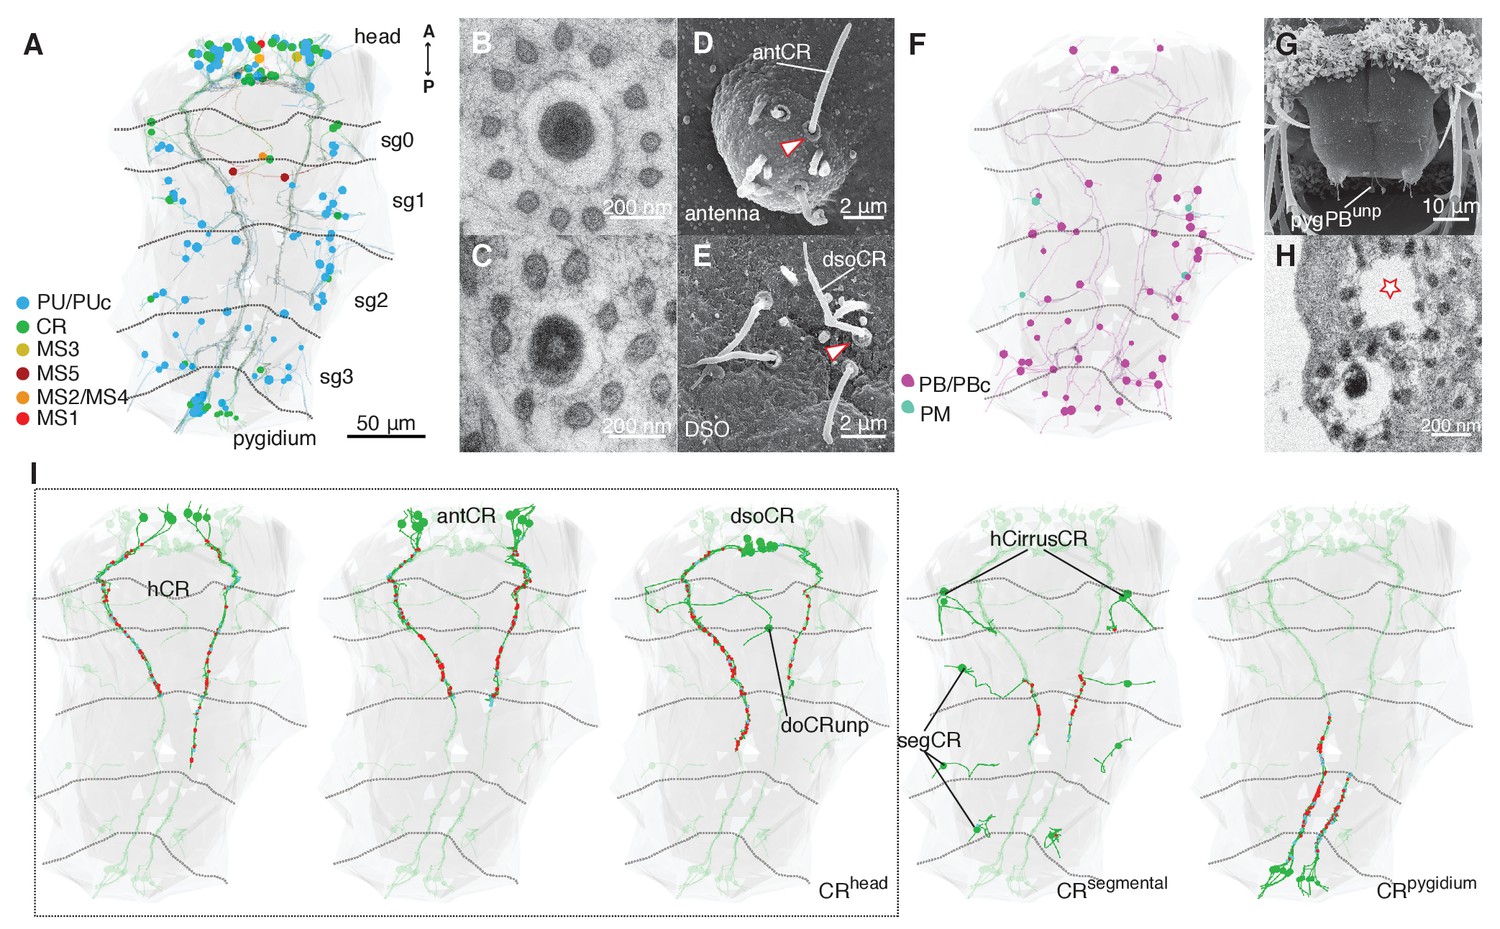
Penetrating ciliated sensory neurons in the nectochaete larva.
(A) Penetrating uniciliated cell complement classified by sensory dendrite morphology. MS neurons are mostly asymmetric and localized to the head. CR and PU/PUc neurons are located around the body. (B) MS1 has a single cilium and a collar of 13 microvilli. This sensory morphology is characteristic of MS neurons. (C) hPUc1 cilium with a collar of 8 microvilli. PUc cells have irregularly shaped collars with variable numbers of thin microvilli. PU cells do not have a recognizable collar. (D–E) Organs with CR neurons. Antenna in D, and dorsal sensory organ (DSO) in E with multiple CR cells (antCR or dsoCR) recognized by the collar at the base (red arrowheads). (F) Penetrating biciliated (PB) and multiciliated (PM) cell complement. (G) Pygidium with multiple penetrating ciliated cells, including CR neurons and the single pygPBunp. (H) pygPBunp has two cilia (one lost in this preparation, star) each with a collar of microvilli. (I) The 45 CR neurons (green) are localized to the head, segments and pygidium. Output and input synapses are shown as red and cyan dots, respectively.
Figure 2—figure supplement 2
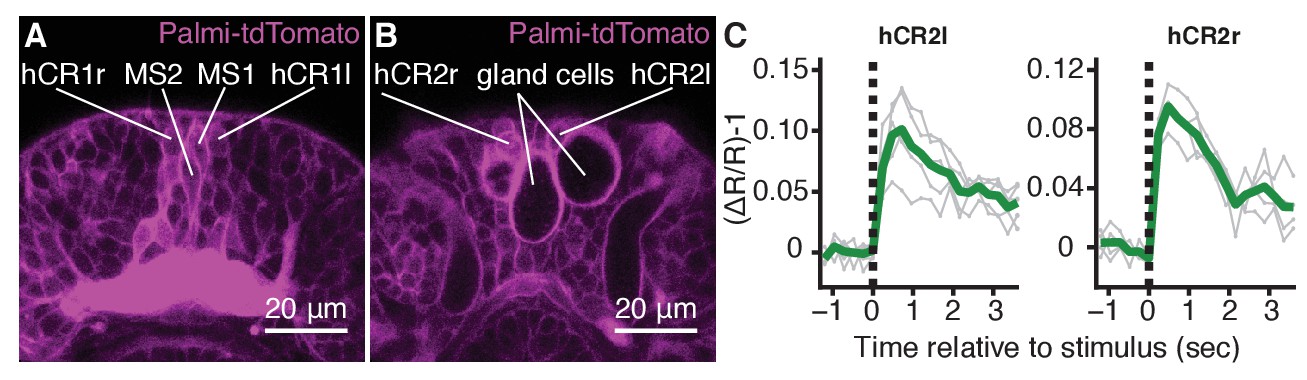
Distinct head CR and MS neurons are identifiable in living animals.
(A–B) hCR1, hCR2 and MS1/2 cell bodies are identifiable in larvae injected with Palmi-tdTomato-P2A-GCaMP6s mRNA. hCR1 and MS1/2 are located in the middle of the head (A), while hCR2 cells are in a more ventral position and adjacent to the head gland cells (see Figure 2E). Only the signal from Palmi-tdtomato is shown. (C) Mean ratiometric fluorescence changes (green traces) of hCR2l, and hCR2r neurons upon stimulation with a vibrating filament placed 50 m anterior to the head. 5 (hCR2l), and 4 (hCR2r) measurements (grey traces) from two animals are shown. The traces were aligned relative to the stimulus start (t = 0).
Figure 3 with 3 supplements
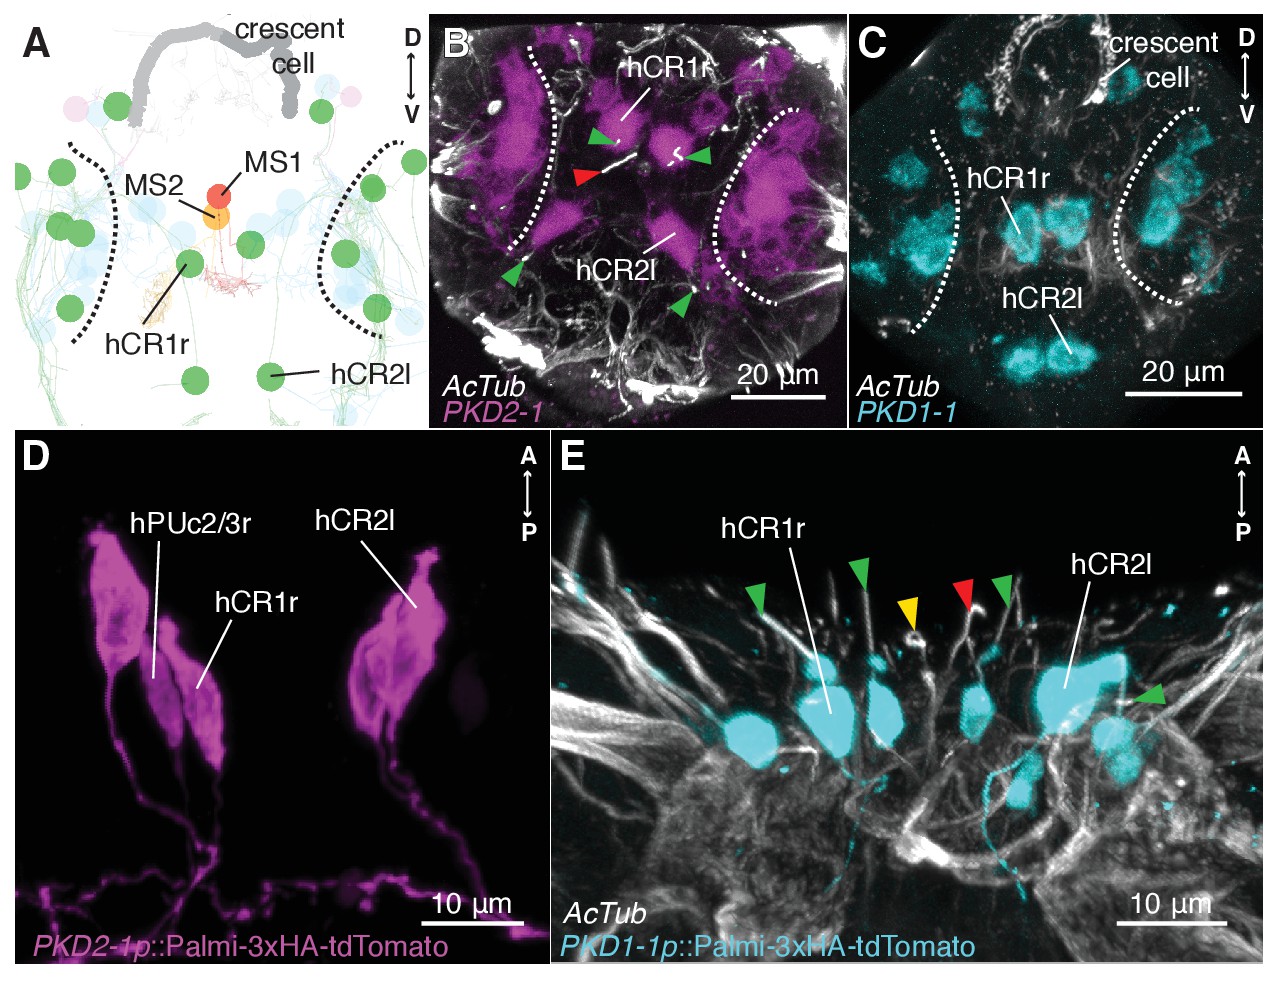
CR neurons express PKD1-1 and PKD2-1.
(A) Electron microscopy volume reconstruction of penetrating ciliated cells in the head. Only soma position of CRs (green) and MS cells are highlighted for comparison with panels B and C. Black dashed lines demarcate the antennal region. Refer to Figure 2B for a more detailed view. (B and C) PKD1-1 (B) or PKD2-1 (C) head gene expression revealed by in situ hybridization; anterior views. Compare cell position in B and C to panel A. White dashed lines demarcate the antennal region. (D and E) Immunostaining of 3xHA-Palmi-tdTomato expressed under the PKD1-1 (D) or the PKD2-1 (E) promoter; ventral views. Counterstaining against acetylated tubulin (AcTub) is in white. Green arrowheads in C and D point to CR cilia (green), MS1 (red) or MS2 cilia (yellow).
Figure 3—figure supplement 1
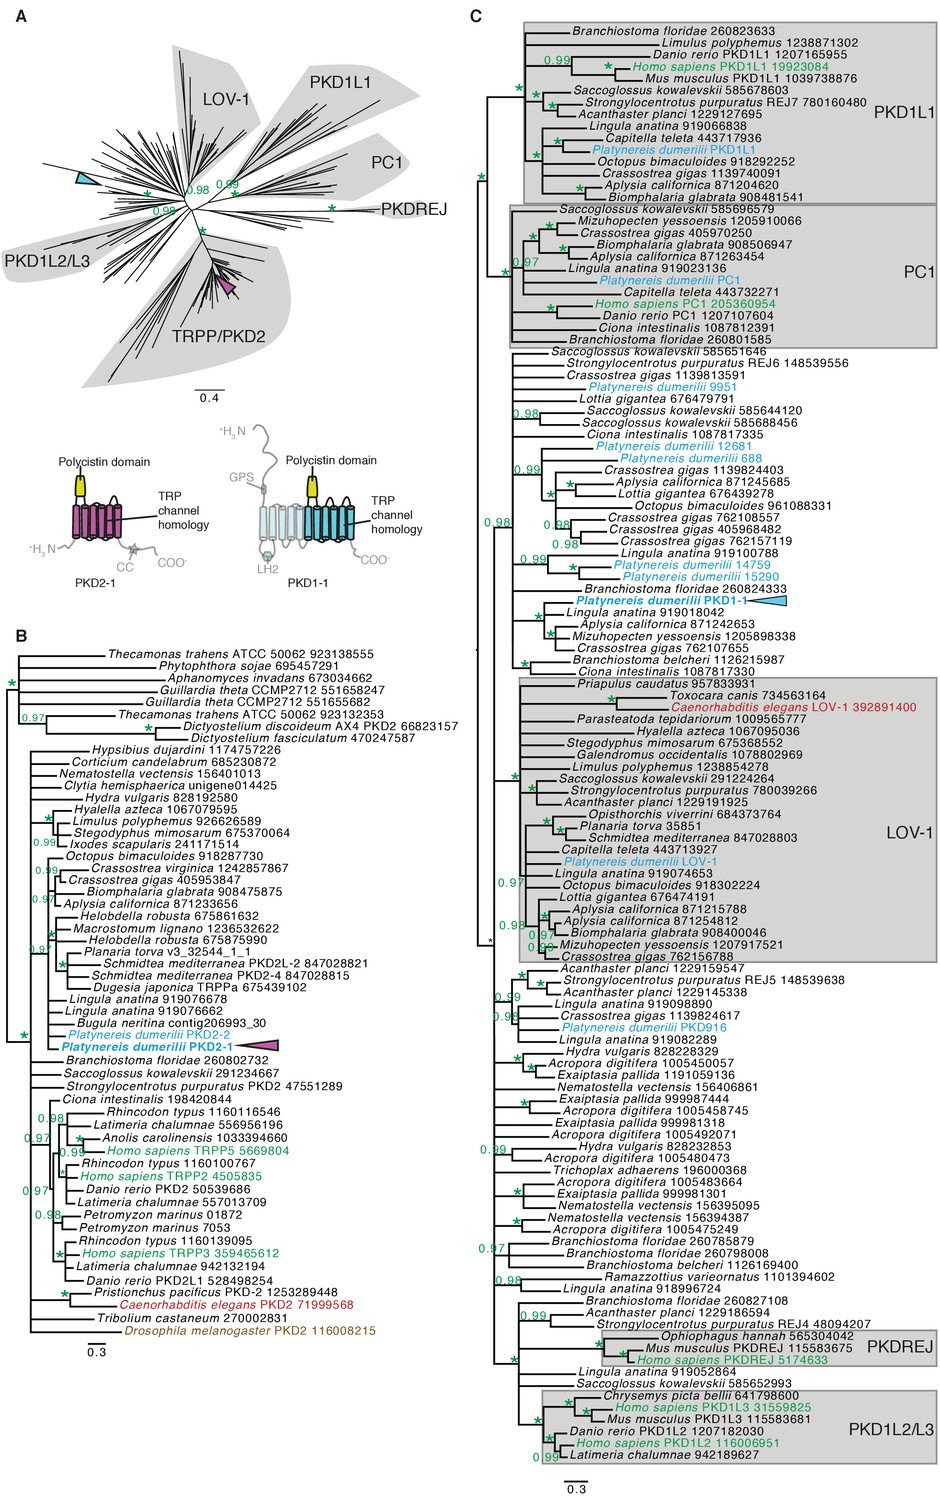
Platynereis PKD1-1 and PKD2-1 belong to the TRPP/PKD1 superfamily.
(A–C) Maximum likelihood (ML) phylogenies of TRPP2 and/or PKD1 families. Well-supported families are outlined in grey colour and named after experimentally characterized members. The location of Platynereis PKD1-1 and PKD2-1 in each tree is indicated with a cyan or a magenta arrowhead, respectively. Asterisks symbolize an aLRT value of 1. (A) ML phylogeny of the combined TRPP2 and PKD1 families (top) based on the common alignable region that includes the TRP channel homology domain and the polycystin domain (highlighted in the PKD2-1 and PKD1-1 cartoon architectures below). (B–C) ML phylogeny of the TRPP/PKD2 family (B) or of the PKD1 family (C). Only branching points with support probabilities ≥ 97 are shown.
-
Figure 3—figure supplement 1—source data 1
Source data of phylogenetic analysis, including alignment and tree files and nucleotide sequences of all Platynereis PKD genes analysed.
- https://doi.org/10.7554/eLife.36262.019
Figure 3—figure supplement 2
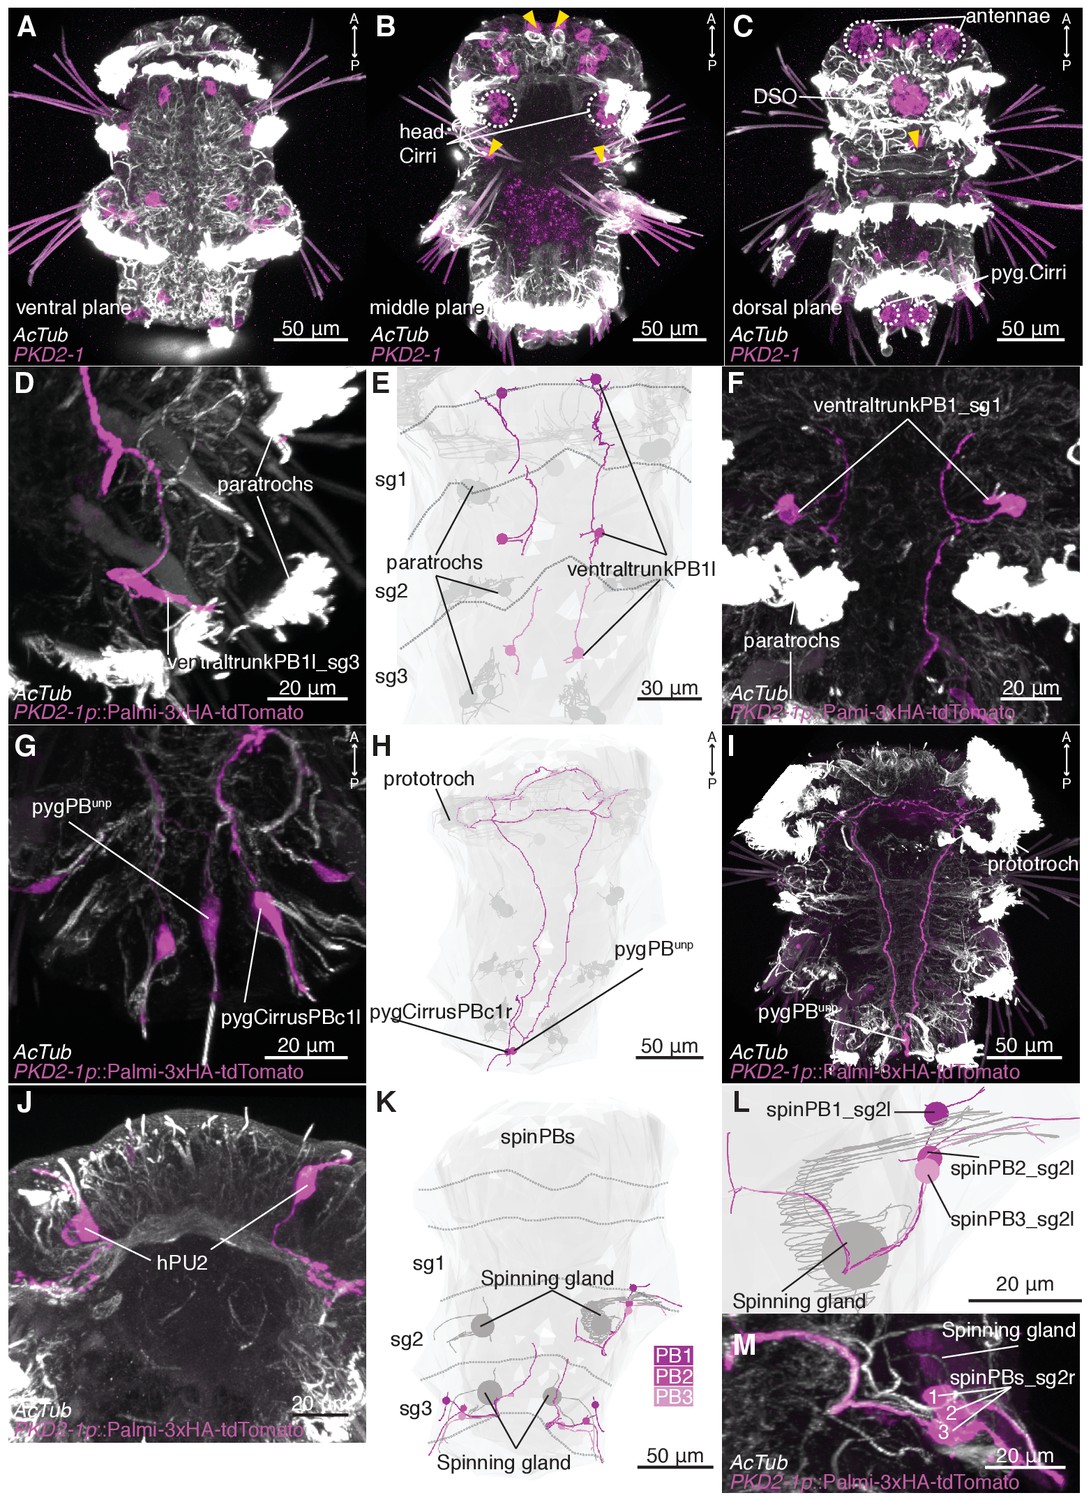
PKD2-1 is expressed in CR and other penetrating ciliated neurons.
(A–C) Different planes of a representative specimen showing expression of PKD2-1 by whole mount in situ hybridization. Yellow arrowheads point to putative CR neurons. White dotted circles demarcate sensory organs where CR neurons are present. Dorsal view in C. (D–F) PKD2-1 is expressed in segmental biciliated cells in the trunk (ventraltrunkPBs) (D, F). The same cells were reconstructed in the EM volume (E). (G–I). PKD2-1 is expressed in pygPBunp (G, I), and in the single biciliated cell in the pygidial cirrus, pygCirrusPBc1 (G). H shows their corresponding EM reconstruction. (J) PKD2-1 is expressed in hPU2 cells. EM reconstruction shown in Figure 2B. (K–L) PKD2-1 is expressed in a group of three biciliated cells associated with the segmental spinning glands, spinPBs. (M) Reconstruction of spinPB1-3 in each segment is shown in K (cells on the right body side in the 2nd segment could not be reconstructed). A close-up view is shown in L. Immunostainings against HA-Palmi-tdTomato expressed under the PKD2-1 promoter (PKD2-1p::3xHA-Palmi-tdTomato) and counterstained against acetylated tubulin (AcTub) are shown in D, F, G, I, J and M. Segment (sg) boundaries (dotted lines) in E and K were defined by muscle anatomy. Ventral views are shown in all panels unless otherwise indicated.
Figure 3—figure supplement 3
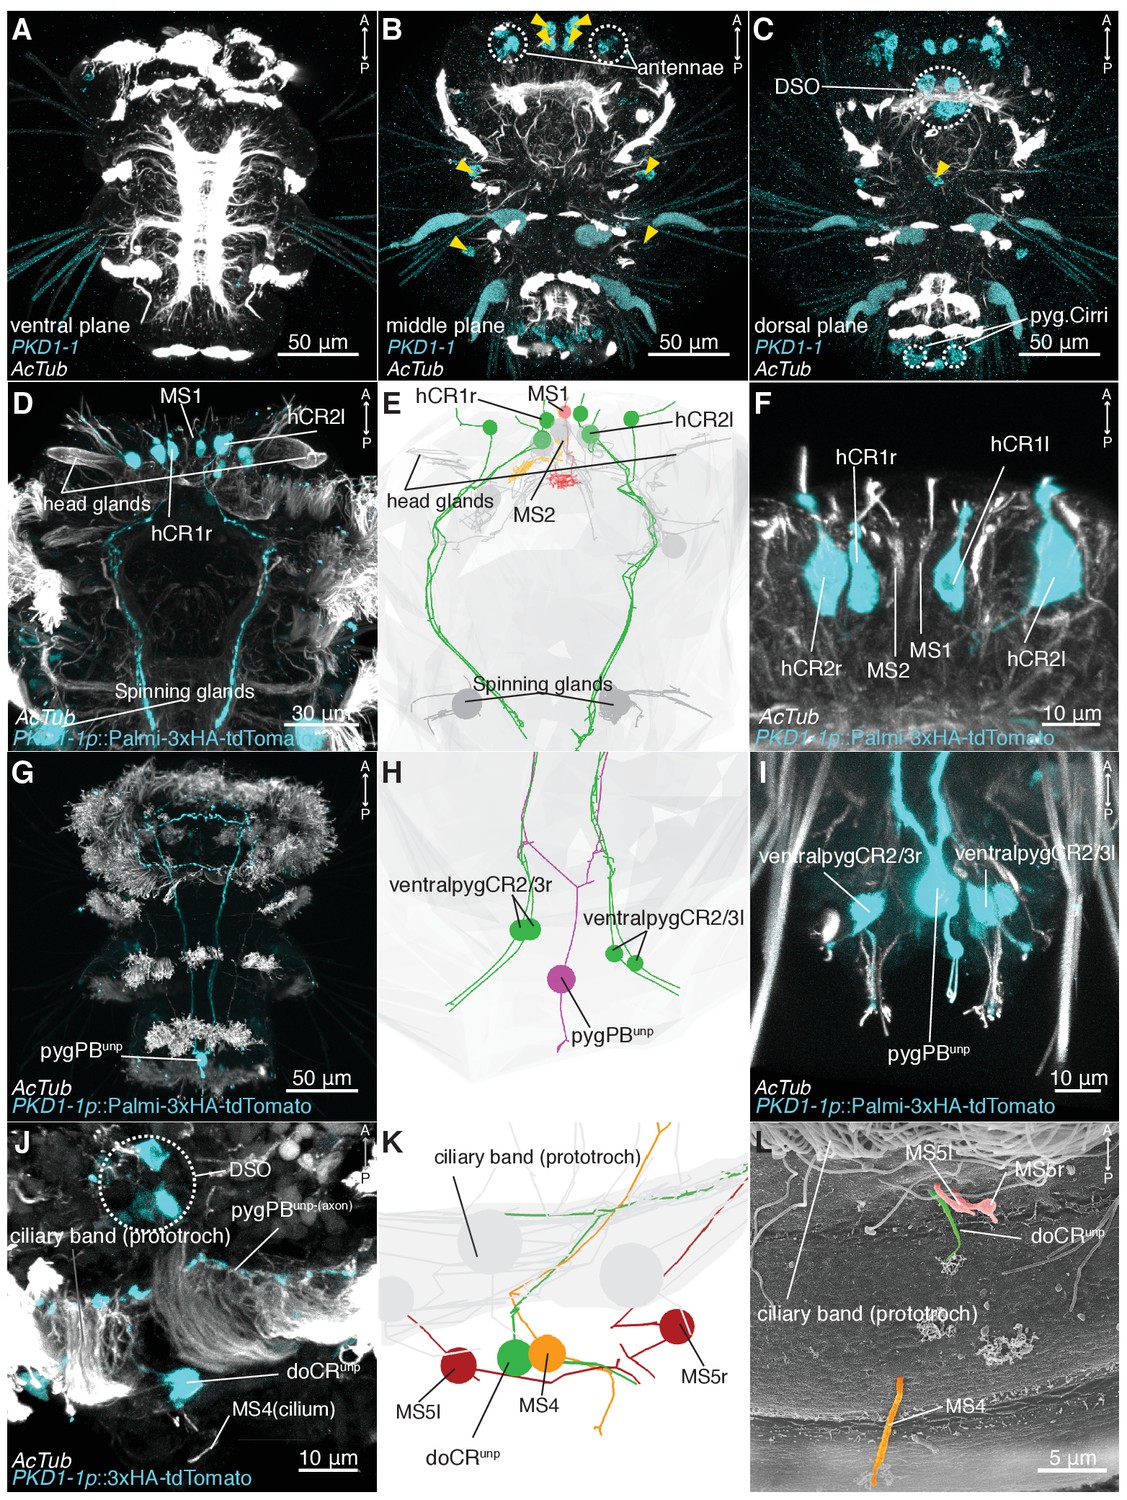
PKD1-1 is expressed in CR and pygPBunp neurons.
(A–C) Different planes of a representative specimen showing expression of PKD1-1 by whole mount in situ hybridization. Yellow arrowheads point to putative CR neurons. White dotted circles demarcate sensory organs where CR neurons are present. Dorsal view in C. (D–F) PKD1-1 is expressed in head CR neurons hCR1 and hCR2, but not in MS neurons MS1 and MS2 (D, F). The same cells were reconstructed in the EM volume (E). (G–I) PKD1-1 is expressed in pygPBunp (G, I), and in CR neurons in the ventral side of the pygidium (ventralpygCR2/3) (I). H shows their corresponding EM reconstruction. (J) PKD1-1 is expressed in the unpaired dorsal CR neuron doCRunp located slightly posterior to the prototroch. (K) Close-up view of doCRunp reconstructed in the EM volume. Neighbouring cells of the MS type (MS4 and MS5 cells) are also shown. (L) SEM view of the same region shown in K. Dorsal views in J-L. Cilia are coloured according to cell colours in K. Immunostainings against HA-Palmi-tdTomato expressed under the PKD1-1 promoter (PKD1-1p:: 3xHA-Palmi-tdTomato) and counterstained against acetylated tubulin (AcTub) are shown in D, F, G, I and J. Ventral views in all panels unless otherwise indicated.
Figure 4 with 1 supplement
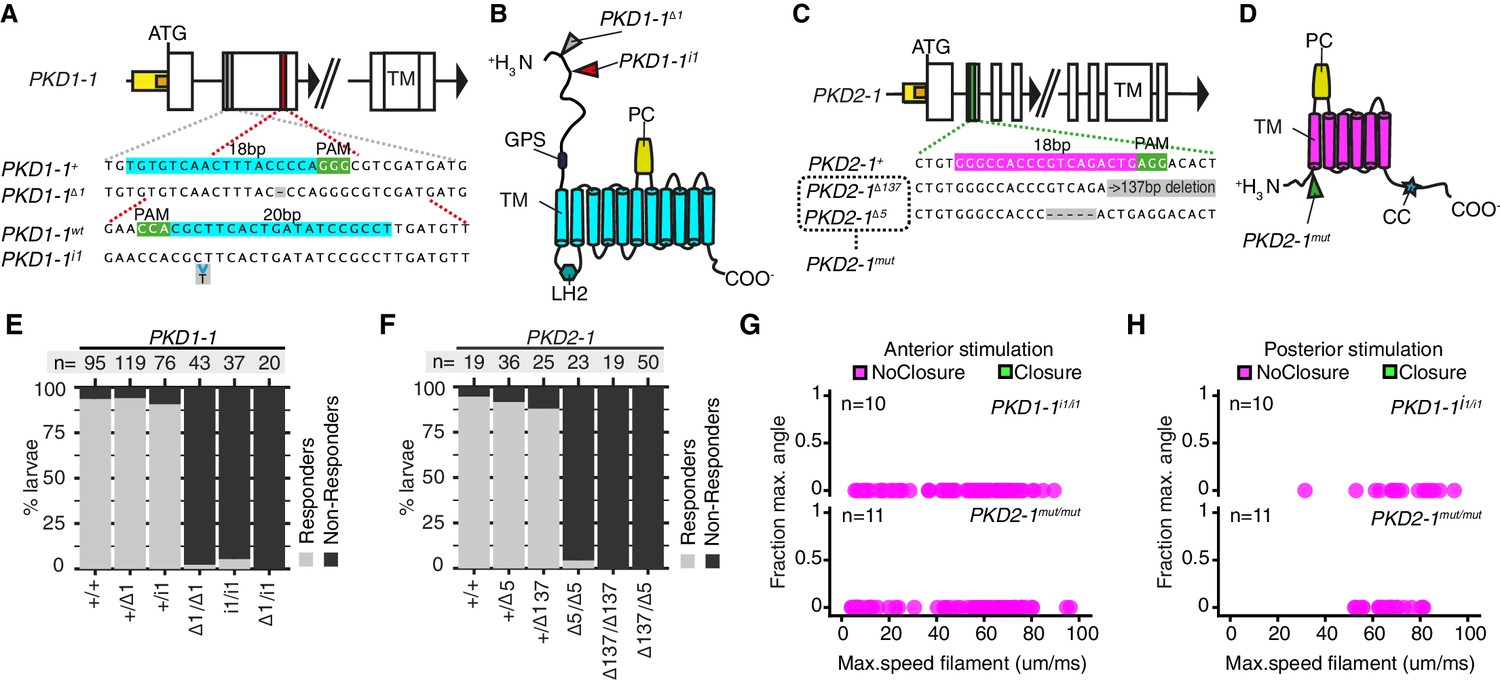
PKD1-1 and PKD2-1 are required for the startle response.
(A and C) PKD1-1 (A) and PKD2-1 (C) genomic loci and close-up regions showing wildtype (+) sequences targeted with CRISPR/Cas9. The mutant alleles generated are also shown. White, yellow and orange boxes represent exons, promoters, and 5’UTRs, respectively. (B and D) PKD1-1 (B) or PKD2-1 (D) protein secondary structure. Main conserved domains are labelled. Mutation sites are indicated by arrowheads. (E and F) Stacked barplots of PKD1-1 (E) or PKD2-1 (F) mutant and wildtype (+/+) homozygote, heterozygote or trans-heterozygote larvae (%) startle response to touch stimulus. Data in (E) and in (F) from 18 or 14 batches, respectively. (G and H) Parapodial elevation angles of PKD1-1i1/i1 or PKD2-1mut/mut larvae as a function of filament speed. Stimulation filament ca. 100 μm from anterior (G) or from posterior (H).
-
Figure 4—source data 1
Phenotyping of PKD1-1 and PKD2-1 mutant larvae in the touch assay.
- https://doi.org/10.7554/eLife.36262.025
-
Figure 4—source data 2
Phenotyping of tethered PKD1-1 and PKD2-1 mutant larvae.
- https://doi.org/10.7554/eLife.36262.026
Figure 4—figure supplement 1
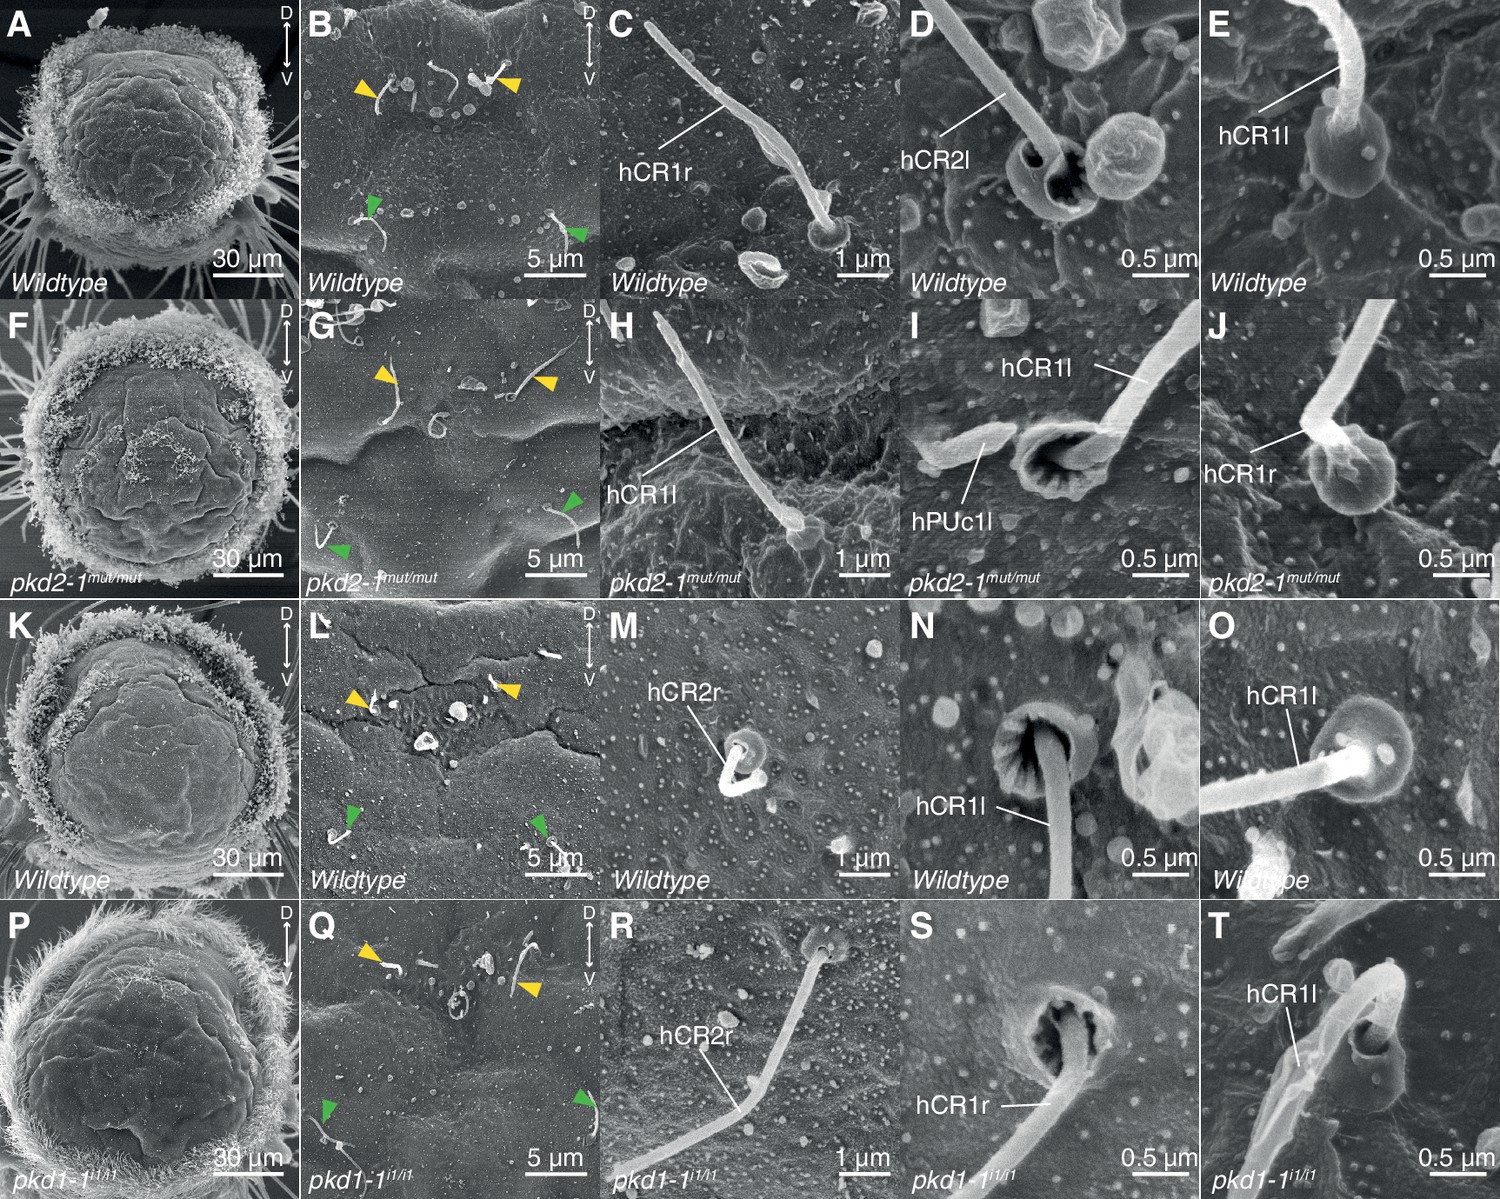
Cilia of hCR1 and hCR2 neurons in PKD1-1i1/i1 or PKD2-1mut/mut larvae are morphologically similar to wildtype controls.
(A–J). Morphology of hCR1 and hCR2 neurons in wildtype (A–E) and age-matched PKD2-1mut/mut (F–J) larvae. (K–T). Morphology of hCR1 and hCR2 neurons in wildtype (K–O) and age-matched PKD1-1i1/i1 (P–T) larvae. hCR1 and hCR2 cilia are marked with yellow and green arrowheads, respectively, in B, G, L and Q. Examples of the ‘open’ CR collar configuration are shown in D, I, N,S. Examples of the ‘closed’ configuration are shown in E, J, O and T.
Figure 5
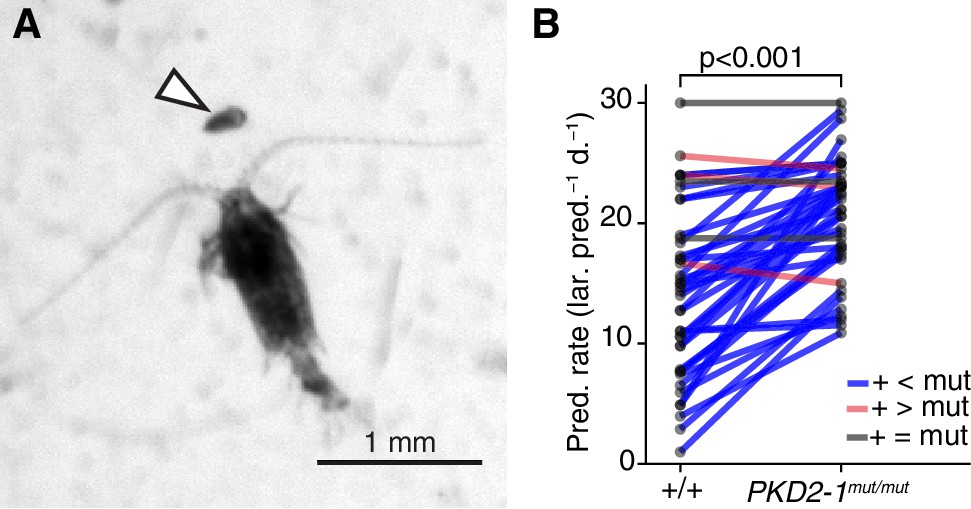
PKD2-1 is required for predator avoidance and escape.
(A) Adult Centropages typicus female approaching a nectochaete Platynereis larva (arrowhead). (B) Predation on wildtype (+/+) and PKD2-1mut/mut larvae by C. typicus. Paired values are joined by blue, grey or red lines if predation rates were higher, equal or lower in mutant than in wildtype larvae, respectively; data from 42 trials with 12 batches. One-sided exact Wilcoxon-Pratt signed rank test, P 5.2e-10.
-
Figure 5—source data 1
Source data of predation experiments.
- https://doi.org/10.7554/eLife.36262.029
Figure 6 with 3 supplements
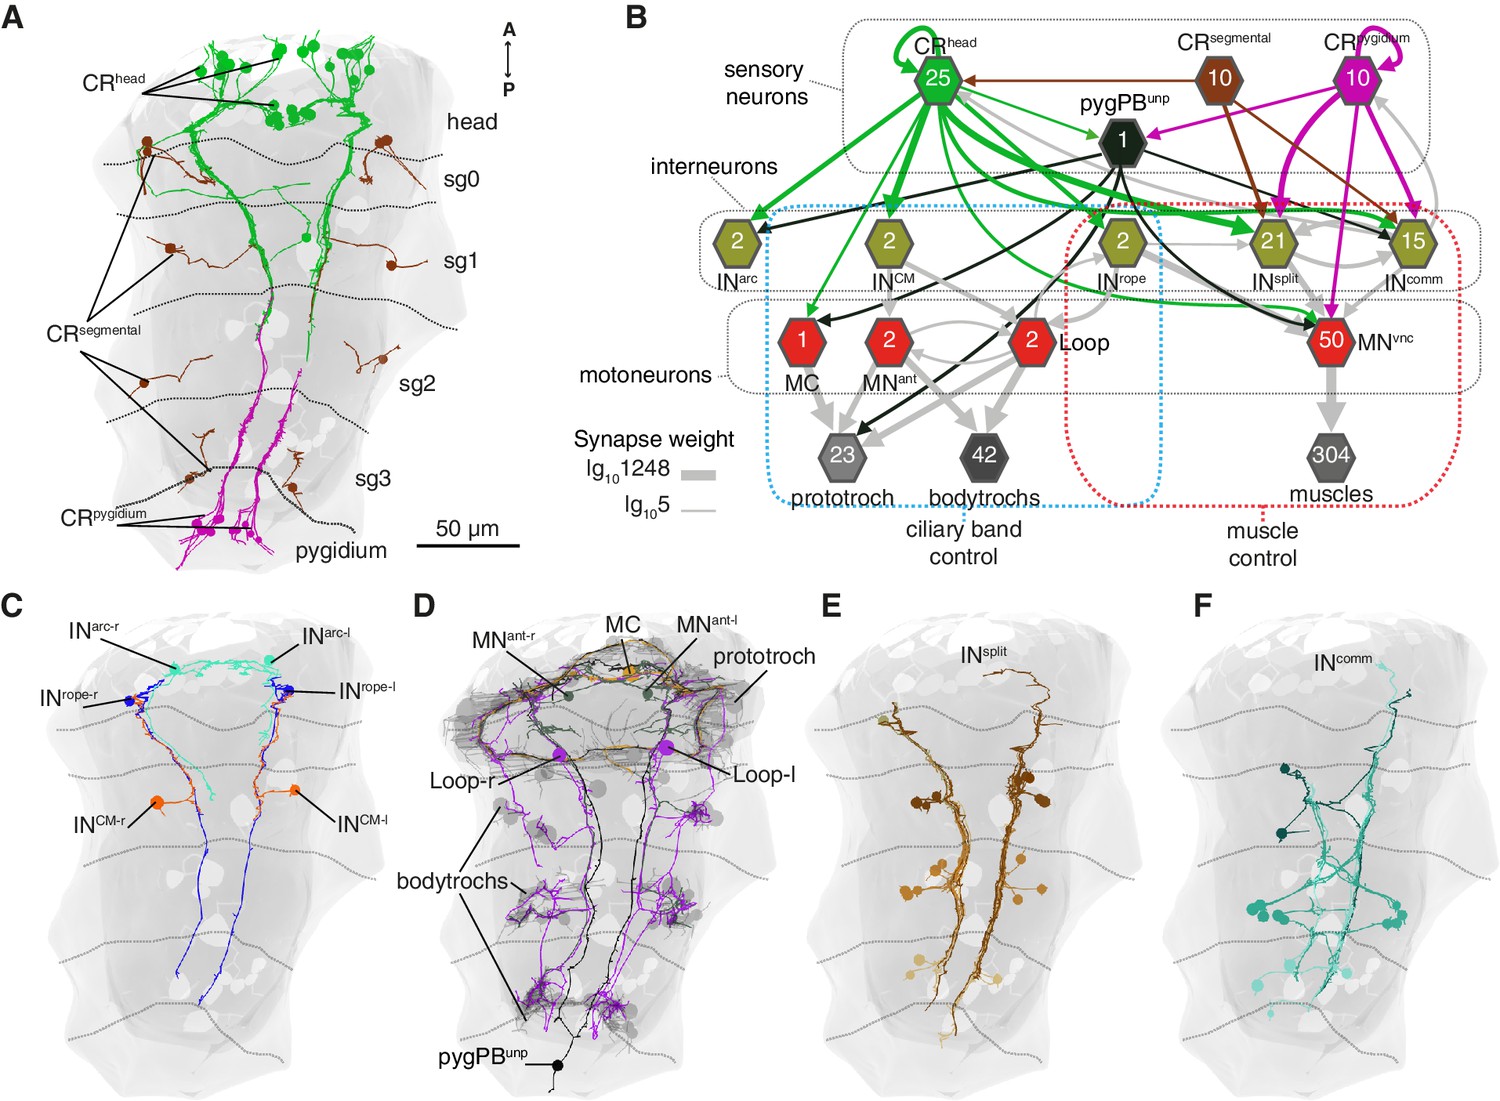
Wiring diagram of CR neurons.
(A) All CRs in the nectochaete larva reconstructed from an EM volume. Head, segmental and pygidial groups are differently coloured. Segment (sg) boundaries are indicated by dotted lines. (B) Sensory-motor network from CR neurons to muscles and locomotory cilia. Hexagons and arrows represent neuron groups and their synaptic connections, respectively. Numbers inside hexagons indicate the number of neurons grouped in each node. Interactions with less than five synapses were filtered out in this display. Arrow line thickness (synapse weight) is equal to the common logarithm of the number of synapses (scale is shown on the bottom left of the panel). (C) EM reconstruction of INrope, INarc and INCM neurons. (D) Ciliomotor neurons targeted by CRs or by INCM (E) Ipsilateral split neurons (INsplit) (F) Commissural interneurons (INcomm). Ventral view in A, C-F. Segment boundaries as defined in A are overlaid in C-F.
-
Figure 6—source data 1
Full connectivity matrix, grouped.
- https://doi.org/10.7554/eLife.36262.035
-
Figure 6—source data 2
Full connectivity matrix, non-grouped.
Nomenclature example: INsplitCR_sg2r1:Split interneuron 1 in the second segment on the right side.
- https://doi.org/10.7554/eLife.36262.036
Figure 6—figure supplement 1
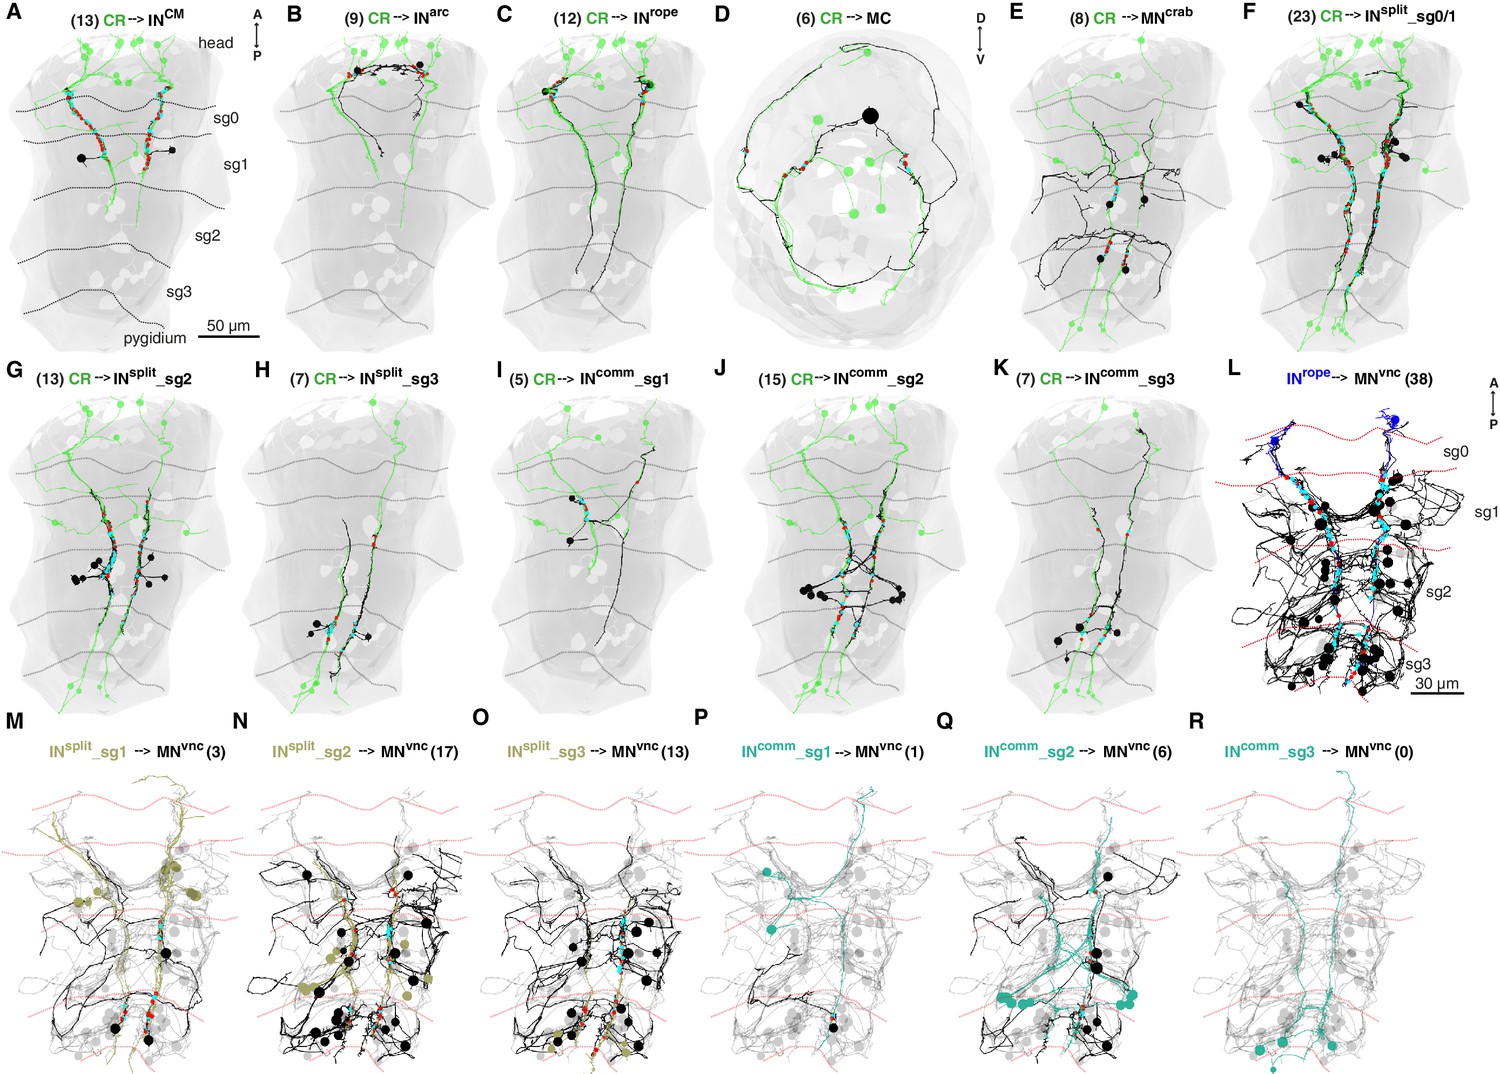
CR neurons target ipsilateral and commissural interneurons innervating VNC motoneurons.
(A–K) Electron microscopy volume reconstructions show subsets of CR neurons (green cells) target diverse classes of interneurons and motoneurons (black). Only head CRs target CM, Arc, MC and Rope neurons (A–D), while both head and tail CR neurons target the segmentally arranged Split, Commissural and Crab neurons (E–K). Commissural interneurons have heterogeneous axonal projections. Apical view in D. (L–R) Interneurons downstream of CR neurons (coloured) innervate distinct groups of VNC motoneurons (black). The complete set of (MNvnc) is coloured in light grey. All panels except D show ventral views. Number of cells in each group is indicated in parentheses. Incoming and outgoing synapses between groups are mapped (red and cyan dots, respectively).
Figure 6—figure supplement 2
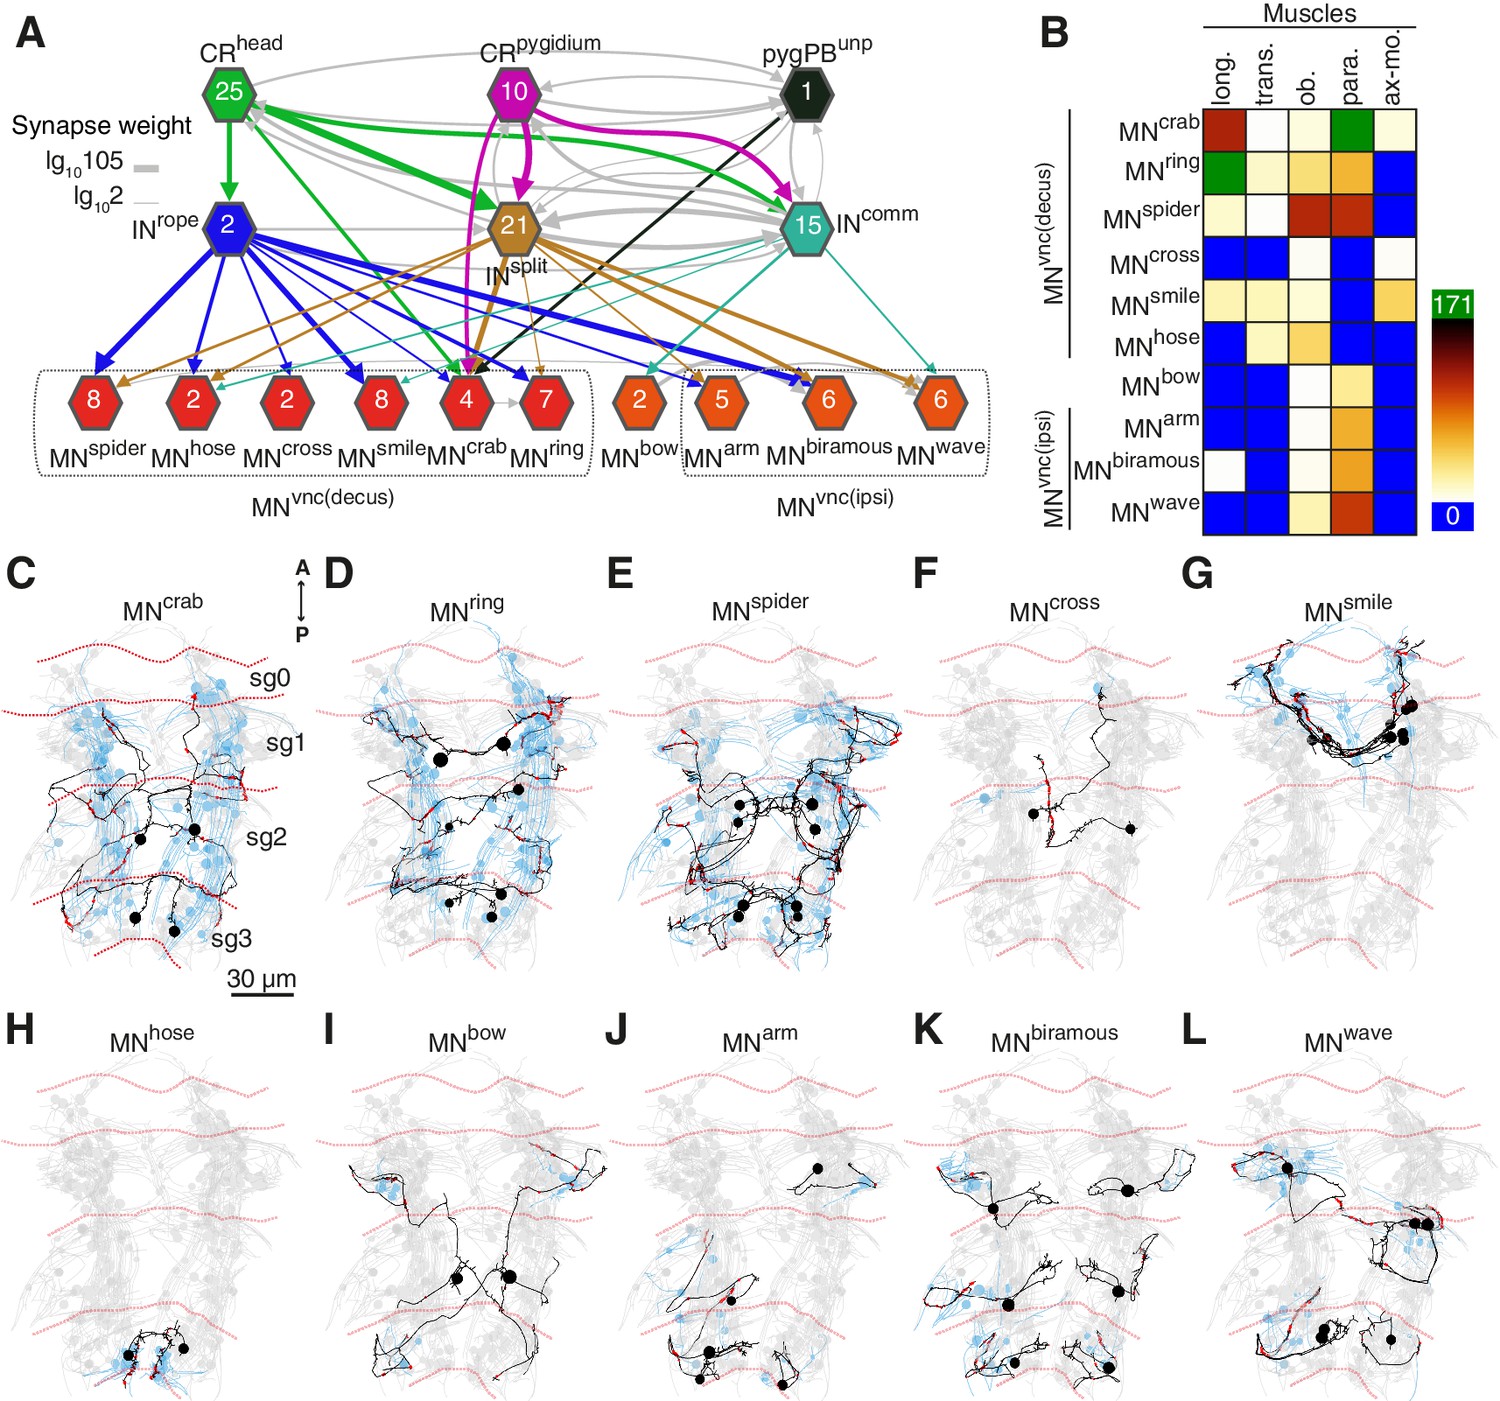
VNC musclemotor neuron classes in the CR neural network.
(A) Network from CR neurons to VNC motoneurons (MNvnc). Motoneurons are grouped by the 10 morphologically distinct types recognized and arranged by axonal projection patterns (decussating (MNvnc(decuss) or ipsilateral MNvnc(ipsi) (B) Connectivity matrix of motoneuron to muscle class. (C–L) Reconstructed morphologies of the distinct motoneuron types (black) and the muscles they innervate (blue). As a reference, all the 273 muscle cells targeted by the whole set of motoneurons are shown and coloured in light grey. Segment boundaries (sg) are indicated in C to L by dotted lines. Arrow line thickness (synapse weight) in A is equal to the common logarithm of the number of synapses.
Figure 6—figure supplement 3
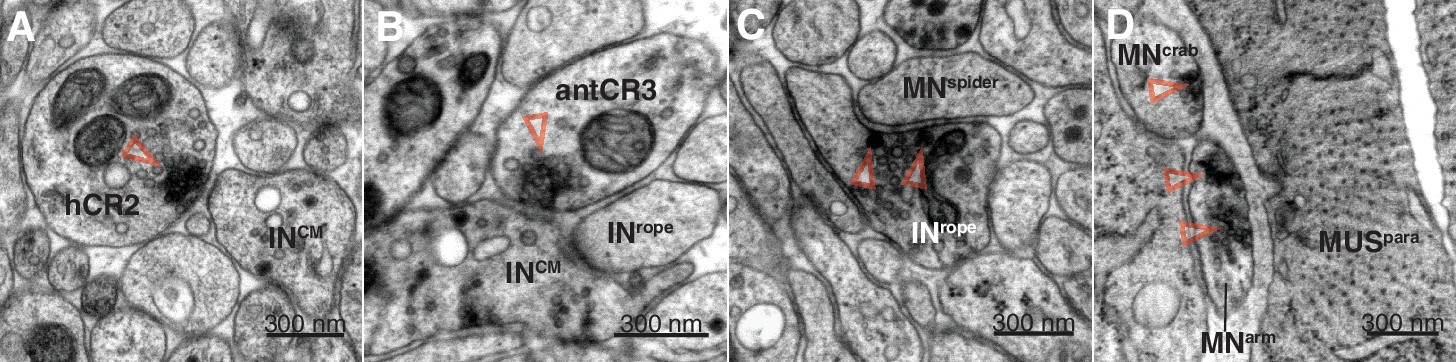
Synaptic connections in the startle circuit.
(A to D) Electron microscopy micrographs showing representative examples of synaptic contacts between neurons in the startle circuit. Synapses were defined as a visible accumulation of vesicles in the inner membrane of the presynaptic cell (red arrowheads). (A) hCR2 making synaptic contact to INCM. (B) antCR3 making synaptic contact to INCM. INrope is adjacent to both cells in this section. (C) INrope making synaptic contact onto MNspider. Two synaptic contacts were recorded in this section between these neurons. (D) Neuromuscular junction showing left side MNcrab and right side MNarm synapsing on one of the parapodial muscle cells (MUSpara). Synapses shown in A to D were included in the connectivity matrix reported in this study, but the resolution at which synapses were identified was lower than that of the images shown here.
Figure 7
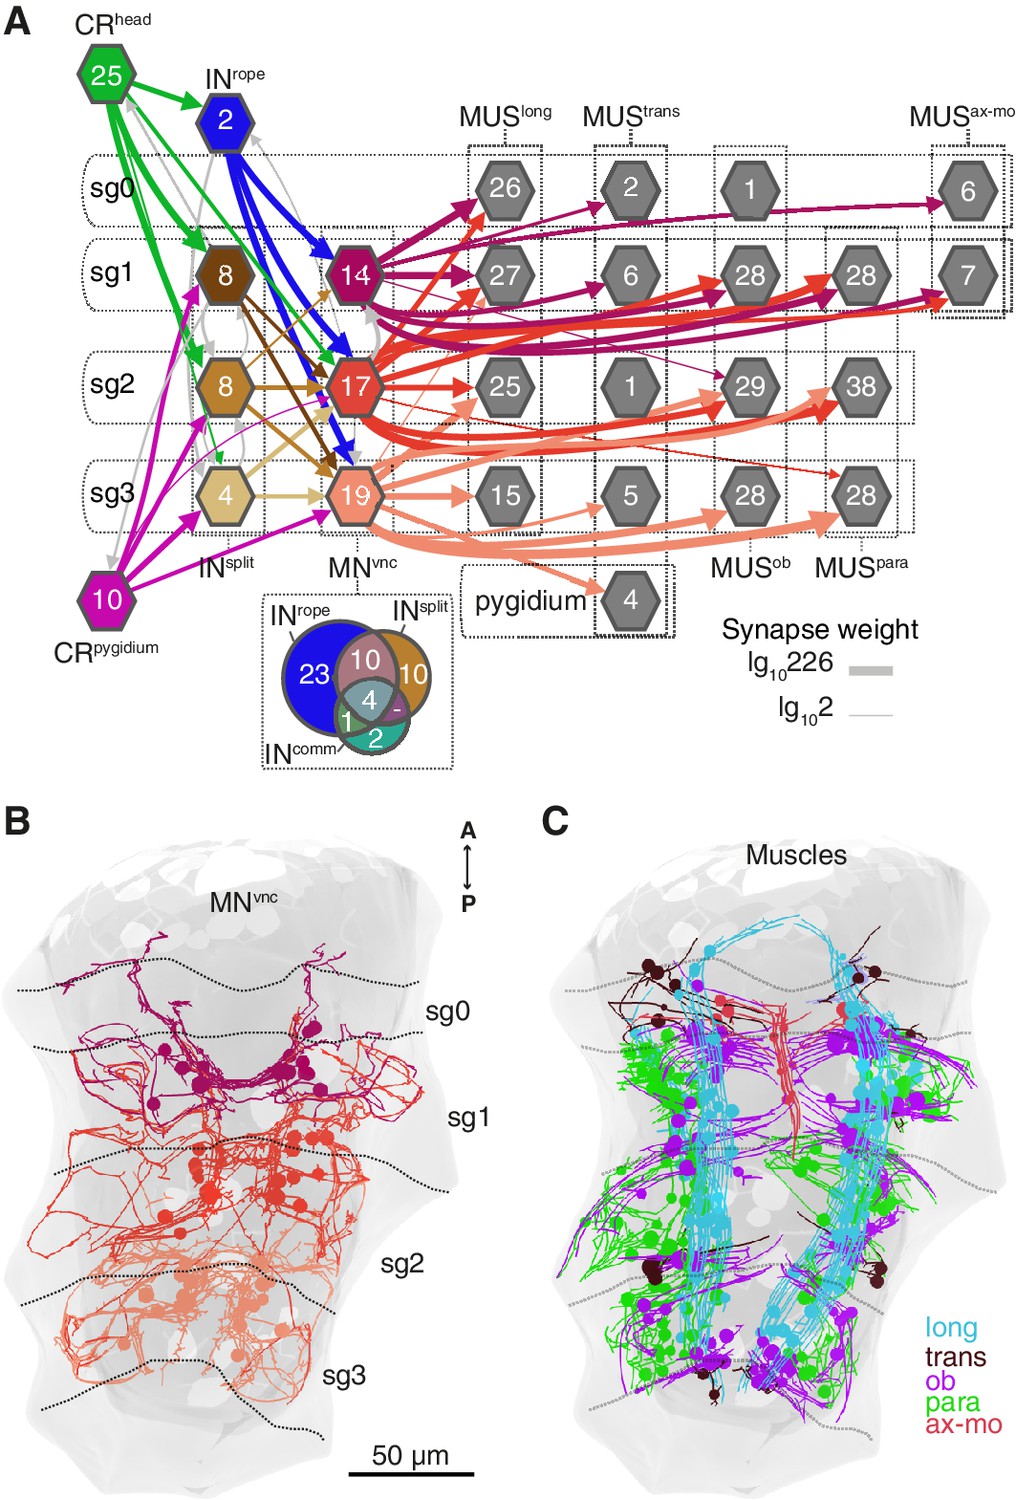
Segmental coordination motifs and musclemotor neuron diversity in the startle circuit.
(A) Muscle network downstream of INrope and INsplit sorted by segmental location and muscle type. Arrows represent synaptic connections and are coloured based on the source neuronal group (represented by hexagons). Venn diagram at the bottom of the network shows the number of common or unique VNC motoneurons (MNvnc) targets of INrope, INsplit, and INcomm. (B) MNvnc targeted by Rope and Split interneurons coloured by segmental location. (C) Muscles targeted by MNvnc neurons coloured by type (long, longitudinal; trans, transvers; ob, oblique; para, parapodial; ax-mo, axochord-mouth). Segment (sg) boundaries are indicated by dotted lines in A and C. Arrow line thickness (synapse weight) in A is equal to the common logarithm of the number of synapses.
Figure 8
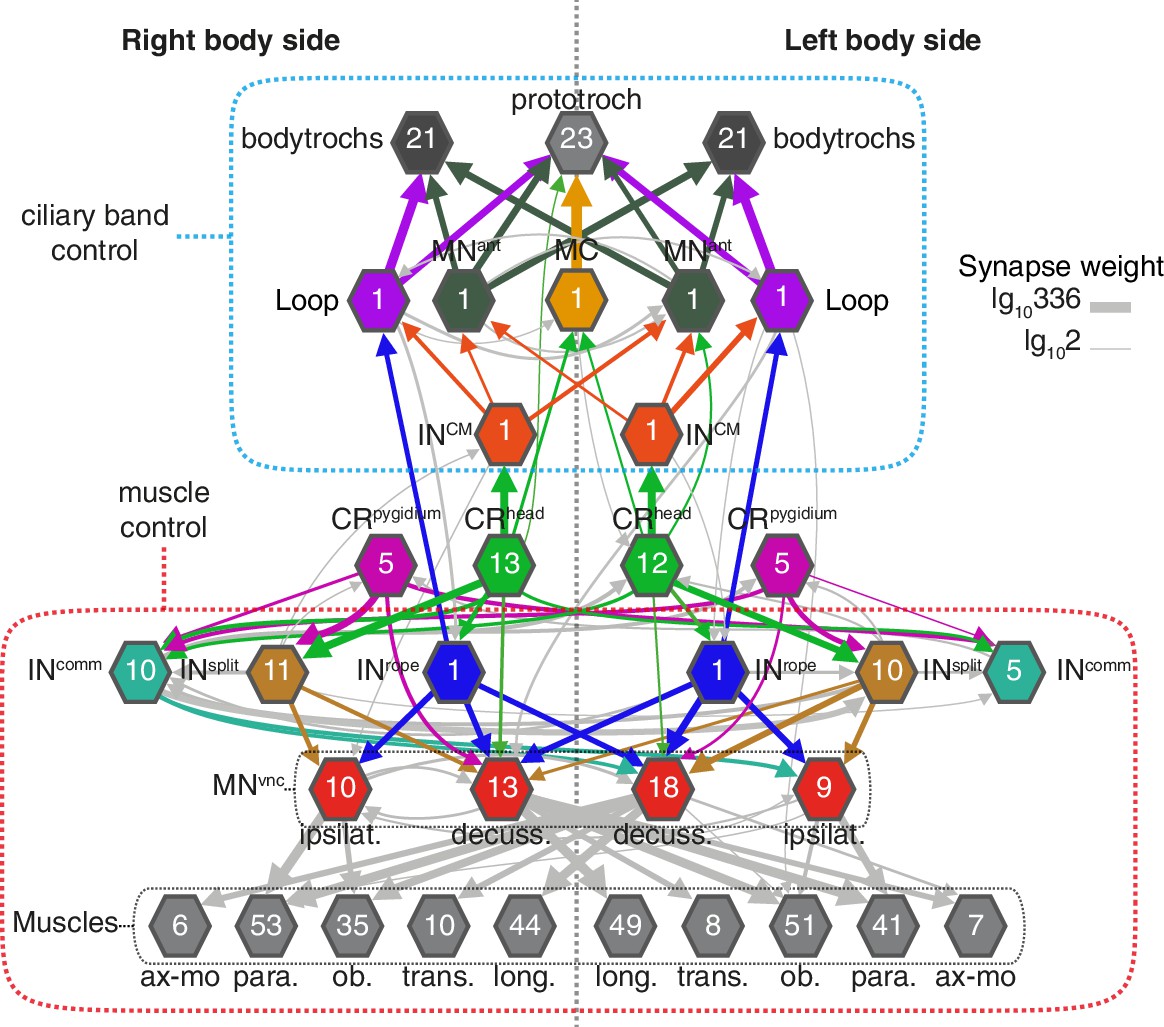
Bilateral coordination motifs in the startle circuit.
Muscle and cilia network downstream of CRhead and CRpygidium sorted by body side. Numbers inside hexagons indicate the number of neurons grouped in each node. Interactions with less than two synapses were filtered out. Arrow line thickness (synapse weight) is equal to the common logarithm of the number of synapses.
Figure 9
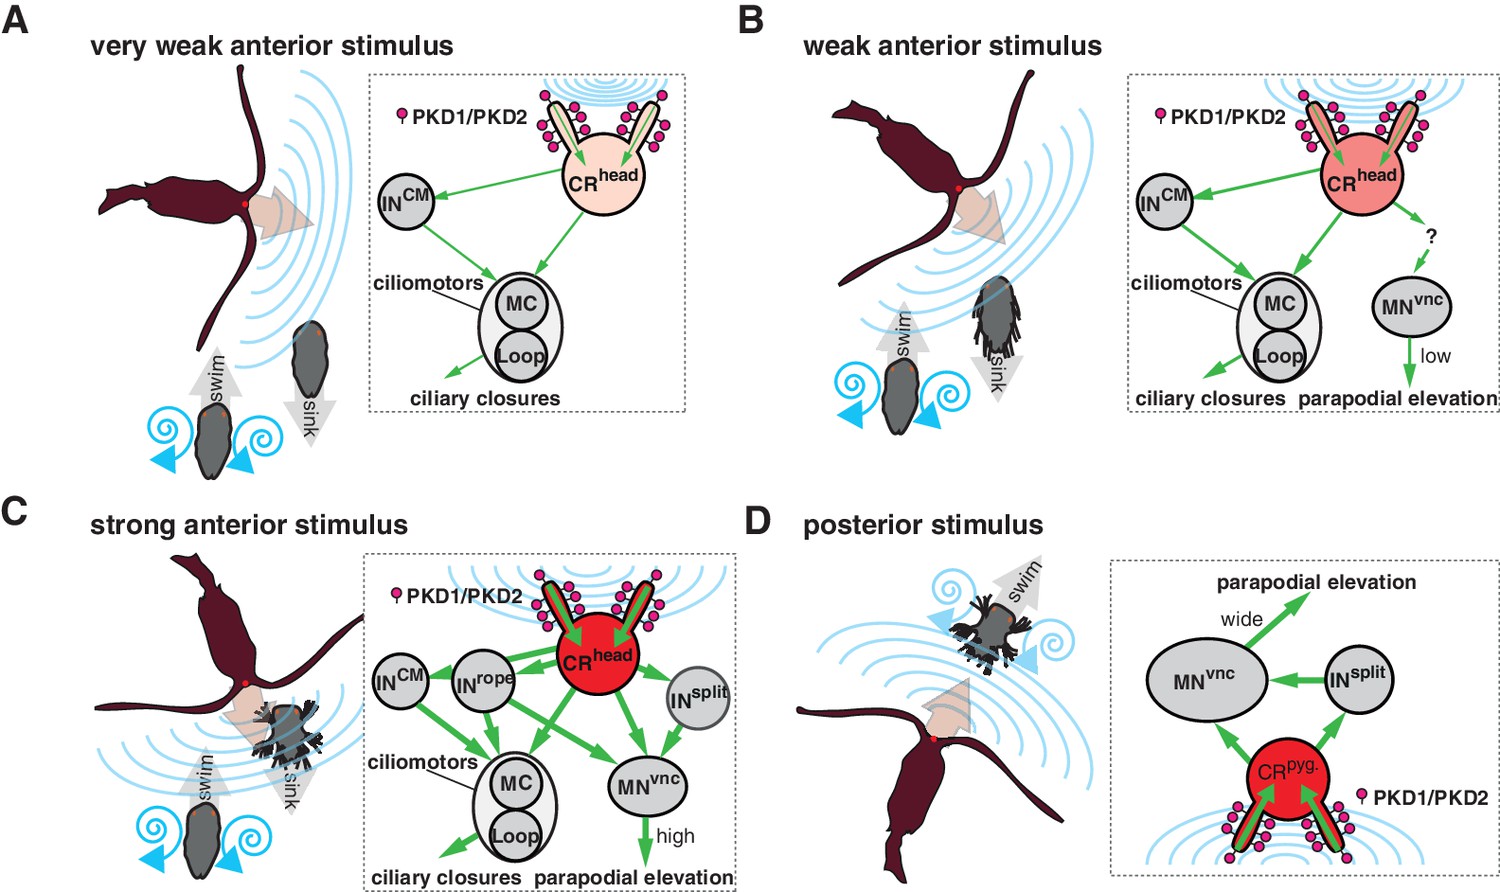
Summary schematics of the proposed neural implementations behind the startle response in different predator-prey scenarios.
(A–D) Different interaction scenarios between a predatory copepod (brown) and a nectochaete Platynereis larva (grey) are schematized on the left side of each panel. Blue lines schematize hydrodynamic signals produced by the copepod or the larva. Arrows indicate the direction of movement. Inset on the right of each panel shows the proposed cellular/circuit implementation behind the corresponding larval response shown to the left. Green arrows indicate the direction of propagation of the signal. PKD1-1 and PKD2-1 (symbolized as lollipops) localize to CRs, which transduce a signal of different intensity (shown with different tones of red) depending on the strength of the hydrodynamic signal (blue lines).
Videos
Video 1
Startle response of Platynereis larvae.
Time relative to start of stimulus.
Video 2
Graded startle responses of a glued Platynereis larva stimulated with a vibrating filament.
Low stimulus intensity triggers ciliary closures only (as assessed by stop of the fluorescent beads around the larva), intermediate stimulation induces ciliary closures and low-angle parapodial elevation, and high intensity stimulation induces ciliary closures and wide-angle parapodial elevation (WideE). Time is relative to stimulus start.
Video 3
Flow field generated by beating cilia around a glued Platynereis larva.
Fluorescent beads were added in order to visualize flow. The stimulation needle is located in front of the larva. Some drops of dried glue are visible.
Video 4
Morphology of the hCR1 neurons marked with Palmi-tdTomato.
Circles track the dendrite projection towards the cilia of each hCR1.
Video 5
Calcium imaging from the hCR1 and MS1 neurons during a vibrational stimulation.
The larva is ubiquitously expressing Palmi-tdTomato and GCaMP6s. Time is relative to stimulus start.
Video 6
Calcium imaging from the hCR1 and MS1 neurons during a vibrational stimulation.
The stimulation filament and the deflection of the sensory cilia are visible. The larva is ubiquitously expressing Palmi-tdTomato and GCaMP6s.
Video 7
Immunostained nectochaete larva against 3xHA-Palmi-tdTomato expressed under the PKD1-1 promoter (PKD1-1p::Palmi-3xHA-tdTom) and counterstained against acetylated tubulin (AcTub).
Right: full body view, Left: close up of the head region. Green arrows point to the hCR1 and hCR2 cilia.
Video 8
No startle response in a PKD1-1i1/i1 mutant l Platynereis larva exposed to a high-intensity stimulus.
Time is relative to stimulus start.
Video 9
Copepod attack on either a wild type or a PKD2-1mut/mut mutant Platynereis larva.
https://doi.org/10.7554/eLife.36262.030
Video 10
Animation of the wiring diagram and neuronal morphology reconstructed from serial electron microscopy data.
Colours in wiring diagram (left) correspond to colours of neurons in 3D model of the larva (right).
Video 11
Calcium imaging from larval muscles during a startle response.
The larva is ubiquitously expressing Palmi-tdTomato and GCaMP6s. The contractions of the longitudinal, oblique and parapodial muscles are visible.
Tables
Key resources table
| Reagent type (species) or resource | Designation | Source or reference | Identifiers | Additional information |
|---|---|---|---|---|
| Gene (Platynereis dumerilii) | PKD1-1 | This paper | GenBank_Acc#: MH035679 | |
| Gene (P. dumerilii) | PKD2-1 | This paper | GenBank_Acc#: MH035677 | |
| Gene (P. dumerilii) | PKD2-2 | This paper | GenBank_Acc#: MH035678 | |
| Gene (P. dumerilii) | LOV-1 | This paper | GenBank_Acc#: MH035680 | |
| Strain, strain background (P. dumerilii) | Wild Type | Tübingen cultures, Max Planck Institute for Developmental Biology | NCBITaxon:6359 | |
| Strain, strain background (P. dumerilii) | PKD1-1Δ1/Δ1 | This paper | Progenitor:Tübingen WT strain using PKD1-1_truT1 gRNA | |
| Strain, strain background (P. dumerilii) | PKD1-1i1/i1 | This paper | Progenitor:Tübingen WT strain using PKD1-1_T5 gRNA | |
| Strain, strain background (P. dumerilii) | PKD2-1Δ137/Δ137; PKD2-1mut/mut | This paper | Progenitor:Tübingen WT strain using PKD2-1_truT2 gRNA | |
| Strain, strain background (P. dumerilii) | PKD2-1Δ5/Δ5; PKD2-1mut/mut | This paper | Progenitor:Tübingen WT strain using PKD2-1_truT2 gRNA | |
| Strain, strain background (P. dumerilii) | PKD2-1Δ137/Δ5; PKD2-1mut/mut | This paper | Progenitor:PKD2-1Δ5 and PKD2-1Δ137 allele-carrying strains. | |
| Strain, strain background (Centropages typicus) | Wild Type | National Institute for Aquatic Resources culture, Technical University of Denmark | NCBITaxon: 463189 | |
| Antibody | Goat anti-Mouse IgG (H + L) Cross-Adsorbed Secondary Antibody, Alexa Fluor 488 | ThermoFisher Scientific | Cat#:A11001 | (1:250) |
| Antibody | Goat anti-Rabbit IgG (H + L) Cross-Adsorbed Secondary Antibody, Alexa Fluor 633 | ThermoFisher Scientific | Cat#:A21070 | (1:250) |
| Antibody | Monoclonal Anti-Tubulin, Acetylated antibody produced in mouse | Sigma-Aldrich | Cat#:T6793, RRID:AB_477585 | (1:250) |
| Antibody | HA-Tag (C29F4) Rabbit mAb | Cell Signaling Technology | Cat#:3724P | (1:250) |
| Recombinant DNA reagent | pUC57-PKD2-1p::Palmi- 3xHA-tdTomato (plasmid) | This paper | Promoter construct: injected at 250 ng/μl | |
| Recombinant DNA reagent | pUC57-PKD1-1p::Palmi- 3xHA-tdTomato (plasmid) | This paper | Promoter construct: injected at 250 ng/μl | |
| Recombinant DNA reagent | pUC57-T7-RPP2-tdTomato- P2A-GCaMP6 (plasmid) | This paper | Used for generating tdTomato-P2A-GCaMP6s mRNA | |
| Recombinant DNA reagent | pMJ920 (plasmid) | DOI:10.7554/ eLife.00471 | Addgene_plasmid: #42234 | Laboratory of Jennifer Doudna |
| Recombinant DNA reagent | pUC57-T7-RPP2-hSpCas9- HA-2XNLS-GFP (plasmid) | This paper | Used for generating Cas9-GFP mRNA | |
| Recombinant DNA reagent | pGP-CMV-GCaMP6s (plasmid) | DOI:10.1038/ nature12354 | Addgene_plasmid: #40753 | Laboratory of Douglas Kim |
| Recombinant DNA reagent | pX335-U6-Chimeric_BB- CBh-hSpCas9n(D10A) (plasmid) | DOI:10.1126/ science.1231143 | Addgene_plasmid: #42335 | Laboratory of Feng Zhang |
| Recombinant DNA reagent | DR274 (plasmid) | DOI:10.1038/ nbt.2501 | Addgene_plasmid: #42250 | Laboratory of Keith Joung |
| Recombinant DNA reagent | PKD2-1_truT2 (plasmid) | This paper | Derived from Addgene plasmid 42250.Used for gRNA synthesis | |
| Recombinant DNA reagent | PKD1-1_truT1 (plasmid) | This paper | Derived from Addgene plasmid 42335.Used for gRNA synthesis | |
| Recombinant DNA reagent | PKD1-1_T5 (plasmid) | This paper | Derived from Addgene plasmid 42335.Used for gRNA synthesis | |
| Recombinant DNA reagent | pCRII-PKD2-1 (plasmid) | This paper | Used for synthesizing WMISH probes | |
| Recombinant DNA reagent | pCRII-PKD1-1 (plasmid) | This paper | Used for synthesizing WMISH probes | |
| Sequence-based reagent | PKD1-1-WMISH forward primer (5'- > 3') | This paper | TGTCTTTGTAACTGTTGGTCTGGT | |
| Sequence-based reagent | PKD1-1-WMISH reverse primer (5'- > 3') | This paper | ATGTTCCTCAGAGATTCCTTCATC | |
| Sequence-based reagent | PKD2-1 WMISH forward primer (5'- > 3') | This paper | TCCTCGTCATCATAATATCCATTG | |
| Sequence-based reagent | PKD2-1 WMISH reverse primer (5'- > 3') | This paper | CTCTCTTTGTTGAGTTGGTCCTTT | |
| Sequence-based reagent | PKD1-1 T5 (gRNA) | This paper | 20 ng/μl; AGGCGGATATCAGTGAAGCG; It generated i1 allele in PKD1-1. | |
| Sequence-based reagent | PKD1-1 truT1 (gRNA) | This paper | 20 ng/μl; TGTGTCAACTTTACCCCA. It generated Δ1 allele in PKD1-1. | |
| Sequence-based reagent | PKD2-1 truT2 (gRNA) | This paper | 20 ng/μl; GGGCCACCCGTCAGACTG. It generated Δ137 and Δ5 alleles in PKD2-1. | |
| Sequence-based reagent | PKD1-1_Genotyping- truT1andT5-forward primer (5'- > 3') | This paper | TCAAACTGGTCAAGATTAAATTCCAGA | |
| Sequence-based reagent | PKD1-1_Genotyping- truT1andT5-reverse primer (5'- > 3') | This paper | TCTATTTCACTAATGTTGTTCCTGATG | |
| Sequence-based reagent | PKD1-1 truT1-sequencing primer (5'- > 3') | This paper | TAAGTGAAGGTCACATACTCGTCAGT | |
| Sequence-based reagent | PKD1-1 T5-sequencing primer (5'- > 3') | This paper | TATGAGACTGAATGCACAATAGAGTTT | |
| Sequence-based reagent | PKD2-1_Genotyping-truT2- forward primer (5'- > 3') | This paper | CCCTTTGTGAGCAGGAGATGCCCTGC | |
| Sequence-based reagent | PKD2-1_Genotyping-truT2- reverse primer (5'- > 3') | This paper | CATGACCTGAGTGTAGTAGTACATGGT | |
| Sequence-based reagent | PKD2-1 truT2-sequencing primer (5'- > 3') | This paper | AACCTTCAAATATGTTCACTACAATCC | |
| Sequence-based reagent | BamHI-PKD1-1promoter forward primer (5'- > 3') | This paper | ATGGATCCGGAAGCCTGATAACAAAGTGAGTAGGAA | |
| Sequence-based reagent | AscI-PKD1-1promoter reverse primer (5'- > 3') | This paper | AAGGCGCGCCGCTCCTCCTCCAAGTGGCTCTACCATCTCCGTCTGTATC | |
| Sequence-based reagent | BamHI-PKD1-1promoter forward primer (5'- > 3') | This paper | ATGGATCCAATAAAATTTGAACCGAGGCCAATGGA | |
| Sequence-based reagent | AscI-PKD1-1promoter reverse primer (5'- > 3') | This paper | AAGGCGCGCCGCTCCTCCTCCGGGGCGTGACATCAGCCAGTAGTTGGT | |
| Commercial assay or kit | QuickExtract | Epicentre,US | Cat#:QE09050 | |
| Commercial assay or kit | MEGAshortscript T7 Transcription Kit | Ambion, ThermoFisher Scientific | Cat#:AM1354 | |
| Commercial assay or kit | mMESSAGE mMACHINE T7 ULTRA Transcription Kit | Ambion, ThermoFisher Scientific | Cat#:AM1345 | |
| Commercial assay or kit | MEGAclear Transcription Clean-Up Kit | Ambion, ThermoFisher Scientific | Cat#:AM1908 | |
| Chemical compound, drug | Mecamylamine | Sigma-Aldrich | Cat#:M9020 | 500 μM |
| Software, algorithm | Fiji | NIH | RRID:SCR_002285 | |
| Software, algorithm | R Project for Statistical Computing | R Foundation | RRID:SCR_001905 | |
| Software, algorithm | Imaris Version 8.0.0 | Bitplane, UK. | RRID:SCR_007370 | |
| Software, algorithm | CATMAID | DOI:10.1093/ bioinformatics/btp266 | RRID:SCR_006278 | |
| Software, algorithm | PhyML | DOI:10.1093/sysbio/ syq010 | RRID:SCR_014629 | |
| Software, algorithm | Gblocks | DOI:10.1080/ 10635150701472164 | RRID:SCR_015945 | |
| Other | Wormglu | GluStitch Inc. | ||
| Other | Fluoresbrite Multifluorescent Microspheres 1.00 µm | Polysciences Inc, US | Cat#:24062–5 | (1:1000) |
Additional files
-
Supplementary file 1
Summary of cells that form part of the CR wiring diagram, proposed function and the evidence supporting it.
- https://doi.org/10.7554/eLife.36262.043
-
Transparent reporting form
- https://doi.org/10.7554/eLife.36262.044
Download links
A two-part list of links to download the article, or parts of the article, in various formats.
Downloads (link to download the article as PDF)
Open citations (links to open the citations from this article in various online reference manager services)
Cite this article (links to download the citations from this article in formats compatible with various reference manager tools)
Neural circuitry of a polycystin-mediated hydrodynamic startle response for predator avoidance
eLife 7:e36262.
https://doi.org/10.7554/eLife.36262


