An expanded allosteric network in PTP1B by multitemperature crystallography, fragment screening, and covalent tethering
- University of California, San Francisco, United States
- Diamond Light Source, United Kingdom
- Utrecht University, Netherlands
- University of Oxford, United Kingdom
- University of Johannesburg, South Africa
Figures
Figure 1
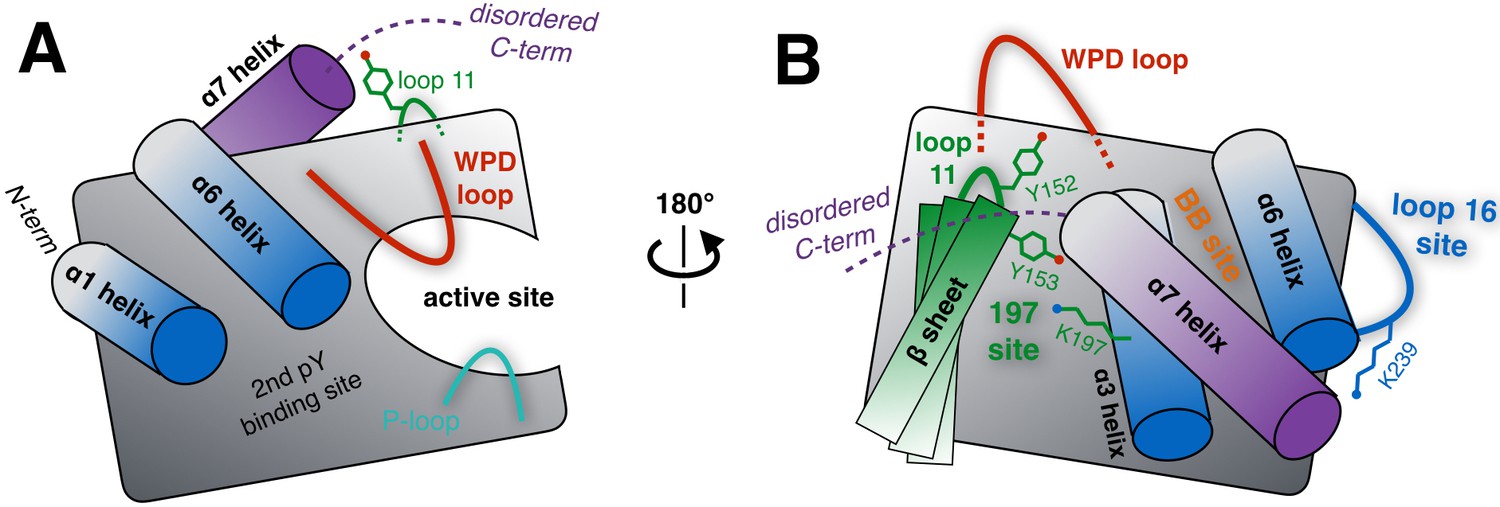
Schematic of key structural components in PTP1B.
(A) The ‘front side’ of PTP1B features the active site covered by the dynamic catalytic WPD loop, as well as several other structural elements relevant to substrate recognition and binding. The α6 helix next to the WPD loop leads into the α7 helix and disordered C-terminus, which are positioned near loop 11 (partially occluded in this view). (B) On the ‘back side’ of PTP1B, with the view rotated by roughly 180°, the α7 helix and disordered C-terminus sit atop the α3 helix, the α6 helix, and the edge of the central β sheet including loop 11. The pocket between the α3 helix and the β sheet includes several sidechains which interact with each other, leading to the ‘197 site’ (green). Elsewhere on the back side, a sidechain in loop 16 interacts with the α6-α7 connection to form the ‘loop 16 site’ or ‘L16 site’ (blue). These two allosteric sites are distinct from the previously established ‘BB site’ (orange) (Wiesmann et al., 2004), which is underneath the α7 helix that is displaced by BB allosteric inhibitor binding. As PTP1B transitions between its global states, many of the key structural components illustrated here undergo coordinated conformational changes, which together define the protein’s intrinsic allosteric circuitry.
Figure 2 with 5 supplements
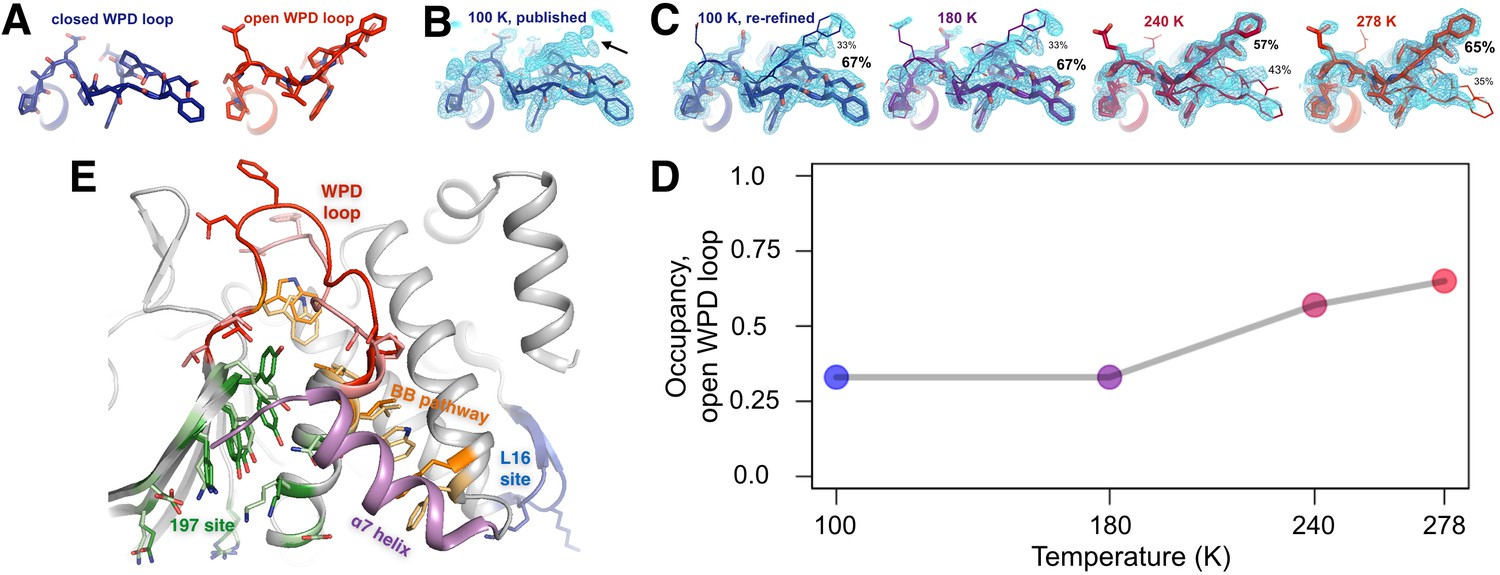
The conformational ensemble of the active-site WPD loop and allosterically coupled regions.
(A) The active-site WPD loop in PTP1B adopts either a closed conformation (example from PDB ID 1sug) or an open conformation (example from PDB ID 1t49). View from the ‘front side’ of PTP1B. (B) In the previously published apo structure of PTP1B, solved at 100 K (PDB ID 1sug), 0.8 σ 2Fo-Fc electron density (cyan) supports the modeled closed conformation, but substantial electron density remains unexplained (arrow). (C) Adding the open conformation of the WPD loop as a secondary conformation at partial occupancy accounts for this electron density. In structures solved at different elevated temperatures, electron density for the open conformation becomes more prominent as its occupancy (labeled) relative to the closed conformation increases. (D) The occupancy of the open conformation increases non-linearly with temperature. (E) Overall roadmap of allostery on the ‘back side’ of PTP1B, with the allosteric 197 site and loop 16 (L16) site highlighted in the context of the larger allosteric network including the previously established BB site, a7 helix, and WPD loop. Sidechains are shown in stick representation for several key residues in the WPD loop and allosteric regions. For those residues with alternative conformations at 278 K, both open-state (darker hues) and closed-state (lighter hues) conformations are shown. The viewing orientation in (A–C) is as in Figure 1A (‘front side’ of PTP1B), except zoomed in on the active site (labeled in Figure 1A). The viewing orientation in (E) is as in Figure 1B (‘back side’ of PTP1B).
Figure 2—figure supplement 1

The WPD loop adopts multiple conformations only in the absence of inhibitors.
36 structures from the PDB in the same space group as our datasets (P3121), originally modeled as only-open or only-closed, were naively re-refined with open and closed WPD loops modeled as alternative conformations with occupancies constrained to sum to 1. Almost all models have an active-site inhibitor bound. In P3121 the loop is free from any crystal contacts. (A-C) Representative examples of structures with the WPD loop originally modeled as closed or open (left, blue or red), and our re-refined dual-conformation models (right, purple). 1.0 σ 2Fo-Fc (cyan) and ±3.0 σ Fo-Fc electron density (green/red) are shown. (A) PDB ID 1sug: apo PTP1B; originally closed. 2Fo-Fc electron density supports the dual-conformation model; residual Fo-Fc density reflects partial-occupancy waters (Figure 2—figure supplement 2). (B) PDB ID 2f70: PTP1B in complex with an active-site inhibitor; originally closed. Fo-Fc electron density suggests the dual-conformation model is a poor fit. (C) PDB ID 2f6f: PTP1B in complex with another active-site inhibitor; originally open. Fo-Fc electron density suggests the dual-conformation model is a poor fit. (D) Loop occupancies for the re-refined dual-conformation models are bimodal: either ~fully open (left) or ~fully closed (right). The curve is a fit to the histogram using kernel density estimation, and is shown to emphasize the bimodal nature of the distribution. The only exception is the one published apo structure in this space group (1sug), which can be successfully refined with partial open and closed occupancies. The viewing orientation in (A-C) is as in Figure 1A (‘front side’ of PTP1B), except zoomed in on the active site (labeled in Figure 1A).
Figure 2—figure supplement 2
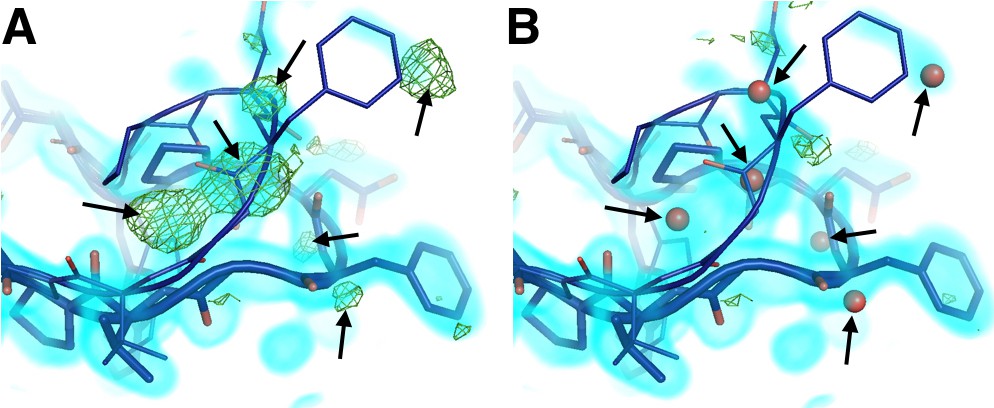
Mutually exclusive partial-occupancy protein and solvent atoms complicate model building.
(A) Although both closed and open WPD loop states are supported by 0.8 σ 2Fo-Fc electron density (cyan volume) in the 100 K apo PTP1B structure, several +3.2 σ Fo-Fc electron density (green mesh) remain unexplained (arrows). (B) Partial-occupancy waters (red spheres) with the opposite ‘altloc’ alternative conformation label as the closest protein atoms (‘A’ vs. ‘B’) dramatically reduce the difference density and better explain the data. See (Pedersen et al., 2004). The waters modeled here resemble water networks from either the closed-only (2f70) or the open-only (2f6f) structures. The viewing orientation in A–C) is as in Figure 1A (‘front side’ of PTP1B), except zoomed in on the active site (labeled in Figure 1A).
Figure 2—figure supplement 3

Radiation damage is minimal across all datasets.
Plots of Rd (Diederichs, 2006) versus frame-number difference for each dataset reveal little evidence for radiation damage. Statistics for WT apo at 100 K, which is from PDB ID 1sug, are not shown.
Figure 2—video 1
Movie version with five scenes: Figure 2B then Figure 2C.
https://doi.org/10.7554/eLife.36307.008
Figure 2—video 2
Movie version of Figure 2E.
https://doi.org/10.7554/eLife.36307.009
Figure 3 with 3 supplements
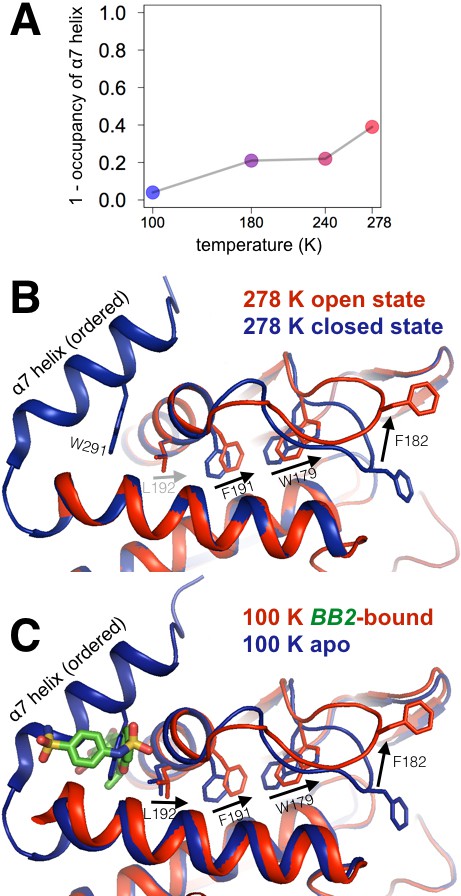
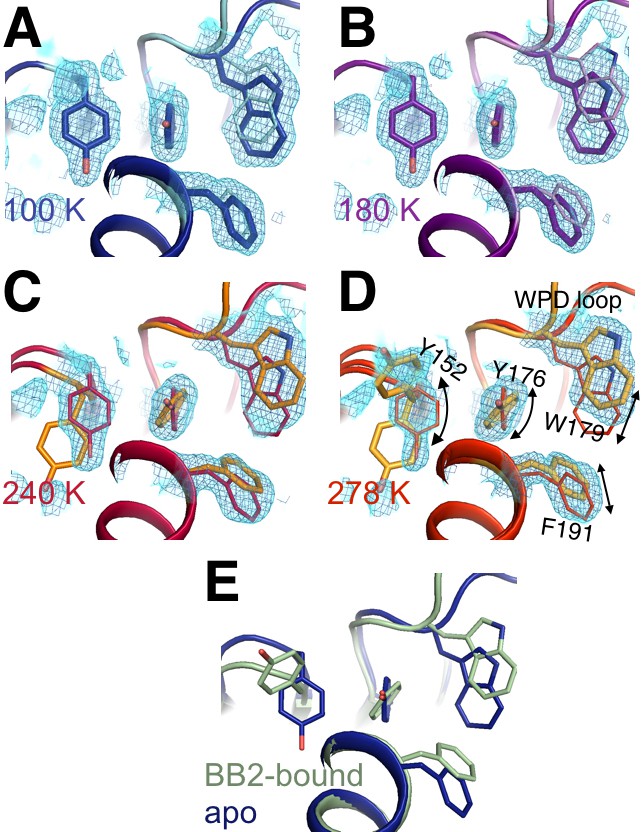
Multitemperature crystallography of apo PTP1B recapitulates an allosteric mechanism.
(A) In apo PTP1B, the occupancy of the α7 helix decreases (i.e. the helix becomes more disordered) with temperature. The helix was modeled with one conformation and its occupancy was refined; the remaining occupancy corresponds to the disordered state of the helix. (B) Several residues that allosterically link α7 and the active-site WPD loop also undergo shifts with temperature. (C) These additional conformations match the state trapped by the allosteric inhibitor BB2 (PDB 1t49) (Wiesmann et al., 2004) which binds >12 Å away from the active site. The viewing orientation in (B–C) is as in Figure 1A (‘front side’ of PTP1B), except slightly zoomed in.
Figure 3—figure supplement 1
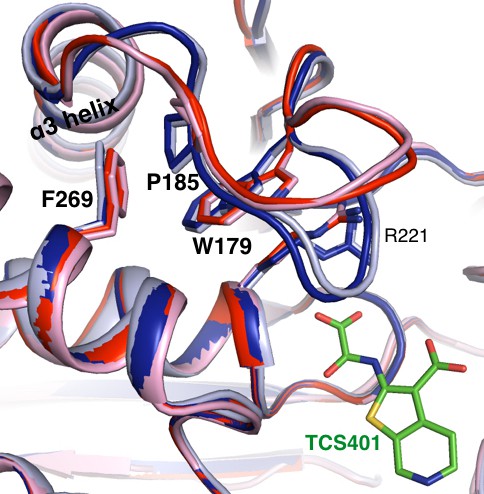
Alternative conformations in apo PTP1B recapitulate a reported conformational switching mechanism in the active site during WPD loop closing.
Alternative conformations in our 278 K apo structure corresponding to the open state (red) vs. closed state (dark blue) recapitulate conformational changes for several residues (labeled) in the active site that undergo a CH/π-mediated switch between the open state (pink, 5k9v) and TCS401-inhibitor-bound closed state (light blue, 5k9w) (Choy et al., 2017). The viewing orientation is as in Figure 1A (‘front side’ of PTP1B), except zoomed in on the active site (labeled in Figure 1A).
Figure 3—figure supplement 2
Allosteric inhibitor binding quenches conformational heterogeneity regardless of temperature.
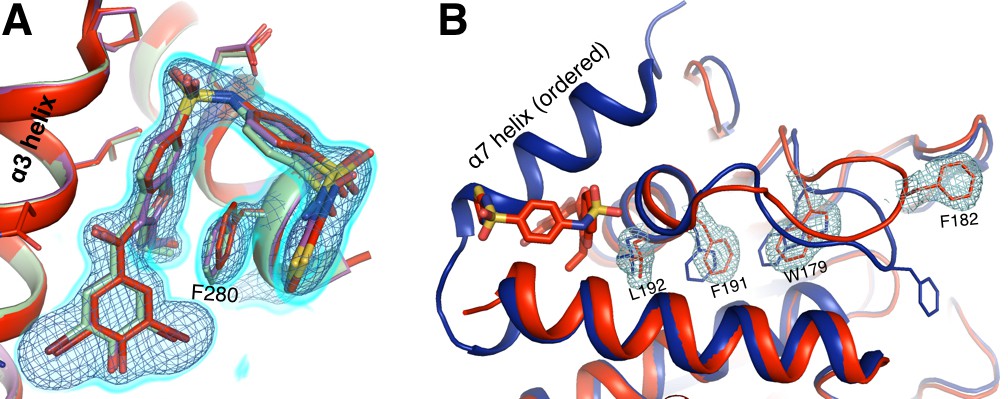
(A) The pose of BB3 in our new 1.80 Å 273 K structure (red) is well-justified by 2Fo-Fc electron density contoured at 0.75 σ (cyan volume) and at 1.5 σ (blue mesh). The pose is also essentially identical to the poses in previously published 100 K structures with BB3 (1t4j, magenta) and BB2 (1t49, pale green), which is very similar in structure and inhibition to BB3 (Wiesmann et al., 2004). (B) 2Fo-Fc electron density contoured at 0.75 σ (cyan) supports only a single conformation along the previously characterized allosteric pathway, rather than the multiple conformations seen at 278 K from our multitemperature apo PTP1B series (Figure 3); a 100 K structure in the closed state (1sug, blue) is shown for comparison. This confirms that inhibitor binding quenches conformational heterogeneity essentially completely, locking the protein in the open state. The viewing orientation in A) is as in Figure 1B (‘back side’ of PTP1B), except zoomed in on the BB site (labeled in Figure 1B). The viewing orientation in B) is as in Figure 1A (‘front side’ of PTP1B), except slightly zoomed in.
Figure 3—figure supplement 3
Allosteric-inhibitor-bound PTP1B has some low-occupancy conformations only at 273 K.
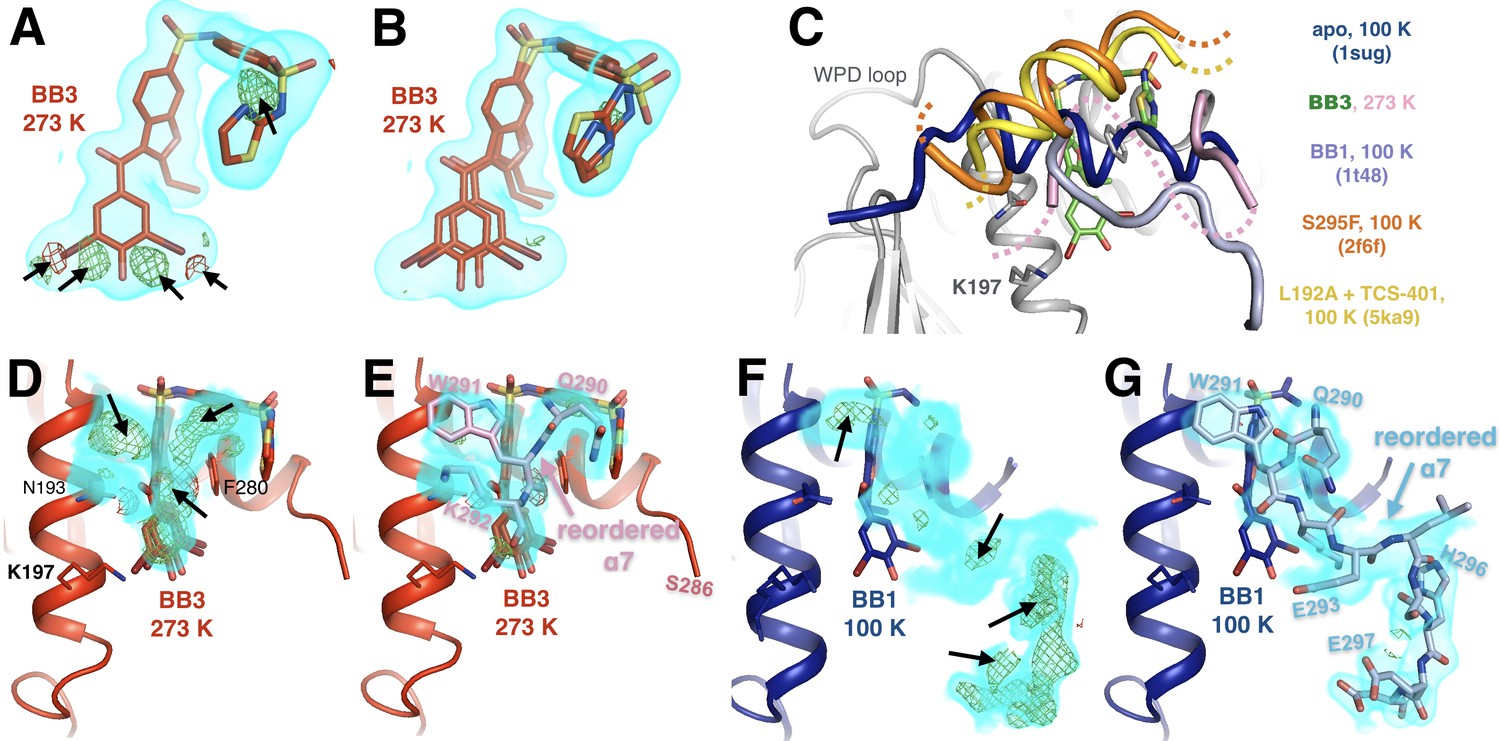
(A) At 273 K, despite a good fit to 2Fo-Fc electron density, shown contoured at 0.75 σ (cyan volume), the allosteric inhibitor BB3 cannot be sufficiently modeled with a single conformer, as evidenced by +3.5 σ (green mesh) and −3.5 σ (red mesh) Fo-Fc difference electron density. These features are absent from the 100 K structure with BB3 (1t4j). (B) These unexplained difference features disappear when a second alternate conformer is added with a translation at the ‘bottom’ of the molecule (from this viewing angle) and dihedral-angle changes at the ‘top right’. (C) The disordered α7 helix is reordered above the BB binding site in various structures: 273 K with BB3 (pink; BB3 molecule in green), 100 K with BB1 (pale blue, PDB ID 1t48), 100 K with the S295F mutation (orange, PDB ID 2f6f), and 100 K with the L192A mutation and the TCS-401 active-site inhibitor (yellow, PDB ID 5ka9). The normal ordered α7 conformation (blue, PDB ID 1sug) is shown for reference. See Figure 7A for another example of a reordered α7 conformation. (D–G) Evidence for some of the conformations in C. (D) At 273 K, 2Fo-Fc electron density contoured at 1.0 σ (cyan volume) and Fo-Fc difference electron density contoured at +3.5 σ (green mesh) and −3.5 σ (red mesh) suggest something remains unmodeled above the bound BB3 molecule. (E) Modeling a reordered portion of the disordered α7 helix, including Trp291 (pink), fits the 2Fo-Fc density, removes the positive Fo-Fc peaks, and has reasonable interactions with nearby sidechains on α3 (left). (F–G) At 100 K, the electron density (shown at the same contour levels) suggests a different reordered conformation of α7 above BB1 (PDB ID 1t48). Both reordered α7 conformations (D–E) vs. (F–G) place residues 290–292, including Trp291, in the same place. However, the C-terminal portion of the reordered conformation with BB1 at 100 K, including His296 (right), is sterically incompatible with the N-terminal portion of the α6-α7 junction with BB3 at 278 K, including Ser286. Neither conformation is compatible with the electron density for the other, suggesting that differences in temperature and/or inhibitor dictate different α7 conformations. The viewing orientation in C–G) is as in Figure 1B (‘back side’ of PTP1B), except zoomed in on the BB site (labeled in Figure 1B).
Figure 4 with 1 supplement
Both an allosteric inhibitor and high temperature favor an alternative conformation for an α7-coupled loop 16.
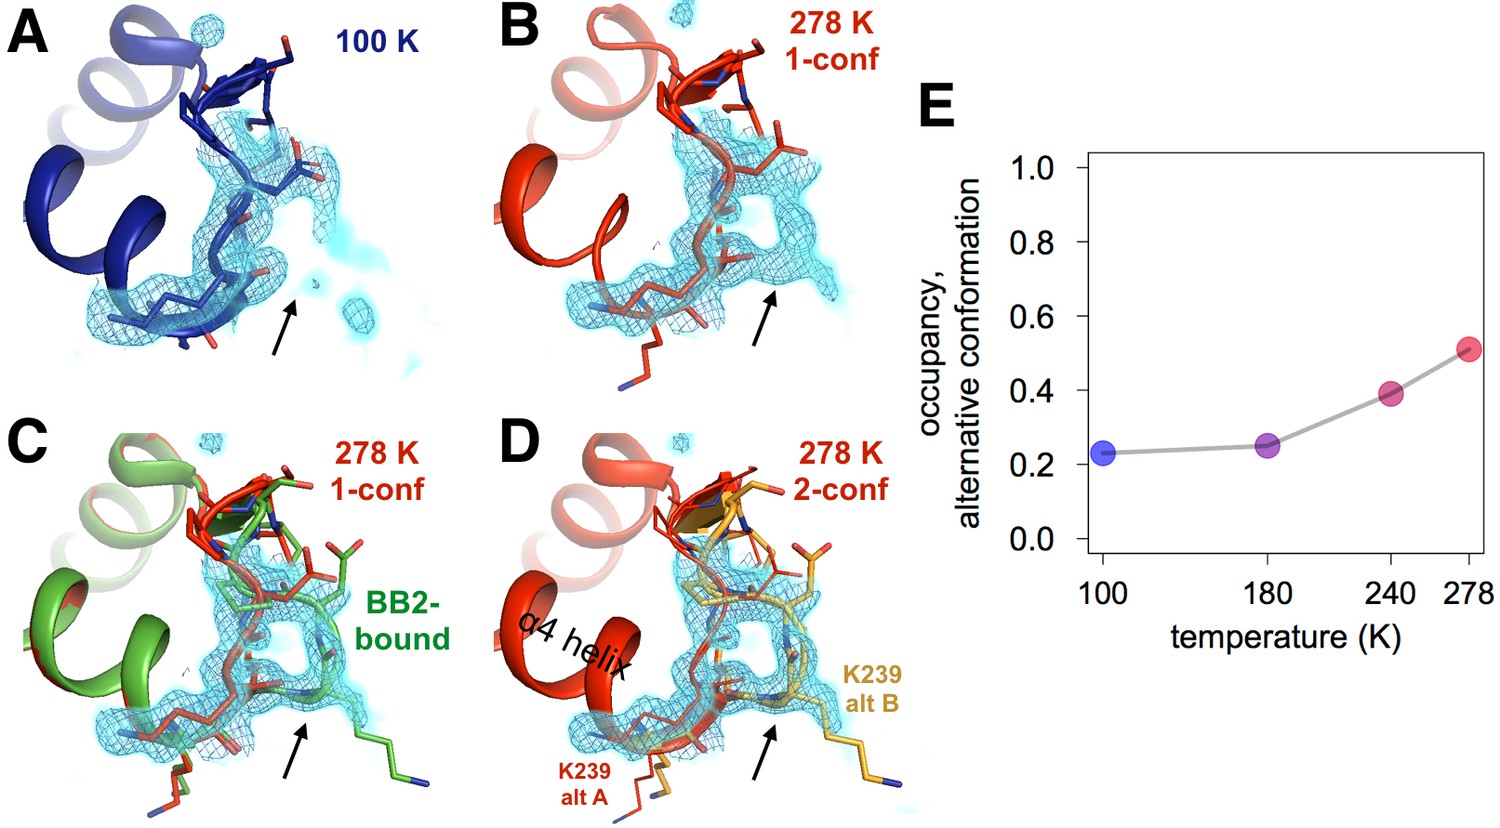
(A) At low temperature, loop 16 (residues 237–243, bottom right) is single-conformer, as evidenced by 2Fo-Fc electron density contoured at 1.0 σ (cyan volume) and at 1.0 σ (blue mesh). (B) At high temperature, when the protein is modeled as single-conformer, the electron density suggests the existence of an alternative conformation. (C) The structure with BB2 bound (>12 Å away) (PDB ID 1t49) perfectly explains the mysterious electron density. (D) The final 278 K dual-conformation model is a good explanation of the data. (E) The refined occupancy of the alternative conformation (state ‘B’) in apo PTP1B increases continuously but non-linearly with temperature. The viewing orientation in (A–D) is as in Figure 1B (‘back side’ of PTP1B), except zoomed in on the loop 16 site (labeled in Figure 1B).
Figure 4—figure supplement 1
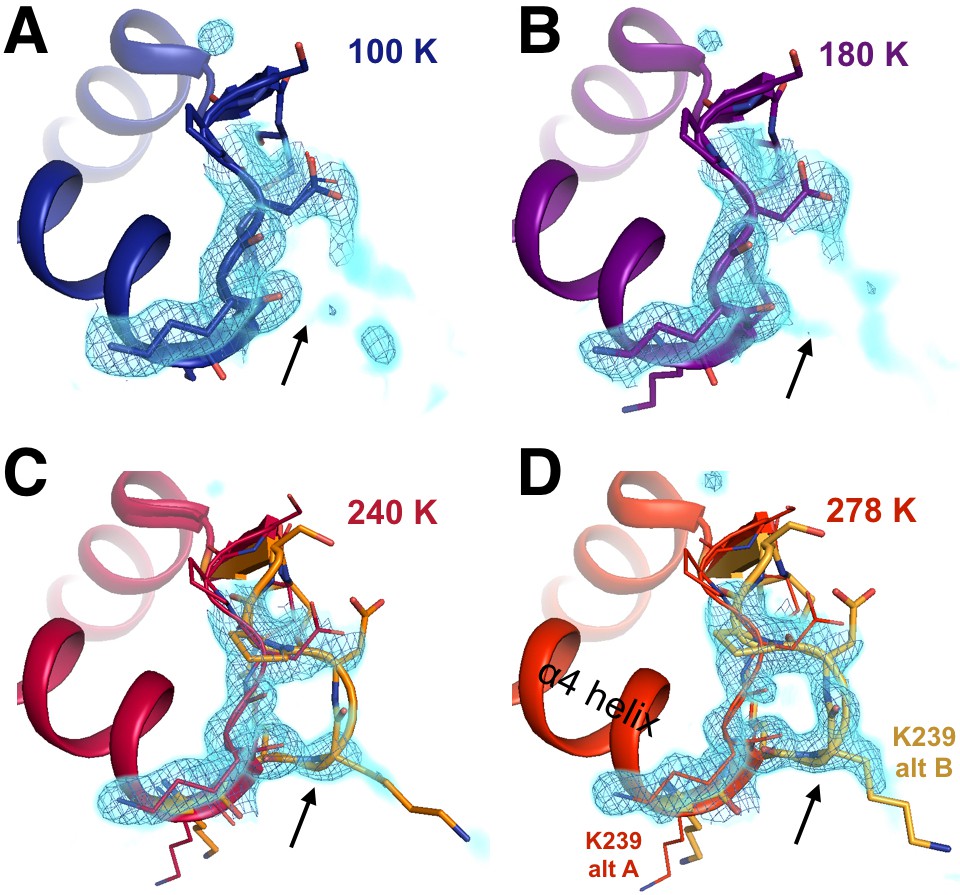
The conformational distribution of the α7-coupled loop 16 titrates with temperature.
The loop consisting of residues 237–243 (bottom right) is single-conformer at low temperatures including (A) 100 K and (B) 180 K, as evidenced by 2Fo-Fc electron density contoured at 1.0 σ (cyan volume) and at 1.0 σ (blue mesh). By contrast, it adopts multiple conformations at higher temperatures including (C) 240 K and (D) 278 K. The viewing orientation is as in Figure 4.
Figure 5 with 5 supplements
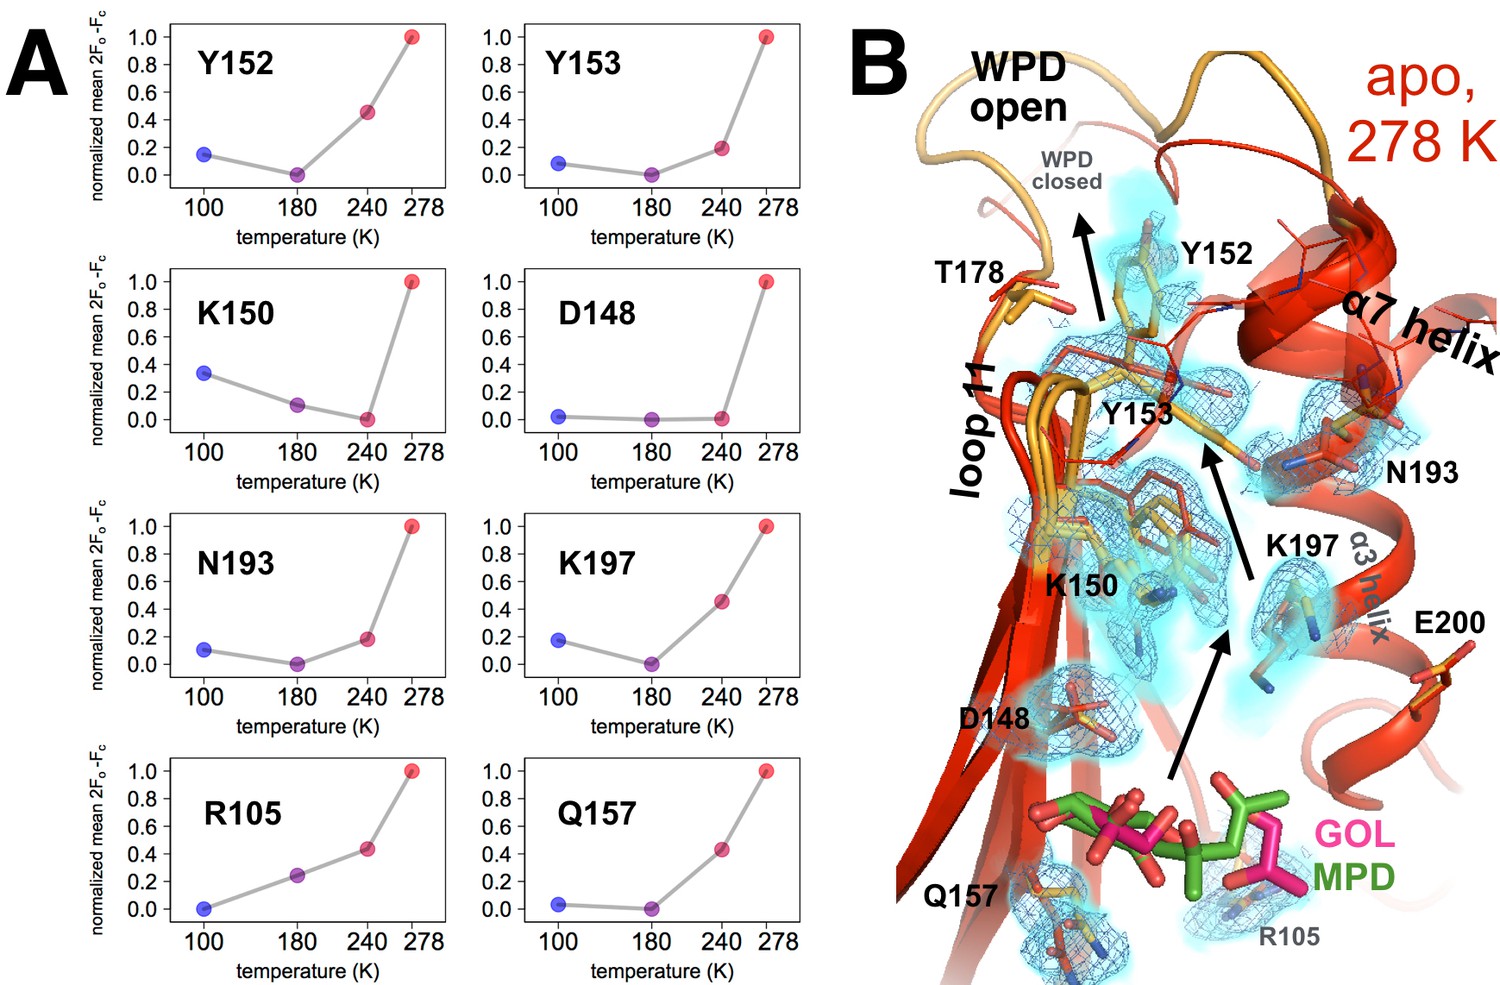
Coupled conformational heterogeneity leads to the allosteric 197 site.
(A) Several residues distinct from both the active site and a previously characterized allosteric network each have minor alternative conformations that become more populated with temperature. This is quantified by the sum of 2Fo-Fc electron density values for the centers of atoms that are unique to the minor state (defined as being at least 1.0 Å away from any atoms in the major state), normalized across temperatures from 0 to 1 for each residue. (B) These residues colocalize to a region of the protein surrounded by loop 11 (top-left), the quasi-ordered α7 helix (top-right), and the α3 helix (right), including the eponymous K197. 2Fo-Fc electron density contoured at 0.6 σ (cyan volume) and at 0.8 σ (blue mesh) justify multiple conformations for these residues in our 278 K apo model, as quantified in (A). The alternative conformations of these residues appear to interact with one another and thus may be allosterically coupled. Ordered crystallization mother liquor or cryoprotectant molecules (glycerols in pink, from the PDB and our structures, or MPD molecules in green, from the PDB) can be present at the terminus of this allosteric pathway, suggesting it may be amenable to binding other small molecules. The viewing orientation in B) is as in Figure 1B (‘back side’ of PTP1B), except zoomed in on the 197 site (labeled in Figure 1B).
Figure 5—figure supplement 1

Alternative conformations in apo PTP1B recapitulate and expand upon reported coupling between loop 11 and α3.
(A) Structures of the apo open state (yellow, 5k9v) and the closed state with the active-site inhibitor TCS401 (pink, 5k9w) (Choy et al., 2017) feature coupled movements of the loop 11 backbone, including Tyr152, and Asn193 within α7. (B–D) In our 278 K apo structure, we also observe coupling between these residues. However, Tyr152 is best fit with a ‘down’ plus an ‘up’ rotamer as alternative conformations for the open-state backbone, and only a down rotamer for the closed-state backbone. This is borne out by 2Fo-Fc electron density contoured at 0.3 σ (cyan volume) and Fo-Fc electron density contoured at +2.8 σ (green mesh) and −2.8 σ (red mesh) after refinement with either the down rotamer (C) or the up rotamer (D) omitted. A partial-occupancy water that is mutually exclusive with the up rotamer is also present (transparent red sphere). Note: Asn193 may also adopt another low-occupancy rotamer. (E) The down Tyr152 rotamer in the WPD-closed-compatible L11 backbone conformation (red) would sterically clash (pink pillows) with Thr178 in the open state of the WPD loop (orange). Both Tyr152 rotamers in the WPD-open state (orange) would sterically clash with the ordered conformation of the α7 helix (red). The viewing orientation in all panels is as in Figure 1B (‘back side’ of PTP1B), except zoomed in on loop 11, the α3 helix, and the α7 helix (labeled in Figure 1B).
Figure 5—figure supplement 2
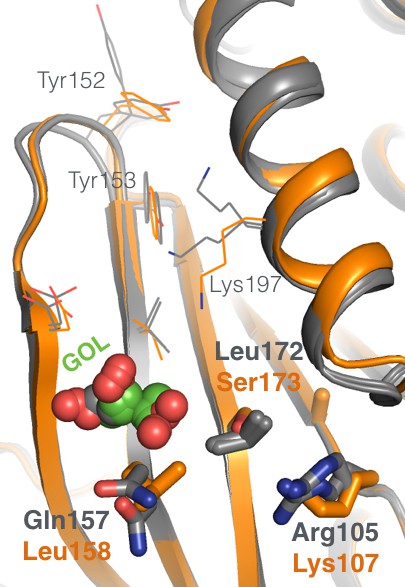
The allosteric 197 site has local sequence differences in related PTPs.
Several amino acids in the allosteric 197 site in PTP1B (gray) are different at the equivalent positions in the closest homolog, TCPTP (orange). The viewing orientation is as in Figure 1B (‘back side’ of PTP1B), except zoomed in on the 197 site (labeled in Figure 1B).
Figure 5—figure supplement 3
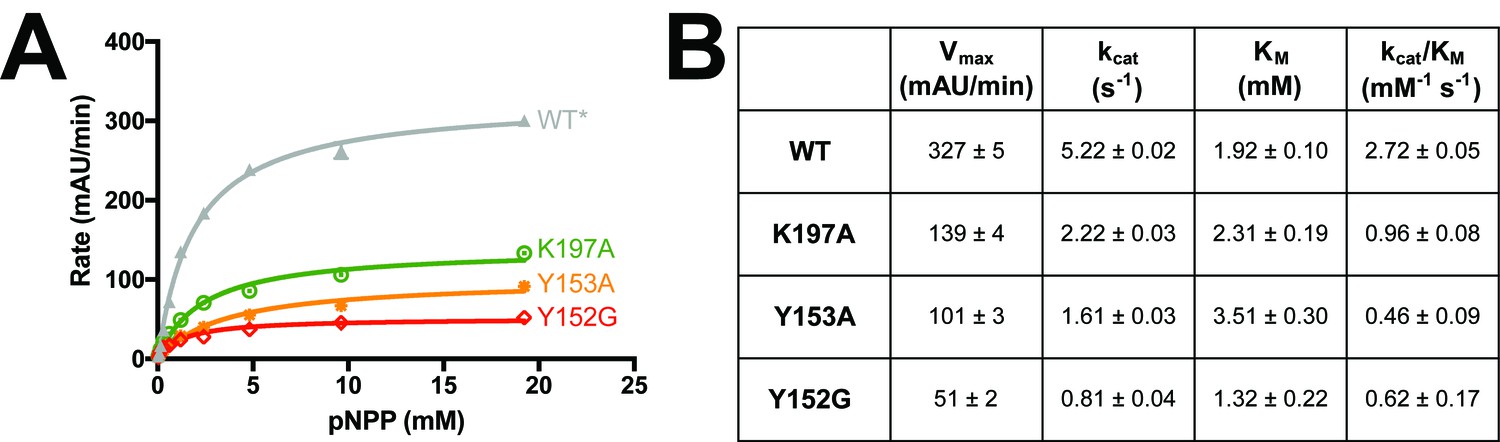
Mutations along the 197 site’s allosteric pathway reduce enzyme activity.
(A) Point mutations to several residues along the allosteric pathway from the allosteric 197 site to the active site reduce activity to varying degrees. Data represent the mean of four independent assays ± standard deviation. (B) Michaelis-Menten kinetics for WT* vs. allosteric point mutants ± the standard error of the mean. See Materials and methods for details.
Figure 5—figure supplement 4
Flexible aromatic residues complete an allosteric circuit.
Conformational heterogeneity for Tyr176 links Tyr152 in the allosteric 197 site to Phe191 in the previously reported allosteric pathway (Wiesmann et al., 2004) and Trp179 in the WPD loop, thus completing an allosteric circuit. (A-D) In apo PTP1B, 2Fo-Fc electron density contoured at 0.8 σ (cyan volume) and at 0.8 σ (blue mesh) generally justifies a single conformation these aromatic residues at low temperatures, but multiple conformations at high temperatures -- especially for Tyr176 and Tyr152. (E) These individual conformations are evident in the previously published 100 K apo (blue, 1sug) or BB2-bound (green, 1t49) structures, respectively. The viewing orientation in all panels is as in Figure 1B (‘back side’ of PTP1B), except looking down from the top of that image into the core of the protein.
Figure 5—video 1
Movie version of Figure 5B.
https://doi.org/10.7554/eLife.36307.023
Figure 6 with 1 supplement
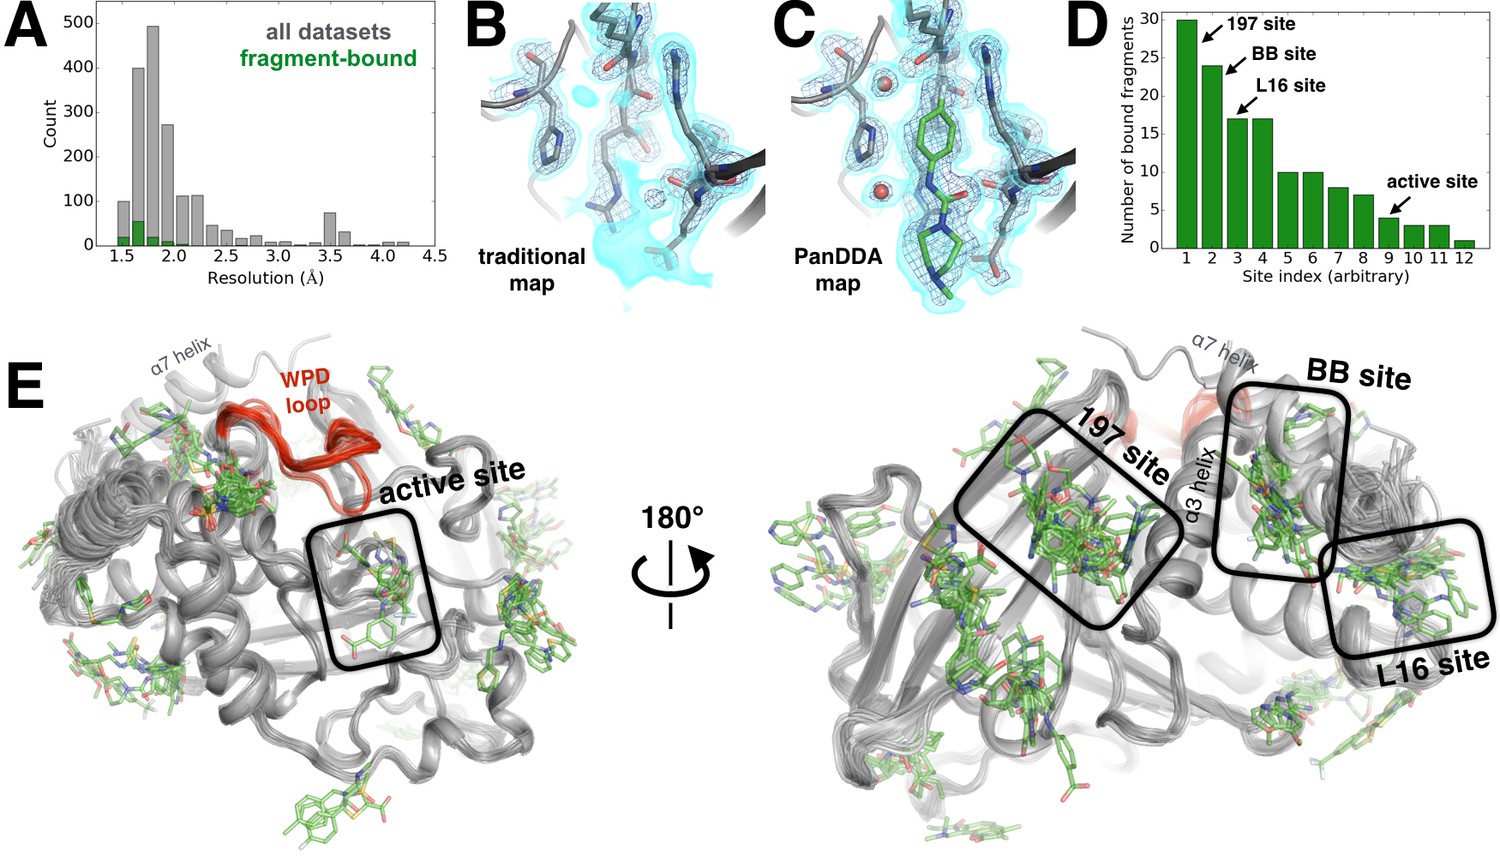
Electron-density background subtraction reveals small-molecule fragments at allosteric sites in PTP1B.
(A) Histogram of X-ray resolution for 1774 structures of PTP1B soaked with small-molecule fragments (gray) vs. the 110 structures from that set with small-molecule fragments bound to PTP1B (green). (B) For one example fragment, a traditional 2Fo-Fc map contoured at 1.25 σ (cyan volume) and at 3.5 σ (blue mesh) provides no clear evidence for a bound fragment. (C) By contrast, a background-subtracted PanDDA event map (85% background subtraction in this case) contoured at the same levels clearly reveals the precise pose of the bound fragment, plus additional ordered water molecules that accompany it (red spheres). (D) PanDDA analysis and manual inspection reveal 110 fragment-bound structures of PTP1B, with bound fragments clustered into 12 non-overlapping binding sites. Some structures contain multiple bound copies of the same fragment. Several sites of interest are labeled. (E) Overview of bound fragments across the PTP1B surface. Left: front of protein, facing active site (WPD loop open and closed conformations in red). Right: back of protein, facing several fragment-binding hotspots: the 197 site, BB site, and L16 site. The viewing orientation in E) (left) is as in Figure 1A (‘front side’ of PTP1B). The viewing orientation in E) (right) is as in Figure 1B (‘back side’ of PTP1B).
-
Figure 6—source data 1
Results of all 1966 fragment and DMSO soaks into PTP1B crystals.
For each crystal soak of DMSO (only 48 soaks) or a fragment (1918 soaks), we list temperature of data collection (almost always cryogenic at 100 K), resolution of data set collected (with ‘None’ for failed soaks), fragment name, SMILES string, fragment library, estimated occupancy (or occupancies) of primary bound ligand from PanDDA (or ‘None’ if no modelled ligand), and PDB ID. For a relatively small number of soaks, two fragments were soaked per crystal well (in 43 cases) or a database error led to uncertainty as to which of up to 16 fragments were soaked into the crystal (in 39 cases); in these cases, all possible fragments are listed. In 3 of these 82 cases, we identified and modeled the ligand from among the possibilities based on the electron density in the event map.
- https://doi.org/10.7554/eLife.36307.026
Figure 6—video 1
Movie version of Figure 6E.
https://doi.org/10.7554/eLife.36307.025
Figure 7 with 2 supplements

Fragments cluster at three binding hotspots distal from the active site.
(A) Twenty-four fragments (green) bind to the same site and in similar poses as the BB2 inhibitor (orange, PDB ID 1t49), and similarly displace the α7 helix (foreground, transparent blue, PDB ID 1sug). BB2 is also shown in the following panels to emphasize that its binding site is distinct from the other fragment-binding hotspots. One structure with a fragment bound in this site features a reordered conformation of the α7 helix (pink). (B) Seventeen fragments bind to the L16 site, where they may modulate the conformations of loop 16, the α6 helix, and the protein’s N-terminus on the α1 helix. (C) Thirty fragments bind to the 197 site in one primary subsite contacting K197, or a distinct secondary subsite nearby. The viewing orientation in (A) is as in Figure 1B (‘back side’ of PTP1B), except zoomed in on the BB site (labeled in Figure 1B). The viewing orientation in (B) is also as in Figure 1B, except looking left from the right of that image and zoomed in on the L16 and BB site site. The viewing orientation in A) is as also in Figure 1B, except zoomed in on the 197 site and BB site (labeled in Figure 1B). See also Figure 6E (right) for orientation.
-
Figure 7—source data 1
Crystallographic statistics for fragment-bound structures.
PDB ID, resolution, Rwork, Rfree, and MolProbity score are listed for the 110 fragment-bound ensemble structures.
- https://doi.org/10.7554/eLife.36307.030
-
Figure 7—source data 2
Small-molecule fragments tested in enzyme inhibition assays.
These 20 small-molecule fragments, which were thought to bind in or near either the 197 site or the loop 16 site in our structures early in our PanDDA analysis, were tested for inhibition of PTP1B using a pNPP activity assay in quadruplicate with 200 nM protein and 1 mM fragment in 2% DMSO (final). No inhibition was observed compared to no-fragment and no-protein controls.
- https://doi.org/10.7554/eLife.36307.031
Figure 7—figure supplement 1
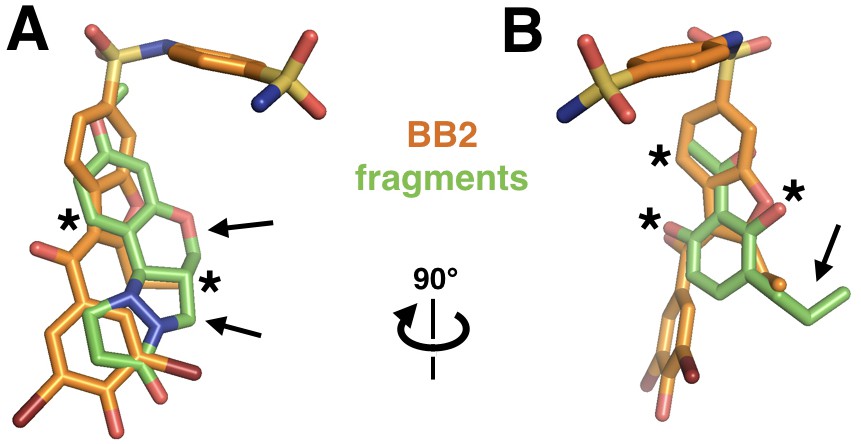
Fragments overlap with the BB allosteric inhibitor scaffold and suggest possible improvements.
Out of the 24 fragments that bind in the same site as BB2 (PDB ID 1t49, orange), two example fragments (green) are shown that overlap parts of BB2’s pose (asterisks), but also have chemical extensions that may be fruitfully added to the BB scaffold (arrows). (A) The first fragment has aromatic rings in roughly the same positions as does BB2 and a carbon matching a methyl extension in BB2, but in the fragment that carbon is part of two additional protruding rings. (B) The second fragment places two oxygens and a methyl in the same position as the equivalent atom types in BB2, but has a unique ethyl extension.
Figure 7—figure supplement 2
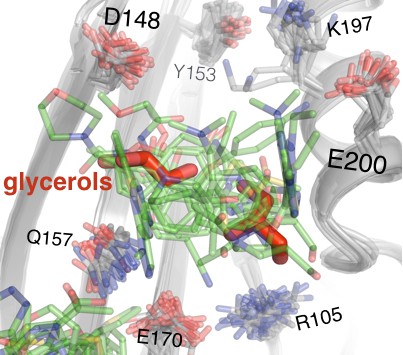
Fragments in the 197 site overlay with glycerols from multitemperature structures.
Fifteen fragments (green) in the primary subsite of the 197 site occupy a similar region of space as ordered glycerols (red) from our 278 K apo structure. The viewing orientation is as in Figure 1B (‘back side’ of PTP1B), except zoomed in on the 197 site (labeled in Figure 1B). See also Figure 6E (right) for orientation.
Figure 8 with 3 supplements
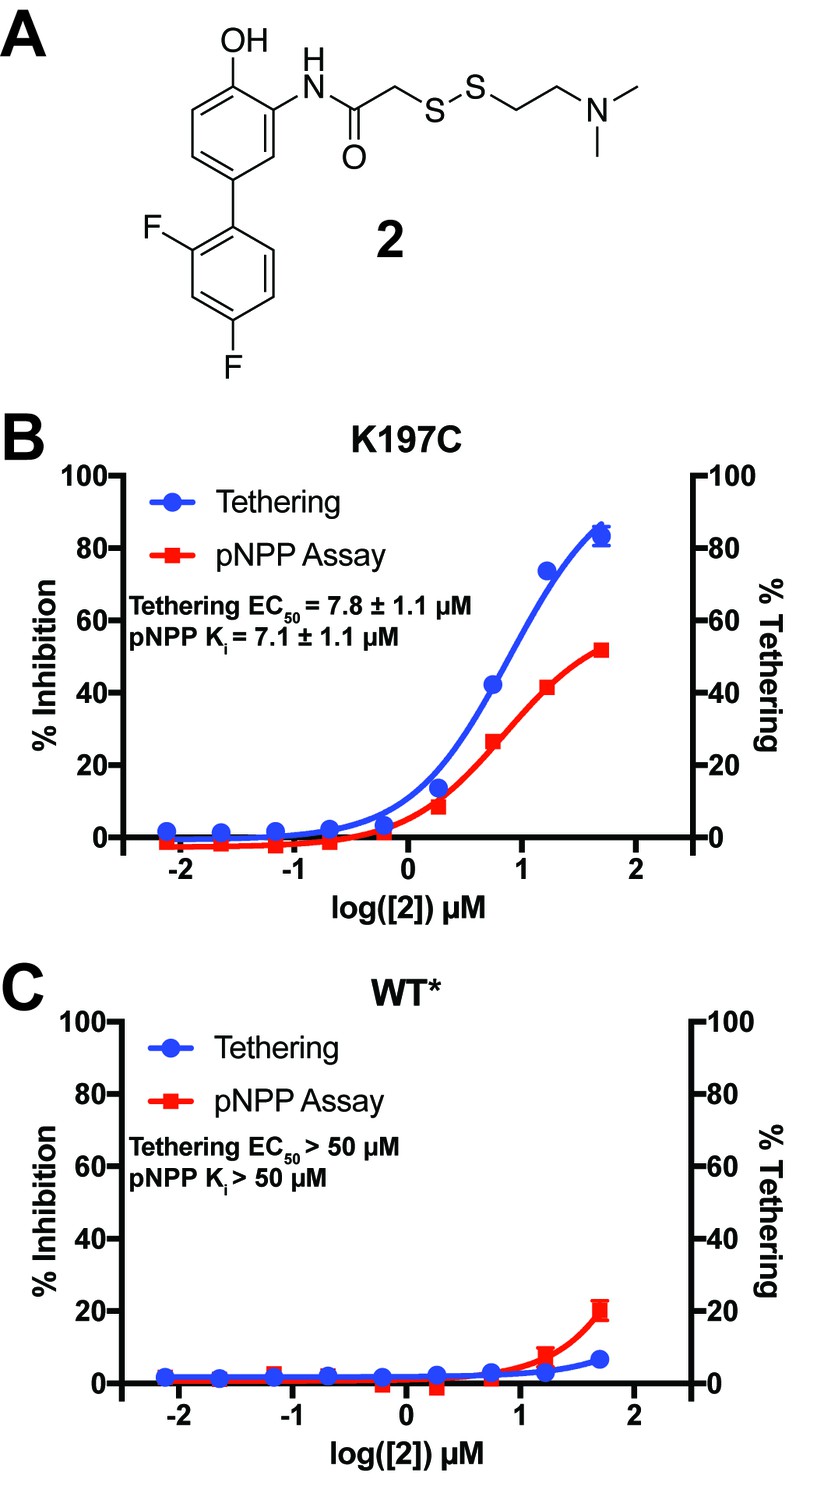
Characterization of a functional covalent allosteric inhibitor.
(A) The chemical structure of our covalent disulfide fragment 2. (B) Tethering and Inhibition of K197C at varying concentrations of 2. The tethering EC50 observed was 7.8 ± 1.1 µM and the Ki for pNPP activity was 7.1 ± 1.1 µM with a maximum inhibition of ~60%. Tethering data represents all tethering events combined. (C) Tethering and Inhibition of WT* at varying concentrations of 2. The tethering EC50 and the Ki for pNPP activity were both >50 µM. Tethering data represents all tethering events combined. Data represent the mean of three independent assays ± the standard error of the mean. All assays were performed in the presence of 100 µM of β-mercaptoethanol.
Figure 8—figure supplement 1
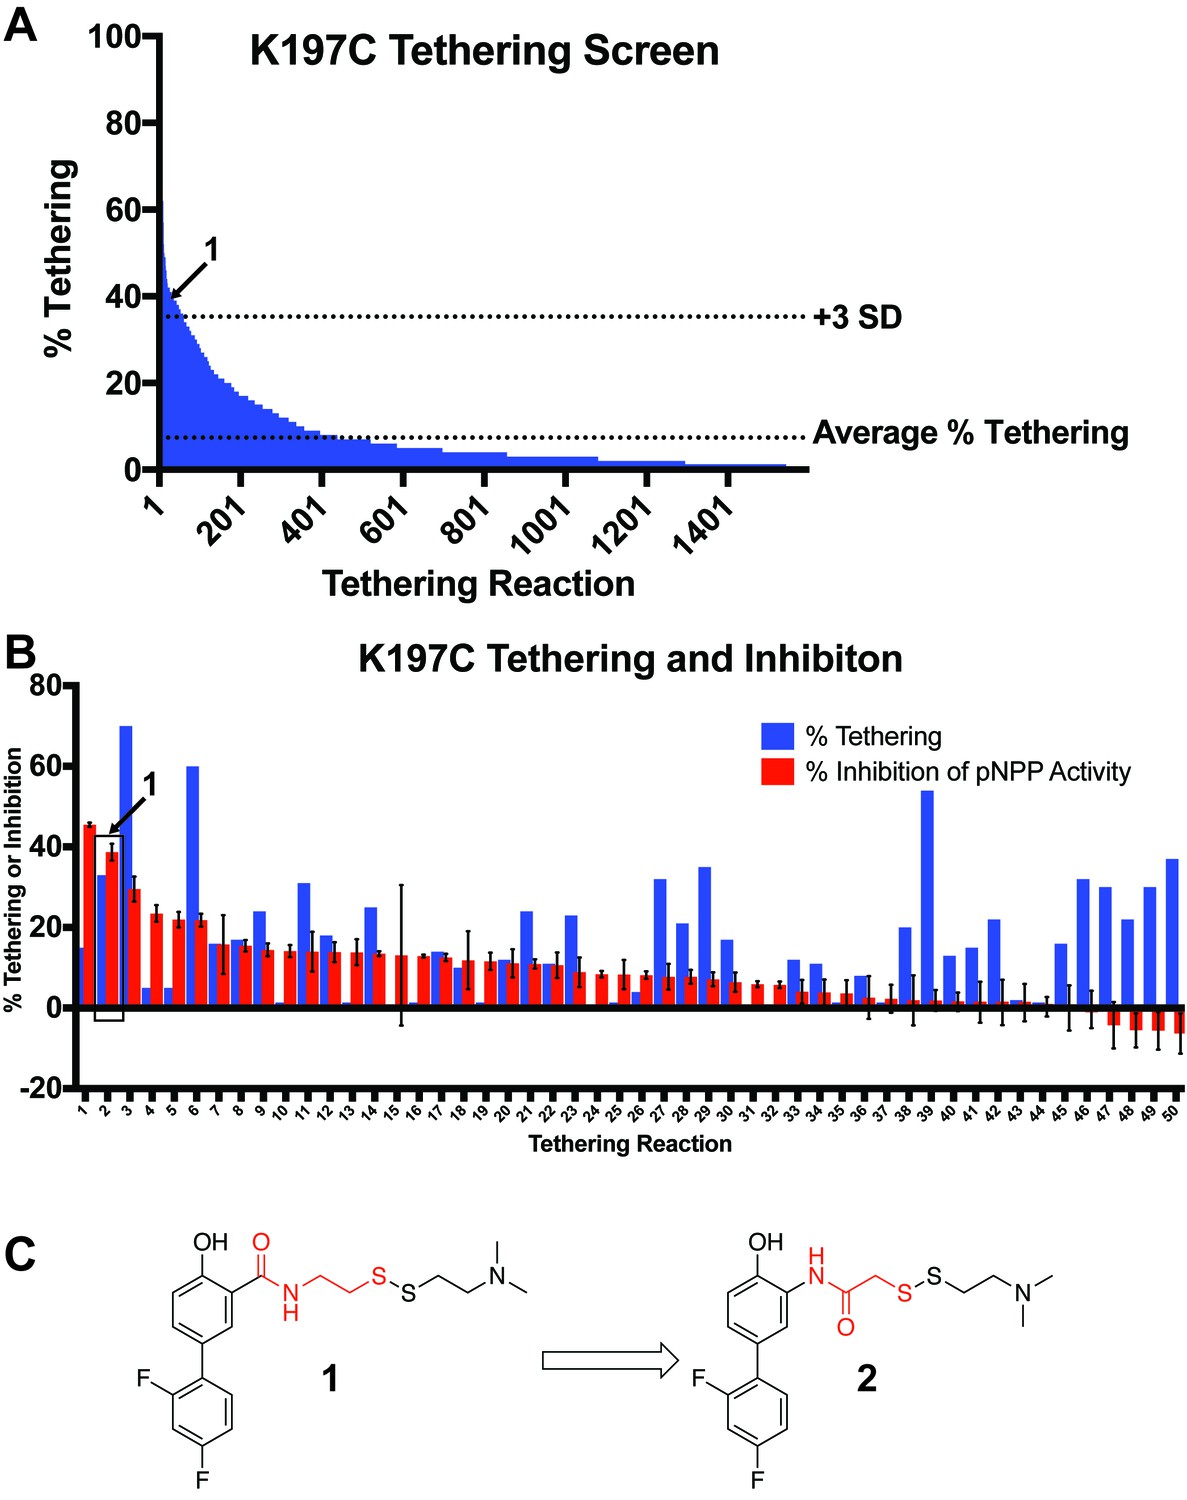
Identification of a functional covalent allosteric inhibitor.
(A) 1600 disulfide fragments were screened for their ability to covalently label K197C. The location of 1 in the data is highlighted. Data represents a single experiment. The % Tethering data reported is for the 1:1 (2:K197C) adduct only. (B) Follow up tethering and pNPP inhibition assays of the top 50 fragments from the initial screen. 1, showed the second best inhibition of pNPP activity and correlated well with percent tethering. This suggested the activity was specific through K197C. Other fragment tested showed either poor, or non-specific inhibition of pNPP activity. Percent tethering represents a single experiment. The % Tethering data reported is for the 1:1 (2:K197C) adduct only. Percent inhibition represents the average of three independent assays ± the standard error of the mean. Both assays were performed in the presence of 50 µM of 1 and 100 µM of β-mercaptoethanol. (D) Structure of 1 as well as the closely related analog 2. Molecular differences between 1 and 2 are highlighted in red.
Figure 8—figure supplement 2
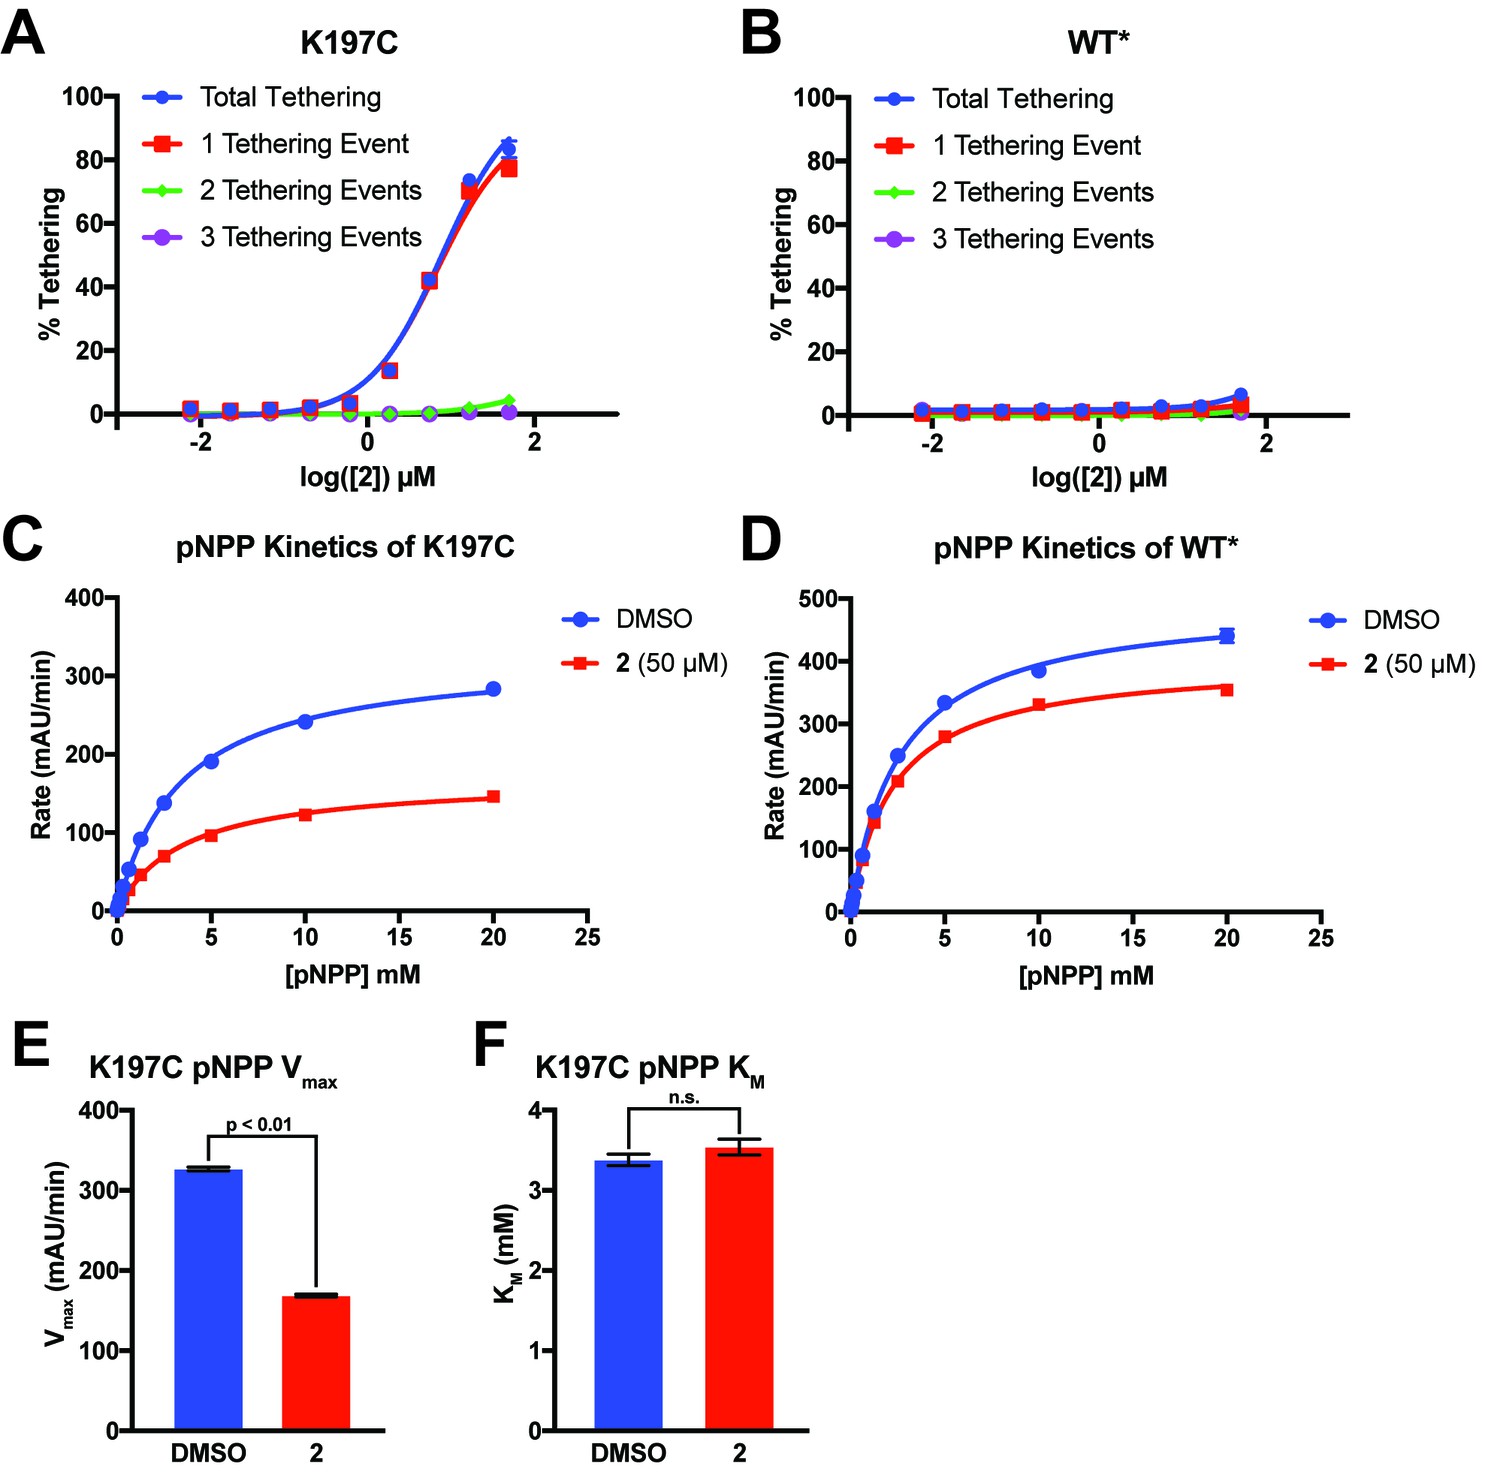
2 tethers to only a single cysteine in K197C and inhibits through a reduction in Vmax.
(A) Percent tethering of K197C at varying concentrations of 2. The vast majority of labeled K197C appears to have only a single tethering event of 2, supporting specific labeling of K197C. Observation of more than one tethering event suggests nonspecific labeling of native cysteines in PTP1B. (B) Percent tethering of WT* at varying concentrations of 2. Very little tethering of WT* is observed (<10%) with the total coming from a combination of different adducts, supporting nonspecific labeling. (C) Michaelis–Menten kinetic analysis of K197C in the presence and absence of 2 (50 µM). Compound 2 causes a ~ 54% reduction in Vmax relative to DMSO but almost no change in KM, supporting a non-competitive allosteric mechanism of inhibition. (D) Michaelis–Menten kinetic analysis of WT* in the presence and absence of 2 (50 µM). Compound 2 causes only a ~ 20% reduction in Vmax relative to DMSO but almost no change in KM. This background inhibition does not correlate with labeling and may be caused by nonspecific factors, such as aggregation of 2 at higher concentrations (≥50 µM). (E) Tethering of compound 2 to K197C reduces the Vmax observed for dephosphorylation of pNPP. Values are derived from the data shown in (C). Vmax was calculated using the Michaelis-Menten nonlinear fit in Graphpad Prism 7. (F) Tethering of compound 2 to K197C shows no effect on the KM observed for dephosphorylation of pNPP. Values are derived from data shown in (C). KM was calculated using the Michaelis-Menten nonlinear fit in Graphpad Prism 7. Data represent the mean of three independent assays ± the standard error of the mean. All p-values and significance was calculated using a FDR-Approach Multiple t-test in Graphpad Prism 7. All assays were performed in the presence of 100 µM of β-mercaptoethanol.
Figure 8—figure supplement 3
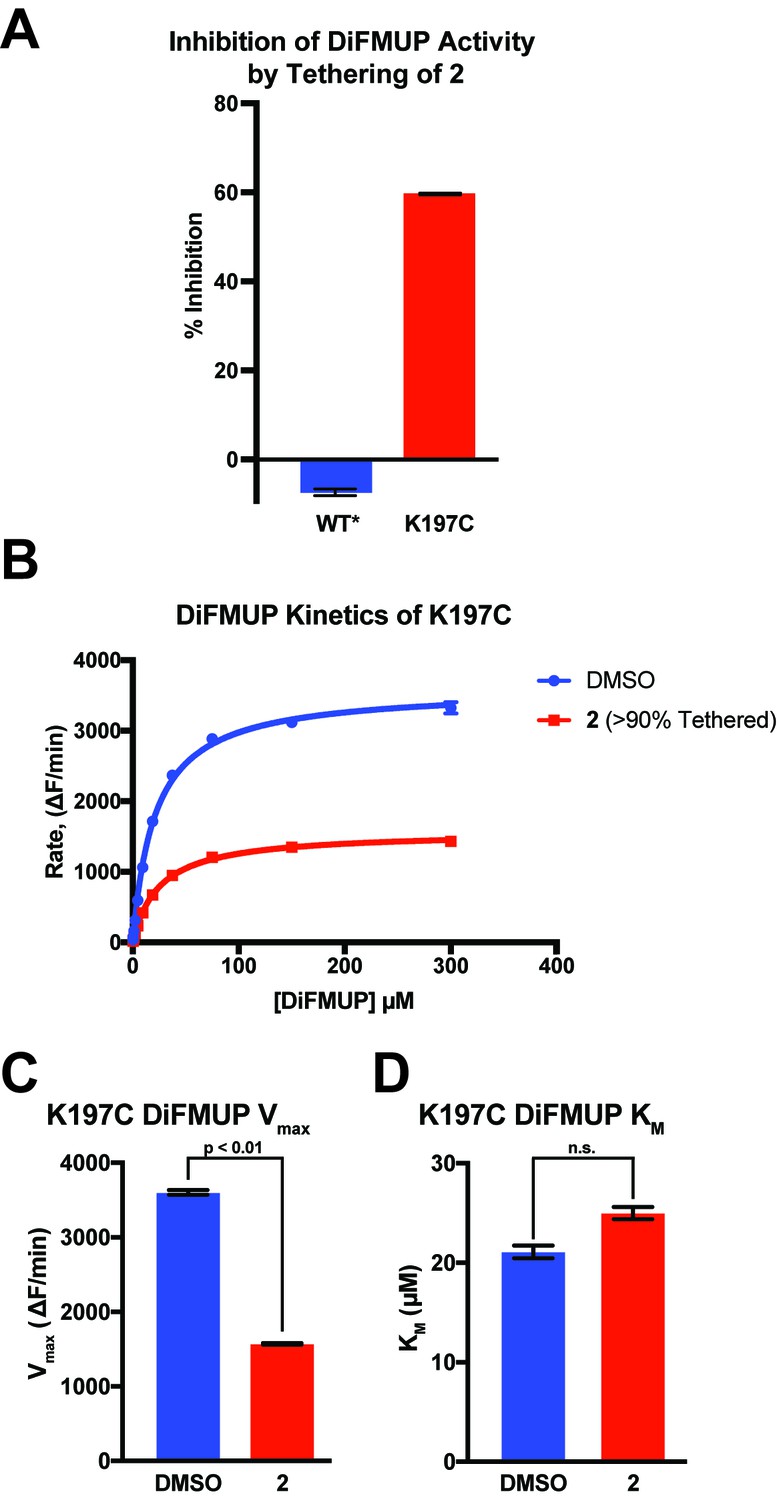
2 inhibits K197C catalysis of DiFMUP through a reduction in Vmax.
https://doi.org/10.7554/eLife.36307.035
Figure 9 with 2 supplements
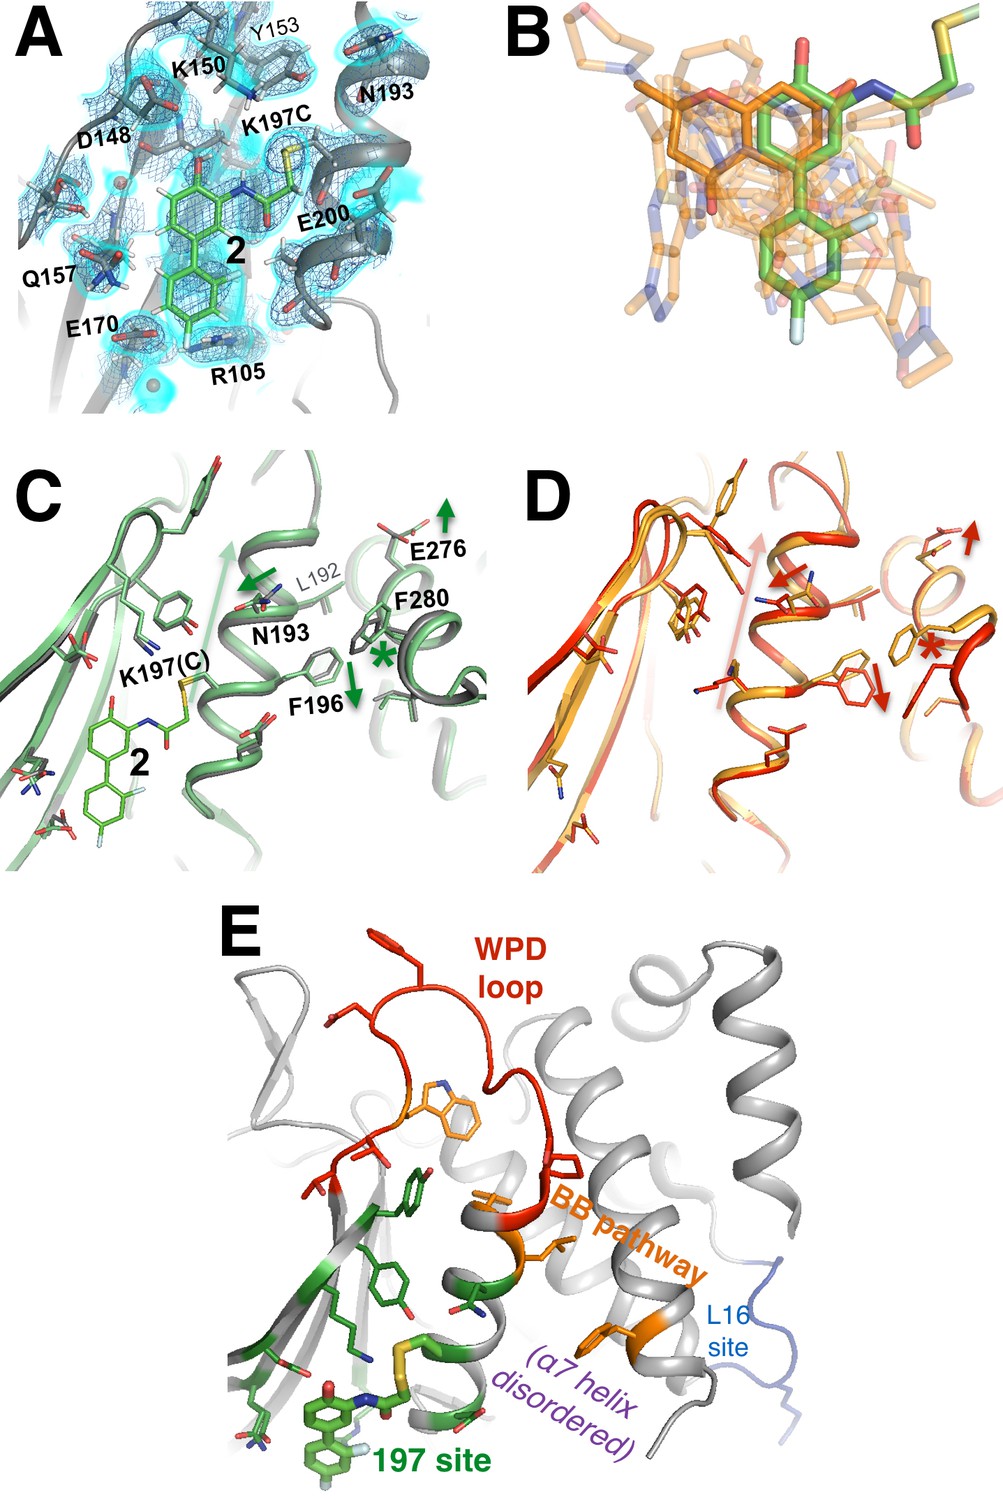
A functional small-molecule inhibitor tethered to the allosteric 197 site.
(A) The tethered inhibitor 2 is highly ordered (~85% occupancy) in the 197 site, as seen by 2Fo-Fc electron density for our 1.90 Å structure contoured at 0.75 σ (cyan volume) and at 1.5 σ (blue mesh) that is continuous to the K197C sidechain. A few waters (transparent red spheres) which appear to be mutually exclusive with the molecule are likely displaced by binding. (B) Many fragments from WT* cocrystal structures (transparent orange) overlay well with 2 in the K197C cocrystal structure (green). One fragment in particular (solid orange) has a ring substructure that overlays very closely with a ring substructure of 2. (C) The K197C 2-tethered structure (green) is similar to the K197C apo structure (gray), but upon tethering there are several conformational changes (arrows and asterisk) in the α3 helix: the whole backbone shifts up in this view slightly leading back into the WPD loop (top), N193 switches rotamers, and the sidechains of F196 and E200 move within rotameric wells. The end of the α6 helix, including E276 and F280, appears to respond in concert. (D) Several of these changes mirror changes from open-to-closed apo PTP1B (arrows and asterisk) as seen in the two conformations of our 278 K model (red/orange). (E) Overview as in Figure 2E for context. The viewing orientation in (A) is as in Figure 1B (‘back side’ of PTP1B), except zoomed in on the 197 site (labeled in Figure 1B). The viewing orientation in (C–E) is as in Figure 1B.
Figure 9—figure supplement 1

Polder omit map of K197C tethered structure.
(A) Tethering of 2 to K197C (>90% tethered) inhibits dephosphorylation of DiFMUP. As expected, WT*, which is not capable of being tethered by 2, shows no inhibition. (B) Michaelis–Menten kinetic analysis of K197C either after tethering with 2 (>90% tethered) or being treated with a DMSO control. (C) Tethering of compound 2 to K197C reduces the Vmax observed for dephosphorylation of DiFMUP. Values are derived from the data shown in (B). Vmax was calculated using the Michaelis-Menten nonlinear fit in Graphpad Prism 7. (D) Tethering of compound 2 to K197C shows no significant effect on the KM observed for dephosphorylation of DiFMUP. Values are derived from data shown in (B). KM was calculated using the Michaelis-Menten nonlinear fit in Graphpad Prism 7. Data represent the mean of three independent assays ± the standard error of the mean. ΔF is the change in fluorescent signal from DiFMUP upon dephosphorylation. All p-values and significances were calculated using a FDR-Approach Multiple t-test in Graphpad Prism 7.
Figure 9—video 1
Movie version of Figure 9A.
https://doi.org/10.7554/eLife.36307.038Tables
Table 1
Crystallographic statistics for multitemperature and mutant X-ray datasets.
Overall statistics given first (statistics for highest-resolution bin in parentheses). For WT apo, 100 K: statistics are taken from our remodeled structure where appropriate, or from the original PDB ID 1sug when possible otherwise, or given as ‘---” where unavailable.
| WT apo, 100 K | WT* apo, 180 K | WT* apo, 240 K | WT* apo, 278 K | WT* with BB3, 278 K | K197C apo, 100 K | K197C tethered to 2, 100 K | |
|---|---|---|---|---|---|---|---|
| PDB ID | 6B90 | 6B8E | 6B8T | 6B8X | 6B8Z | 6BAI | 6B95 |
| Number of crystals used | 1 | 1 | 1 | 1 | 1 | 1 | 1 |
| Wavelength (Å) | 0.8110 | 1.115869 | 1.115869 | 0.9795 | 1.11583 | 1.11583 | 1.11583 |
| Resolution range (Å) | 33.60–1.95 (2.02–1.95) | 19.18–1.82 (1.89–1.82) | 62.54–1.85 (1.92–1.85) | 31.31–1.74 (1.80–1.74) | 43.88–1.8 (1.86–1.8) | 75.57–1.95 (2.02–1.95) | 43.98–1.95 (2.02–1.95) |
| Space group | P 31 2 1 | P 31 2 1 | P 31 2 1 | P 31 2 1 | P 31 2 1 | P 31 2 1 | P 31 2 1 |
| Unit cell (Å, °) | 88.12 88.12 103.90 90 90 120 | 88.57 88.57 104.32 90 90 120 | 89.44 89.44 106.00 90 90 120 | 89.52 89.52 106.25 90 90 120 | 89.65 89.65 106.39 90 90 120 | 87.27 87.27 104.10 90 90 120 | 87.96 87.96 104.63 90 90 120 |
| Total reflections | --- | 339461 (33574) | 256701 (25484) | 299041 (30678) | 771858 (76158) | 653798 (63759) | 170094 (16845) |
| Unique reflections | 34486 (3371) | 42866 (4223) | 42343 (4156) | 50486 (4960) | 46311 (4561) | 33409 (3296) | 34596 (3387) |
| Multiplicity | 7.4 (---) | 7.9 (7.9) | 6.1 (6.1) | 5.9 (6.2) | 16.7 (16.7) | 19.6 (19.3) | 4.9 (5.0) |
| Completeness (%) | 99.9 (100.0) | 99.9 (100.0) | 100.0 (100.0) | 99.0 (98.3) | 100.0 (100.0) | 98.06 (98.51) | 99.81 (99.88) |
| Mean I/sigma(I) | 26.4 (4.4) | 21.40 (1.46) | 15.89 (1.46) | 17.15 (1.49) | 11.69 (0.75) | 25.06 (0.94) | 12.04 (0.81) |
| Wilson B (Å2) | 24.12 | 23.69 | 28.48 | 19.48 | 34.96 | 46.3 | 38.82 |
| Rmerge | 0.073 (0.515) | 0.089 (1.483) | 0.079 (1.215) | 0.098 (1.209) | 0.148 (2.664) | 0.076 (3.056) | 0.088 (1.852) |
| Rmeas | --- | 0.096 (1.585) | 0.086 (1.329) | 0.108 (1.318) | 0.153 (2.748) | 0.078 (3.138) | 0.098 (2.071) |
| Rpim | --- | 0.034 (0.556) | 0.035 (0.535) | 0.044 (0.520) | 0.038 (0.672) | 0.018 (0.705) | 0.044 (0.916) |
| CC1/2 | --- | 0.999 (0.520) | 0.999 (0.560) | 0.999 (0.496) | 0.997 (0.366) | 1.000 (0.438) | 0.999 (0.292) |
| CC* | --- | 1.000 (0.827) | 1.000 (0.847) | 1.000 (0.814) | 0.999 (0.732) | 1.000 (0.781) | 1.000 (0.672) |
| Reflections used in refinement | 34486 (3371) | 42862 (4223) | 42343 (4156) | 50486 (4959) | 46309 (4561) | 33302 (3296) | 34576 (3386) |
| Reflections used for Rfree | 1356 (128) | 1689 (165) | 1669 (163) | 1993 (196) | 1820 (176) | 1310 (135) | 1362 (135) |
| Rwork | 0.1580 (0.1881) | 0.1708 (0.2781) | 0.1674 (0.2760) | 0.1752 (0.3511) | 0.1675 (0.3116) | 0.2061 (0.3365) | 0.1858 (0.3295) |
| Rfree | 0.1926 (0.2090) | 0.1997 (0.2911) | 0.2123 (0.2869) | 0.2059 (0.3888) | 0.1978 (0.3017) | 0.2569 (0.3292) | 0.2307 (0.3686) |
| CCwork | --- | 0.963 (0.753) | 0.958 (0.789) | 0.964 (0.673) | 0.964 (0.709) | 0.934 (0.618) | 0.957 (0.574) |
| CCfree | --- | 0.948 (0.744) | 0.908 (0.677) | 0.948 (0.739) | 0.961 (0.757) | 0.994 (0.484) | 0.938 (0.294) |
| Non-H atoms | 2997 | 3021 | 3149 | 3260 | 2709 | 2502 | 2541 |
| Macromolecule atoms | 2657 | 2687 | 2875 | 3011 | 2460 | 2377 | 2370 |
| Ligand atoms | 46 | 40 | 34 | 24 | 82 | 16 | 36 |
| Solvent atoms | 294 | 294 | 240 | 225 | 167 | 109 | 135 |
| Protein residues | 298 | 298 | 299 | 298 | 289 | 282 | 285 |
| RMS bonds (Å) | 0.010 | 0.011 | 0.011 | 0.012 | 0.011 | 0.015 | 0.013 |
| RMS angles (°) | 1.01 | 1.02 | 1.10 | 1.08 | 1.14 | 1.30 | 1.15 |
| Ramachandran favored (%) | 97.64 | 97.64 | 97.98 | 95.95 | 97.19 | 95.00 | 95.76 |
| Ramachandran allowed (%) | 2.03 | 2.03 | 1.68 | 3.72 | 2.11 | 4.64 | 2.83 |
| Ramachandran outliers (%) | 0.34 | 0.34 | 0.34 | 0.34 | 0.70 | 0.36 | 1.41 |
| Rotamer outliers (%) | 1.35 | 2.67 | 1.87 | 2.38 | 2.19 | 6.44 | 4.91 |
| Clashscore | 2.79 | 3.31 | 3.62 | 2.98 | 2.79 | 6.06 | 3.36 |
| MolProbity score | 1.24 | 1.52 | 1.36 | 1.65 | 1.47 | 2.29 | 1.95 |
| Average B (Å2) | 29.35 | 30.22 | 36.50 | 28.06 | 43.58 | 55.81 | 49.66 |
| Average B, macromolecule (Å2) | 28.14 | 29.11 | 35.51 | 27.01 | 43.30 | 56.02 | 49.53 |
| Average B, ligands (Å2) | 47.43 | 48.08 | 60.29 | 67.33 | 41.13 | 45.41 | 53.91 |
| Average B, solvent (Å2) | 37.46 | 37.90 | 44.96 | 38.01 | 48.96 | 52.76 | 50.82 |
-
Table 1—source data 1
Multiconformer models best explain PTP1B X-ray data across temperatures.
R-factors are reported for the deposited multiconformer models for multitemperature datasets in Table 1 vs. single-conformer models derived by removing alternative conformations and re-refining with Phenix either with default parameters (‘without solvent picking’) or with automated water placement turned on by adding the flag ‘ordered_solvent = True’ (‘with solvent picking’) for 12 macro-cycles. For the new single-conformer models, R-factors are given both for state A with state B’s alternative conformations removed, and for state B with state A’s alternative conformations removed, to confirm that either option for a single-conformer model is worse than a multiconformer model. Overall, regardless of the choice of solvent parameters, at each temperature the multiconformer model has lower (better) Rwork and Rfree.
- https://doi.org/10.7554/eLife.36307.011
Additional files
-
Supplementary file 1
PDB deposition details for all structures reported.
- https://doi.org/10.7554/eLife.36307.039
-
Transparent reporting form
- https://doi.org/10.7554/eLife.36307.040
Download links
A two-part list of links to download the article, or parts of the article, in various formats.
Downloads (link to download the article as PDF)
Open citations (links to open the citations from this article in various online reference manager services)
Cite this article (links to download the citations from this article in formats compatible with various reference manager tools)
An expanded allosteric network in PTP1B by multitemperature crystallography, fragment screening, and covalent tethering
eLife 7:e36307.
https://doi.org/10.7554/eLife.36307


