Nanoscale dysregulation of collagen structure-function disrupts mechano-homeostasis and mediates pulmonary fibrosis
- Faculty of Medicine, University of Southampton, United Kingdom
- TU Wien, Austria
- Synairgen Research Ltd, United Kingdom
- Pharmaxis Ltd, Australia
- Firestone Institute for Respiratory Health, McMaster University and The Research Institute of St. Joe's Hamilton, Canada
- University of Southampton, United Kingdom
- University Hospital Southampton, United Kingdom
- University of Rochester School of Medicine and Dentistry, United States
- St. Vincent's University Hospital & UCD School of Medicine, University College Dublin, Ireland
- Fondazione Policlinico Universitario Agostino Gemelli IRCCS, Italy
- Mater Misericordiae University Hospital, Ireland
- University College Dublin, Ireland
Figures
Figure 1 with 1 supplement
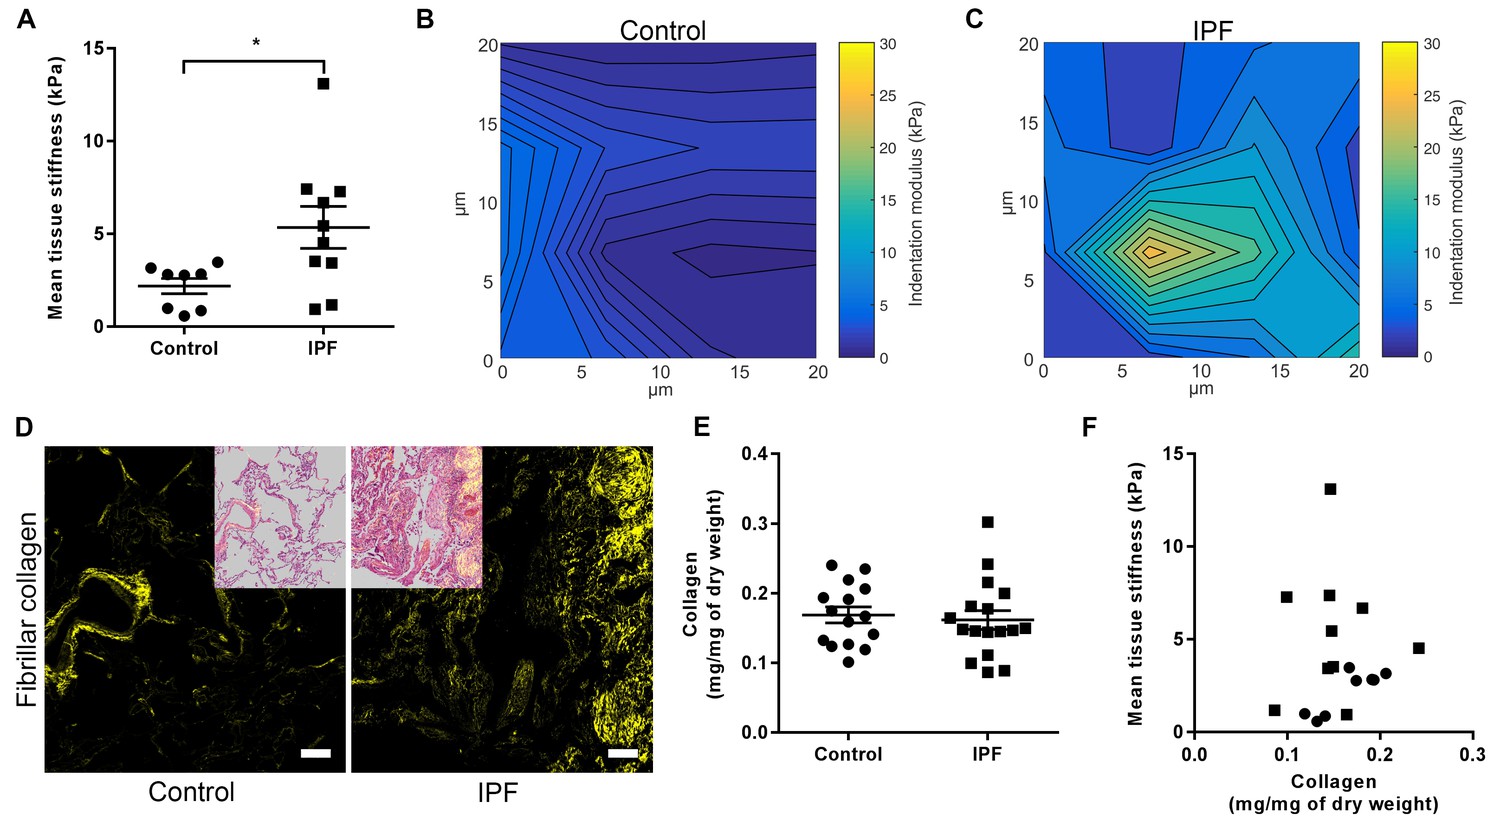
IPF lung tissue has increased stiffness which is not dependent on total collagen content.
(A) Tissue stiffness of control (n = 8 donors, ●) and IPF (n = 10 donors, ■) lung tissue determined by micro-indentation atomic force microscopy (AFM). Data presented as mean stiffness of each donor determined from force-displacement curve measurements (n = 80–150 measurements per donor). Bars are mean ± s.e.m. *p<0.05 by Student's t-test with Welch’s correction for unequal variances (two-tailed). (B, C) Representative elastograph images from AFM cantilever-based microindentation analyses of control and IPF lung tissue, respectively. Axis labels indicate spatial scale in micrometres and colour bars the indentation modulus in kPa. The coefficient of variation in (B) is 66.6% and in (C) is 74.6%. (D) Representative second harmonic generation images (SHG) of control or IPF lung tissue. Fibrillar collagen is visualised in yellow. Inset image shows histological staining of an adjacent section using hematoxylin and eosin with the SHG image overlaid. Scale bar = 100 μm. (E) Total collagen content of control (n = 15) and IPF lung tissue (n = 17) normalised by dry weight. Bars are mean ±s.e.m. p=0.70 by Student's t-test (two-tailed). (F) Paired data from (A) and (E) were plotted to determine the dependency of mean tissue stiffness on collagen content (Spearman correlation coefficient: r = 0.16; p=0.52).
Figure 1—figure supplement 1
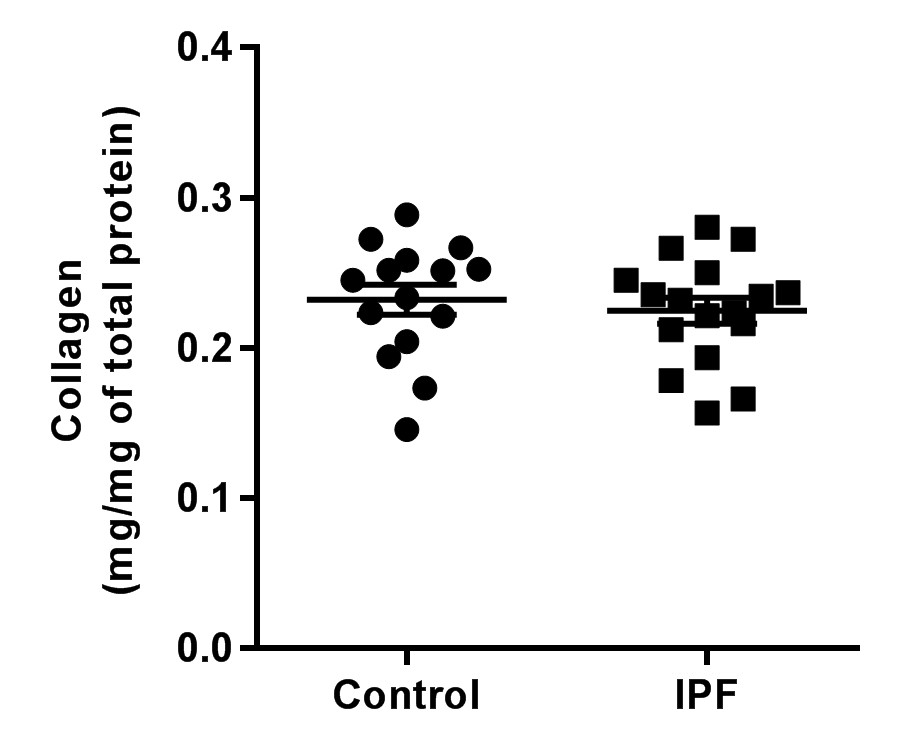
IPF lung tissue total collagen content.
Total collagen content of control (n = 15) and IPF lung tissue (n = 17) normalised by total protein. Bars are mean ±s.e.m. p=0.70 by Student's t-test (two-tailed).
Figure 2
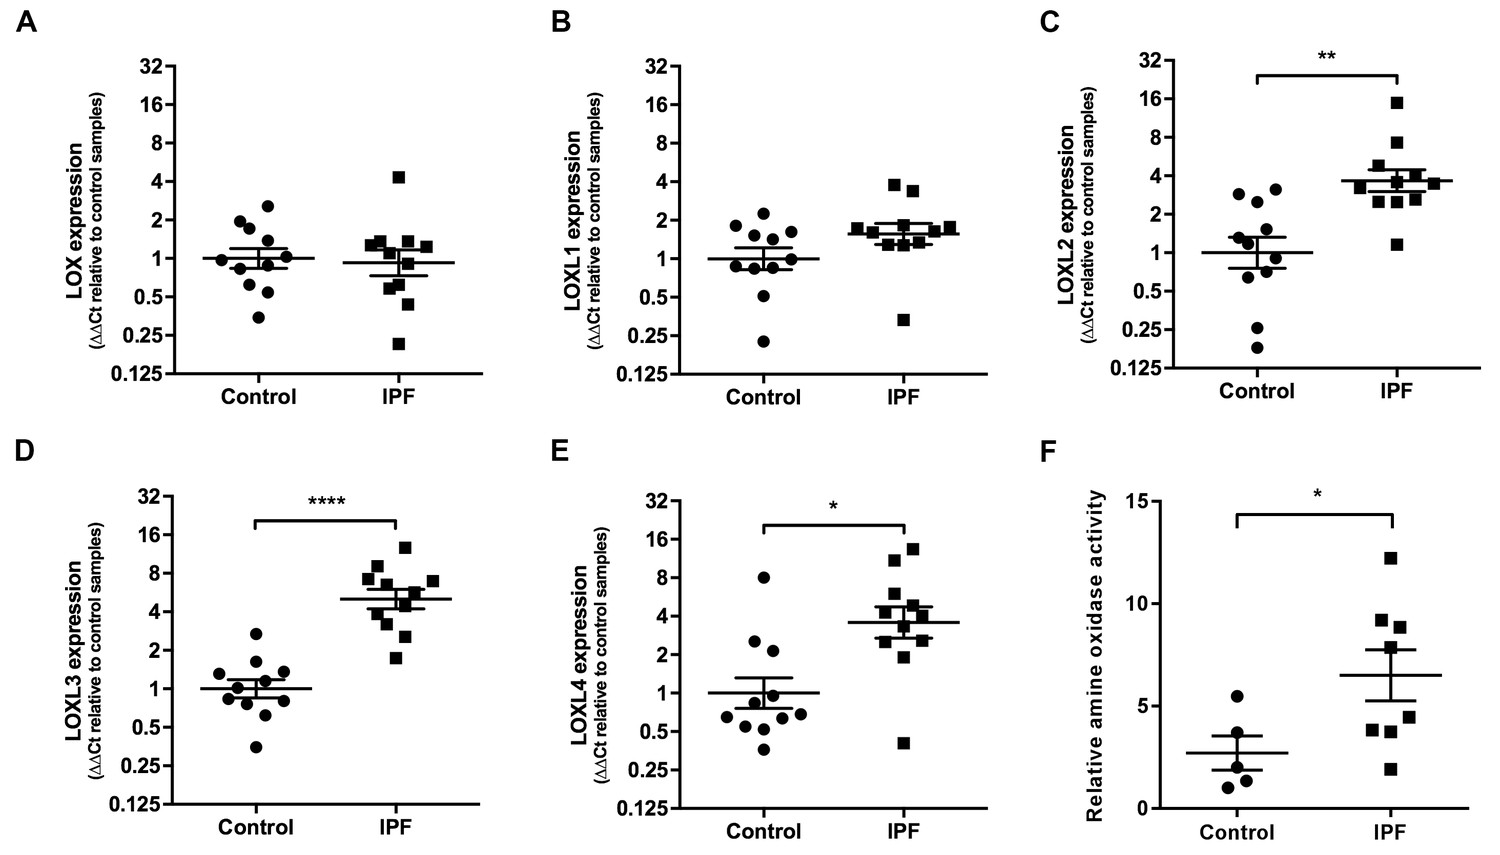
Lysyl oxidase-like (LOXL) enzymes and amine oxidase activity are increased in IPF tissue.
(A–E) Expression of LOX, LOXL1, LOXL2, LOXL3 and LOXL4 was analysed in control (●) and IPF (■) lung tissue (n = 11 individual donors per group) using the ∆∆Ct method. Bars indicate geometric means. LOX p=0.79; LOXL1 p=0.22 *p<0.05; **p<0.01; ***p<0.001; ****p<0.0001 by multiple t-test of log transformed data using the Holm-Sidak method to adjust for multiple comparisons (two-tailed). SD was not assumed to be consistent between groups. (F) Amine oxidase activity as measured in situ from control (n = 5 individual donors) or IPF lung tissue (n = 8 individual donors). Semi-quantitative analysis was performed using Fiji and normalised to one control sample. Bars are mean ±s.e.m. *p<0.05 by Student’s t-test with Welch’s correction for unequal variances (2-tailed).
Figure 3
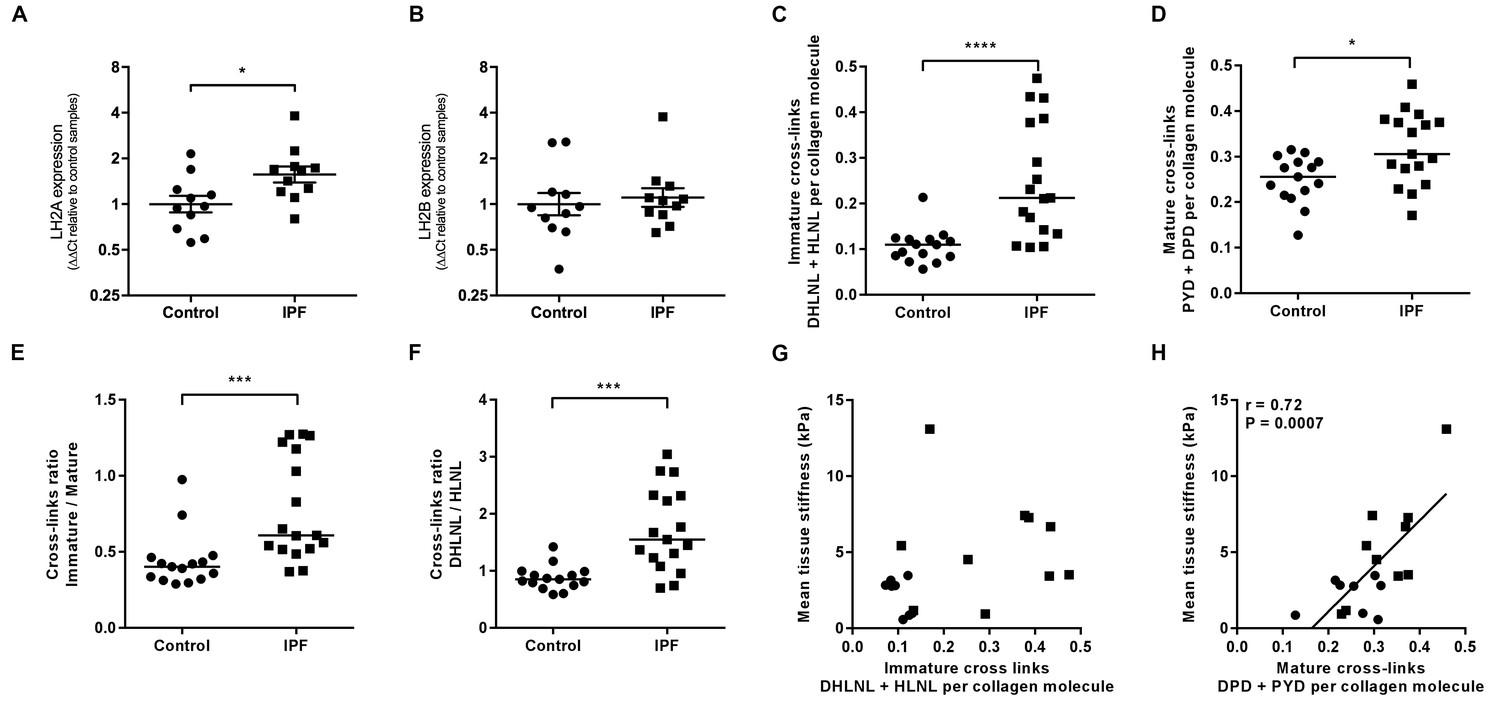
Hydroxyallysine-derived collagen cross-link density is increased in IPF lung and is correlated with tissue stiffness.
(A, B) Lysyl hydroxylase 2 (LH2A and LH2B) expression was analysed in control (●) and IPF (■) lung tissue (n = 11 donors per group) using the ∆∆Ct method. Bars indicate geometric means. *p<0.05 by multiple t-test of log transformed data using the Holm-Sidak method to adjust for multiple comparisons (two-tailed). SD was not assumed to be consistent between groups. (C–F) Hydroxyallysine-derived collagen cross-link analysis of IPF (n = 17 donors) and control (n = 15 donors) lung tissue, normalised to total collagen content, as determined by UHPLC-ESI-MS/MS. Each data point represents an individual donor. (C) Total immature divalent cross-links (DHLNL + HLNL); (D) Total mature trivalent cross-links (PYD + DPD); (E) Ratio of immature to mature cross links; (F) Ratio of DHLNL to HLNL immature divalent cross-links. Bars indicate median values. *p<0.05; **p<0.01; ***p<0.001; ****p<0.0001 by Mann-Whitney t-test (two-tailed). (G, H) Scatterplots of paired data from Figure 1A and Figure 3C or Figure 3D showing dependency of mean tissue stiffness on total immature (r = 0.364, p=0.137) or total mature (r = 0.723, p=0.0007) collagen cross-link density, respectively (Multivariate correlation analysis including mean tissue stiffness, normalised collagen and immature and mature cross-links).
Figure 4
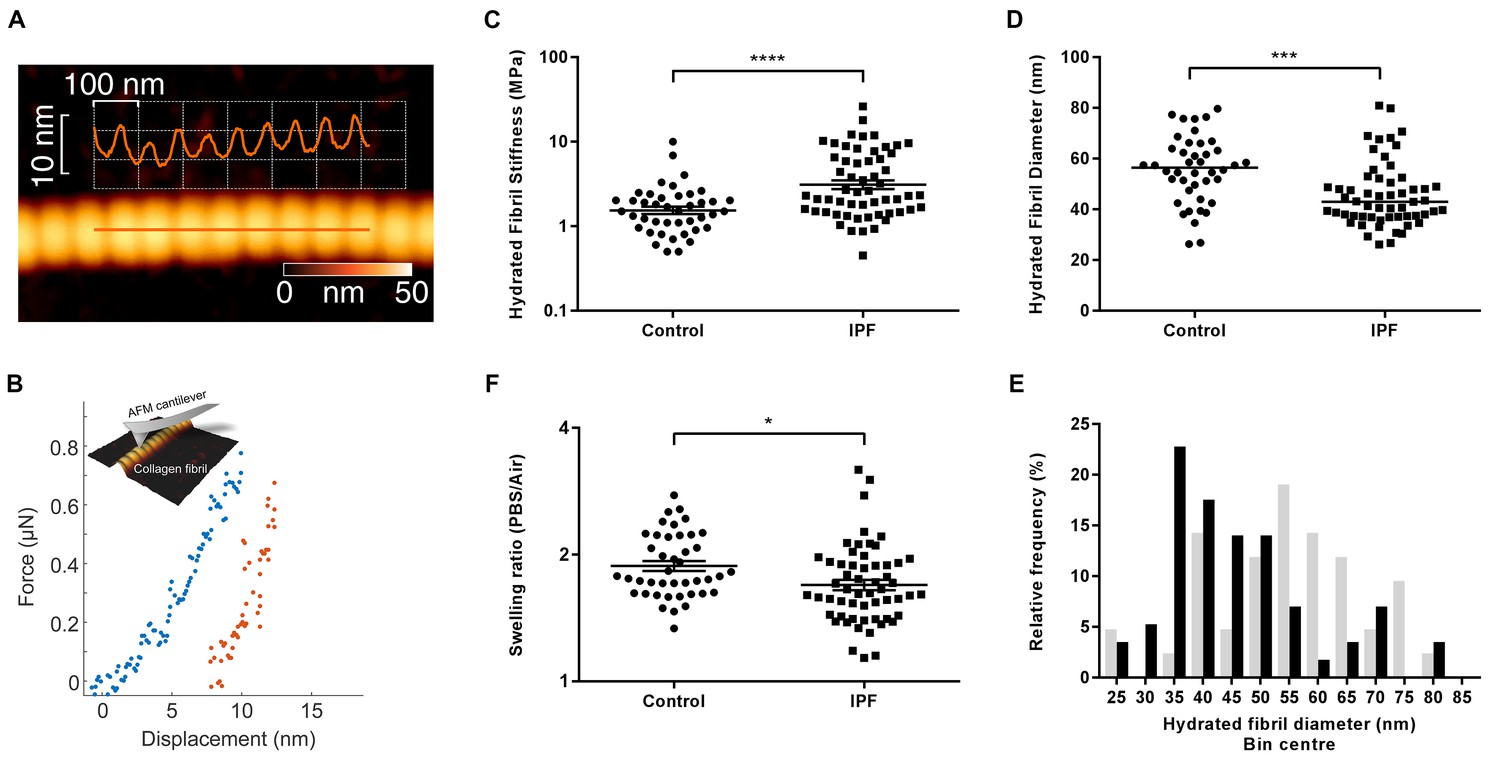
Collagen fibrils from IPF tissue have altered fibril diameter and stiffness.
(A) Atomic force microscopy (AFM) height topography image of a collagen fibril and corresponding height topography long axis profile showing characteristic D-periodicity (~67 nm). (B) Force displacement curve (blue: loading, red: unloading) of an individual fibril tested using AFM cantilever-based nanoindentation. (C) Indentation modulus of collagen fibrils (3–7 fibrils per donor) from control (n = 42 fibrils from eight donors) or IPF lung tissue (n = 57 fibrils from 10 donors) under hydrated conditions; each data point represents the mean of 30 to 50 force-displacement curves per fibril. Bars are mean ±s.e.m of log transformed data. ****p<0.0001 by Student’s t-test with Welch’s correction for unequal variances of log transformed data (two-tailed). (D) Fibril diameter as determined by measurement of fibril height under hydrated conditions. Bars are median; ***p<0.001 by Mann-Whitney t-test (two-tailed). (E) Frequency distribution of hydrated collagen fibril diameters measured for control (light grey bars) and IPF lung tissue (black bars). (F) Fibril swelling as determined by the ratio of the diameters under hydrated and dry conditions. Bars are mean ±s.e.m of log transformed data. *p<0.05 by Student’s t-test of log transformed data (two-tailed).
Figure 5
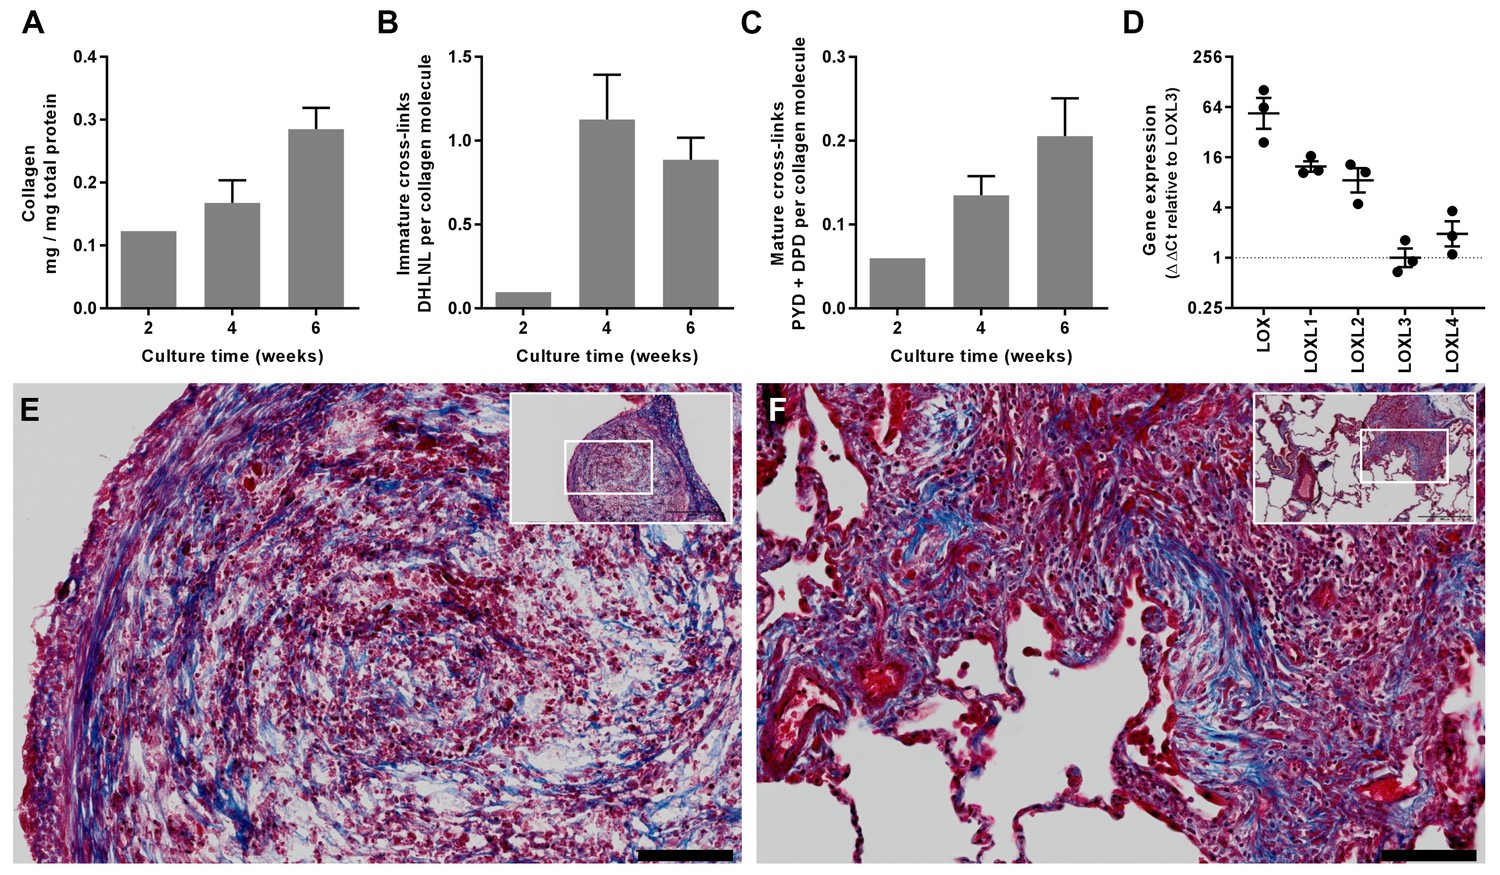
In vitro modelling of fibrillar collagen production and cross-linking in IPF.
We utilised a long-term 3D in vitro model of lung fibrosis using primary human lung fibroblasts from patients with IPF treated with the pro-fibrotic cytokine TGF-β1 cultured for up to 6 weeks. (A–C) Characterisation of (A) total collagen normalised to total protein, (B) immature divalent (DHLNL) and (C) mature trivalent (PYD and DPD) hydroxyallysine-derived collagen cross-links at the culture times indicated following addition of TGF-β1. Bars are mean +range (n = 2 IPF donors). (D) Relative gene expression analysis of LOX, LOXL1, LOXL2, LOXL3 and LOXL4 using the ∆∆Ct method (n = 3 IPF donors, two experiments per donor). (E, F) Masson’s trichrome stain of histological sections from (E) the in vitro model at 6 weeks and (F) IPF lung tissue including a fibroblastic focus. Blue staining identifies fibrillar collagen. Scale bars are 100 μm (main image) and 500 μm (inset, showing location of enlarged image).
Figure 6 with 1 supplement
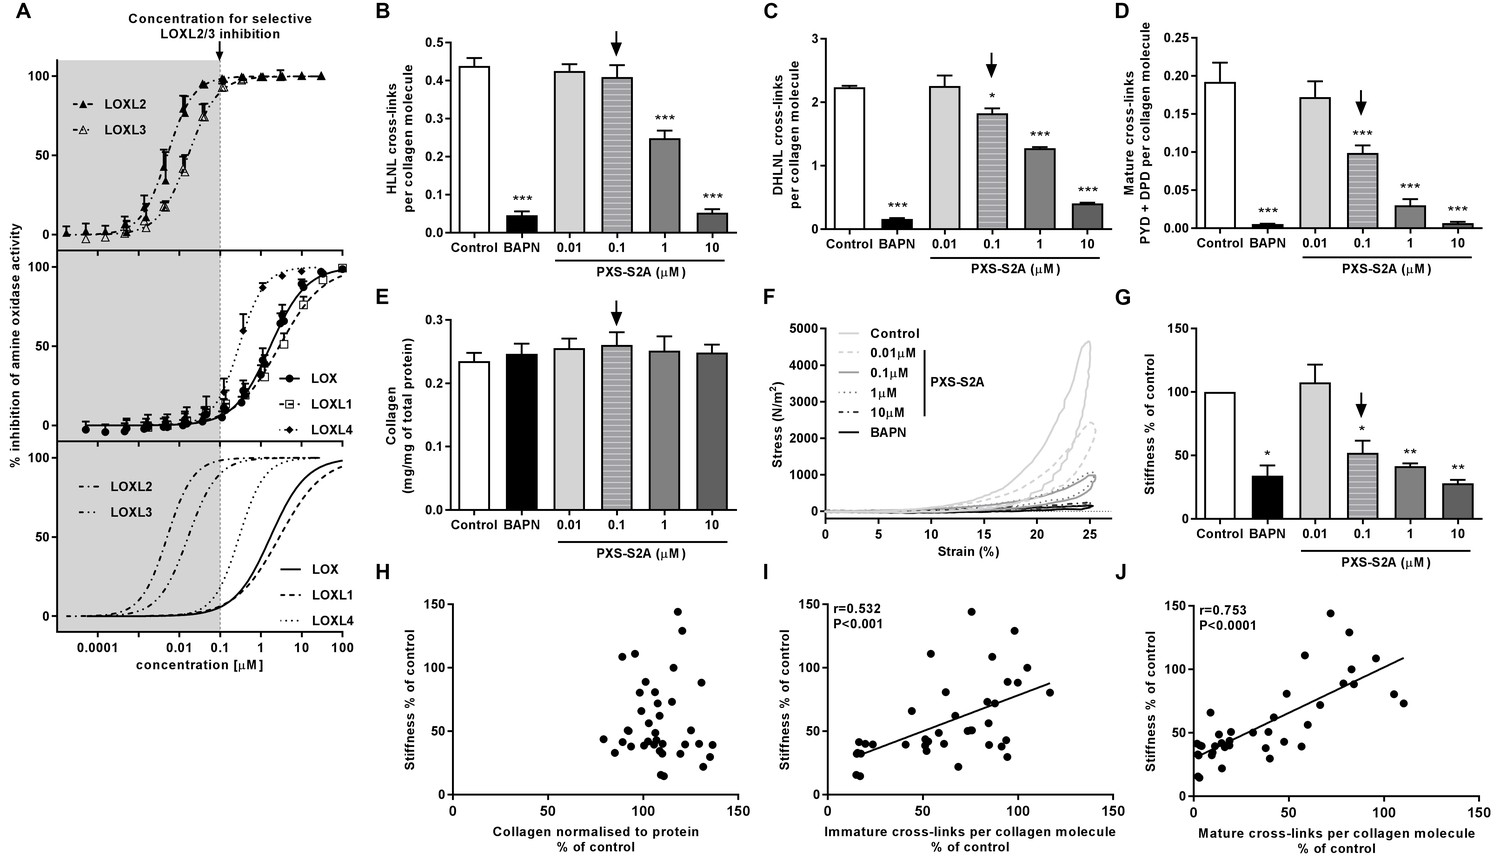
Selective inhibition of LOXL2/LOXL3 reduces hydroxyallysine-derived collagen cross-links and tissue stiffness.
(A) PXS-S2A inhibition curves against LOXL2 and LOXL3 (upper panel), LOX, LOXL1, LOXL4 (middle panel), and all LOX/LOXL enzymes (lower panel). Downward arrows in (A–E, G) identify LOXL2/LOXL3-selective dose. (B–G) Lung fibroblasts from IPF patients (n = 3 donors, two experiments per donor) were used in the 3D model of fibrosis in the presence of 1 mM BAPN, PXS-S2A (at concentrations indicated) or vehicle control for 6 weeks. Bars are mean +s.e.m. (B–D) Hydroxyallysine-derived collagen cross-link analysis: (B) HLNL determined by LC-MS; (C) DHLNL determined by LC-MS; (D) Total mature (PYD +DPD) cross-links determined by ELISA. *p<0.05; **p<0.01; ***p<0.001 by one-way repeated measures ANOVA with Dunnett’s post-test. (E) Total collagen content determined by hydroxyproline assay. (F–G) Parallel plate compression testing of the 3D culture of lung fibrosis. (F) Typical stress versus strain plots following treatment with LOXL2/LOXL3 inhibitor or BAPN. (G) Young’s modulus. *p<0.05; **p<0.01 by one sample t-test. (H–J) Scatterplots showing dependency of tissue stiffness on (H) collagen content (r = −0.0272; p=0.873), (I) immature (r = 0.532; p=0.0007) or (J) mature (r = 0.753; p<0.0001) collagen cross-link density following PXS-S2A treatment (Multivariate correlation including mean tissue stiffness, normalised collagen and immature and mature cross-links).
Figure 6—figure supplement 1

Parallel plate compression testing and analysis of the in vitro fibrosis model: Example for a single experiment.
Output graphs of raw data from parallel plate compression testing: (A) force vs time, (B) displacement vs time, and (C) force vs displacement for the control, BAPN, or PXS-S2A-treated cultures.
Figure 7
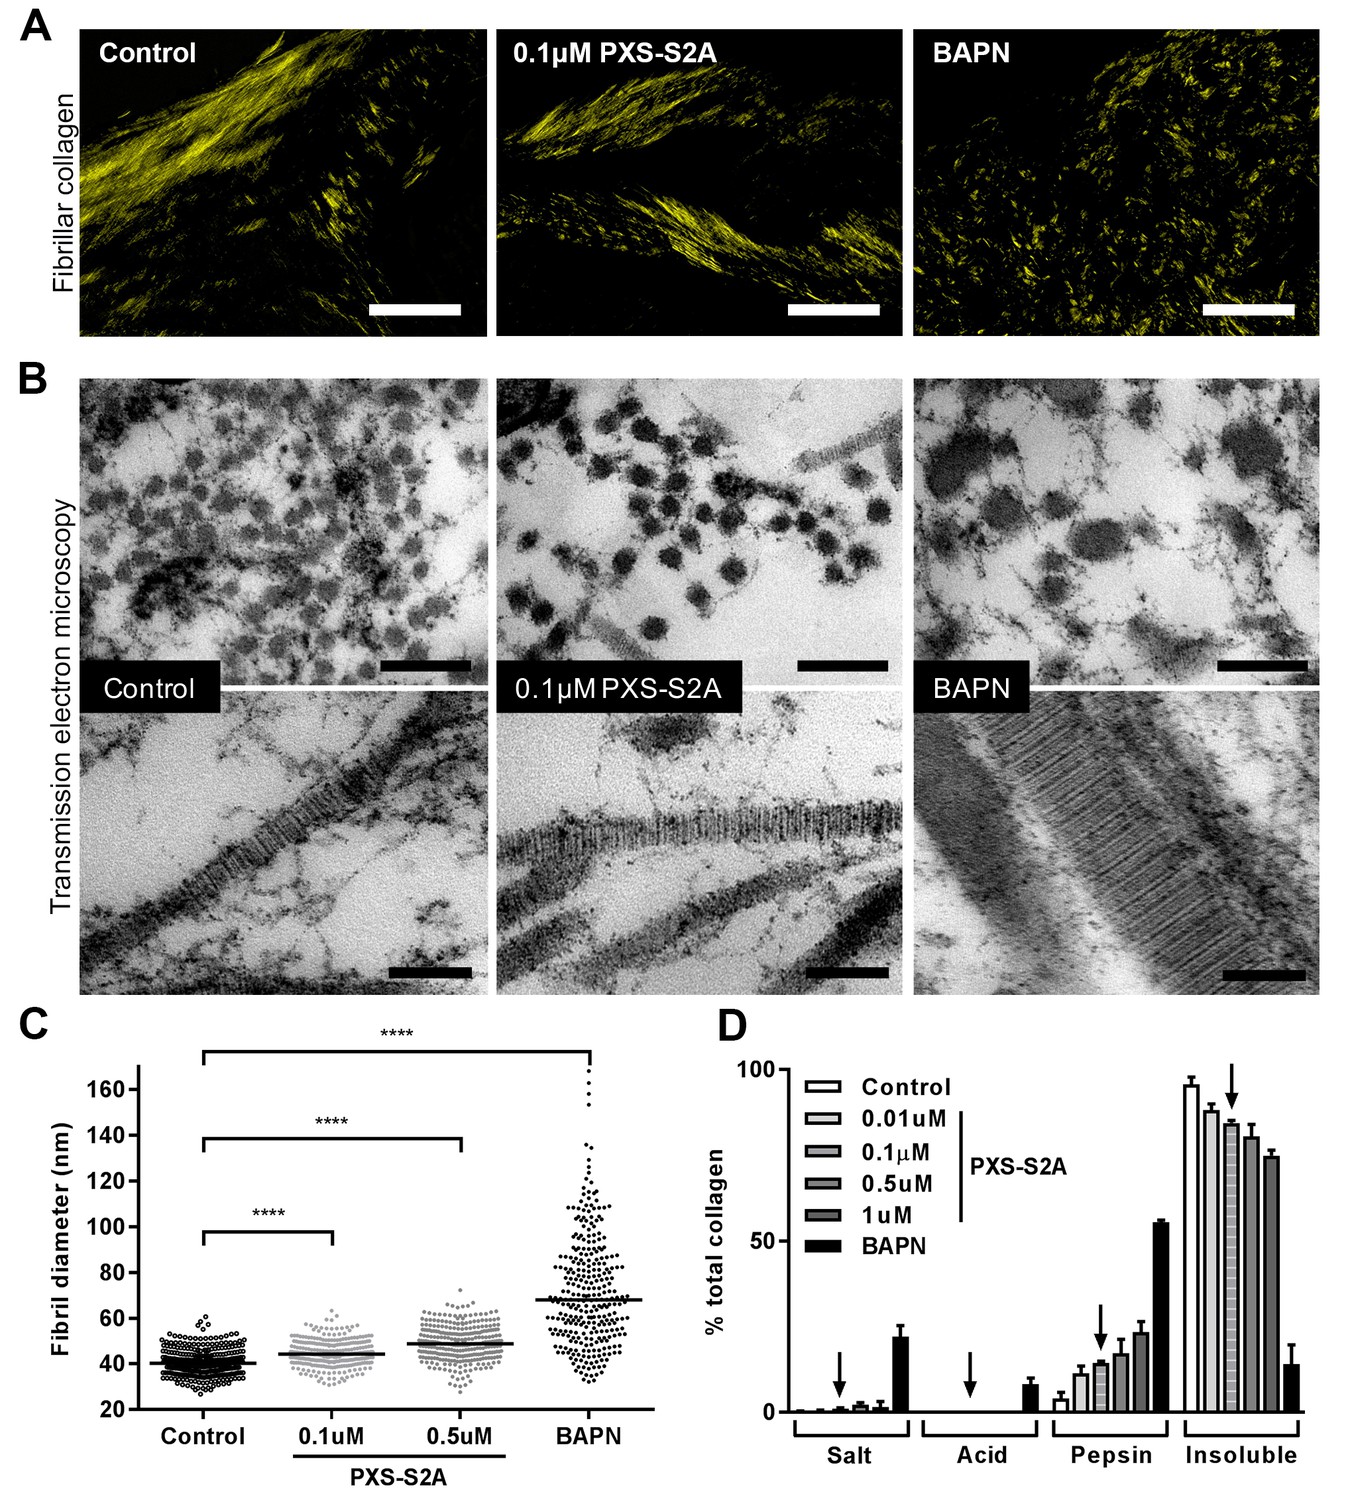
Selective LOXL2/LOXL3 inhibition modifies collagen fibril assembly.
IPF fibroblasts were grown for 6 weeks in the 3D in vitro model of fibrosis with vehicle control, concentrations of PXS-S2A or 1 mM BAPN, as indicated. (A) Representative images of histological sections stained with picrosirius red and viewed under plane polarised light, scale bar: 50 μm. (B) Representative transmission electron microscopy images of collagen fibrils in transverse (upper panel, scale bar 200 nm) and longitudinal (lower panel, scale bar 100 nm) cross-section. Images are representative of the mean fibril diameter. (C) Collagen fibril diameter measured in transverse section (300 fibrils per treatment measured by a blinded observer from one experiment). Data are representative of measurements from two independent experiments. Bars show the median value. ****p<0.0001 by non-parametric one-way ANOVA (Kruskal-Wallis test) with Dunn’s multiple comparison test. (D) Collagen solubility of whole cultures assessed by sequential extractions using TBS, 0.5M acetic acid, and pepsin. Each fraction and the final insoluble residue were hydrolysed and assayed for hydroxyproline. Bars are mean +range of two IPF donors.
Figure 8 with 1 supplement
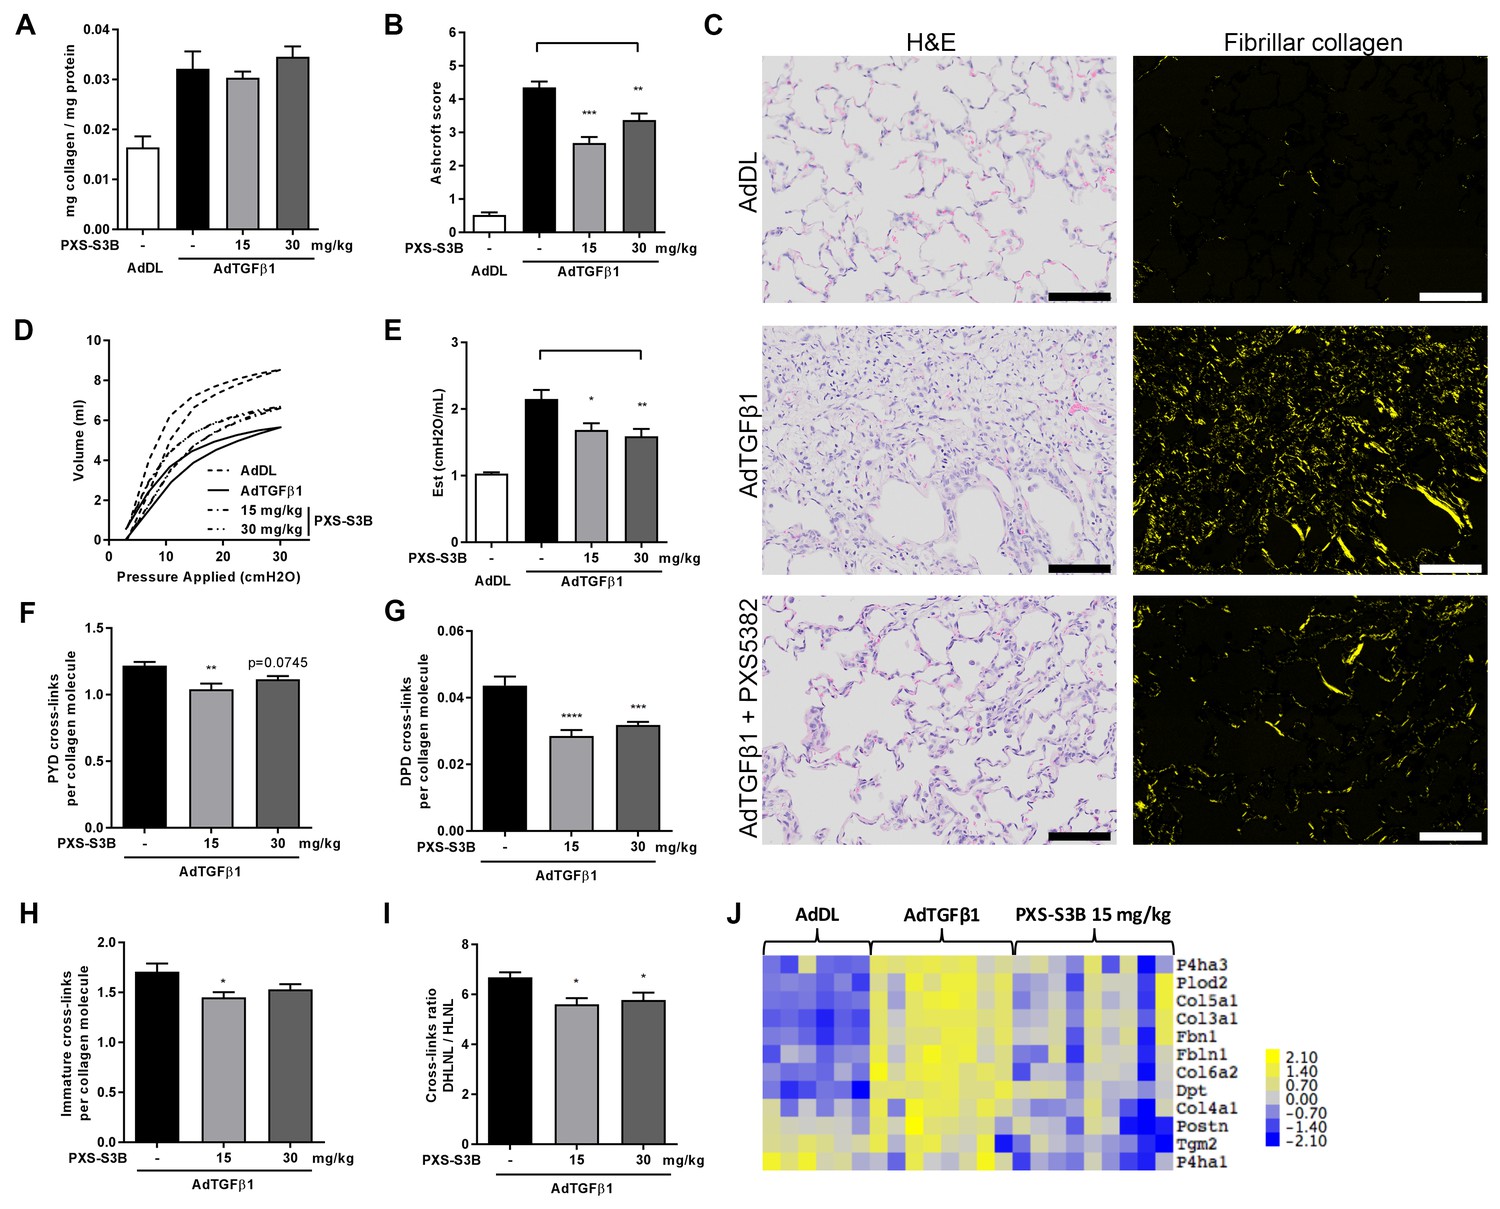
Selective LOXL2/LOXL3 inhibition reduces fibrosis and improves lung function in an in vivo model of lung fibrosis driven by TGF-β.
Rats received either empty vector control (AdDL) (n = 6) on Day 0 or adenoviral vector producing active TGF-β1 (AdTGF-β1) to induce progressive pulmonary fibrosis. AdTGF-β1 groups received either vehicle (PBS, n = 8) or PXS-S3B (15 mg/kg/day or 30 mg/kg/day, n = 9 per group) dosed daily orally from day 1 to day 28 when animals were sacrificed. (A) Total collagen content normalised to total protein content. (B) Fibrotic changes in left lung quantified by modified Ashcroft score. (C) Representative histological sections stained with H and E (left hand panel) or picrosirius red viewed under plane polarised light (fibrillar collagen, right hand panel) (Scale bar = 100 μm). (D–E) Day 28 lung function prior to sacrifice: (D) Representative lung pressure-volume loops. (E) Lung elastance. (F–I) Hydroxyallysine-derived collagen cross-link analysis determined by LC-MS: (F) PYD cross-links, (G) DPD cross-links, (H) immature divalent (DHLNL +HLNL) cross-links; (I) ratio of DHLNL to HLNL cross-links; Bars are mean +s.e.m. *p<0.05; **p<0.01; ***p<0.001; ****p<0.0001 by one-way ANOVA with Dunnett’s multiple comparison test. (J) Transcriptional changes in fibrillogenesis genes in lung tissue shown in a heat map produced by treatment group supervised clustering.
Figure 8—figure supplement 1
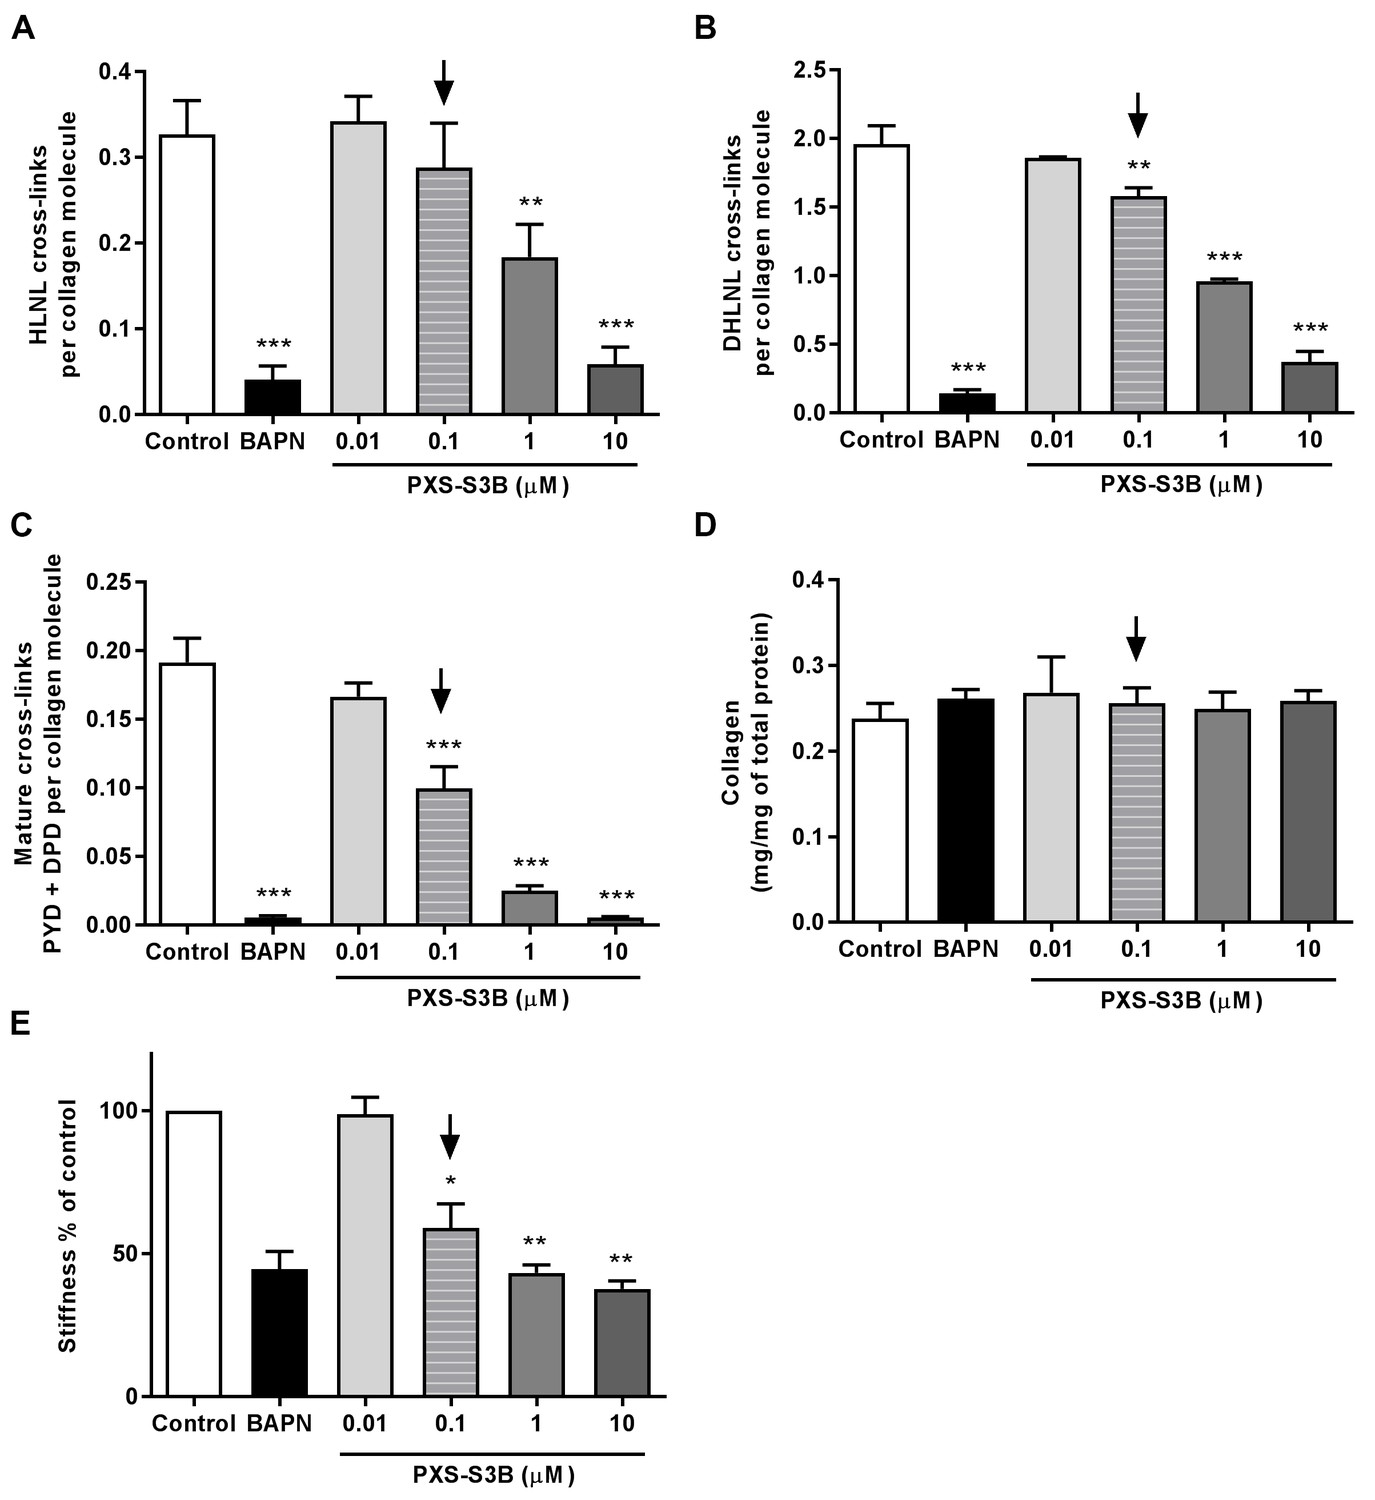
Selective inhibition of LOXL2/LOXL3 with PXS-S3B reduces hydroxyallysine-derived collagen cross-links and tissue stiffness.
Peripheral lung fibroblasts from IPF patients (n = 3 donors) were used in the in vitro model of fibrosis. Either 1 mM BAPN, PXS-S3B (at the concentrations indicated) or vehicle control (0.1% DMSO) were added to the medium after 24 hr of culture and the cells cultured in the presence of TGF-β1 for 6 weeks. (A–C) Hydroxyallysine-derived collagen cross-link analysis, normalised to total collagen content: (A) HLNL content determined by LC-MS; (B) DHLNL content determined by LC-MS; (C) Total mature (PYD +DPD) cross-link content determined by ELISA. Bars are mean +s.e.m. *p<0.05; **p<0.01; ***p<0.001 by one-way repeated measures ANOVA with Dunnett’s post-test. (D) Total collagen content determined by hydroxyproline assay normalised by total protein. Bars are mean +s.e.m. (E) Young’s modulus determined by parallel plate compression testing of the 3D in vitro model of fibrosis. Bars are mean +s.e.m of normalised data. *p<0.05; **p<0.01 by one sample t-test. The downward arrows in (A–E) identify the LOXL2/LOXL3-selective dose.
Videos
Video 1
10x Time-lapse movie of an in vitro model fibrosis sample during testing by parallel plate compression.
https://doi.org/10.7554/eLife.36354.011Additional files
-
Transparent reporting form
- https://doi.org/10.7554/eLife.36354.015
Download links
A two-part list of links to download the article, or parts of the article, in various formats.
Downloads (link to download the article as PDF)
Open citations (links to open the citations from this article in various online reference manager services)
Cite this article (links to download the citations from this article in formats compatible with various reference manager tools)
Nanoscale dysregulation of collagen structure-function disrupts mechano-homeostasis and mediates pulmonary fibrosis
eLife 7:e36354.
https://doi.org/10.7554/eLife.36354


