A multispecies coalescent model for quantitative traits
- Indiana University, United States
- Arizona State University, United States
- Temple University, United States
Figures
Figure 1
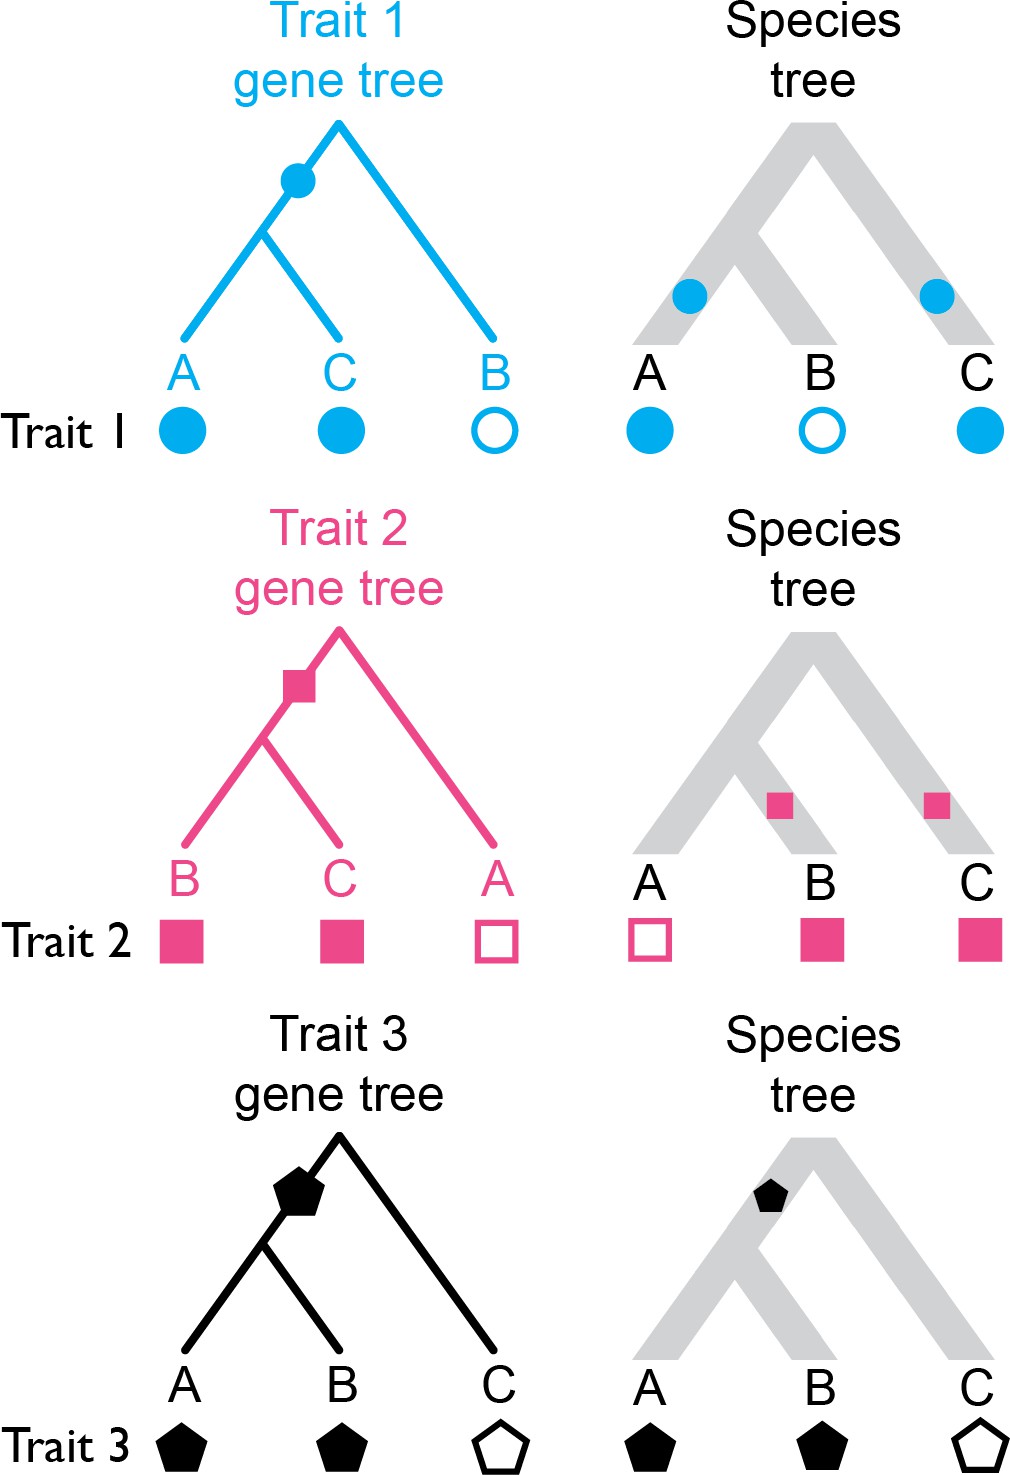
Three distinct discrete traits with their states mapped to the gene trees they evolved on, and to the species tree.
Hollow and filled shapes represent the ancestral and derived states, respectively, with character-state transitions being indicated by filled shapes along internal branches. Traits 1 and 2 undergo a single character-state transition in their evolutionary history, but when the states are resolved on the species tree, a homoplasy-like (yet not truly homoplastic) pattern emerges (i.e. hemiplasy). Trait three has evolved along a gene tree that matches the species tree in topology, and so no hemiplasy occurs.
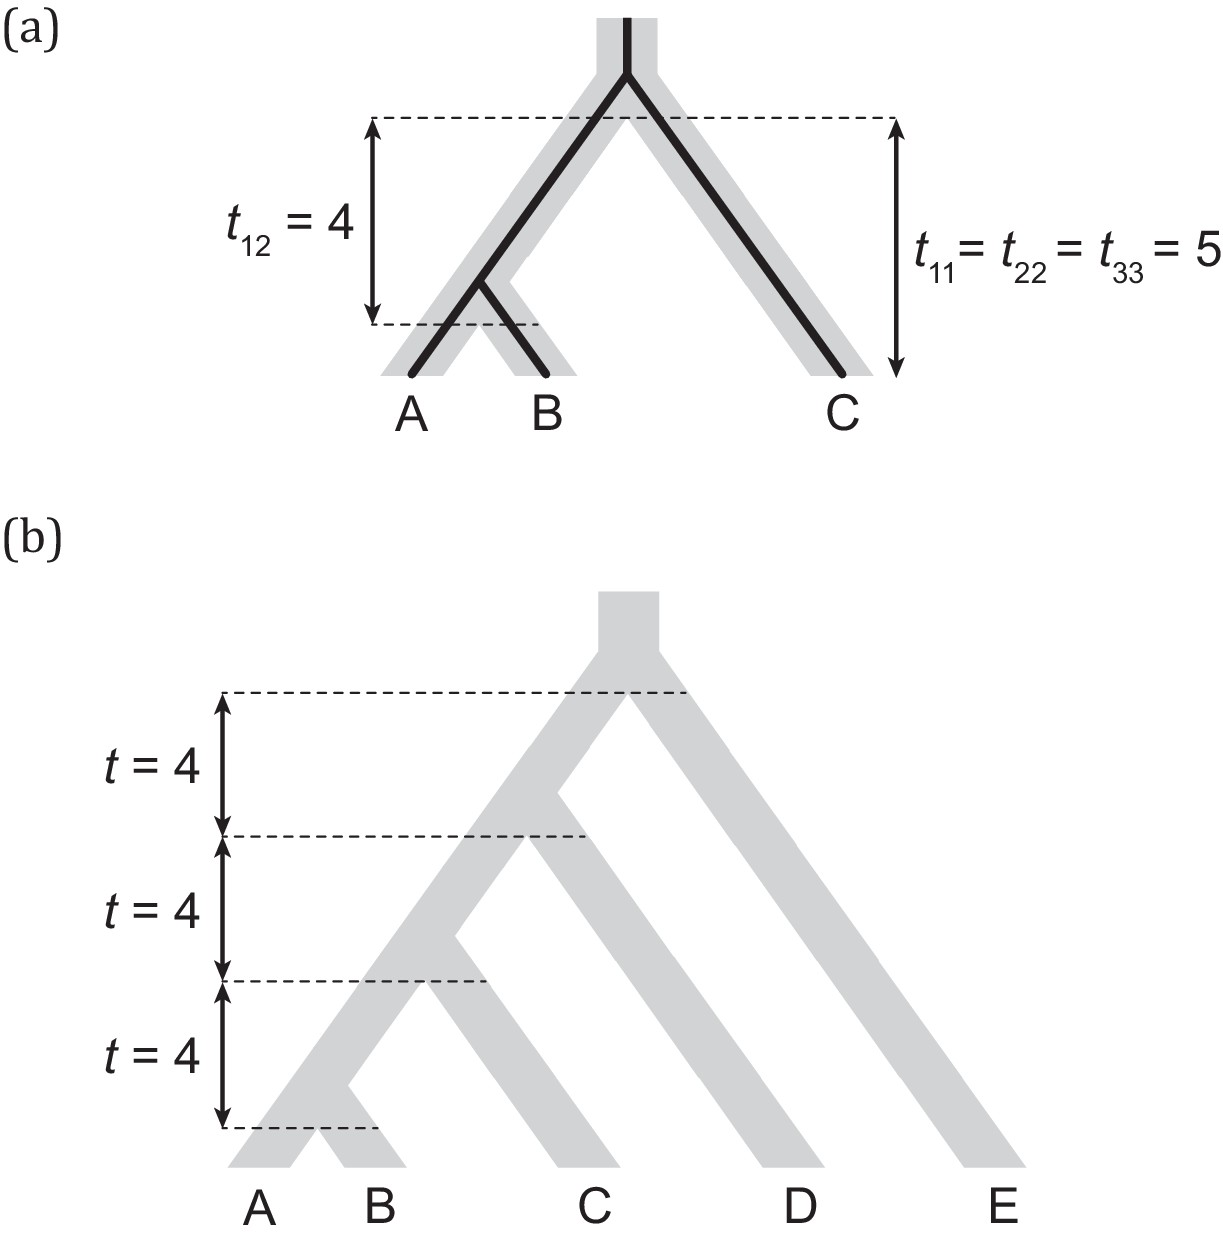
Figure 2
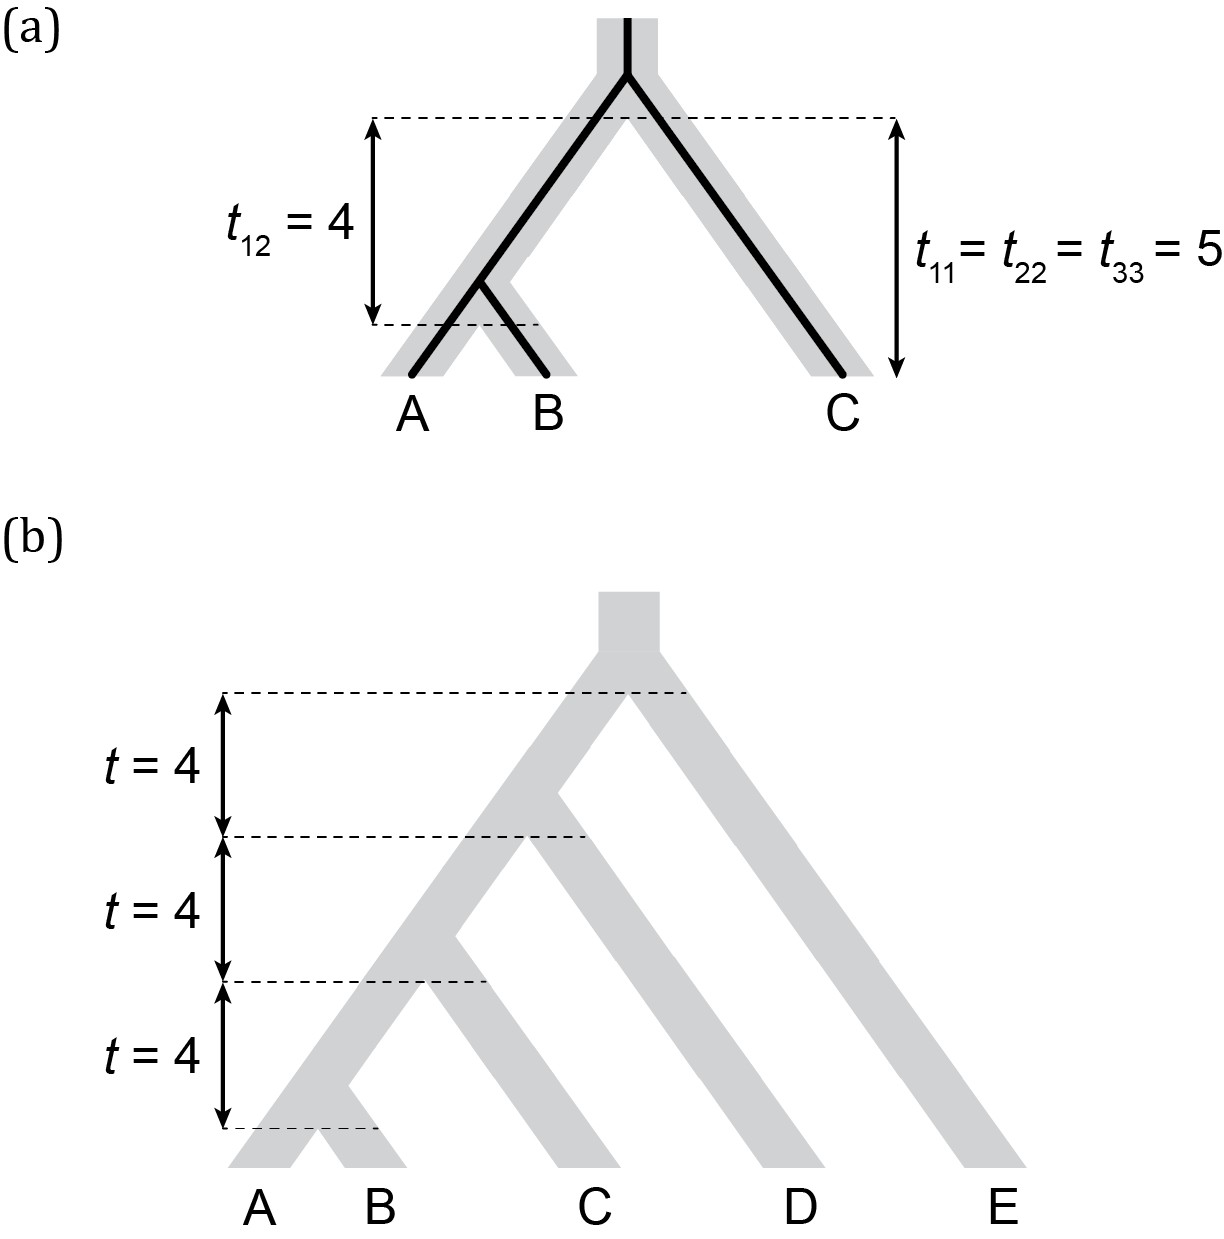
Three- and five-taxon trees with branch lengths indicated.
(a) Three-species phylogeny (and a concordant gene tree within it) and its corresponding T matrix entries. (b) Five-species phylogeny used in coalescent simulations for PCM analyses. Branch lengths are indicated in units of 2N generations.
Figure 3

A single continuous traits controlled by five loci, four of which have discordant gene trees.
(a) Genealogies of the loci controlling the trait. Asterisks represent mutations at a given site in each of the five loci. Ancestral alleles (0) have no effect on the trait value. Derived alleles (1) have their random effects on the trait value drawn from a mutational effect distribution (see (b)). (b) Mutational effect distribution of derived alleles. The distribution has a mean of zero and unit variance. (c) The outcome of a simulation consists of one trait value per species, which correspond to the sum of all derived allele mutational effects coming from all loci controlling the trait.
Figure 4
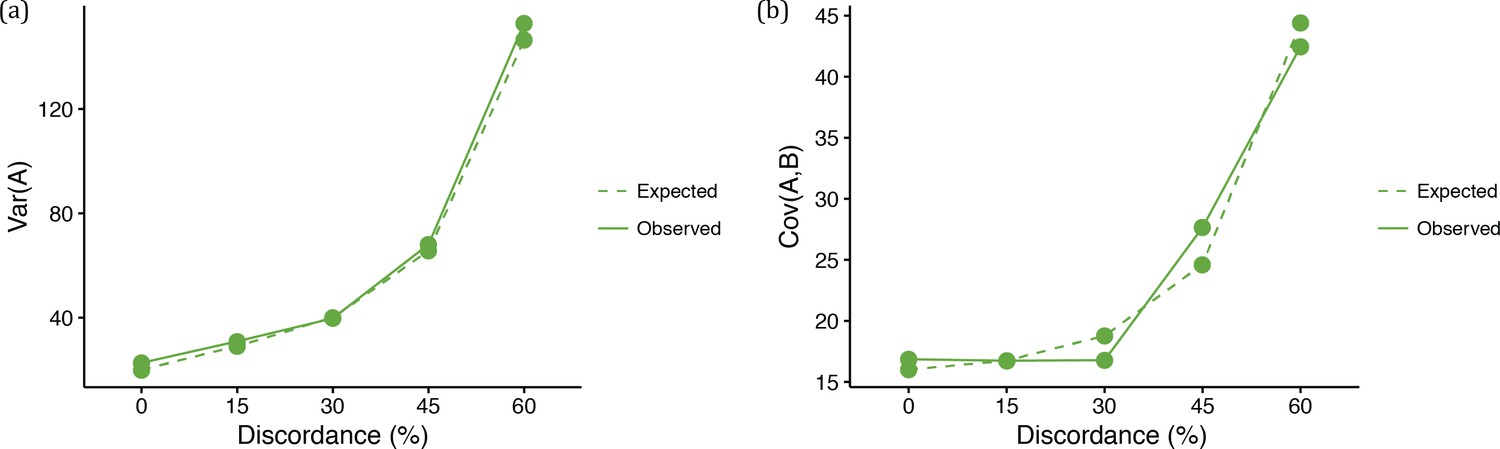
Quantitative trait summaries under varying levels of genealogical discordance, for a three-taxon species tree.
(a) Expected and observed variances in trait values of species A in each of the five ILS conditions. Expected values come from Equation 2. (b) Expected and observed covariances between species A and B in each of the five ILS conditions. Expected values come from Equation 3.
Figure 5

Quantitative trait summaries under varying levels of genealogical discordance, indicating the effect of hemiplasy for a three-taxon species tree.
(a) Expected and observed covariances between species A and C in each of the five ILS conditions. Expected values come from Equation 4. (b) Observed covariances between a pair of species normalized by the variance in species A, for all five ILS conditions.
Figure 6
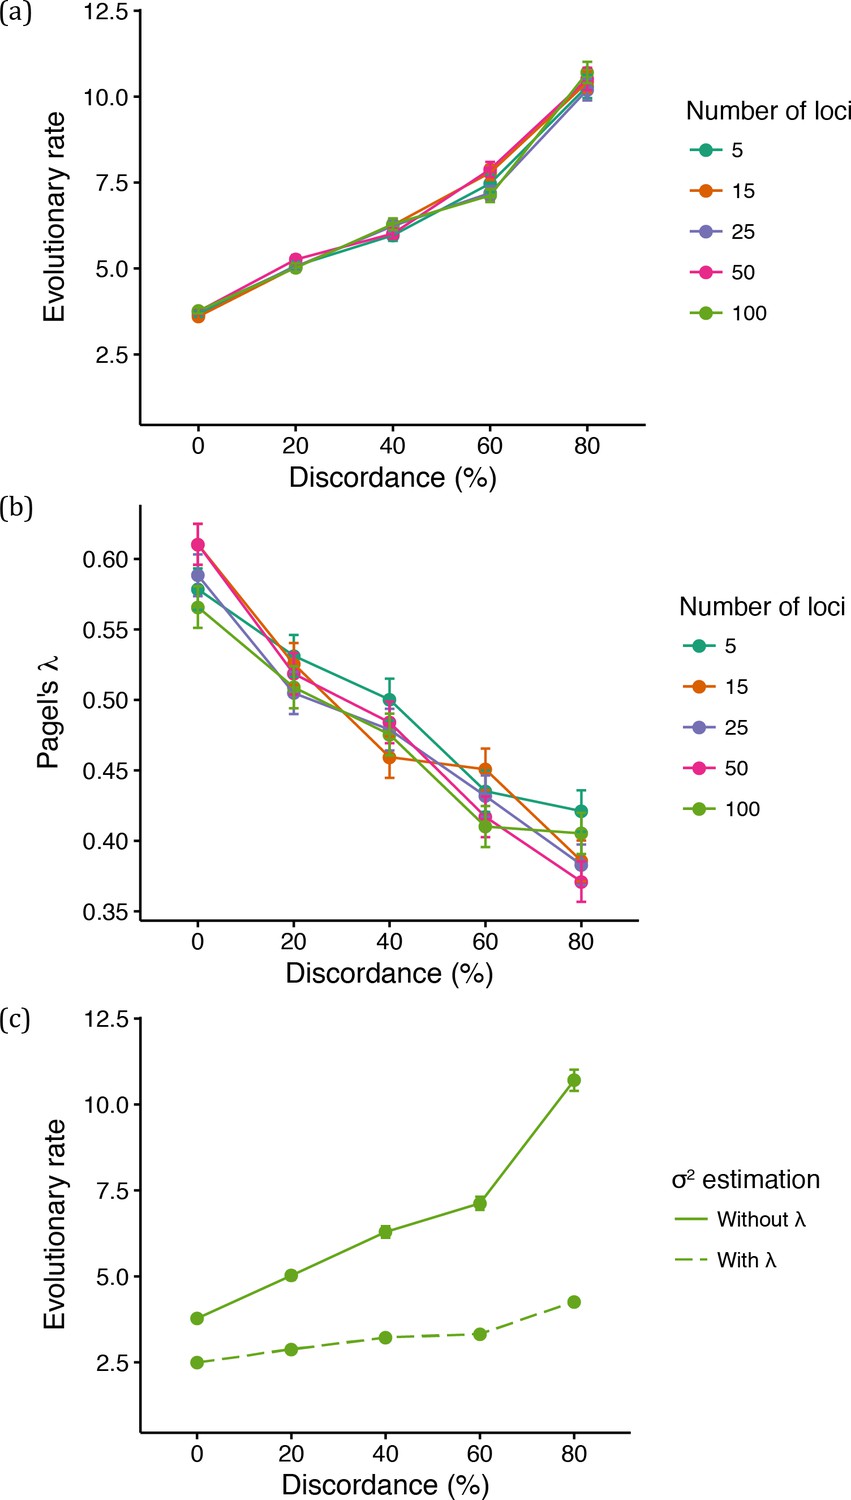
Mean parameter estimates under varying levels of genealogical discordance and number of loci controlling quantitative trait.
(a) Mean evolutionary rate for different number of loci controlling the simulated continuous trait and different levels of discordance. (b) Mean value of Pagel’s λ for different number of loci controlling the simulated continuous trait and different levels of discordance. (c) Mean evolutionary rate when 100 loci control the trait (‘Without λ’ is the same as shown in (a); in ‘With λ’, the rate was estimated with Pagel’s λ).
Figure 7
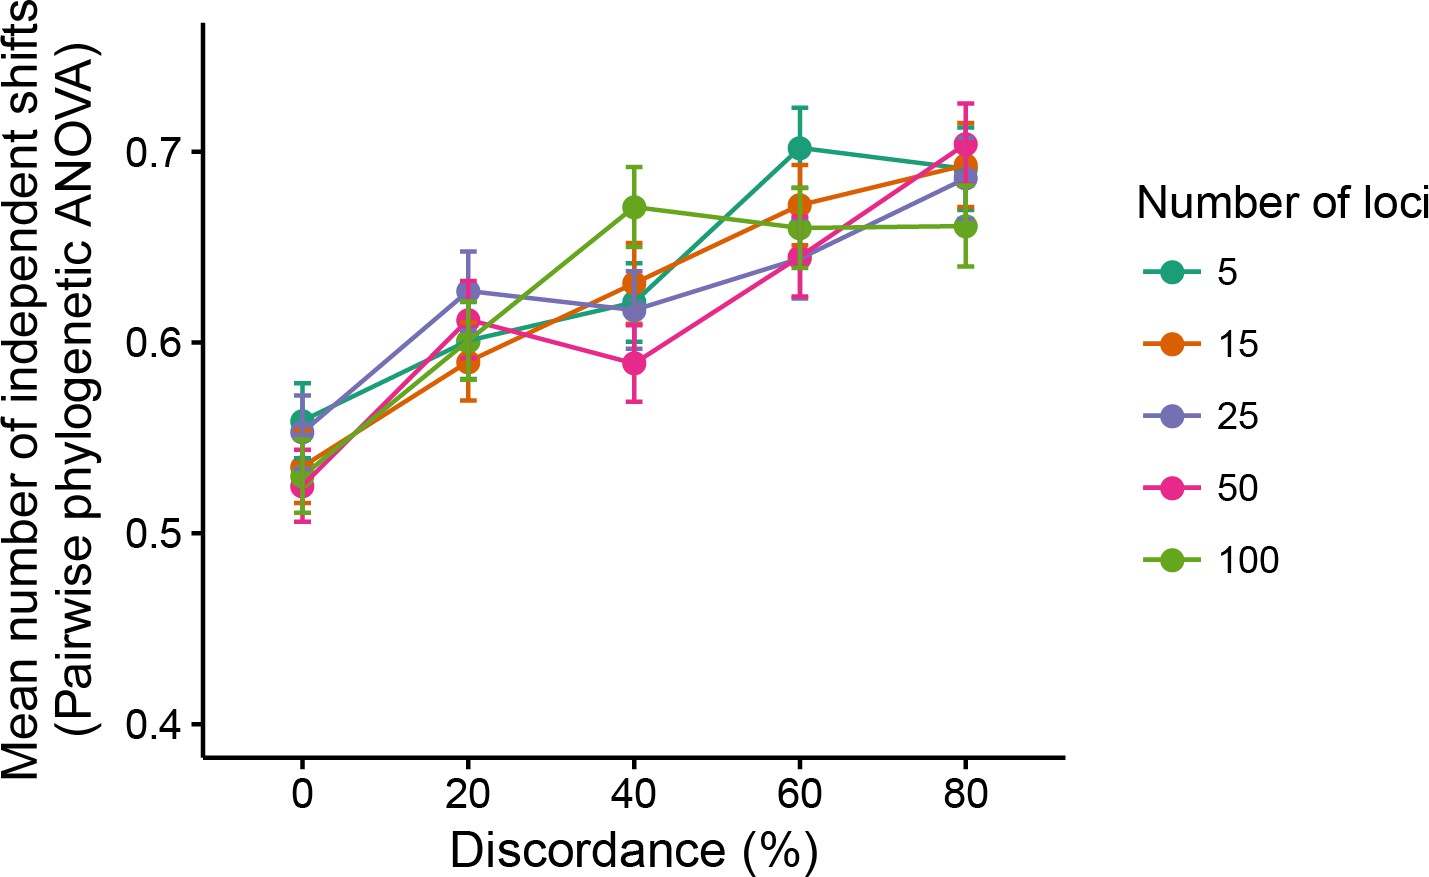
Mean number of independent trait-value shifts (i.e. significant phylogenetic ANOVA tests) among all possible groupings of two versus three species.
https://doi.org/10.7554/eLife.36482.008
Figure 8
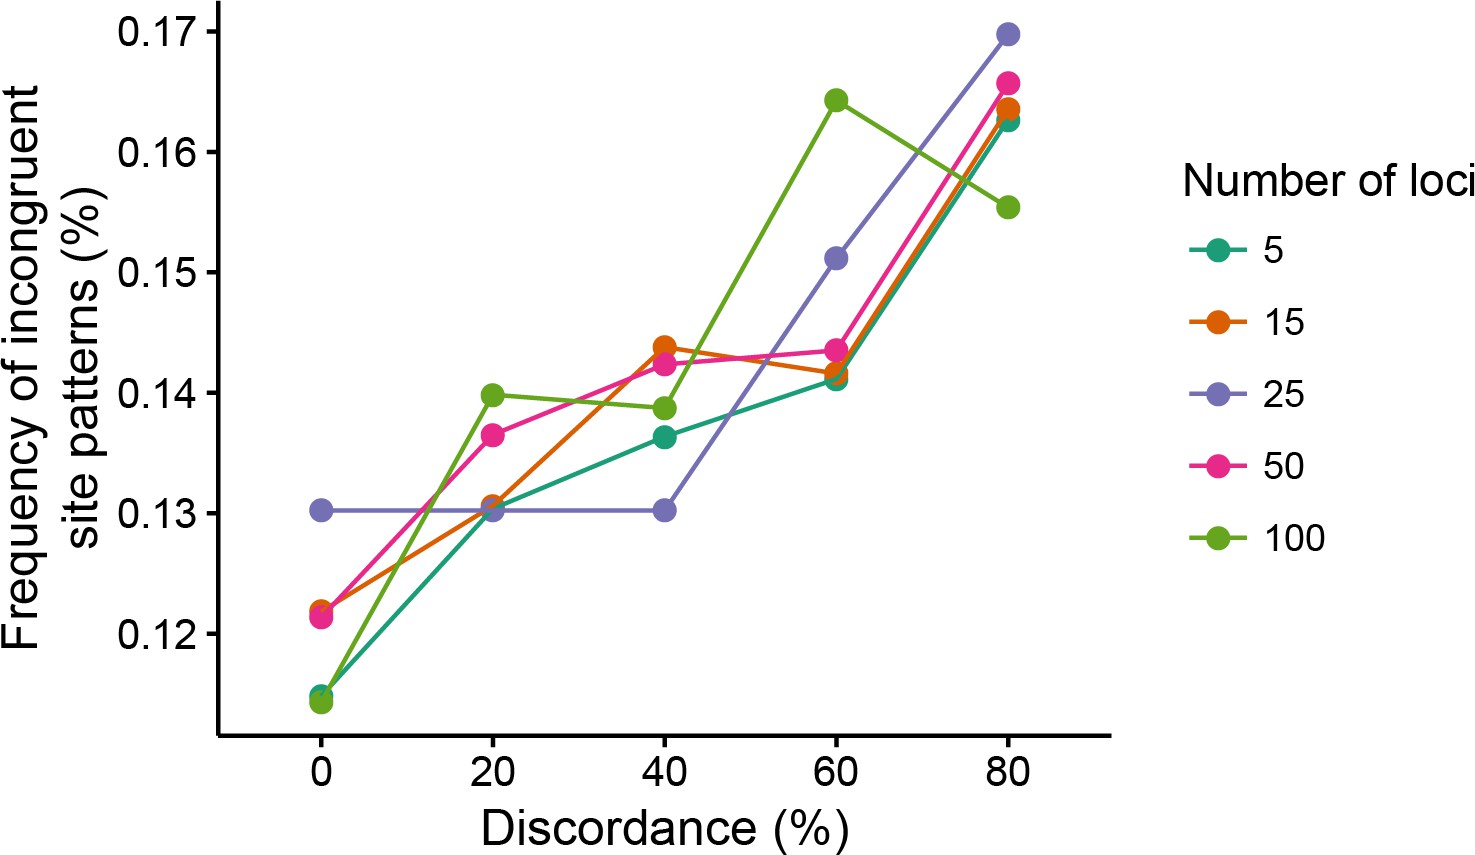
Frequency of incongruent trait patterns (out of all informative trait patterns) for threshold traits.
Each combination of level of discordance and number of loci was simulated 1000 times.
Appendix 1—figure 1
Divergence times, (, and for the species tree depicted in gray), and coalescence times, (, and for genealogy depicted in black).
https://doi.org/10.7554/eLife.36482.013Additional files
-
Source code file 1
R script for plotting figures.
- https://doi.org/10.7554/eLife.36482.010
-
Transparent reporting form
- https://doi.org/10.7554/eLife.36482.011
Download links
A two-part list of links to download the article, or parts of the article, in various formats.
Downloads (link to download the article as PDF)
Open citations (links to open the citations from this article in various online reference manager services)
Cite this article (links to download the citations from this article in formats compatible with various reference manager tools)
A multispecies coalescent model for quantitative traits
eLife 7:e36482.
https://doi.org/10.7554/eLife.36482


