Arcuate nucleus and lateral hypothalamic CART neurons in the mouse brain exert opposing effects on energy expenditure
- Garvan Institute of Medical Research, Australia
- Medical University of Graz, Austria
- Medical University Innsbruck, Austria
Figures
Figure 1
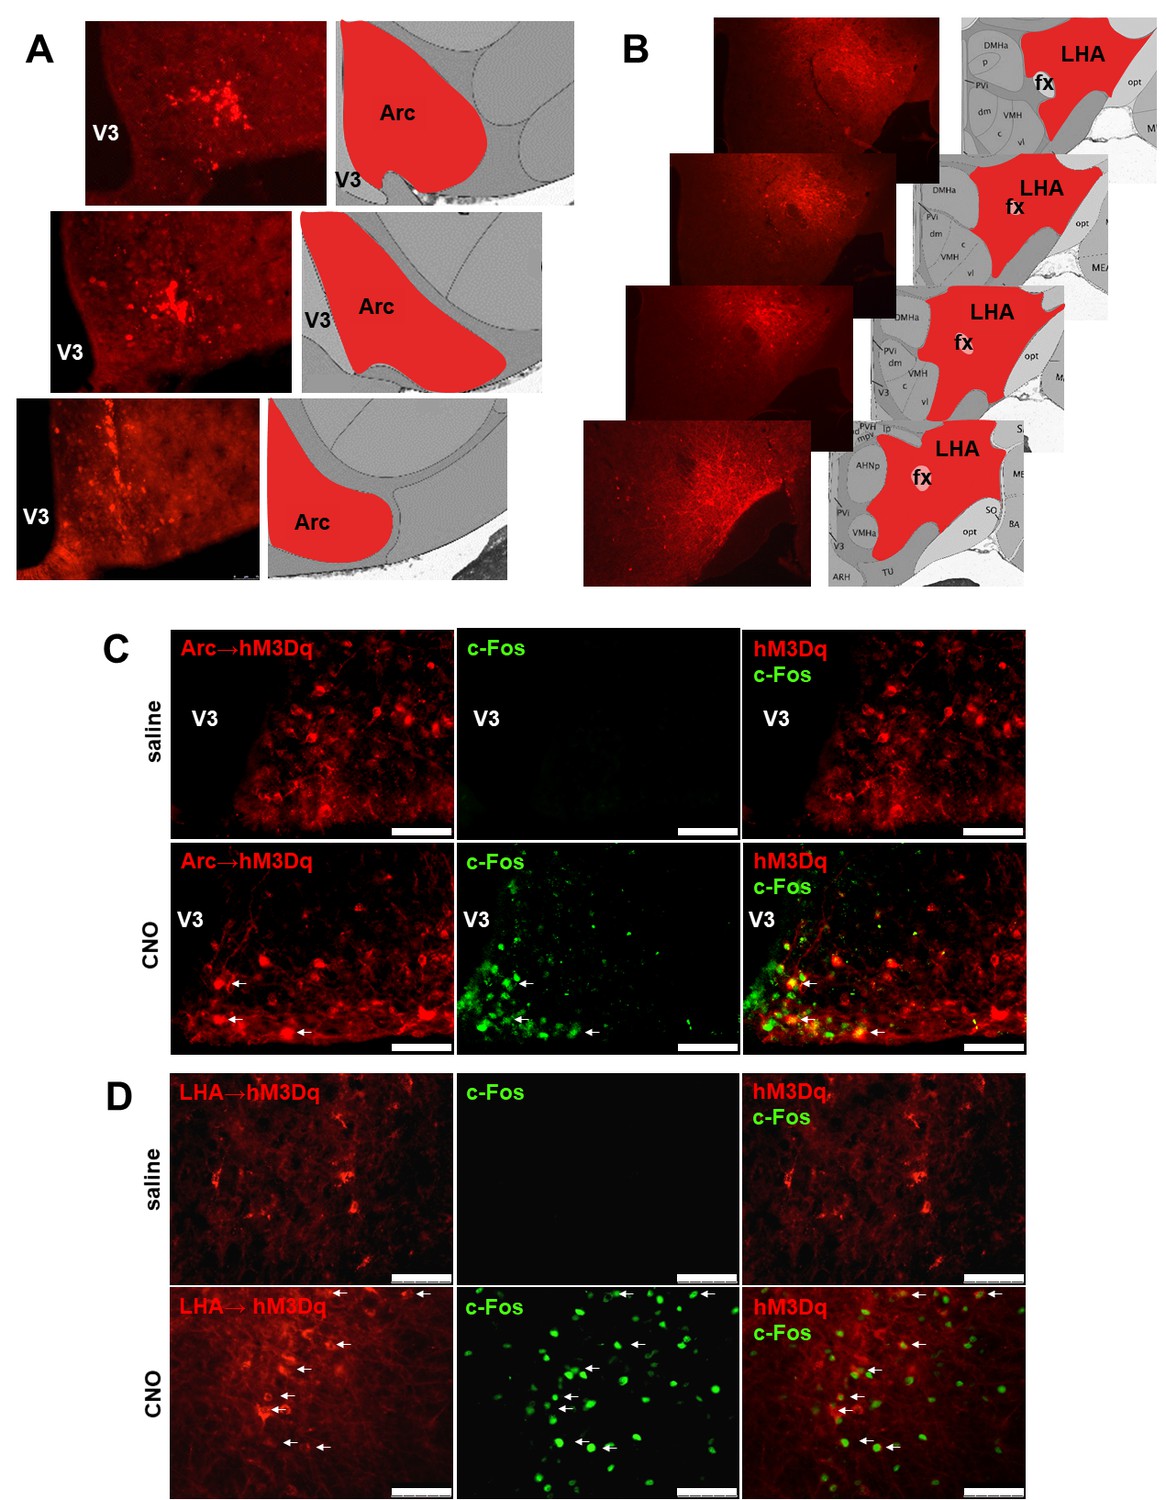
Validation of the expression sites of Cre-dependent AAV-hM3Dq-mCherry for CNO-mediated neuronal activation.
Fluorescence micrographs of coronal brain sections from respective Arc→hM3Dq (A) and LHA→hM3Dq (B) Cartptcre/+ mice, showing the mCherry reporter being specifically expressed in the respective areas. Selective CNO-mediated neuronal activation marked by c-Fos expression in hM3Dq-mCherry-positive CART neurons at the Arc (C) and the LHA (D) (white arrows). Scale bar = 75 μm. Arc, arcuate nucleus; fx, fornix; LHA, lateral hypothalamic area; V3, third ventricle.
Figure 2 with 1 supplement
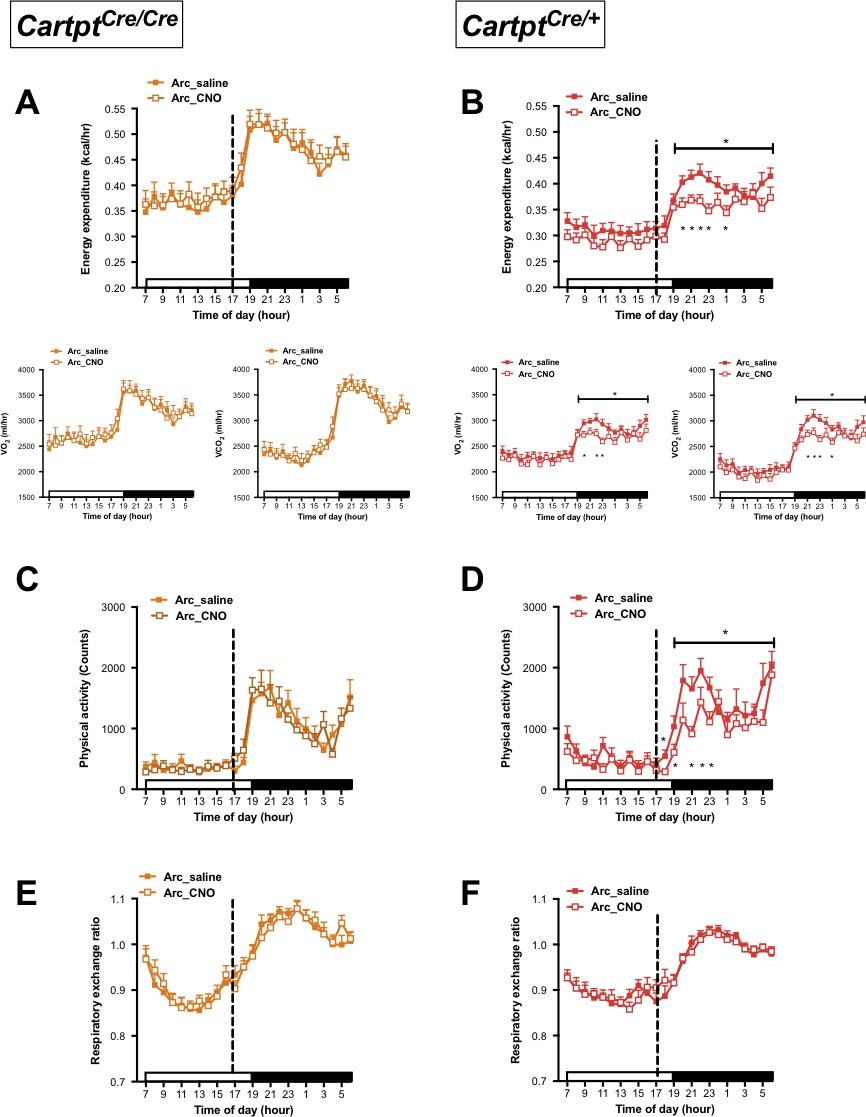
CNO-mediated activation of hM3Dq-containing Arc CART neurons leads to a reduction in energy expenditure and physical activity in Cartptcre/+ mice.
Indirect calorimetric assessments following saline or CNO injection for the 24 hr time course of energy expenditure, VO2 and VCO2 (A, B), physical activity (C, D), and respiratory exchange ratio (E, F) in Arc→hM3Dq Cartptcre/cre and Arc→hM3Dq Cartptcre/+ mice, respectively. Open and filled horizontal bars indicate the light and dark photoperiods, respectively. Dotted line indicates the time of i.p. injection of saline or CNO. Data are means ±SEM. n = 10–12; *p≤0.05 for saline versus CNO treatments.
Figure 2—figure supplement 1
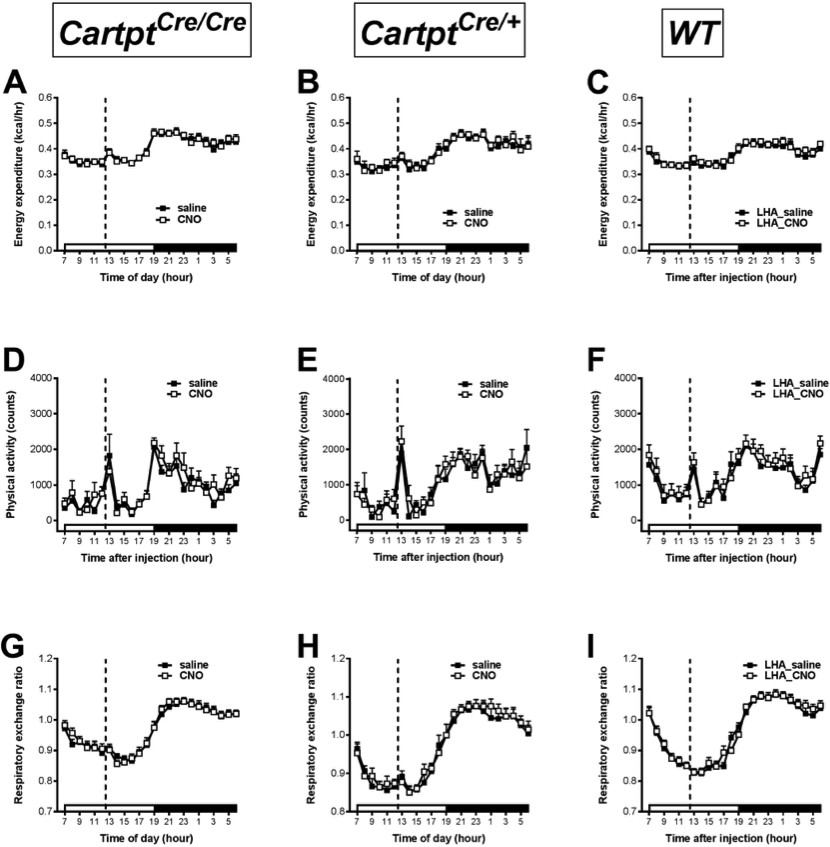
CNO does not exert any effects on physical activity, energy expenditure and respiratory exchange ratio in the absence of hM3Dq-expression in Cartptcre/cre, Cartptcre/+and wild type mice.
Indirect calorimetric assessments following saline or CNO injection for the 24 hr time course of energy expenditure (A, B, C), physical activity represented as total count (D, E, F), and respiratory exchange ratio (G, H, I) in Cartptcre/cre (A, D, G), Cartptcre/+ (B, E, H) without hM3Dq-injection and wild type mice receiving bilateral LHA→hM3Dq but lacking Cre-recombinase expression (C, F, I), respectively. Open and filled horizontal bars indicate the light and dark photoperiods, respectively. Dotted lines indicate the time of i.p. injection of saline or CNO. Data are means ±SEM. n = 8.
Figure 3
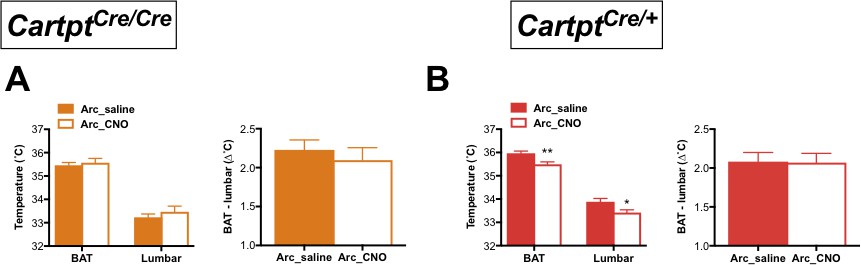
CNO-mediated activation of hM3Dq-containing Arc CART neurons leads to a decrease in body skin temperature in Cartptcre/+ mice.
Temperatures of the interscapular brown adipose tissue (BAT) and the lumbar back region, as well as the temperature differences between the inter-scapular and lumbar areas 2 hr following saline or CNO injection, measured by high-sensitivity infrared imaging in Arc→hM3Dq Cartptcre/cre (A) and Arc→hM3Dq Cartptcre/+ mice (B). Data are means ±SEM. n = 10–12; *p≤0.05, **p≤0.01 for saline versus CNO treatments.
Figure 4
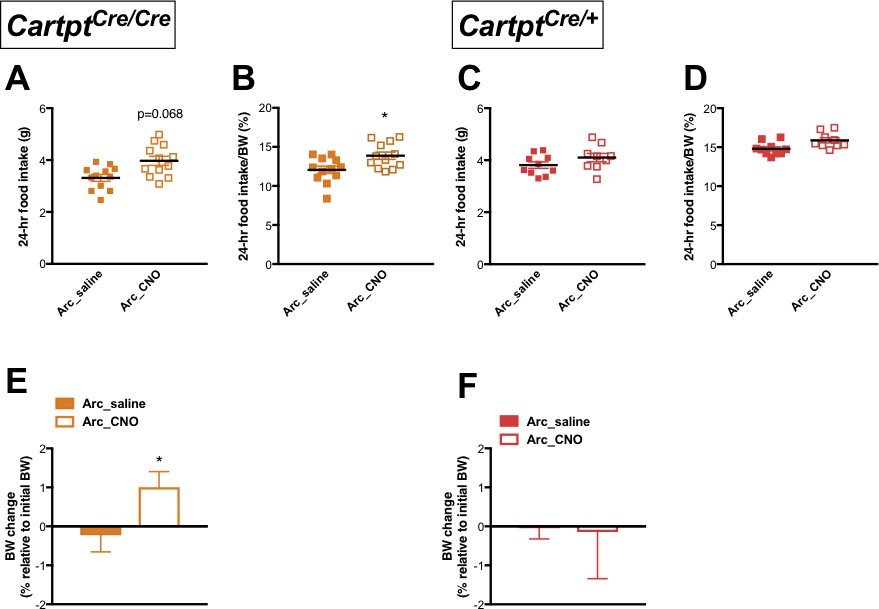
CNO-induced activation of hM3Dq-positive CART neurons in the Arc increases 24 hr food intake and results in weight gain in homozygous Cartptcre/cre mice.
Food intake during fed state 24 hr following saline or CNO injection in Arc→hM3Dq mice, expressed both as absolute amounts of food intake (A, C) and as a percentage of body weight (B, D), for Cartptcre/cre and Cartptcre/+ mice, respectively. The corresponding body weight change at 24 hr in proportion to pre-treatment body weight (E, F) measured in Cartptcre/cre and Cartptcre/+ Arc→hM3Dq mice receiving saline or CNO injection. Data are means ±SEM. n = 10–12; *p≤0.05 for saline versus CNO treatments.
Figure 5
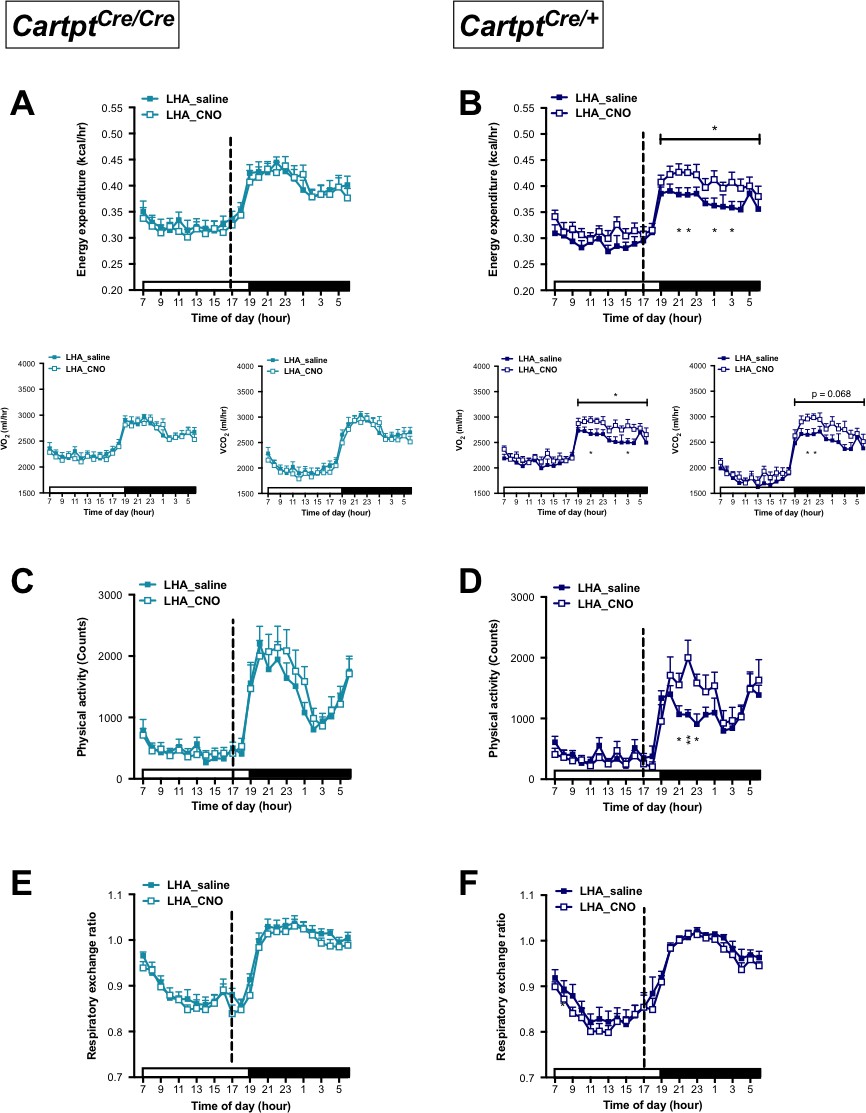
CNO-mediated activation of hM3Dq-containing LHA CART neurons increases energy expenditure and physical activity in Cartptcre/+ mice.
Indirect calorimetric assessments following saline or CNO injection for the 24 hr time course of energy expenditure, VO2 and VCO2 (A, B), physical activity (C, D), and respiratory exchange ratio (E, F) in LHA→hM3Dq Cartptcre/cre and LHA→hM3Dq Cartptcre/+ mice, respectively. Open and filled horizontal bars indicate the light and dark photoperiods, respectively. Dotted line indicates the time of i.p. injection of saline or CNO. Data are means ±SEM. n = 10–12; *p≤0.05, **p≤0.01 for saline versus CNO treatments.
Figure 6
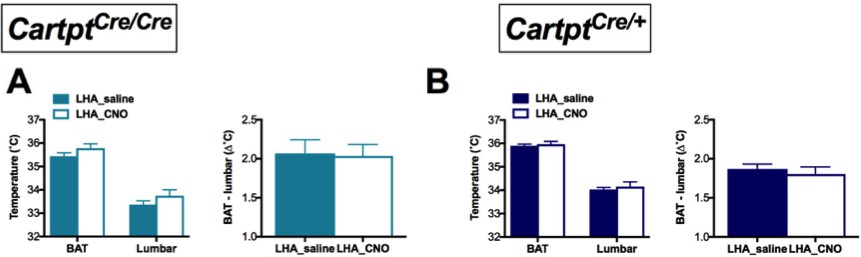
CNO-mediated unilateral activation of hM3Dq-containing LHA CART neurons does not affect body temperature of Cartptcre/cre and Cartptcre/+ mice.
Temperatures of the BAT and the lumbar back region, as well as the temperature differences between the inter-scapular and lumbar areas of Cartptcre/cre (A) and Cartptcre/+ (B) mice measured by high-sensitivity infrared imaging 2 hr after i.p. injection of saline or CNO. Data are means ±SEM. n = 10–12.
Figure 7

CNO-induced activation of hM3Dq-positive CART neurons in the LHA increases 24 hr food intake and body weight gain in heterozygous Cartptcre/+ mice.
Food intake during fed state 24 hr following saline or CNO injection in LHAhM3Dq mice, expressed both as absolute amounts (A, C) and as a percentage of body weight (B, D) for Cartptcre/cre and Cartptcre/+ mice, respectively. The corresponding body weight change at 24 hr in proportion to pre-treatment body weight (E, F) measured in Cartptcre/cre and Cartptcre/+ LHA→hM3Dq mice receiving saline or CNO injection. Data are means ±SEM. n = 10–12; *p≤0.05, **p≤0.01 for saline versus CNO treatments.
Figure 8
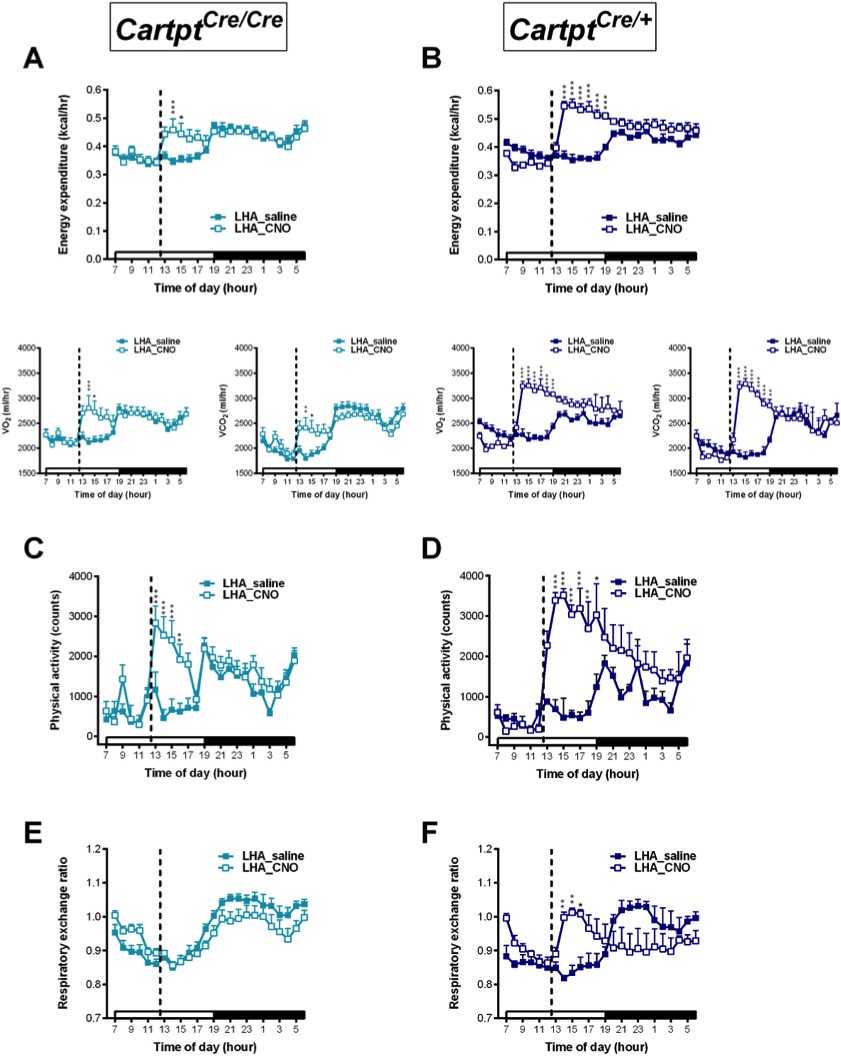
CNO-mediated bilateral activation of hM3Dq-containing LHA CART neurons leads to elevation in physical activity, energy expenditure and respiratory exchange ratio in Cartptcre/+ mice.
Indirect calorimetric assessments following saline or CNO injection for the 24 hr time course of energy expenditure, VO2 and VCO2 (A, B), physical activity represented as total count (C, D), and respiratory exchange ratio (E, F) in LHA→hM3Dq Cartptcre/cre and LHA→hM3Dq Cartptcre/+ mice, respectively. Open and filled horizontal bars indicate the light and dark photoperiods, respectively. Dotted lines indicate the time of i.p. injection of saline or CNO. Data are means ± SEM. n = 6–7; *p≤0.05, **p≤0.01, ***p≤0.001 for saline versus CNO treatments.
Figure 9 with 1 supplement
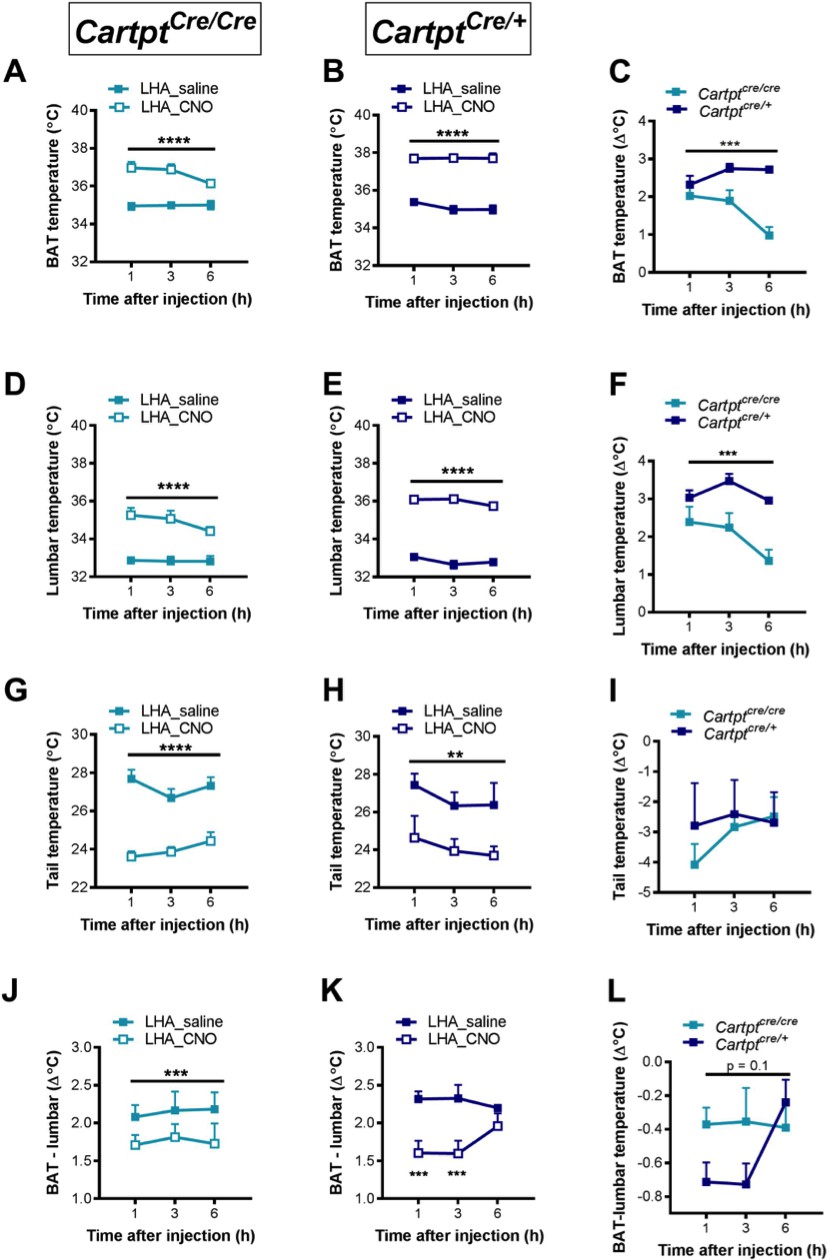
CNO-mediated bilateral activation of hM3Dq-containing LHA CART neurons leads to increased body skin temperature in Cartptcre/cre and Cartptcre/+ mice.
Temperatures of the interscapular brown adipose tissue (BAT) (A, B), the lumbar back (D,E), the tail (G,H) and differences between BAT and lumbar temperatures (J, K) measured by high-sensitivity infrared imaging 1, 3 and 6 hr after i.p. injection of saline or CNO. The difference of these parameters between Cartptcre/cre and Cartptcre/+ mice was assessed by subtracting the value of CNO from that of saline at the corresponding time point for each mouse (C,F, I, L). Data are means ± SEM. n = 6–7; *p≤0.05, **p≤0.01, ***p≤0.001, ****p≤0.0001 for saline versus CNO treatments.
Figure 9—figure supplement 1
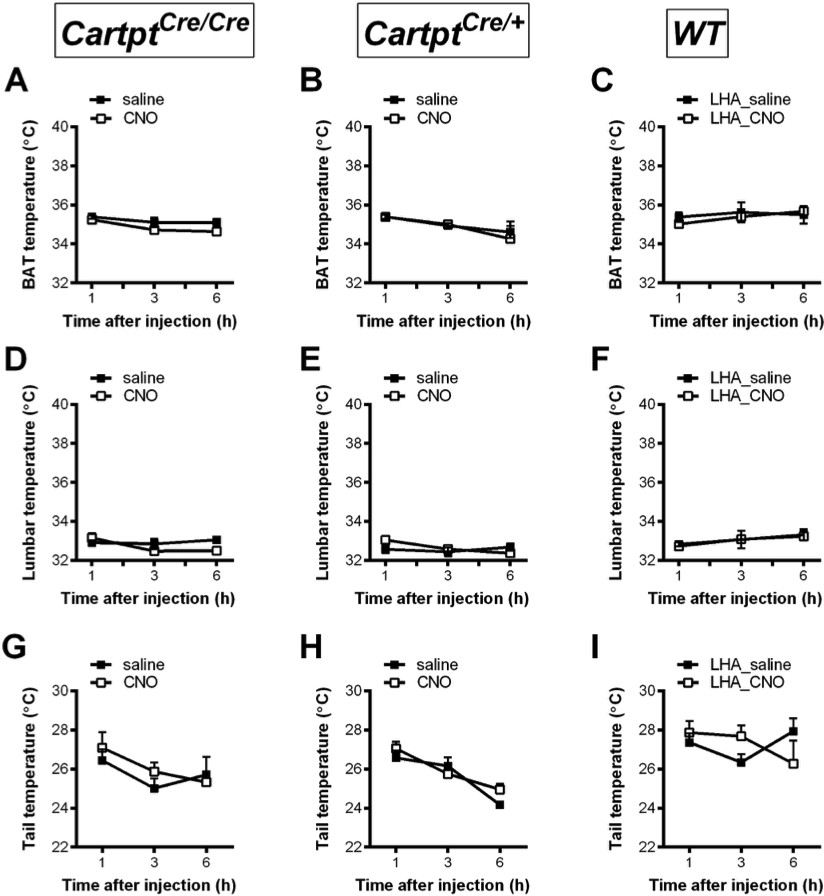
CNO does not exert any effects on body skin temperature in the absence of hM3Dq-expression in Cartptcre/cre, Cartptcre/+ and wild type mice.
Temperatures of the interscapular brown adipose tissue (BAT) (A, B, C), the lumbar back (D, E, F), the tail (G, H, I) measured by high-sensitivity infrared imaging 1, 3 and 6 hr after i.p. injection of saline or CNO of Cartptcre/cre (A, D, G), Cartptcre/+ (B, E, H) without hM3Dq-injection and wild type mice receiving bilateral LHA→hM3Dq but lacking Cre-recombinase expression (C, F, I). Data are means ± SEM. n = 8.
Figure 10 with 1 supplement

CNO-induced bilateral activation of hM3Dq-positive CART neurons in the LHA leads to an increase in ingestive behavior and body weight in heterozygous Cartptcre/+mice.
Cumulative food intake during fed state 6 hr following saline or CNO injection in bilateral LHA→hM3Dq Cartptcre/cre and Cartptcre/+ mice (A, B) as well as interaction with the food hopper (C, D). Cumulative water intake during fed state 6 hr following saline or CNO injection in bilateral LHA→hM3Dq Cartptcre/cre and Cartptcre/+ mice (E, F) and interaction with the water bottle (G, H). Body weight before and after injection of saline or CNO (indicated by dotted line) and corresponding body weight change at 1, 3 and 6 hr in proportion to pre-treatment body weight (I, J) measured in Cartptcre/cre and Cartptcre/+ LHA→hM3Dq mice receiving saline or CNO injection. Open and filled horizontal bars indicate the light and dark photoperiods, respectively. Dotted lines indicate the time of i.p. injection of saline or CNO. Data are means ± SEM. n = 6–7; *p≤0.05, **p≤0.01, ***p≤0.001 for saline versus CNO treatments.
Figure 10—figure supplement 1
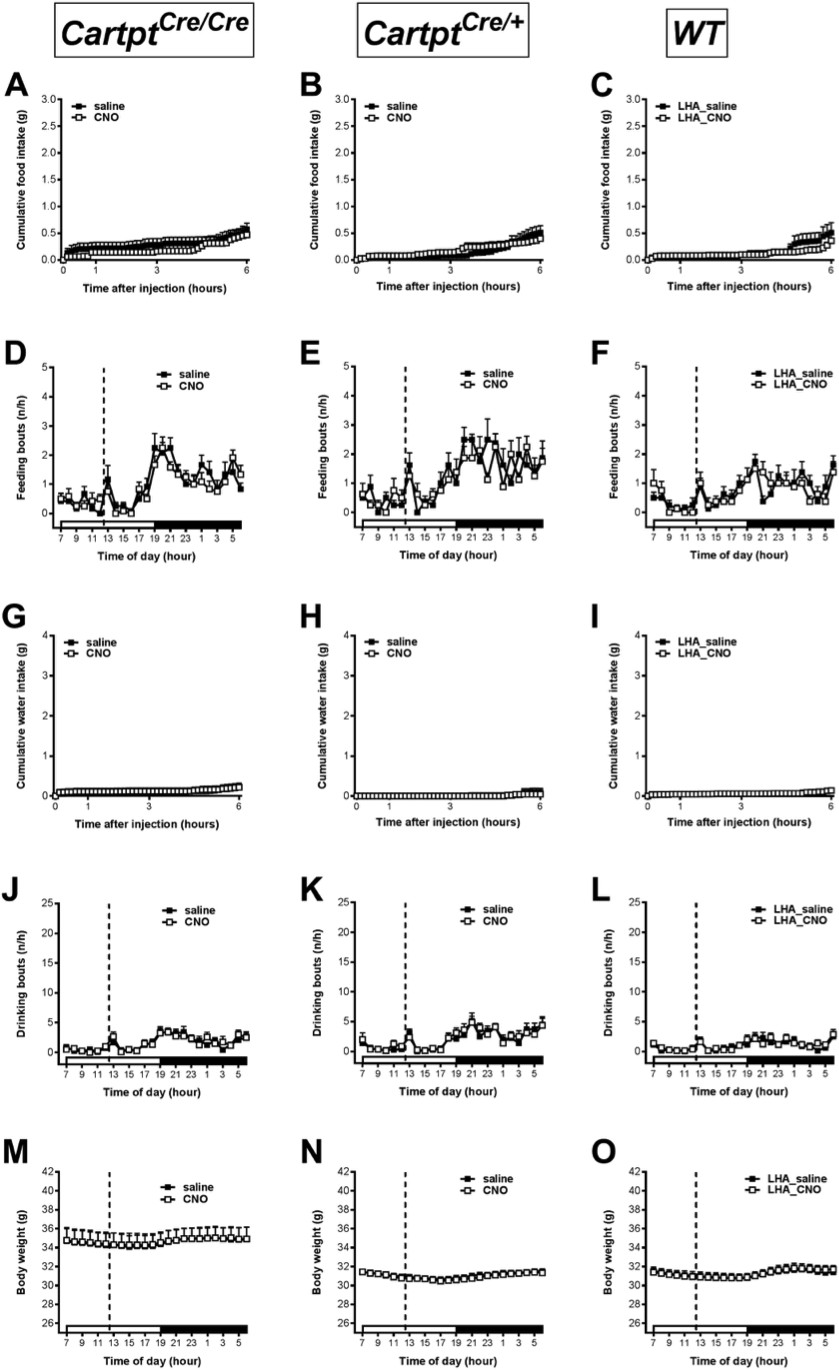
CNO does not exert any effects on ingestive behavior and body weight in the absence of hM3Dq-expression in Cartptcre/cre, Cartptcre/+ and wild type mice.
Cumulative food intake and food hopper interaction during fed state 6 hr following saline or CNO injection Cartptcre/cre (A, D) and Cartptcre/+ mice (B, E) without hM3Dq-injection and wild type mice (C, F) receiving bilateral LHA→hM3Dq but lacking Cre-recombinase expression. Cumulative water intake and interaction with the water bottle during fed state 6 hr following saline or CNO injection in Cartptcre/cre (G, J) and CARTcre/+ mice (H, K) and wild type mice (I, L). Body weight before and after injection of saline or CNO (indicated by dotted line) measured in Cartptcre/cre (M) and Cartptcre/+ (N) as well as wild type mice (O). Open and filled horizontal bars indicate the light and dark photoperiods, respectively. Data are means ± SEM. n = 8.
Figure 11
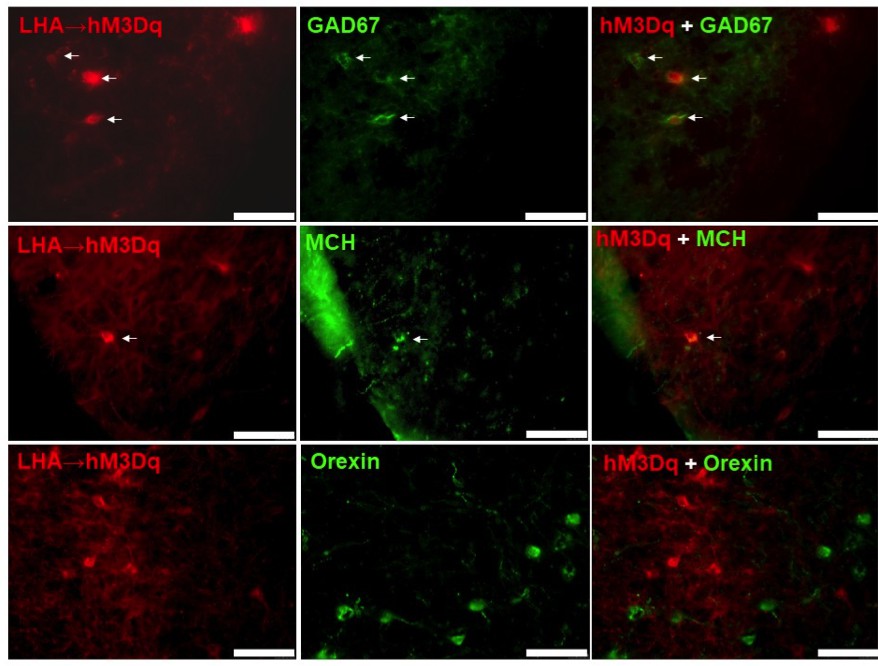
hM3Dq-mCherry-positive CART neurons co-express GAD67 and MCH, but not orexin.
Fluorescence micrographs of coronal brain sections from respective LHA→hM3Dq Cartptcre/+ mice, showing partial co-expression of the mCherry reporter with GAD67 (A), and MCH (B) (white arrows, right panels), while no co-expression could be observed with orexin (C) (right panel). Scale bar = 75 μm.
Figure 12

CART neurons in the LHA are highly heterogeneous and co-localise with various neurotransmitters involved in energy homeostasis.
Representative fluorescence micrograph showing fluorescent CART neurons in the LHA of a CART-TRAP mouse (A). Enrichment (>1) or derichment (<1) of various neurotransmitter transcripts in the immunoprecipitated (IP) mRNA relative to input mRNA of the LHA of CART-TRAP mice (B). Data are means ± SEM. n = 3. Opt, optical tract; V3, third ventricle.
Additional files
-
Supplementary file 1
Sequences of oligonucleotide primers used in qPCR
- https://doi.org/10.7554/eLife.36494.018
-
Transparent reporting form
- https://doi.org/10.7554/eLife.36494.019
Download links
A two-part list of links to download the article, or parts of the article, in various formats.
Downloads (link to download the article as PDF)
Open citations (links to open the citations from this article in various online reference manager services)
Cite this article (links to download the citations from this article in formats compatible with various reference manager tools)
Arcuate nucleus and lateral hypothalamic CART neurons in the mouse brain exert opposing effects on energy expenditure
eLife 7:e36494.
https://doi.org/10.7554/eLife.36494


