Revealing a novel nociceptive network that links the subthalamic nucleus to pain processing
- Inserm, France
- Université Grenoble Alpes, France
- Institut de Neurosciences de la Timone, Aix-Marseille Université, France
- CHU Grenoble Alpes, France
- University of Sheffield, United Kingdom
Figures
Figure 1
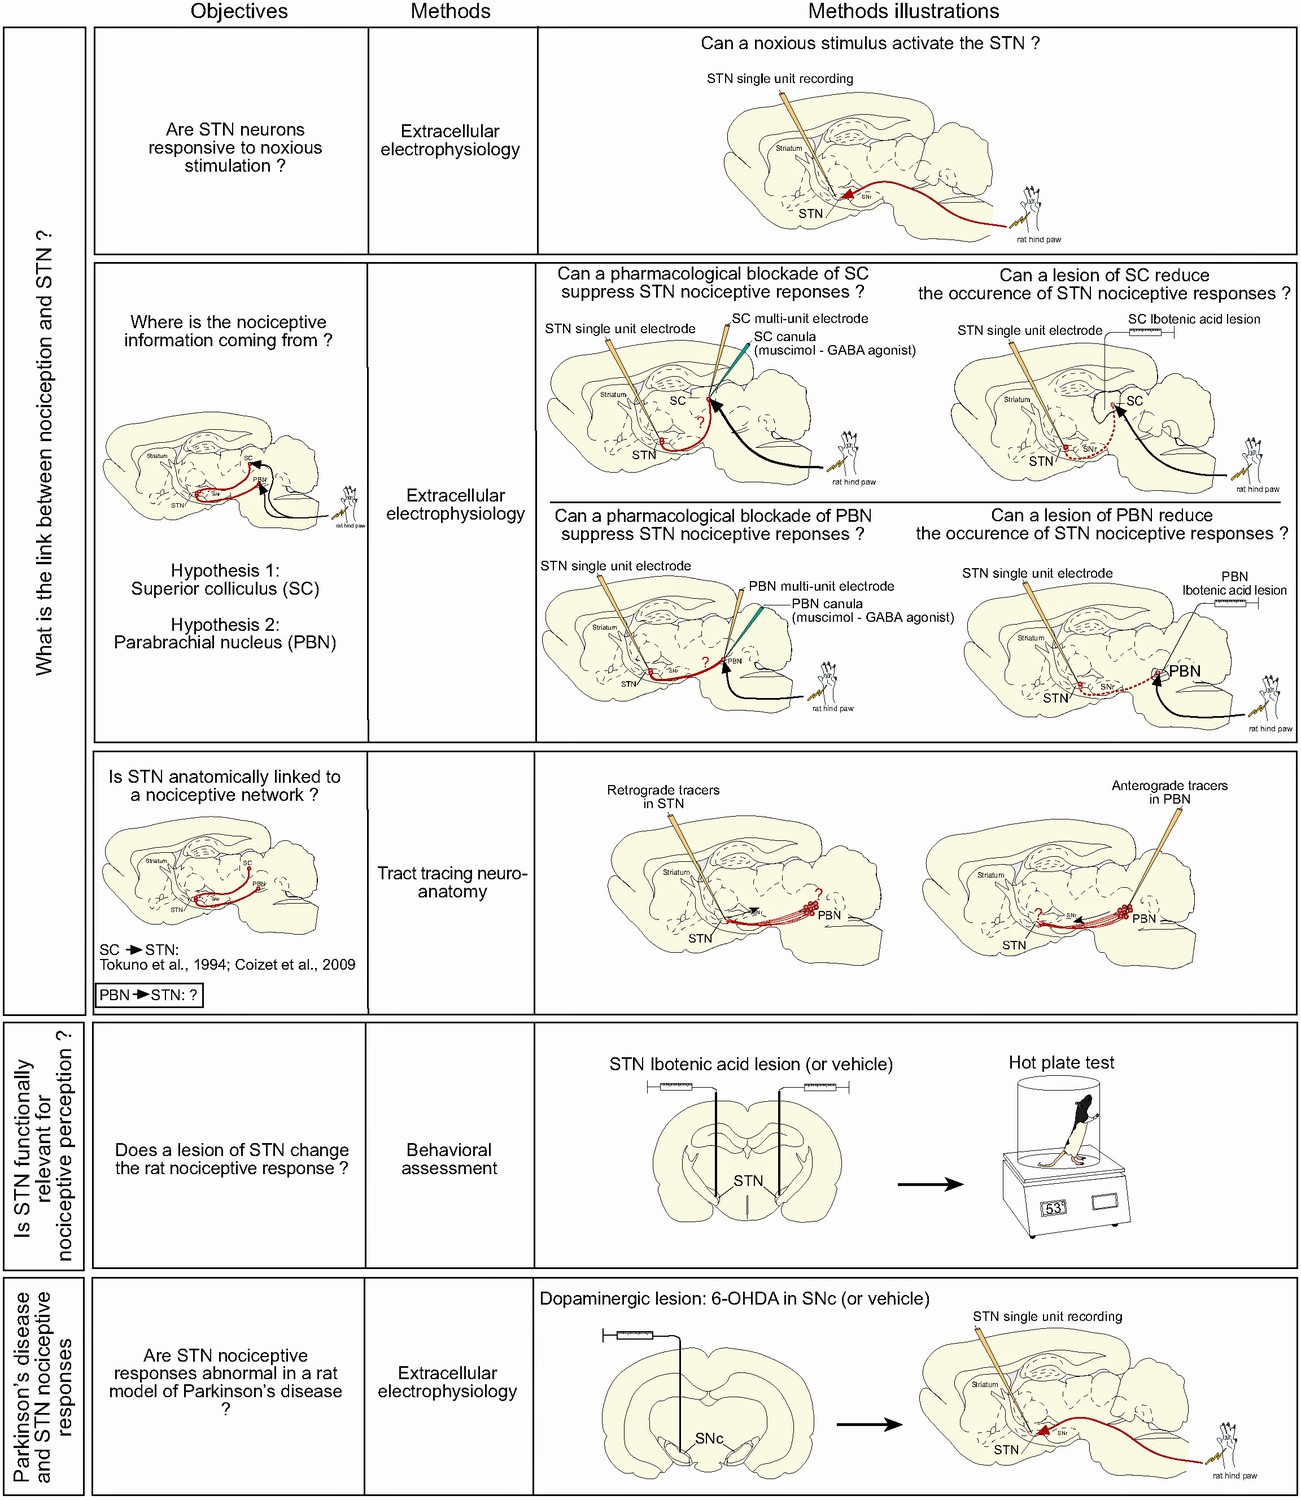
Summary of the objectives and methods.
https://doi.org/10.7554/eLife.36607.003
Figure 2
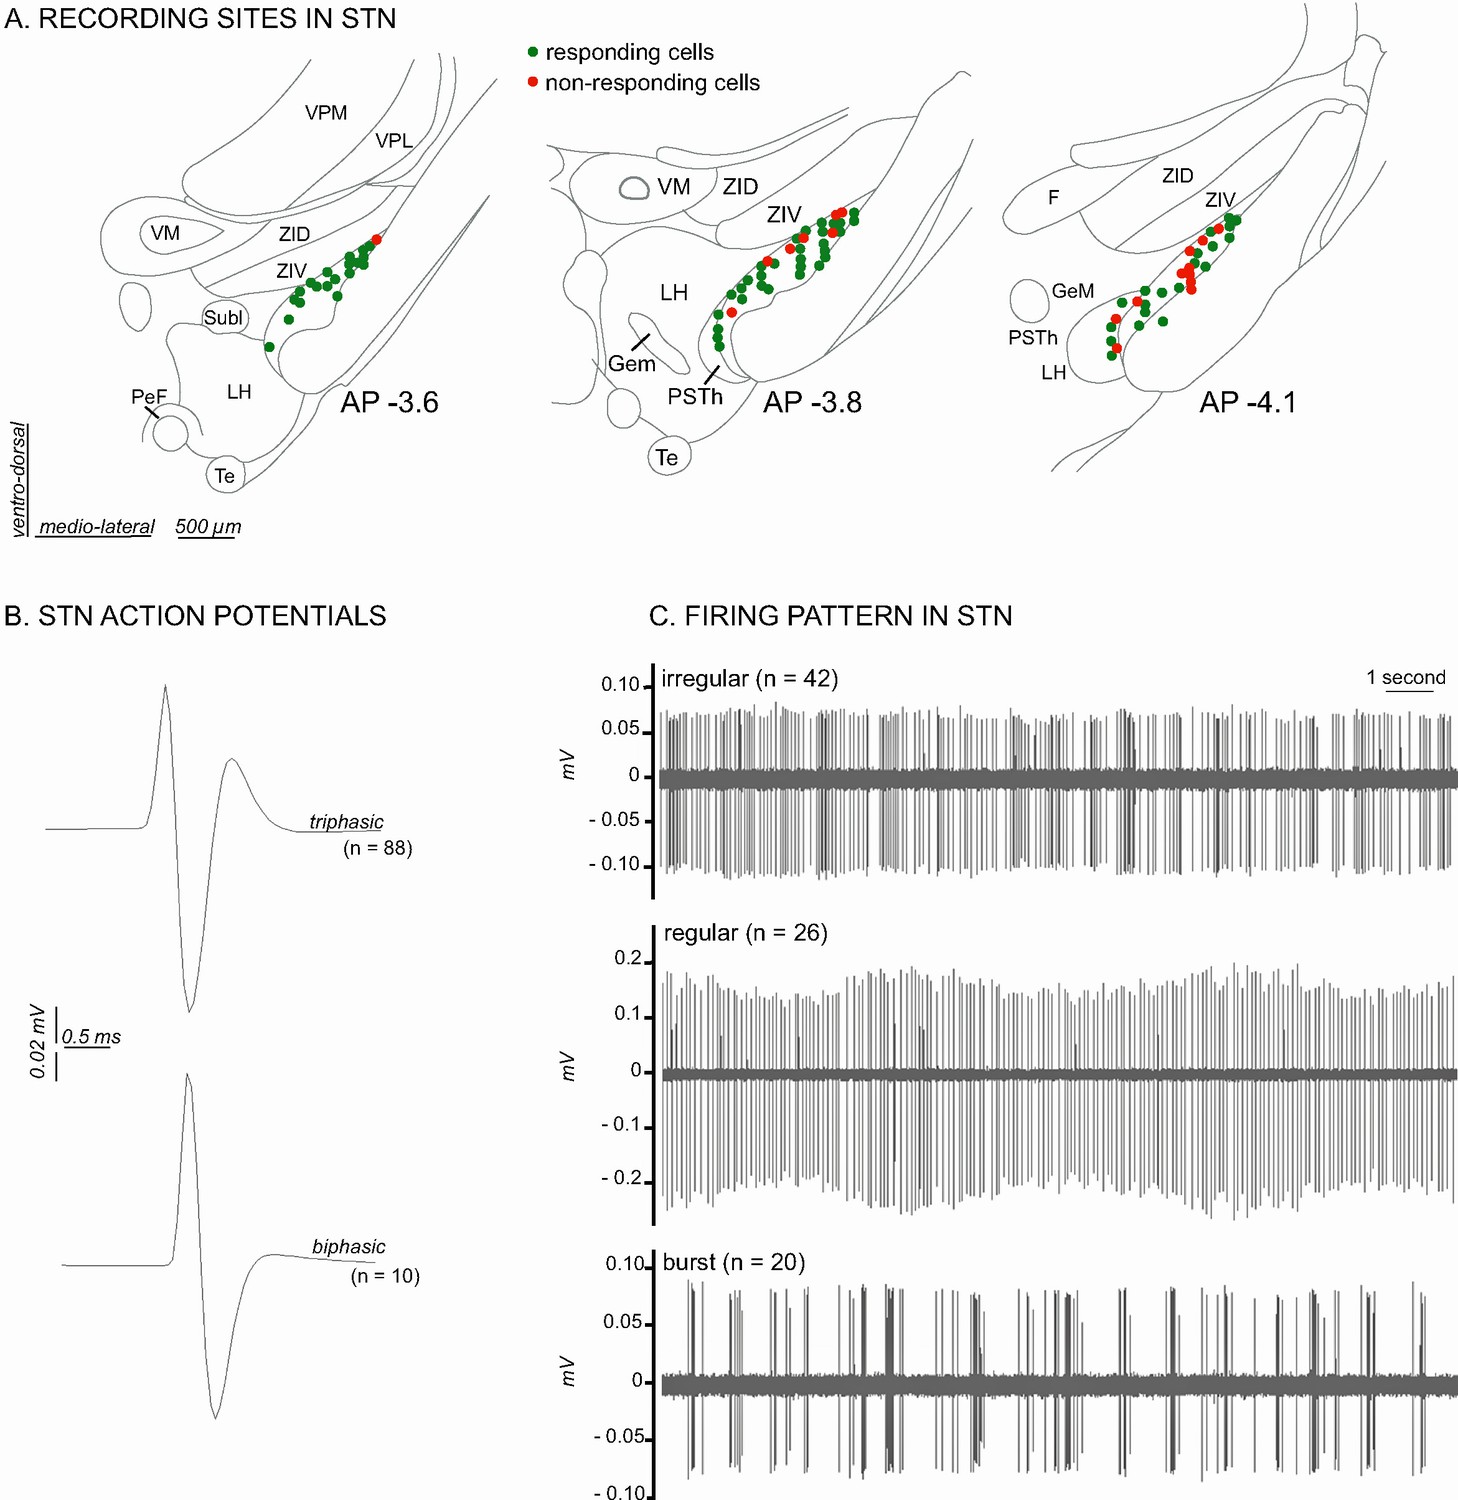
Histological and electrophysiological markers of recorded STN neurons.
(A) Location of recording sites within the STN. Note that the number of non-responding cells is higher in the caudal part of the STN. (B) Example of triphasic (top) and biphasic (bottom) spike waveforms of STN neurons. (C) Individual recordings illustrating STN irregular (top), regular (middle) and in burst (bottom) firing patterns. Abbreviations: F, nucleus of the fields of Forel; GeM, Gemini hypothalamic nucleus; LH, lateral hypothalamic area; PeF, perifornical nucleus; PSTh, parasubthalamic nucleus; Subl, subincertal nucleus; Te, terete hypothalamic nucleus; VM, ventromedial thalamic nucleus; VPL, ventral posterolateral thalamic nucleus; VPM, ventral posteromedial thalamic nucleus; ZID, zona incerta, dorsal part; ZIV, zona incerta, ventral part.
Figure 3
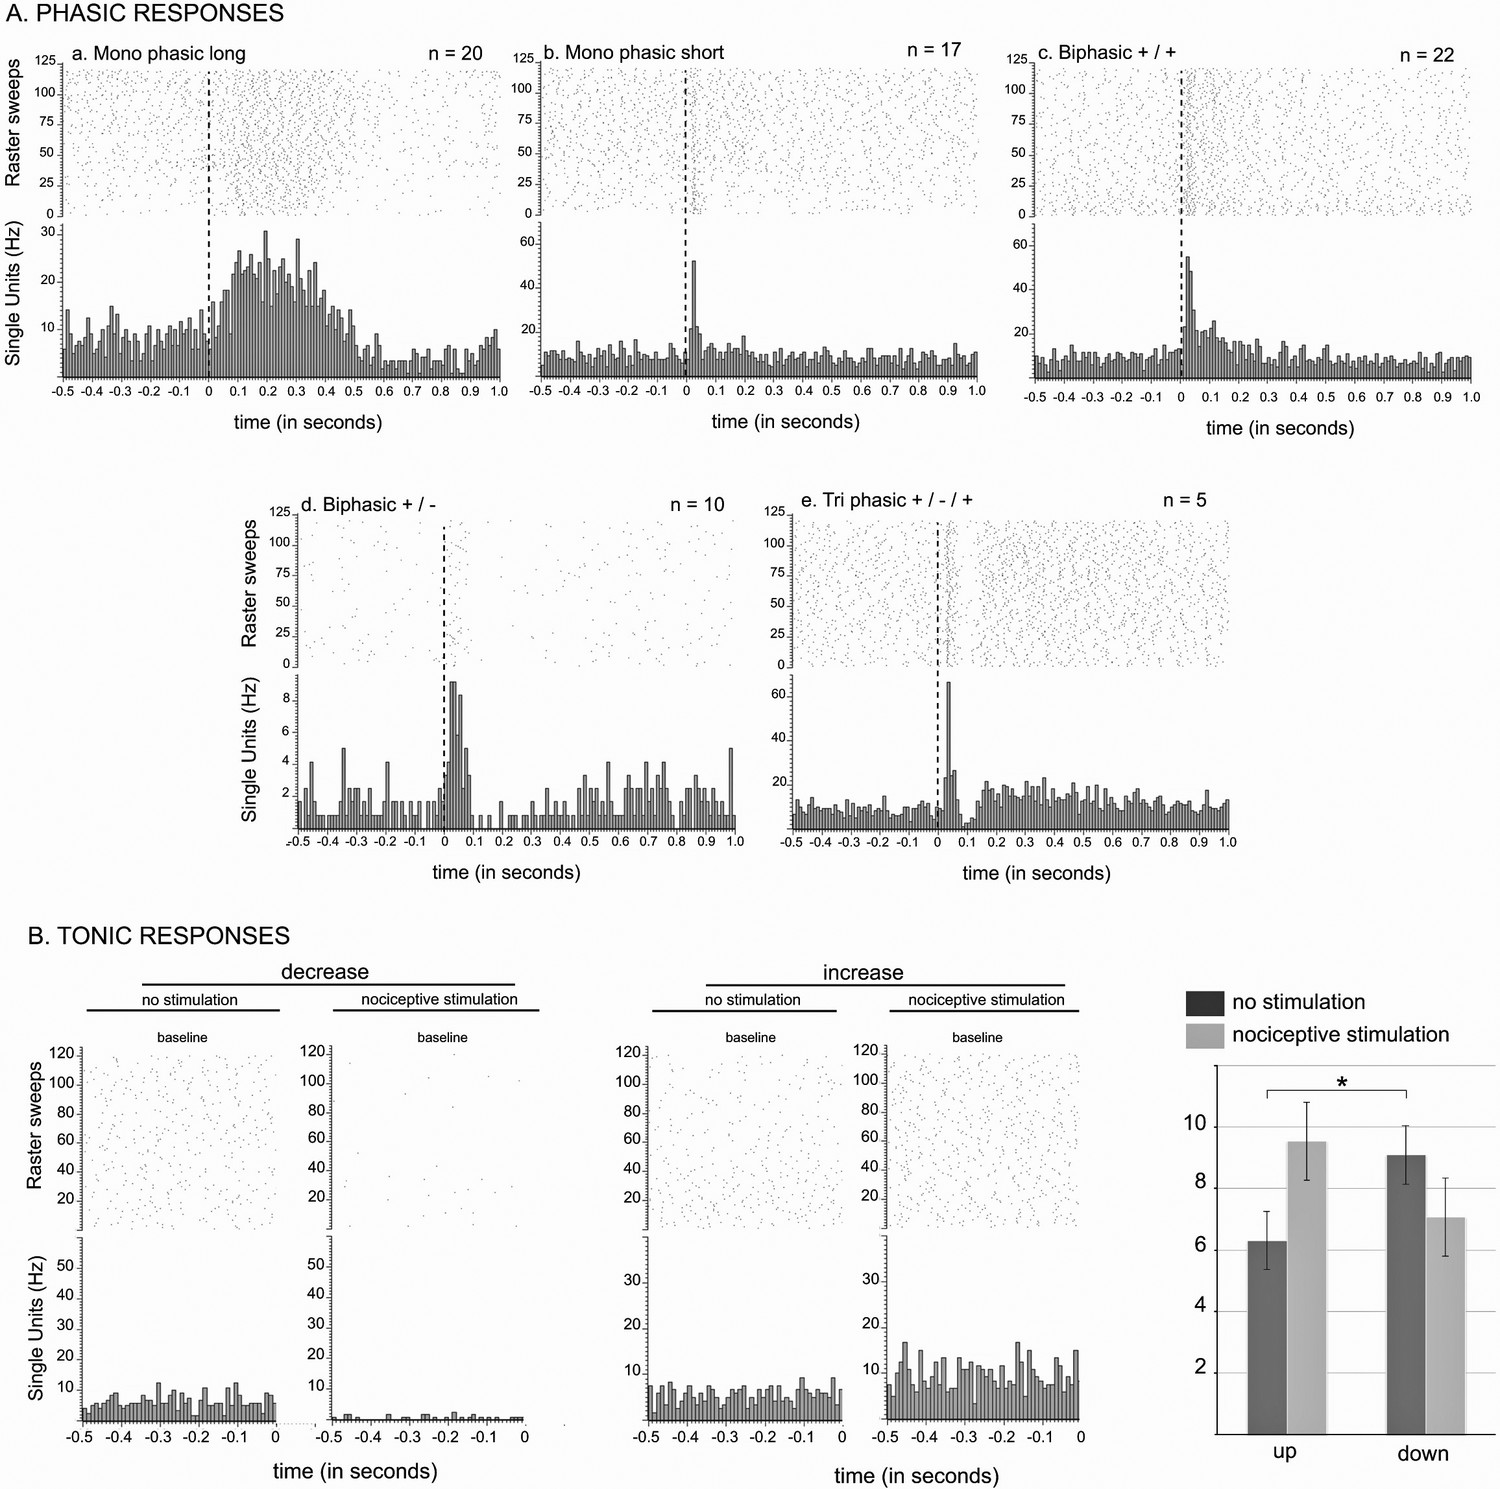
STN nociceptive phasic and tonic response.
(A) Phasic responses. Peristimulus histograms showing individual cases of different types of phasic noxious-evoked responses in the STN. The dashed vertical line indicates the onset time of the nociceptive footshock. The n associated with each histogram indicates the number of cases exhibiting that class of response; total n = 98. (B) Tonic responses. Peristimulus histograms showing individual cases of decreased (left) and increased (right) STN baseline firing rate with the nociceptive stimulation. Histograms of the group mean data (±standard error of the mean [SEM]) during the sham (dark gray) and nociceptive (light gray) stimulation. The histograms show a significant increase or decrease of the baseline firing rate in the up (p<0.001) and down groups (p<0.001), respectively, and no effect of the no change group (p=0.1272). Note the higher baseline firing rate of the down cells during the sham stimulation compared to that of the up groups (p<0.05).
Figure 4
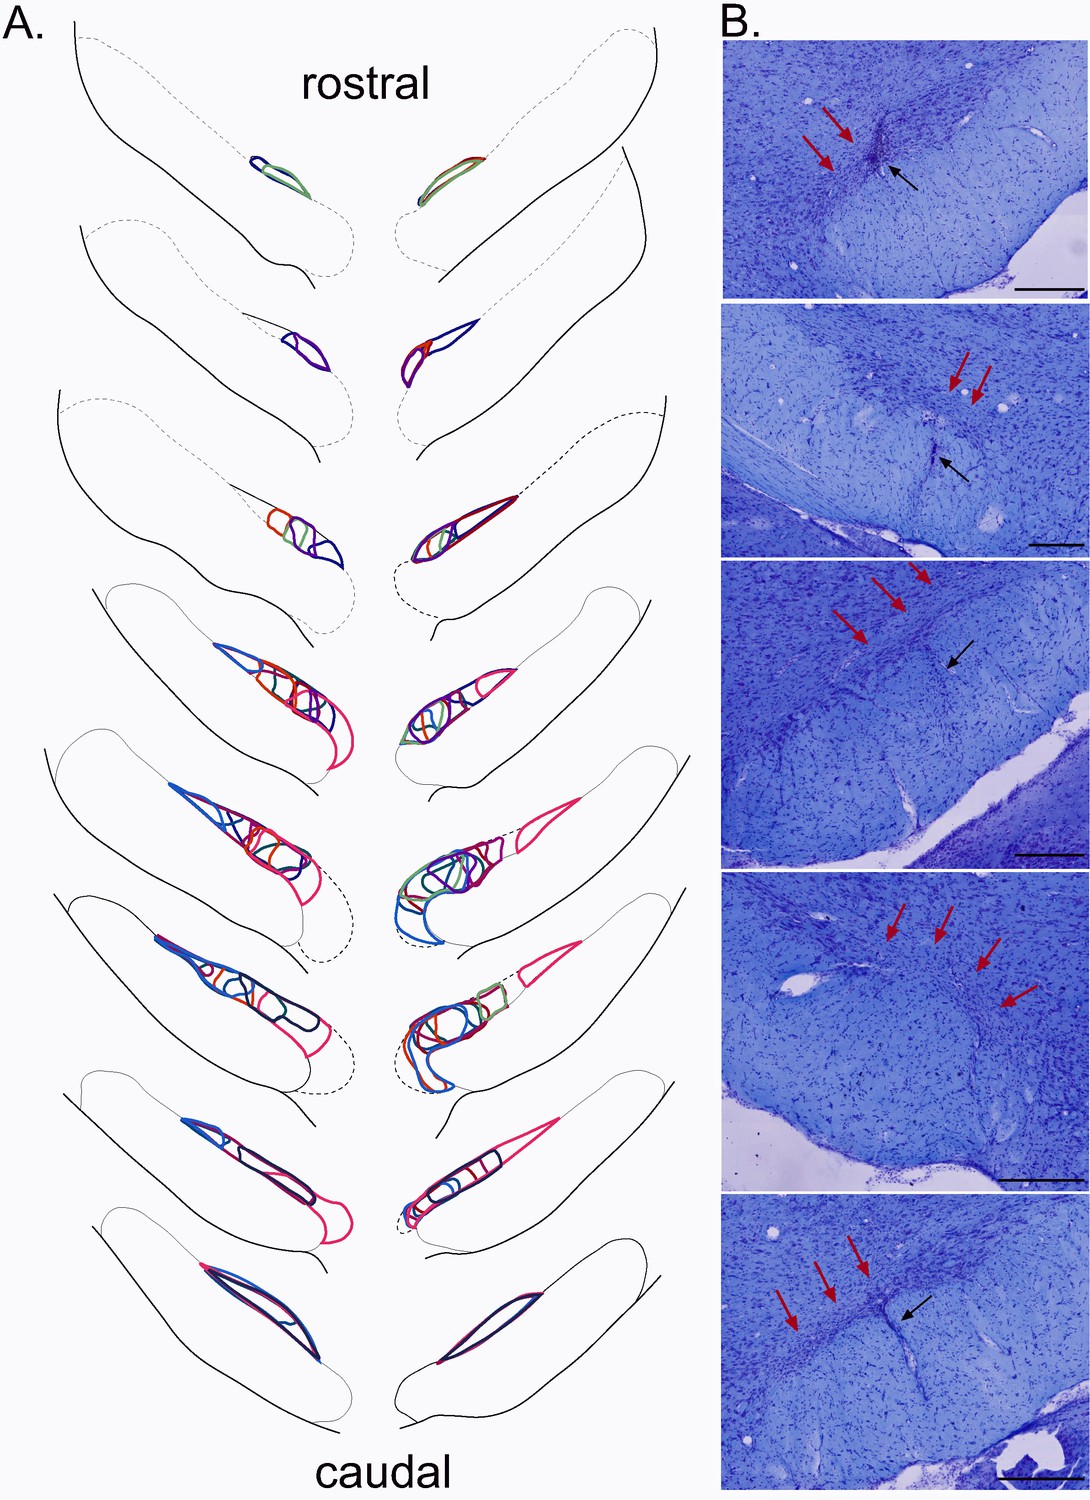
Plots of the STN lesion.
(A) Schematic of the ibotenic acid STN lesions, each colour represents the plot of an individual animal. (B) Coronal sections (stained with cresyl violet) of the STN following a bilateral injection of ibotenic acid. Red arrows indicate the location of the lesion and black arrows the tract of the cannula. Scale bars = 400 µm.
Figure 5

Effect of local injection of muscimol in PBN on STN nociceptive responses.
The set of graphs presents the raster displays and peri-stimulus histograms of three single cases (A, B and C) aligned on the presentation of 120 stimuli (electrical footshocks delivered at 0.5 Hz; vertical red line). Prior to the injection of muscimol, both the PBN (a, e, i) and STN (c, g, k) neurons were responsive to the footshock. Following the injection of muscimol into the PBN, local neurons became less responsive (b, f) or unresponsive to the footshock (j) and so did the STN neurons (d, h, l). Note that PBN blockade with muscimol abolished different STN response types such as bipolar +/– (a), monophasic short/short (g) and monophasic short/long (k).
Figure 6
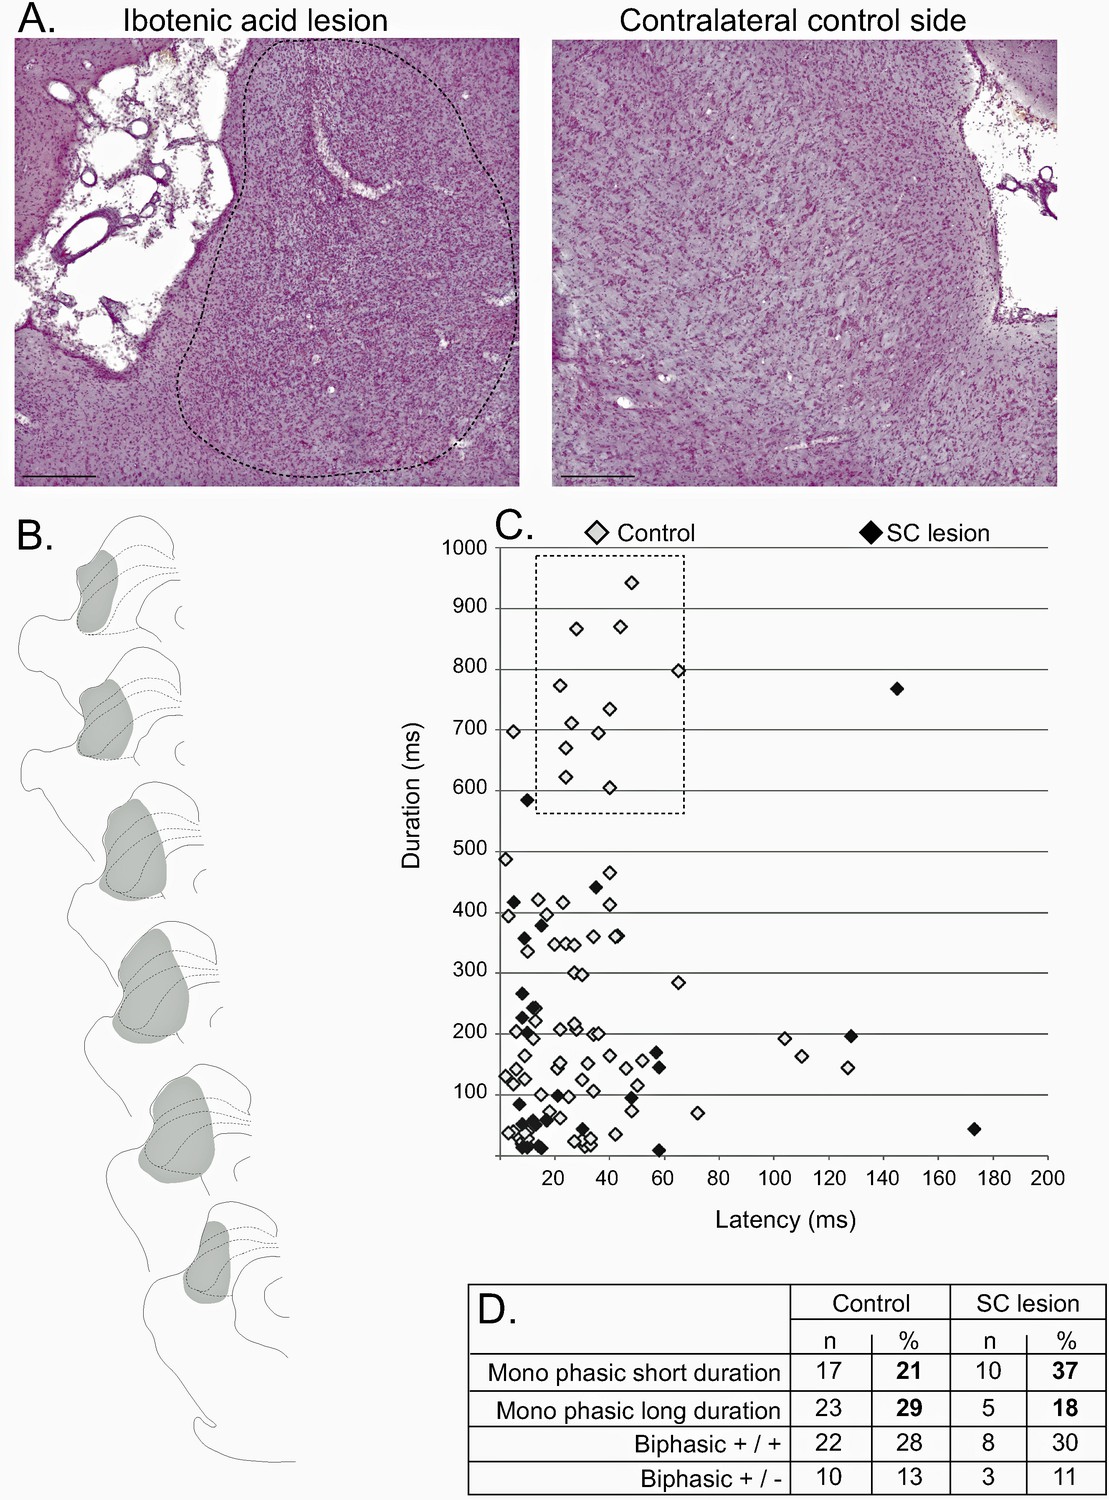
Effect of SC lesion on STN nociceptive responses.
(A) Coronal sections (stained with cresyl violet) of the SC following a unilateral injection of ibotenic acid (dotted line, left) and its control contralateral side (right). Scale bars = 500 µm. (B) Schematic of a typical lesion (in gray) with ibotenic acid in the SC. (C) Plot of STN phasic noxious evoked responses in the STN according to their duration and latency in control (white) and SC lesioned (black) animals. The box outlined with a dotted line highlights the absence of long-duration responses in SC lesioned rats. (D) Table showing the proportions of different STN nociceptive response types in control and SC-lesioned animals. Note that the proportion of STN long-lasting responses decreases in SC-lesioned animals.
Figure 7
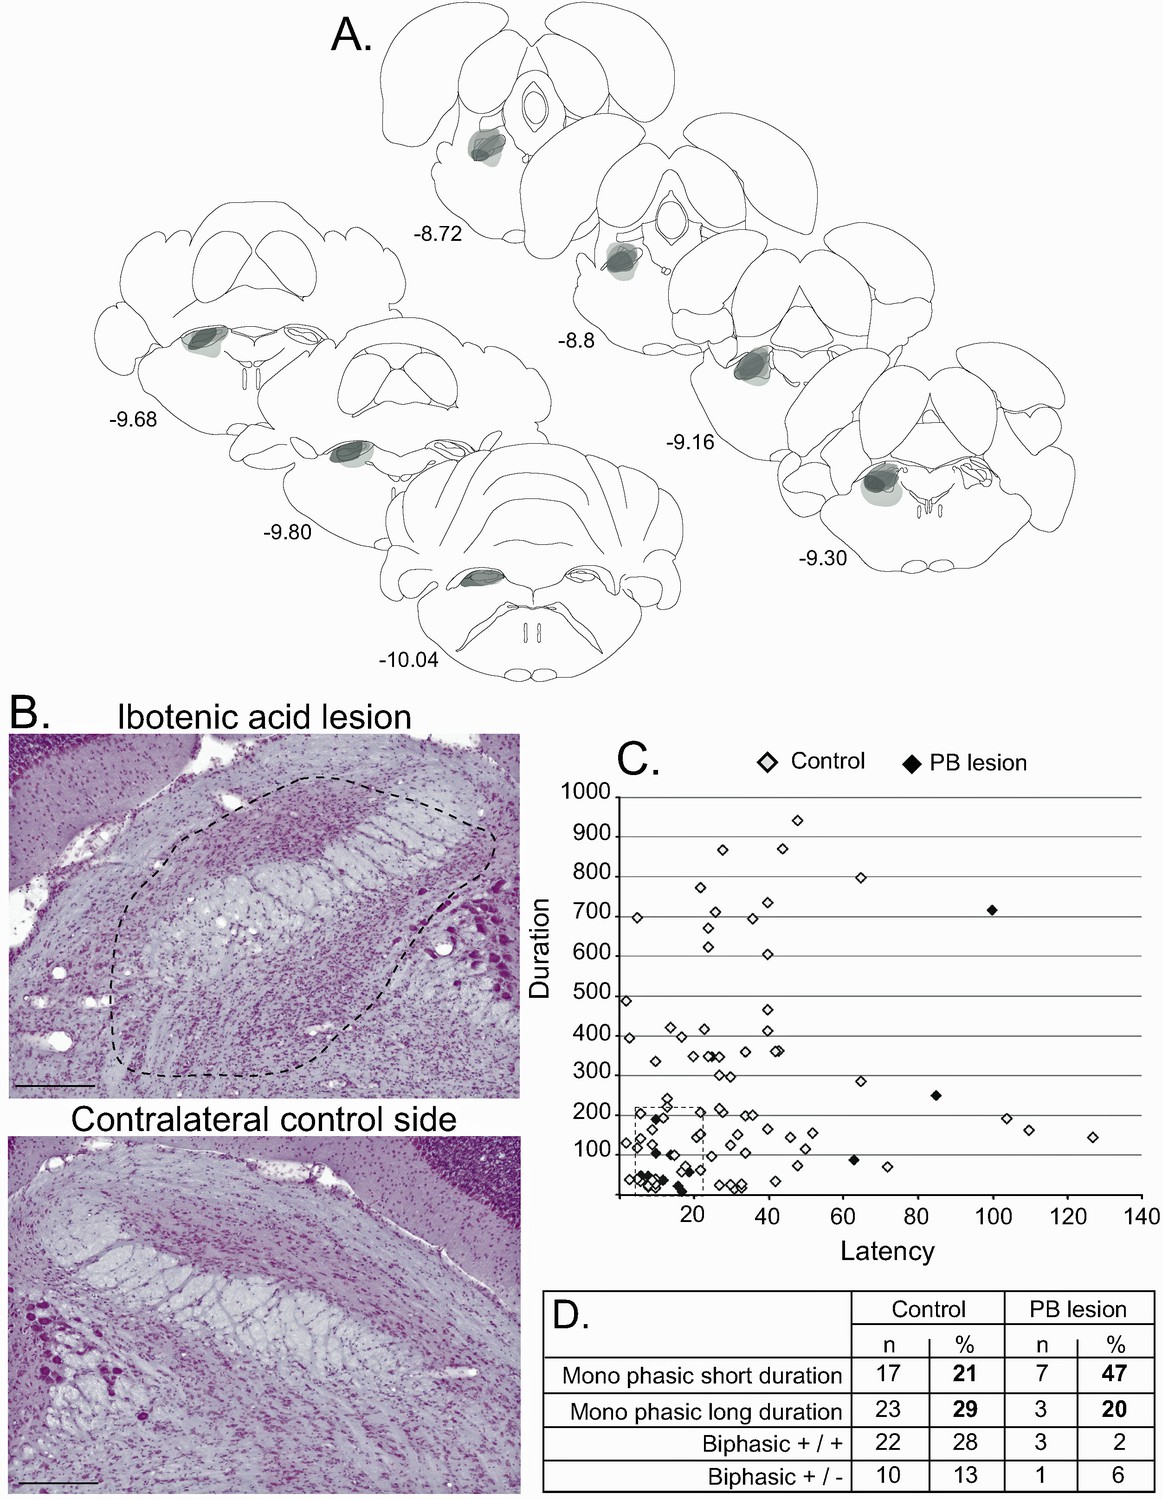
Effect of PBN lesion on STN nociceptive responses.
(A) Schematic of the ibotenic acid lesion of the PBN. Each individual lesion is illustrated in a different tone of gray. (B) Coronal sections (stained with cresyl violet) of the parabrachial nucleus following a unilateral injection of ibotenic acid (dotted line, top) and its control contralateral side (bottom). Scale bars = 500 µm. (C) Plot of STN phasic noxious-evoked responses in the STN according to their duration and latency in control (white) and PBN-lesioned (black) animals. Note that PBN lesion abolished all types of STN nociceptive response. (D) Table showing the proportion of STN nociceptive response types in control and PBN-lesioned animals.
Figure 8
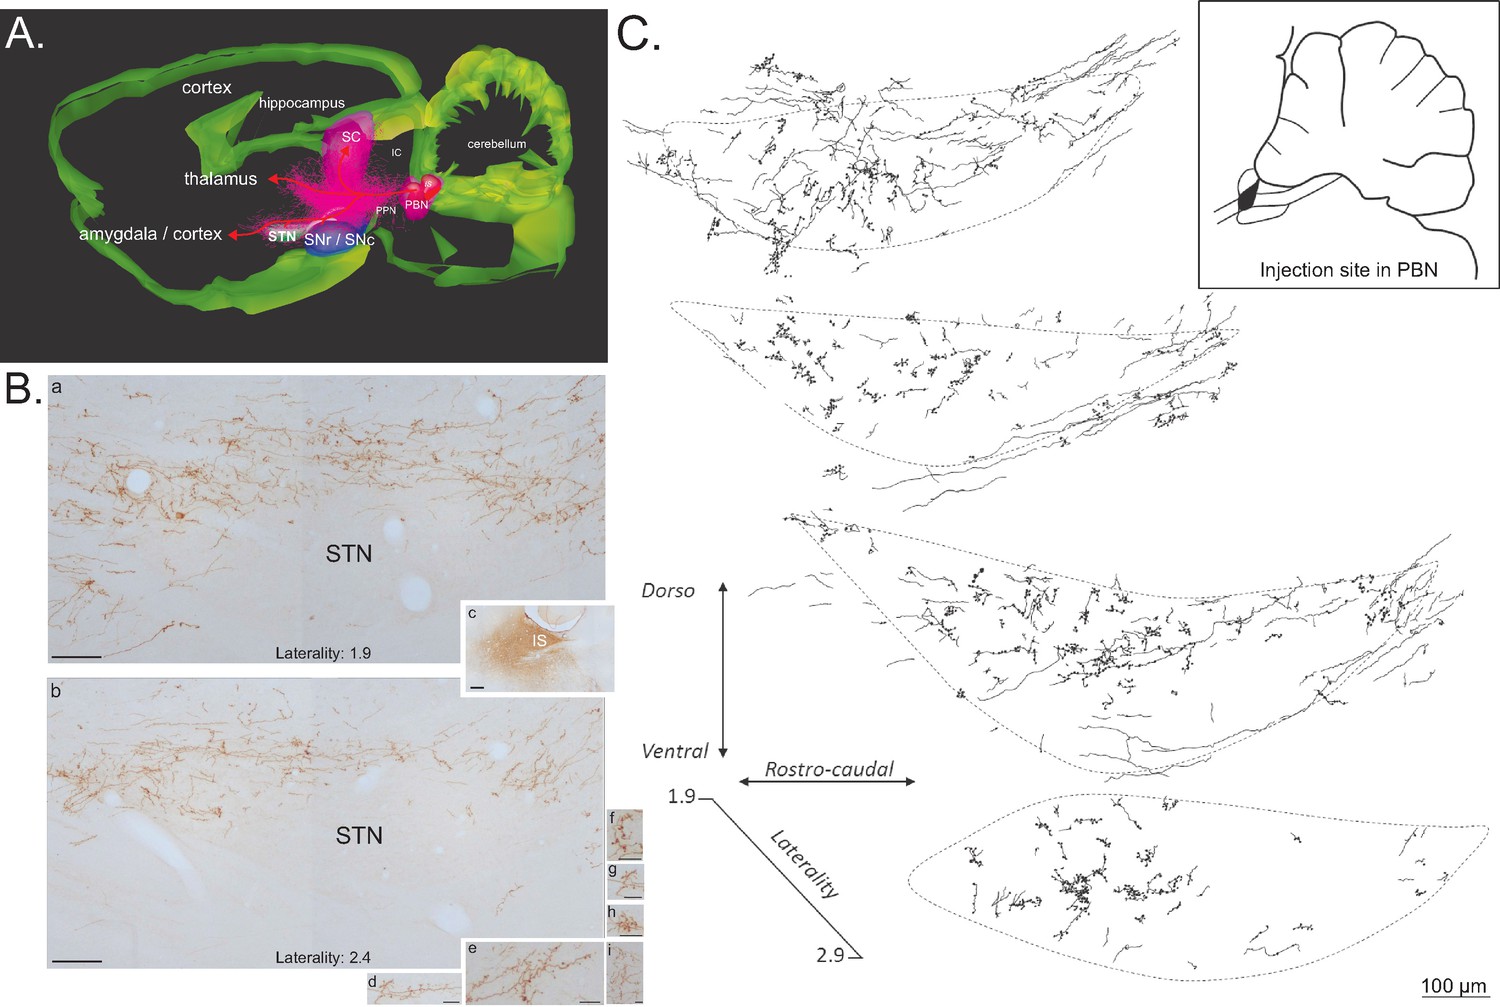
Anterograde tracer in the PBN.
(A) 3D renderings of parasagittal brain sections covering the PBN and STN width, illustrating the different bundles leaving the PBN following a local injection of an anterograde tracer (PHAL). (B) Sagittal sections illustrating a PHAL injection site in the lateral PBN (c), associated with labeled terminals in the medial (a) and lateral (b) STN. PBN labeled terminals contain dense synaptic bouton mainly localized in STN dorsal sector (d–i). Scale bars: a–c = 200 µm, d–i = 20 µm. (C) Schematic illustrating the location of terminals and synaptic boutons in the STN following the injection of biotinylated dextran amine (BDA) in the lateral portion of the rostral PBN (insert box). Abbreviations: IC, inferior colliculus; IS, injection site; PBN, parabrachial nucleus; PPN, pedunculopontin nucleus; SC, superior colliculus; SNc, substantia nigra pars compacta; SNr, substantia nigra pars reticulate; STN, subthalamic nucleus.
Figure 9
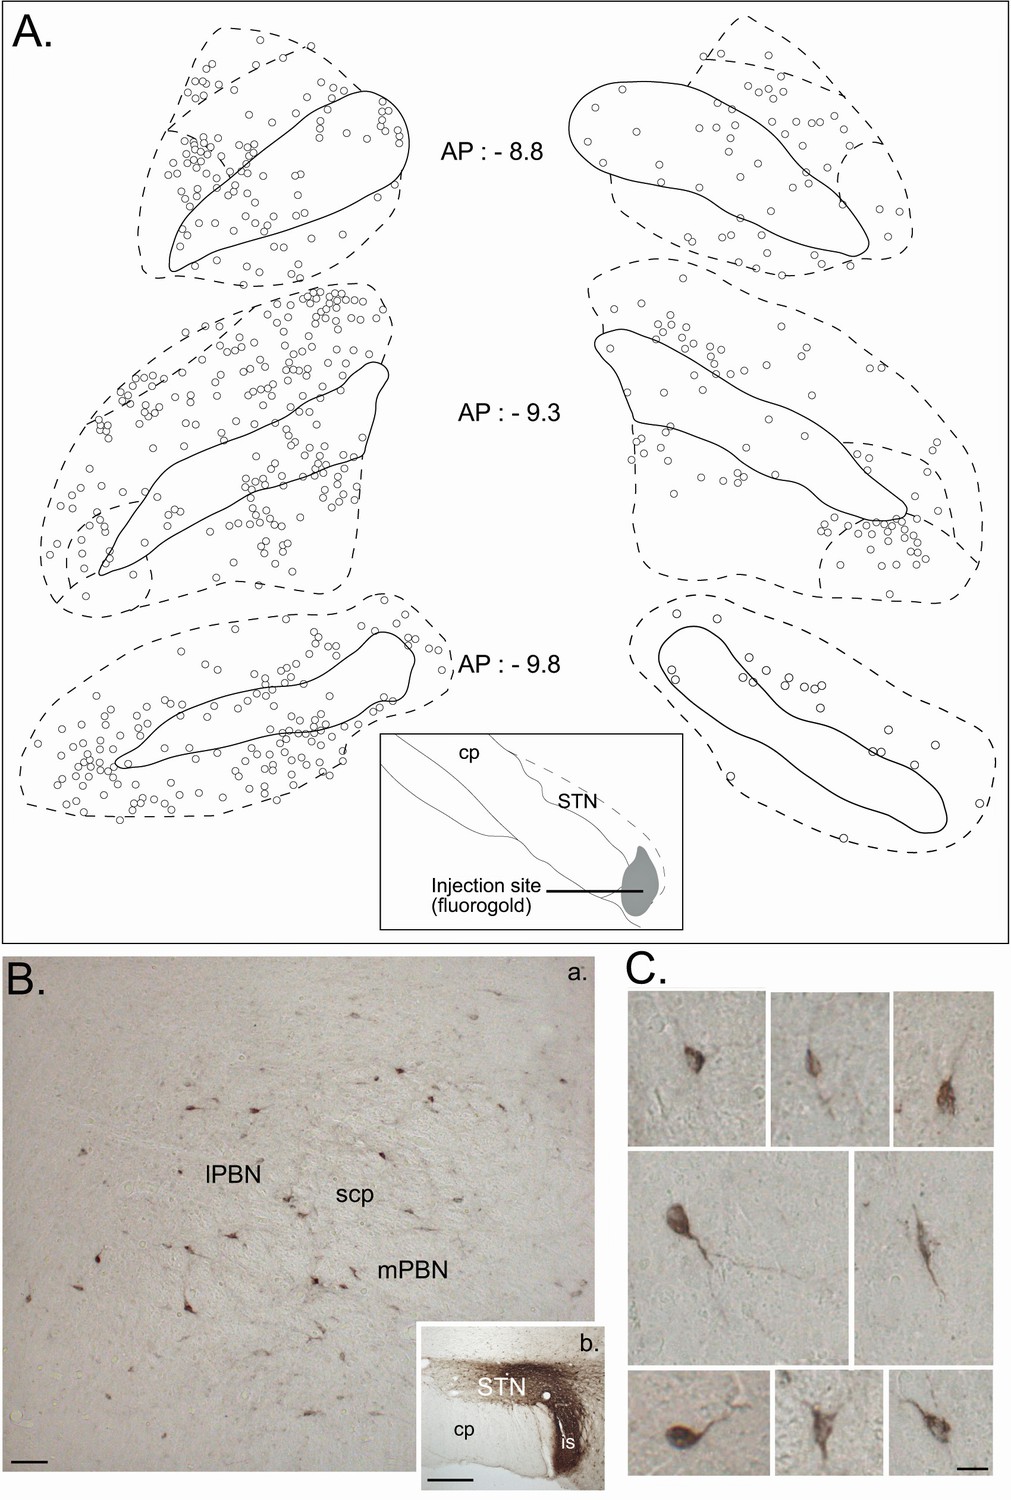
Retrograde tracer in the STN.
(A) Drawing of coronal sections centered on the ipsilateral (left) and contralateral (right) PBN illustrating the location of the retrogradely labeled cells following an injection of a retrograde tracer Fluorogold in the STN. (B) Photomicrographs of retrogradely labeled neurons in the PBN (a) following the injection of cholera toxin unit B (CTB) in the STN (b). Scale bars = 200 µm. (C) Morphology of retrogradely labeled PBN neurons following an injection of CTB into the STN. Scale bars: 20 µm.
Figure 10
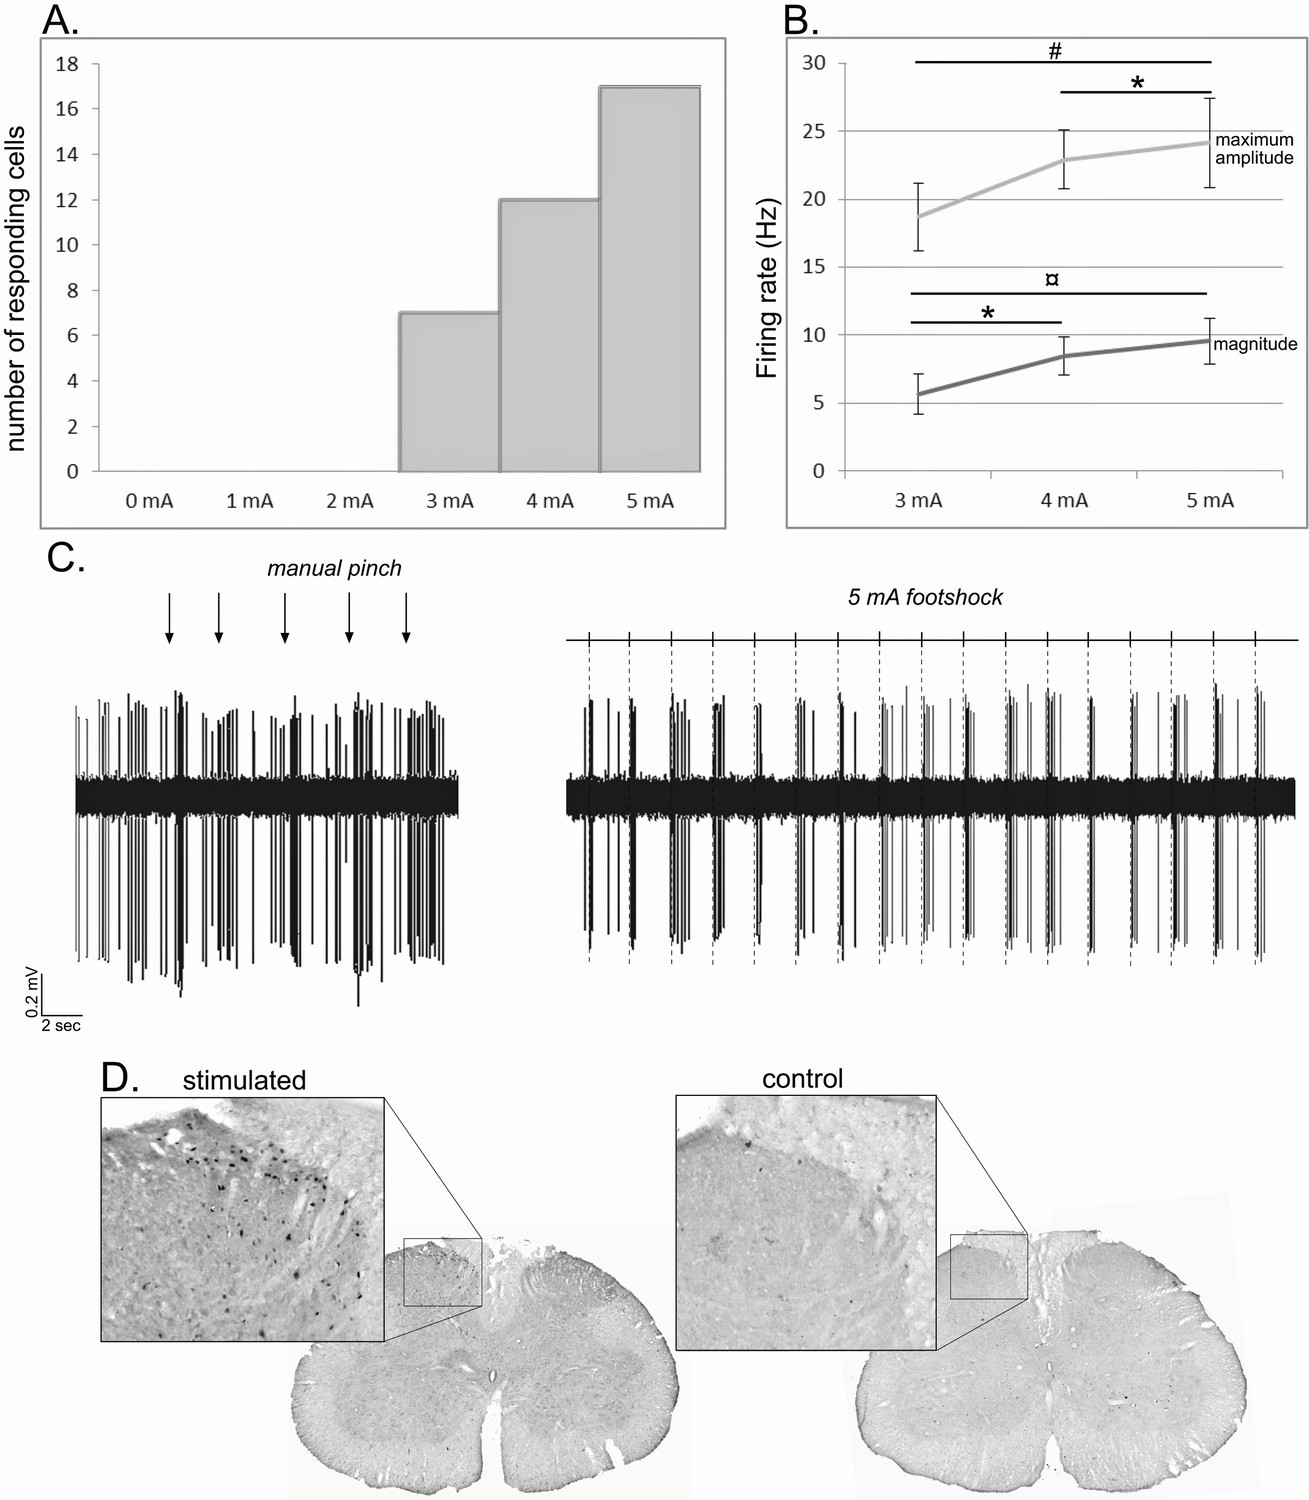
Noxious footshock.
(A) Histogram showing the increase in the number of responding cells with the increase of the footshock intensity. (B) Increase of the maximum amplitude and magnitude of phasic nociceptive-evoked responses with the increase of the footshock intensity. (C) Individual example of an STN cell excited both by a mechanical noxious stimulation (pinch – left) and a 5 mA noxious footshock (right). (D) Coronal sections of the lumbar region of the spinal cord processed for c-fos expression in an animal subjected to 1 hr unilateral noxious electrical stimulation of the hindpaw (left) and in a control animal in which the electrodes were implanted into the hindpaw, but no footshock applied.
Tables
Table 1
Response types latencies and durations
https://doi.org/10.7554/eLife.36607.006| Response type | Phase 1 | Phase 2 | Phase 3 | ||||
|---|---|---|---|---|---|---|---|
| Latency | Duration | Latency | Duration | Latency | Duration | ||
| I. | 1. | 37,80 ± 3,15 ms | 338.40 ± 49.79 ms | — | — | — | — |
| 2. | 20.18 ± 3.15 ms | 34.47 ± 3.92 ms | — | — | — | — | |
| II. | 20.00 ± 3.02 ms | 35.00 ± 3.86 ms | 97.00 ± 6.97 ms | 269.00 ± 40.05 ms | — | — | |
| III. | 23.00 ± 4.61 ms | 69.00 ± 19.59 ms | 133.70 ± 32.76 ms | 176.70 ± 3.83 ms | — | — | |
| IV. | 16.4 ± 4.57 ms | 46.4 ± 7.90 ms | 101.2 ± 18.56 ms | 28.2 ± 5.27 ms | 227.6 ± 43.53 ms | 216.8 ± 69.3 ms | |
Table 2
Nociceptive responses in the subthalmic nucleus, superior colliculus and parabrachial nucleus.
https://doi.org/10.7554/eLife.36607.008| Microinjection of muscimol in the superior colliculus | ||||
|---|---|---|---|---|
| Superior colliculus | Subthalamic nucleus | |||
| Pre muscimol | Post muscimol | Pre muscimol | Post muscimol | |
| Latency | 9 ± 0.8 ms | 7.60 ± 0.68 ms | 25.33 ± 5.27 ms | 28.38 ± 7.75 ms |
| Duration | 19.62 ± 5.00 ms | 14 ± 3.03 ms | 176.13 ± 60.37 ms | 135.74 ± 50.19 ms * |
| Amplitude | 322.29 ± 58.16 Hz | 125.00 ± 26.22 Hz * | 15.61 ± 3.29 Hz | 14.4 ± 2.44 Hz |
| Magnitude | 140.20 ± 28.01 Hz | 45.01 ± 9.16 Hz * | 10.21 ± 1.99 Hz | 7.24 ± 1.41 Hz |
| Baseline FR no footshock | 18.27 ± 2.19 Hz | — | 4.37 ± 0.8 Hz | - |
| Baseline FR footshock | 20.79 ± 2.66 Hz | 7.69 ± 3.00 Hz * | 6.06 ± 1.48 Hz | 6.45 ± 1.38 Hz |
| Microinjection of muscimol in the parabrachial nucleus | ||||
|---|---|---|---|---|
| Parabrachial nucleus | Subthalamic nucleus | |||
| Pre muscimol | Post muscimol | Pre muscimol | Post muscimol | |
| Latency | 11.55 ± 1.35 ms | 19.00 ± 2.48 ms * | 24.54 ± 3.13 ms | 18.43 ± 1.73 ms |
| Duration | 26.45.12 ± 3.85 ms | 14 ± 3.49 ms * | 98.00 ± 27.35 ms | 45.75 ± 12.04 ms * |
| Amplitude | 146.97.42 ± 23.66 Hz | 83.26 ± 17.02 Hz * | 26.98 ± 5.72 Hz | 17.18 ± 3.26 Hz * |
| Magnitude | 45.16 ± 7.45 Hz | 23.70 ± 4.57 Hz * | 10.31 ± 2 Hz | 6.65 ± 1.44 Hz * |
| Baseline FR no footshock | 24.25 ± 1.97 Hz | — | 5.89 ± 0.49 Hz | — |
| Baseline FR footshock | 20.55 ± 2.42 Hz | 14.15 ± 2.76 Hz | 5.50 ± 0.71 Hz | 5.39 ± 0.57 Hz |
-
Mean ± SEM - * statistically different from pre-muscimol measure.
Abbreviations: cp, cerebral peduncle; IS, injection site; lPBN, lateral parabrachial nucleus; mPBN, medial parabrachial nucleus; scp, superior cerebral peduncle; STN, subthalamic nucleus.
-
Note: the amplitude of the response is the maximum amplitude during the response and the magnitude of the response is the mean number of single multi-unit events between response onset and offset minus the baseline mean.
Additional files
-
Transparent reporting form
- https://doi.org/10.7554/eLife.36607.015
Download links
A two-part list of links to download the article, or parts of the article, in various formats.
Downloads (link to download the article as PDF)
Open citations (links to open the citations from this article in various online reference manager services)
Cite this article (links to download the citations from this article in formats compatible with various reference manager tools)
Revealing a novel nociceptive network that links the subthalamic nucleus to pain processing
eLife 7:e36607.
https://doi.org/10.7554/eLife.36607


