A cell autonomous torsinA requirement for cholinergic neuron survival and motor control
- University of Michigan, United States
- Columbia University Medical Center, United States
Figures
Figure 1 with 5 supplements

Conditional cholinergic neuron deletion of torsinA causes cell autonomous loss of striatal cholinergic neurons.
(A) Unilateral stereological quantification of the number of ChAT-positive neurons in the striatum of ChAT-CKO and control mice (One-way ANOVA F(3,28) = 3.589, p=0.02, Dunnett’s multiple comparisons test: adjusted p value = 0.049; ‘WT’=Tor1aFlx/+; ‘Cre Control’=ChAT-Cre+, Tor1a Flx/+; ‘Het Control’=Tor1 aFlx/-; ‘ChAT-CKO’=ChAT-Cre+, Tor1aFlx/-). (B) ChAT immunohistochemistry of coronal sections containing dorsal striatum from WT and ChAT-CKO mice (cc = corpus callosum). (C) Percent reduction in cell density by striatal quadrant (DL = dorsolateral; DM = dorsomedial, VL = ventrolateral, VM = ventromedial). (D) Significant ChI loss is selective for dorsal striatal quadrants. Cell density quantification in control and ChAT-CKO striatal quadrants (Two-way ANOVA main effect of genotype F(3,112) = 24.02, p<0.0001; main effect of quadrant F(3,112)=8.398, p<0.0001; interaction F(9,112)=8.11, p<0.0001. Post-hoc Tukey’s multiple comparisons test). (E) Basal forebrain neurons are spared in ChAT-CKO mice. Stereological quantification of P75-immunoreactive basal forebrain cholinergic neurons in the nucleus basalis of meynert (NBM), medial septum/nucleus of the vertical limb of the diagonal band (MS/VDB), and globus pallidus (GP). No differences in the number of cholinergic neurons was observed (NBM, t(13)=1.684, p=0.11; MS/VDB, t(13)=1.537, p=0.148; GP, t(13)=0.5, p=0.625). (F) P75 immunohistochemistry of sagittal sections containing basal forebrain cholinergic neuron populations. i.c. = internal capsule, ST = striatum.
Figure 1—figure supplement 1
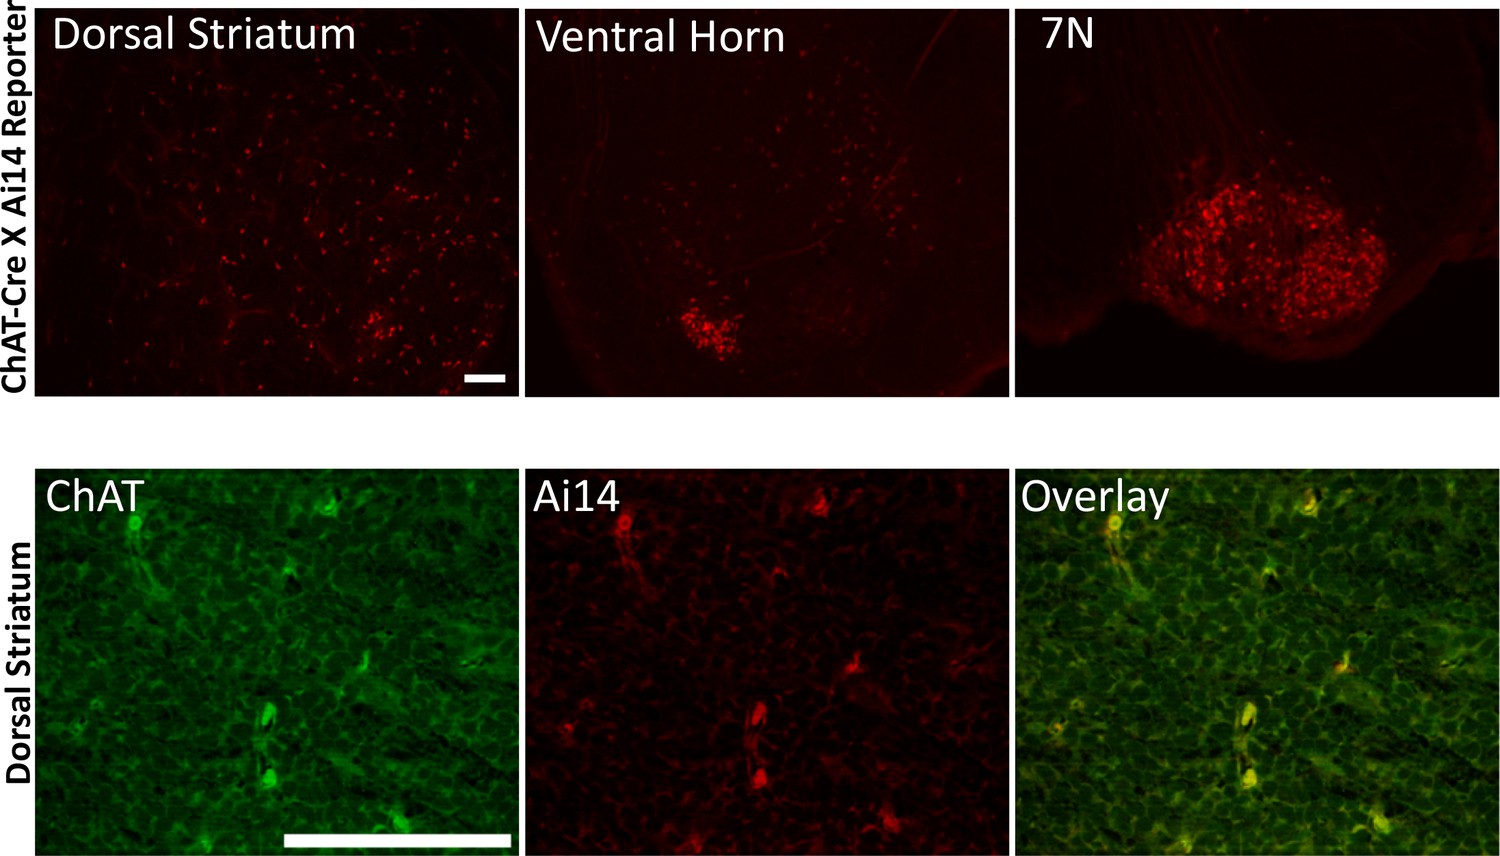
ChAT-Cre is expressed prenatally.
(Upper panels) ChAT-Cre mice were crossed with Ai14 Cre reporter mice. Offspring were collected immediately after birth, brain sections were generated and observed under epifluorescence microscopy. (Lower panels) adjacent sections costained for torsinA. Scale bar = 50 μm.
Figure 1—figure supplement 2

Independent cohort confirmation of selective striatal cholinergic neuron loss in ChAT-CKO mice.
(A) Bilateral unbiased stereology of ChAT-immunoreactive neurons in the dorsal striatum (t(12)=4.42, p=0.0008). (B) Unbiased stereology of parvalbumin (PV) immunoreactive neurons in the dorsal striatum (t9 = 0.699, p=0.50). (C) Unbiased stereology of Nissl positive cells in the dorsal striatum (Welch’s t-test; t7.803=0.655, p=0.53).
Figure 1—figure supplement 3
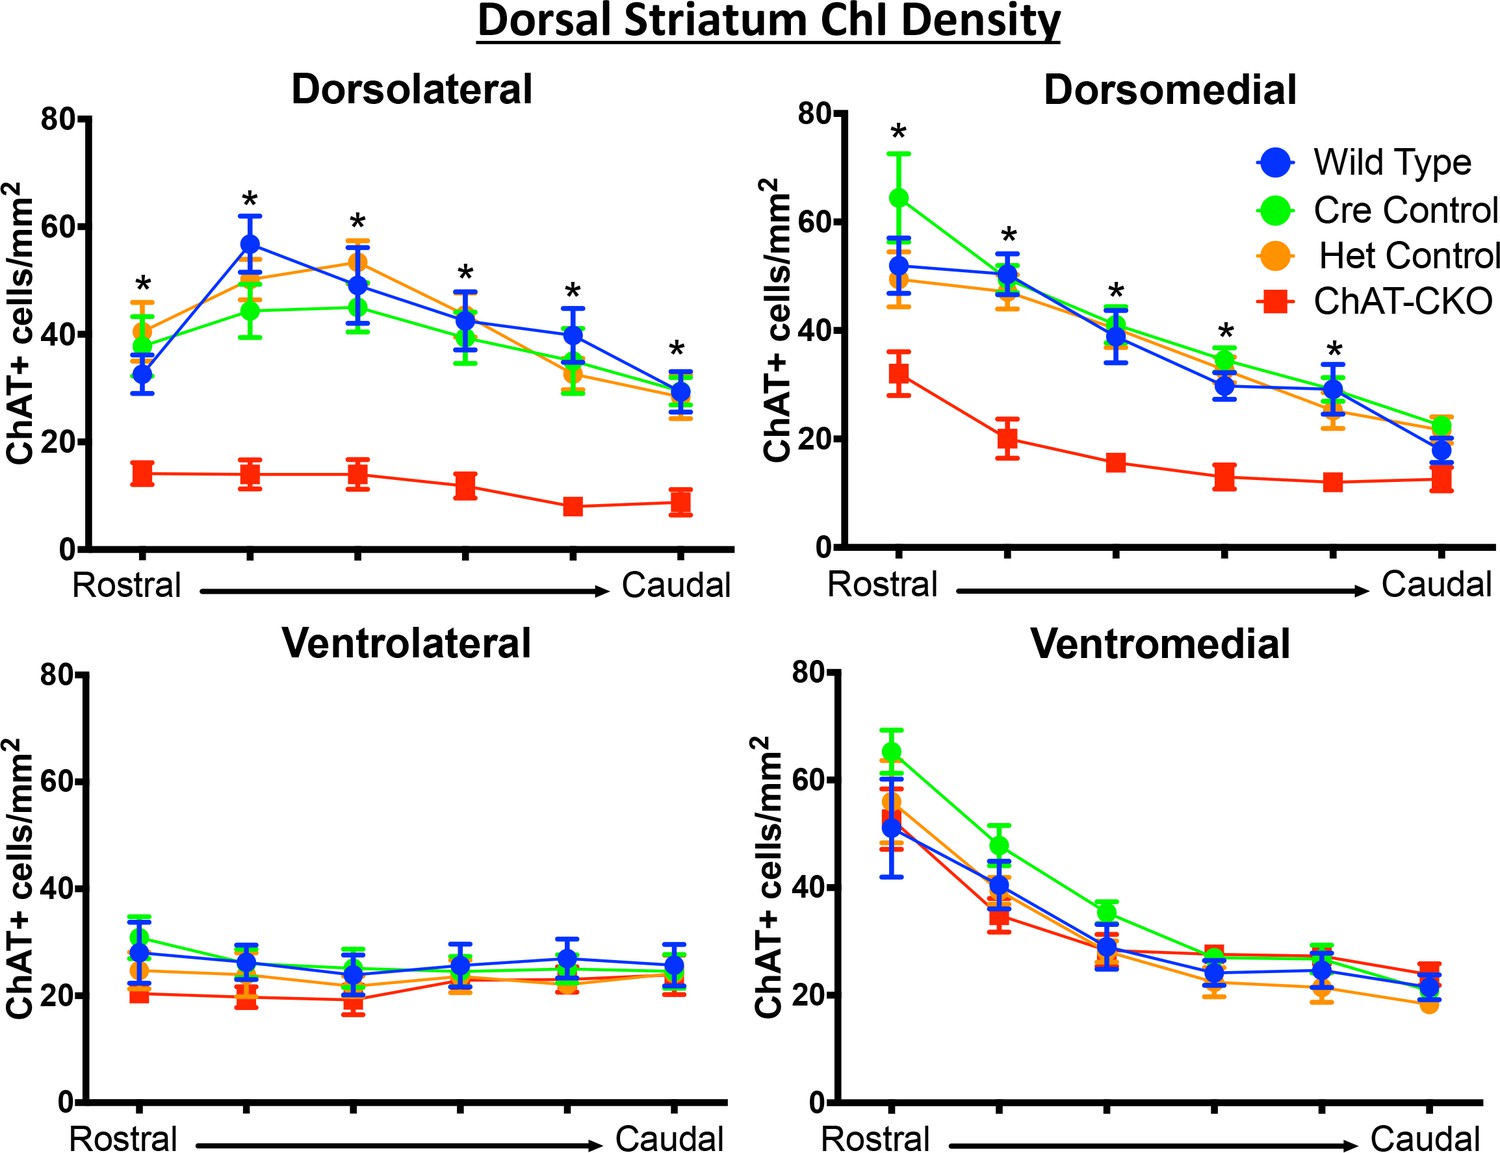
ChAT-positive neurons are reduced in a topographic pattern throughout the rostrocaudal extent of the dorsal striatum.
Significant decreases in ChAT-positive cells were observed in the dorsolateral and dorsomedial segments of the dorsal striatum (dorsolateral striatum, two-way ANOVA main effect of genotype F(3,156)=74.77, p<0.0001, main effect of rostrocaudal section, F(5,156)=10.07, p<0.0001, no interaction F(15,156)=1.204, p=0.273; Dorsomedial striatum main effect of genotype F(3,156)=50.01, p<0.0001, main effect of rostrocaudal section, F(5,156)=41.81, p<0.0001, no interaction F(15,156)=1.646, p=0.067. Post-hoc Tukey’s test was performed for all significant main effects. * represents significant difference between ChAT-CKO mice and all control groups). No significant reductions were observed in the ventral segments of the dorsal striatum (ventrolateral; genotype F(3,156)=2.84, p=0.039 [post-hoc Tukey’s test adjusted p=0.129 or higher for all comparisons], rostrocaudal section F(5,156)=0.479, p=0.79, interaction F(15,156)=0.249, p=0.99. ventromedial; genotype F(3,156)= 2.706, p=0.047 [post-hoc Tukey’s test adjusted p=0.107 or higher for all comparisons], rostrocaudal section F(5,156)=46.28 p<0.0001, interaction F(15,156)=0.672, p=0.80).
Figure 1—figure supplement 4

Time course of torsinA protein loss in dorsal and ventral striatum.
(A,B) TorsinA and ChAT staining in dorsal and ventral striatum brain sections from P0 ChAT-CKO and control mice. (C) TorsinA mean fluorescence intensity analysis in dorsal or ventral striatal ChI (Two-way ANOVA main effect of genotype F1,195= 85.67, p<0.0001; Region, n.s., F1,195=3.301, p=0.07; interaction F1,195=21.34, p<0.0001. Sidak’s multiple comparisons test, Dorsal striatum control vs ChAT-CKO, p=0.003, Ventral striatum control vs ChAT-CKO, p<0.0001, ChAT-CKO dorsal striatum vs ventral striatum, p=0.0002; Control dorsal striatum vs ventral striatum, n.s., p=0.199). (D,E) Frequency histograms of torsinA mean fluorescence intensity in dorsal (n = 57 control, n = 54 ChAT-CKO neurons) and ventral striatal ChI (n = 52 control, n = 36 ChAT-CKO neurons). Scale bar = 10 µm.
Figure 1—figure supplement 5

Time course of torsinA protein loss in basal forebrain.
(A) TorsinA and ChAT staining in basal forebrain brain sections from P0 ChAT-CKO and control mice. (B) TorsinA mean fluorescence intensity analysis of control and ChAT-CKO (Welch’s t-test t138.2=17.35, p<0.0001) and frequency histograms of torsinA mean fluorescence intensity in basal forebrain cholinergic neurons ChI (n = 91 control, n = 79 ChAT-CKO neurons). Scale bar = 10 µm.
Figure 2 with 1 supplement
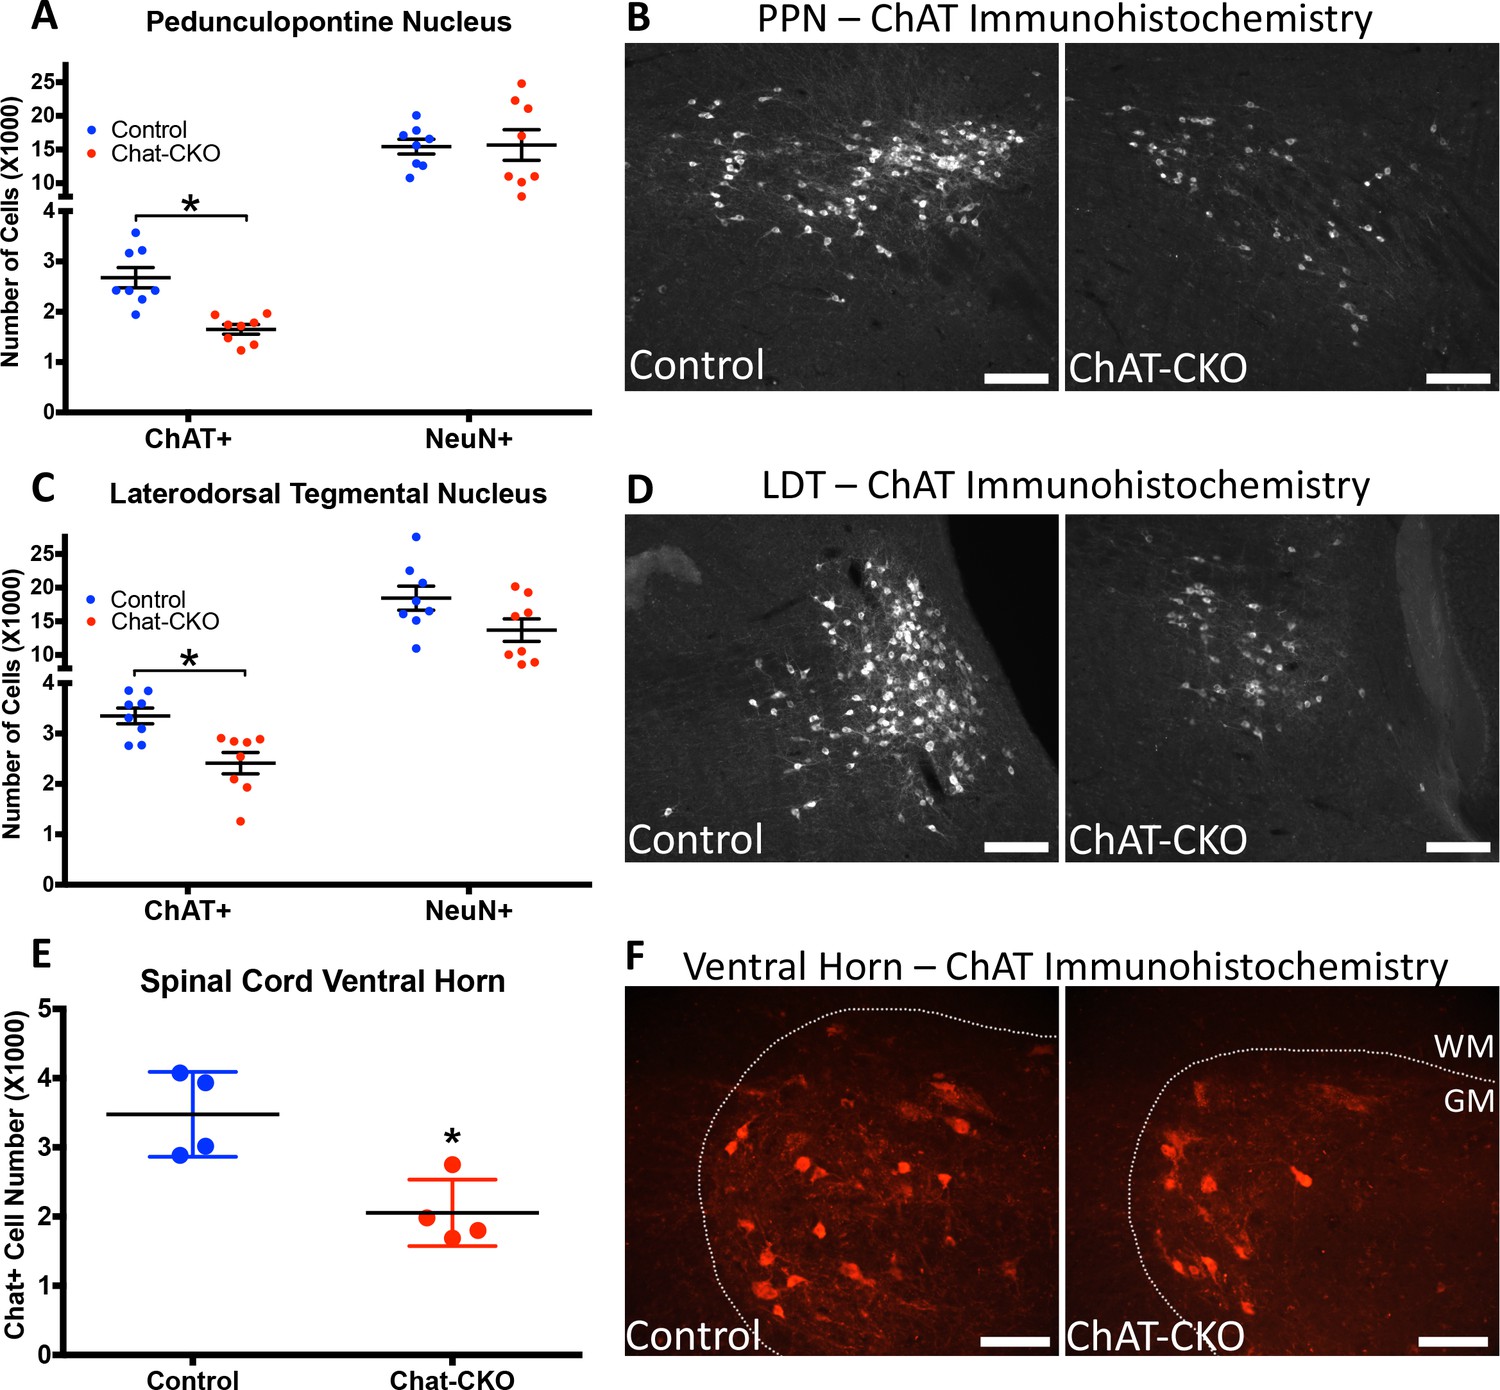
ChAT-CKO mice have significantly fewer brainstem and spinal cord cholinergic neurons.
(A,B) Stereological quantification of ChAT-positive or NeuN-positive neurons in the pedunculopontine nucleus (PPN) of control and ChAT-CKO mice (ChAT; t(14)=4.531, p=0.0005. NeuN; t(14)=0.095, p=0.92). (C,D) Stereological quantification of ChAT-positive or NeuN-positive neurons in the laterdorsal tegmental nucleus (LDT) of control and ChAT-CKO mice (ChAT; t(14)=3.571, p=0.003. NeuN; t(14)=1.934, p=0.073). (E,F) Quantification of the number of ChAT-positive neurons in the cervical spinal cord of control and ChAT-CKO mice (t(6)=3.654, p=0.0107). Scale bars = 100 μm.
Figure 2—figure supplement 1
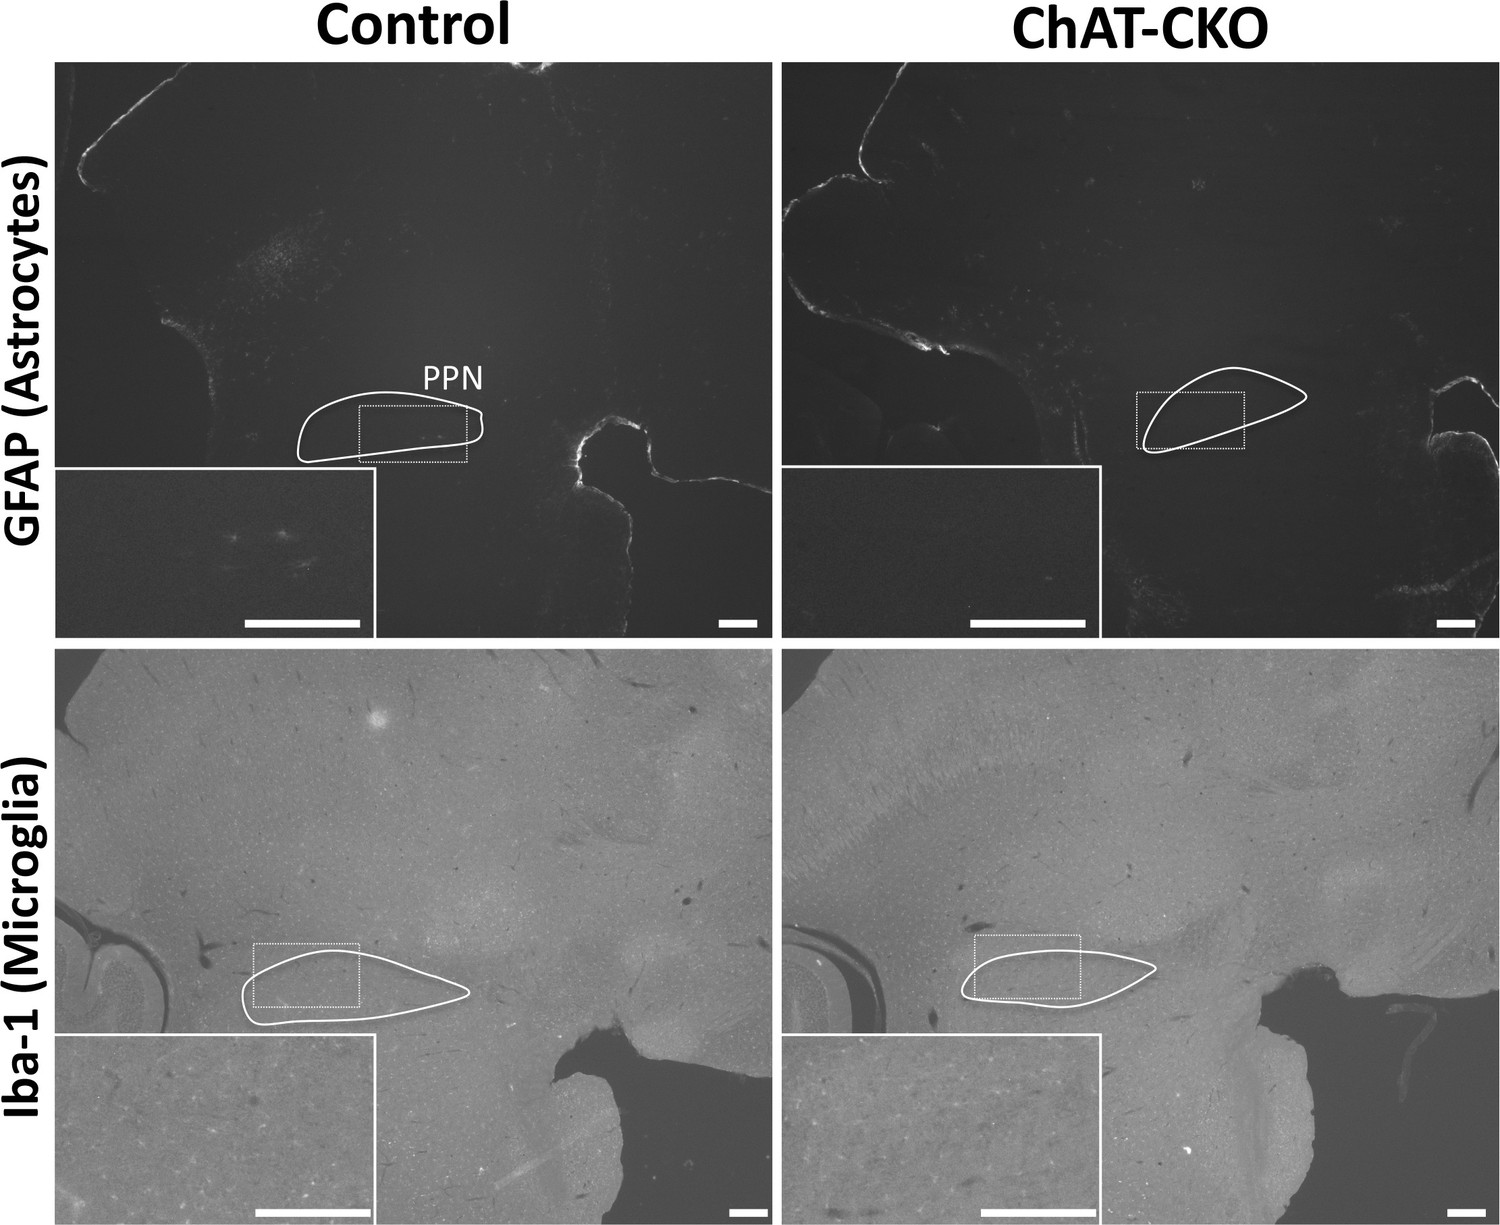
Absence of gliosis in the brainstem of ChAT-CKO mice.
Immunohistochemistry of GFAP (glial fibrillary acidic protein; specific to astrocytes) and Iba-1 (ionized calcium-binding adapter molecule 1; specific to microglia) in sagittal sections of control and ChAT-CKO hindbrain demonstrate normal distribution of glia.
Figure 3 with 4 supplements
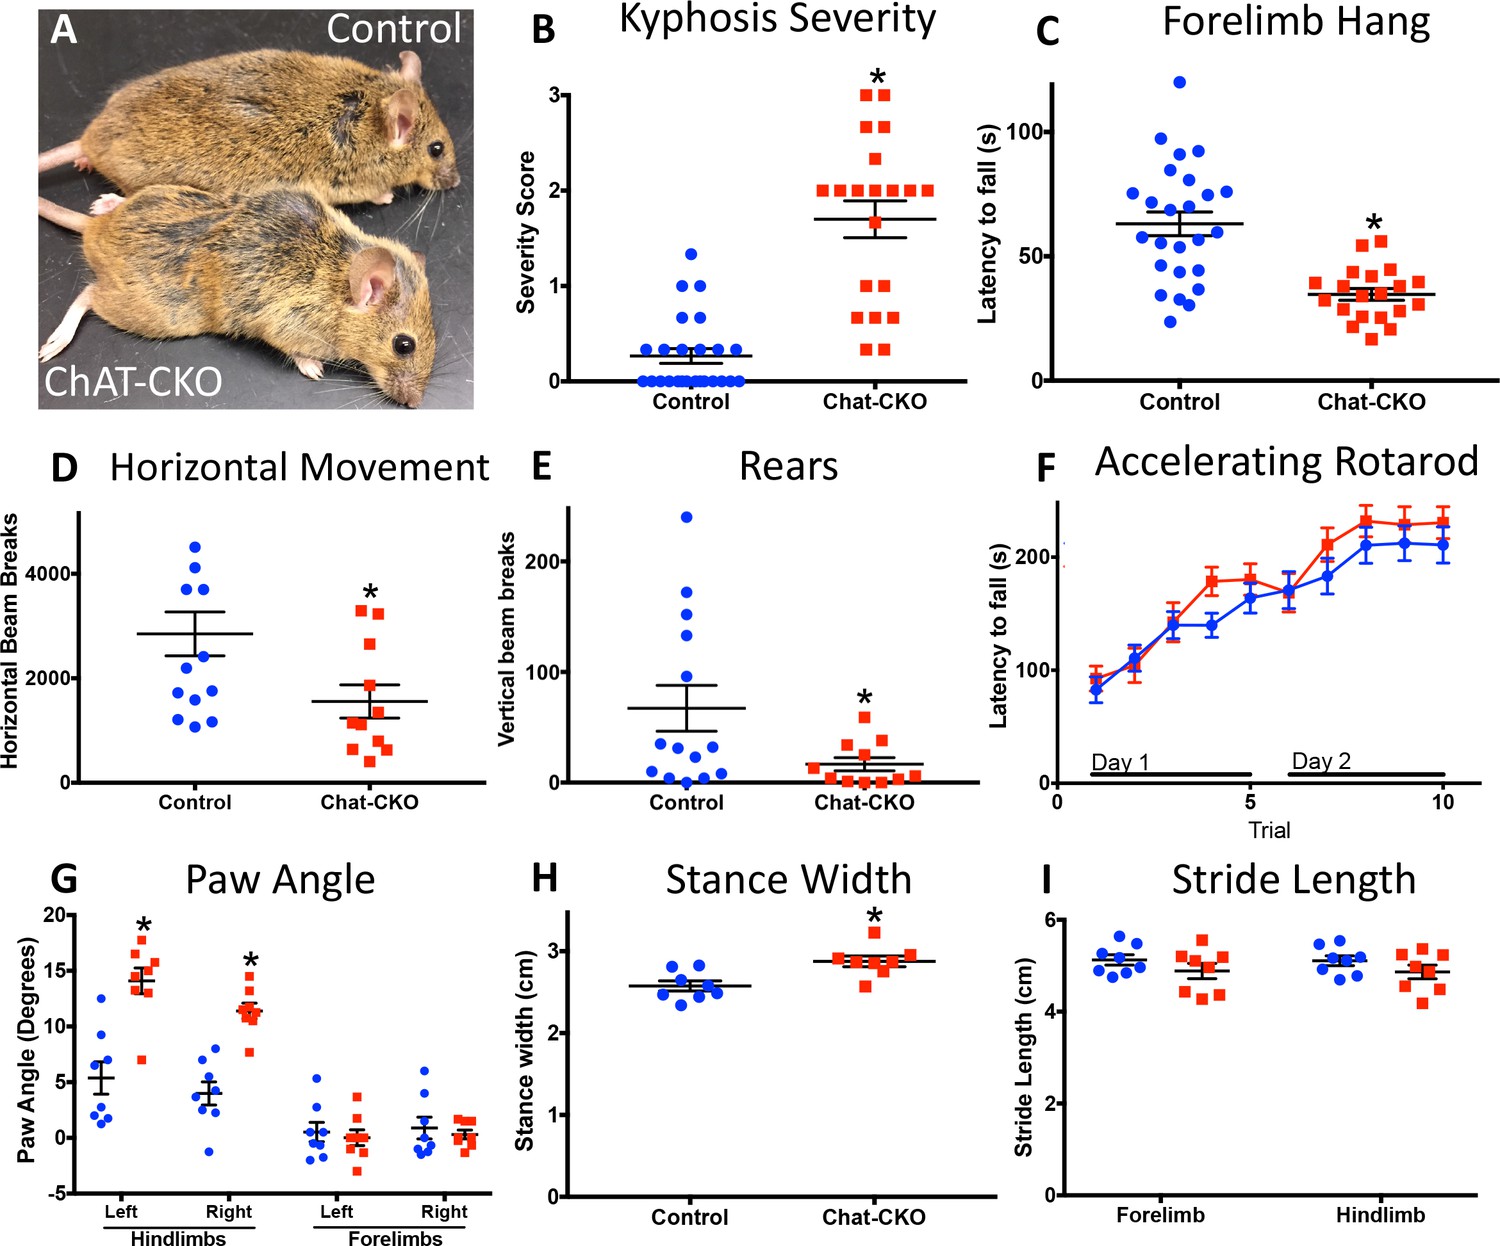
Motor behavior is severely disrupted in ChAT-CKO mice.
(A) Representative image of a control and ChAT-CKO mouse demonstrates severe kyphosis and unkempt coat. (B) ChAT-CKO mice exhibit significantly increased kyphotic curvature during locomotion (Mann-Whitney U = 35, p<0.0001). (C) ChAT-CKO mice exhibit a significantly reduced latency to fall during forelimb suspension (Mann-Whitney U = 71.5, p<0.0001). (D, E) ChAT-CKO mice are hypoactive in the open field (horizontal movement, t(23)=2.345, p=0.028; vertical rears, welch-corrected t(15.1) = 2.345, p=0.033). (F) Performance on the accelerated rotarod does not significantly differ from controls (two-way repeated measures ANOVA, genotype, F(1,43)=0.75, p=0.389; trial, F(9,387)=55.63, p<0.0001; interaction, F(9,387)=1.194, p=0.297). (G - I) ChAT-CKO mouse gait is abnormal during locomotion (paw angle, two-way ANOVA main effect of genotype, F(1,56)=30.54, p<0.0001, main effect of limb F(3,56)=51.02, p<0.0001, interaction F(3,56)=13.51, p<0.0001, post-hoc Sidak’s multiple comparisons test. Stance width, t(14)=3.329, p=0.005. Stride length, two-way ANOVA genotype F(1,28)=3.164, p=0.086, limb F(1,28)=0.02, p=0.887, interaction F(1,28)=0.0001, p=0.989).
Figure 3—figure supplement 1

Representative examples of control and ChAT-CKO spinal cords demonstrate significant kyphotic curvature.
https://doi.org/10.7554/eLife.36691.011
Figure 3—figure supplement 2
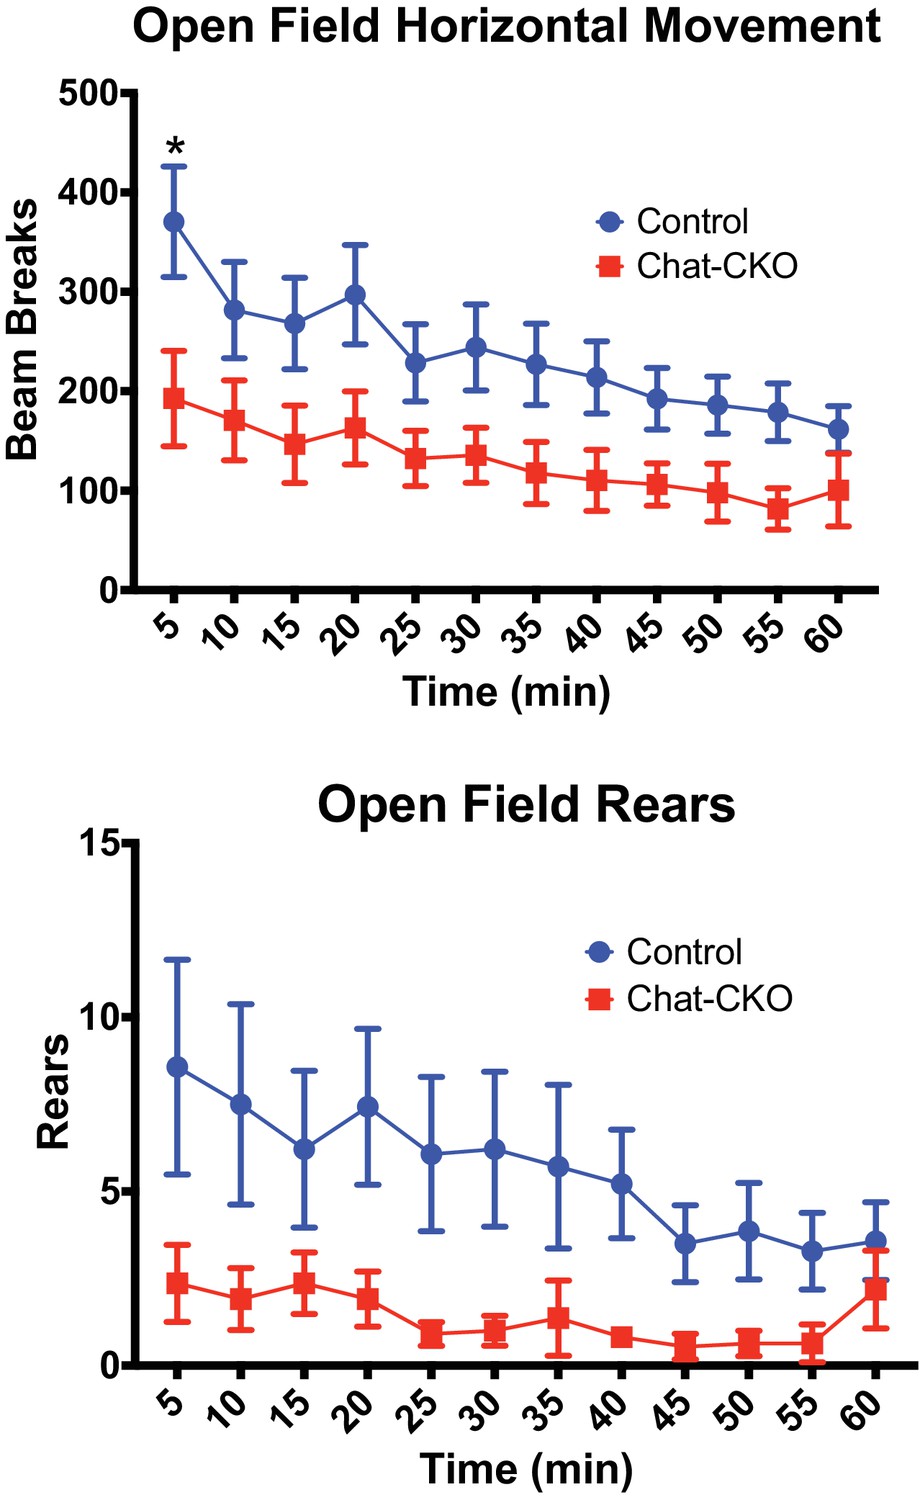
ChAT-CKO mice are significantly hypoactive.
(Upper panel) Open field analysis of horizontal movements (two-way repeated measures ANOVA main effect of genotype F(1,23)=5.498, p=0.02, time F(11,253)=9.222, p<0.0001, interaction F(11,253)=0.899, p=0.541, post-hoc Sidak’s multiple comparisons test). (Lower panel) Open field analysis of vertical rearing movements (two-way repeated measures ANOVA main effect of genotype F(1,23)=4.413, p=0.046, time F(11,253)=2.452, p=0.0063, interaction F(11,253)=0.987, p=0.458).
Figure 3—video 1
Representative video demonstrating tremulousness, kyphosis, and hyperactivity in ChAT-CKO mice, as compared to controls.
https://doi.org/10.7554/eLife.36691.013
Figure 3—video 2
ChAT-CKO exhibit twisting and tremulousness, but not limb clasping during tail suspension.
Representative video demonstrating tail suspension test in control and ChAT-CKO mice.
Tables
Table 1
Behavioral properties of Dlx-CKO and ChAT-CKO mice.
https://doi.org/10.7554/eLife.36691.015| Motor function | Dlx-CKO | ChAT-CKO |
|---|---|---|
| Pappas et al., 2015 eLife 4:e08352 | present manuscript | |
| Tail suspension | Trunk twisting | Trunk twisting |
| Forelimb clasping | - | |
| Hindlimb clasping | - | |
| - | Tremulousness | |
| Open field | Hyperactivity | Hypoactivity |
| Rotarod | Normal | Normal |
| Response to handling | Exaggerated | Reduced |
| Weakness, latency to fall | Grid hang reduction | Wire hang reduction |
| Gait | Normal by eye | Abnormal by eye |
| Slightly reduced stance width | Increased stance width | |
| - | Increased paw angle | |
| Overt postural abnormalities | - | Severe kyphosis |
| Tremulous movement | - | Severe |
| Labored breathing | - | Severe |
Table 2
Vulnerability of cholinergic populations.
(*)=Unconfirmed by independent marker.
| Cre expression | Cell death vulnerability | |||
|---|---|---|---|---|
| Cholinergic population | Dlx-Cre | ChAT-Cre | Dlx-Cre | ChAT-Cre |
| Dorsolateral striatum (including dorsal caudate putamen) | Confirmed | Confirmed | Severe | Severe |
| Dorsomedial striatum (including ventral caudate putamen) | Confirmed | Confirmed | Mild | Spared |
| Nucleus accumbens | Confirmed | Confirmed | - | - |
| Basal forebrain | Confirmed | Confirmed | Spared | Spared |
| Cholinergic Brainstem | Absent | Confirmed | n/a | Severe (*) |
| Primary Motor Neurons | Absent | Confirmed | n/a | Moderate |
Table 3
Properties of cholinergic neuronal populations.
‘Nucleus Basalis Complex’=Nucleus Basalis of Meynert, Horizontal limb of the diagonal band of Broca, Ventral Pallidum, Magnocellular Preoptic Area, Substantia Inominata, Nucleus of the Ansa Lenticularis. ‘Septa”l = Medial Septum, Vertical Limb of the Diagonal Band of Broca. ‘Cholinergic Brainstem’=Pedunculopontine Nucleus, Laterodorsal Tegmental Nucleus (Pappas et al., 2015; Mena-Segovia and Bolam, 2017; Gonzales and Smith, 2015; Manns et al., 2000; Unal et al., 2012; Petzold et al., 2015; Kanning et al., 2010; Kreitzer, 2009; Zaborszky et al., 2012; Garcia-Rill, 1991; Semba et al., 1988; Semba and Fibiger, 1992; Phelps et al., 1990a; Phelps et al., 1988; Phelps et al., 1990b; Phelps et al., 1989; Aroca and Puelles, 2005; Schambra et al., 1989).
| Cholinergic population | Neuronal class | Firing properties | Efferent projections | Afferent inputs | Birth date/final mitosis | Embryonic origin | ChAT expression |
|---|---|---|---|---|---|---|---|
| Dorsolateral striatum (including dorsal caudate putamen) | Interneuron | tonically active, 2–10 Hz baseline firing rate | Local - striatal spiny projection neurons and fast spiking interneurons | Thalamus, sensorimotor cortex, striatal spiny projection neurons, striatal interneurons | E12-E15 | MGE | ~E16 |
| Dorsomedial striatum (including ventral caudate putamen) | Interneuron | tonically active, 2–10 Hz baseline firing rate | Local - striatal spiny projection neurons and fast spiking interneurons | Thalamus, association cortices, striatal spiny projection neurons, striatal interneurons | E12-E15 | MGE | ~E16 |
| Nucleus accumbens | Interneuron | tonically active, 0.6–12 Hz baseline firing rate | Local - striatal spiny projection neurons and fast spiking interneurons | Thalamus, frontal cortex, striatal spiny projection neurons, striatal interneurons | E12-E15 | MGE | ~E16 |
| Basal forebrain | Projection neuron | Tonic/burst, subtype dependent | Cortex (Nucleus Basalis Complex), Hippocampus (Septal) | Medulla, locus ceruleus, substantia nigra, ventral tegmental area, hypothalamic nuclei, nucleus accumbens, amygdala, local intrinsic GABAergic and glutamatergic collaterals | E11-E15 | POA/MGE | ~E15-16 |
| Cholinergic Brainstem | Projection neuron | episodic | Midbrain, superior colliculus, thalamus, globus pallidus, hypothalamus, septum, striatum, cortex | Brainstem reticular formation, midbrain central gray, lateral hypothalamus-zona incerta, cortex, amygdala, basal forebrain, basal ganglia output nuclei, brainstem and spinal cord sensory nuclei | E12-E13 | Ventral rhombomere 1 (r1) | |
| Primary Motor Neurons | Projection neuron | subtype dependent | Muscle | Motor Cortex, local spinal cord interneurons and sensory neurons | E11-E12 | Ventral spinal cord progenitor domains | E13 |
Key resources table
| Reagent type (species) or resource | Designation | Source or reference | Identifiers | Additional information |
|---|---|---|---|---|
| Gene (Mus musculus) | Tor1a | NA | NCBI Gene: 30931; MGI:1353568 | Encodes TorsinA |
| Strain, strain background(M. musculus) | ChAT-Cre | Jackson Laboratories | Stock ID 006410 | Chattm2(cre)Lowl; (Chat-IRES-Cre) |
| Strain, strain background(M. musculus) | Tor1aFlx/Flx | Jackson Laboratories | Stock ID 025832 | Tor1atm3.1Wtd |
| Strain, strain background(M. musculus) | Tor1a-/- | Jackson Laboratories | Stock ID 006251 | Tor1atm1Wtd |
| Antibody | Choline Acetyltransferase | Millipore AB144P | RRID: AB_2079751 | 1:100 |
| Antibody | P75 Neurotrophin Receptor | Santa Cruz sc6188 | RRID: AB_2267254 | 1:100 |
| Antibody | NeuN | Cell Signaling #12943 | RRID: AB_2630395 | 1:500 |
| Antibody | GFAP | Cell Signaling #3670P | RRID: AB_561049 | 1:1000 |
| Antibody | Iba-1 | Wako 019–19741 | RRID: AB_839504 | 1:500 |
| Antibody | TorsinA | Abcam ab34540 | RRID: AB_2240792 | 1:100 |
| Antibody | anti-mouse | ThermoFisher A-31571 | RRID: AB_162542 | 1:800 |
| Antibody | anti-rabbit | ThermoFisher A-21206 | RRID: AB_2535792 | 1:800 |
| Antibody | anti-rabbit | ThermoFisher A-31572 | RRID: AB_162543 | 1:800 |
| Antibody | anti-goat | ThermoFisher A-21432 | RRID: AB_2535853 | 1:800 |
| Antibody | anti-goat | Jackson Immunoresearch 705-065-003 | RRID: AB_2340396 | 1:800 |
| Commercial assay or kit | ABC HRP Kit (Standard) | Vector Laboratories | Pk-6100 | Vectastain elite ABC kit |
Table 4
Antibodies used for immunohistochemistry.
https://doi.org/10.7554/eLife.36691.018| Level | Antigen | Host | Conjugated | Dilution | Source |
|---|---|---|---|---|---|
| Primary | Choline Acetyltransferase | Goat | - | 1:100 | Millipore AB144P |
| Primary | P75 Neurotrophin Receptor | Goat | - | 1:100 | Santa Cruz sc6188 |
| Primary | NeuN | Rabbit | - | 1:500 | Cell Signaling #12943 |
| Primary | GFAP | Mouse | - | 1:1000 | Cell Signaling #3670P |
| Primary | Iba-1 | Rabbit | - | 1:500 | Wako 019–19741 |
| Primary | TorsinA | Rabbit | - | 1:100 | Abcam ab34540 |
| Secondary | anti-mouse | Donkey | Alexafluor-647 | 1:800 | ThermoFisher A-31571 |
| Secondary | anti-rabbit | Donkey | Alexafluor-488 | 1:800 | ThermoFisher A-21206 |
| Secondary | anti-rabbit | Donkey | Alexafluor-555 | 1:800 | ThermoFisher A-31572 |
| Secondary | anti-goat | Donkey | Alexafluor-555 | 1:800 | ThermoFisher A-21432 |
| Secondary | anti-goat | Donkey | biotin | 1:800 | Jackson Immunoresearch 705-065-003 |
Table 5
Stereology parameters.
https://doi.org/10.7554/eLife.36691.019| Region | Marker | Counting frame (μm) | Grid size (μm) | Guard zone (μm) | Dissector (μm) | Section cut thickness (μm) |
|---|---|---|---|---|---|---|
| Striatum | ChAT | 100 × 100 | 250 × 250 | 1 | 10 | 40 |
| NBM | P75 | 90 × 90 | 200 × 200 | 5 | 30 | 50 |
| MS/VDB | P75 | 90 × 90 | 200 × 200 | 5 | 30 | 50 |
| GP | P75 | 100 × 100 | 140 × 140 | 5 | 30 | 50 |
| PPN and LDT | ChAT | 75 × 75 | 150 × 150 | 5 | 30 | 50 |
| PPN and LDT | NeuN | 40 × 40 | 250 × 250 | 5 | 30 | 50 |
Additional files
-
Transparent reporting form
- https://doi.org/10.7554/eLife.36691.020
Download links
A two-part list of links to download the article, or parts of the article, in various formats.
Downloads (link to download the article as PDF)
Open citations (links to open the citations from this article in various online reference manager services)
Cite this article (links to download the citations from this article in formats compatible with various reference manager tools)
A cell autonomous torsinA requirement for cholinergic neuron survival and motor control
eLife 7:e36691.
https://doi.org/10.7554/eLife.36691


