Cortical dynein pulling mechanism is regulated by differentially targeted attachment molecule Num1
- University of Massachusetts, United States
- Dartmouth College, United States
Figures
Figure 1 with 5 supplements
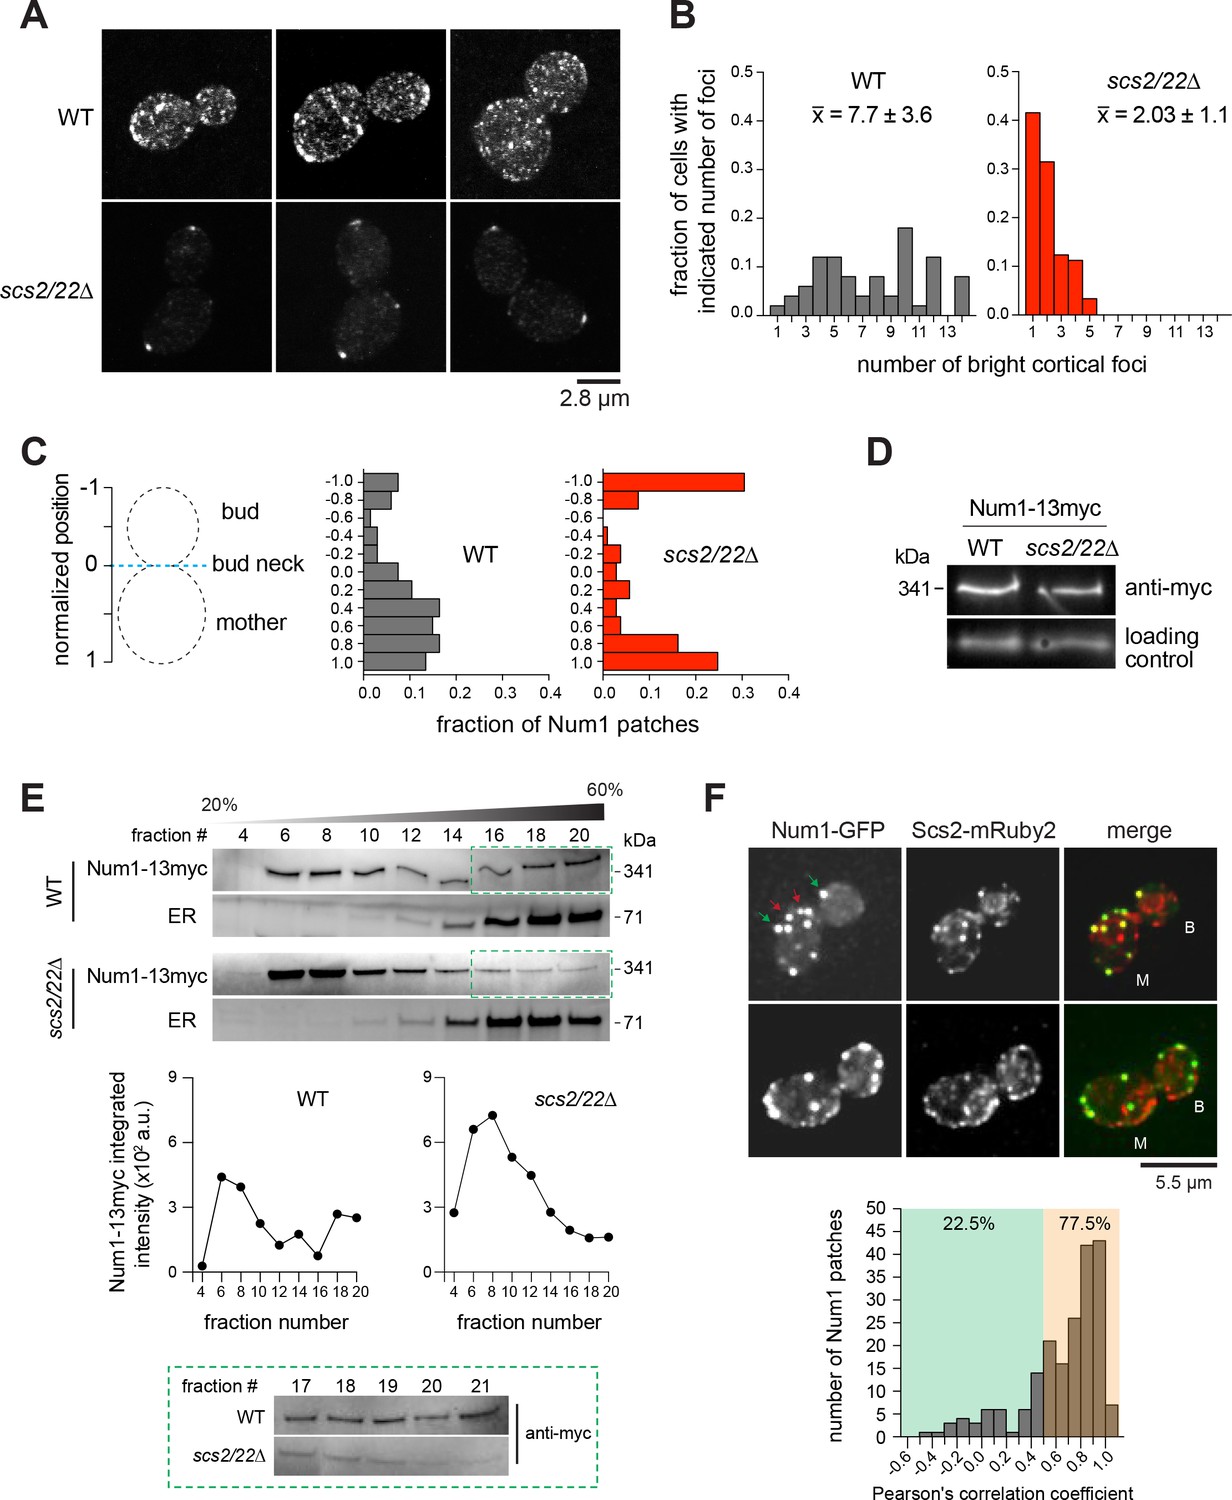
Num1 localization is altered by deletion of Scs2/22.
(A) 2D projections of 3D confocal stack images of Num1-GFP in WT and scs2/22∆ cells. (B) Fraction of cells with indicated number of Num1-GFP patches. , average number of patches per cell (n ≥ 50 cells per strain). (C) Distribution of Num1-GFP patches along the cortex. The position of each patch was projected on the mother-bud axis and normalized to the bud neck. Positive distances indicate that the patch was in the mother cell, whereas negative distances indicate that the patch was in the daughter cell (n = 46 and 16 cells for scs2/22∆ and WT, respectively). (D) Western blots showing Num1-13myc levels in whole cell lysates of indicated strains. (E) Sucrose gradient sedimentation analysis of Num1-13myc in WT and scs2/22∆ strains. Whole cell lysates from each strain were loaded onto 20-60% sucrose gradients, sedimented, and analyzed by Western blot using anti-c-Myc (for Num1-13myc) and anti-Sac1 (for ER) antibodies. Top, representative sedimentation profiles from two independent experiments. Middle, Num1-13myc band intensity plotted against fraction number. Bottom, Western blot showing Num1-13myc in fractions 17 through 21. (F) Deconvolved wide-field images of Num1-GFP and Scs2-mRuby2 in WT cells. Each image is a 2D projection of 11 optical sections spaced 0.5 µm apart. Green and red arrows indicate Num1-GFP patches that do and do not colocalize with Scs2-mRuby2 foci, respectively. B, bud; M, mother. Bottom, histogram of Pearson’s correlation coefficients for the colocalization of Num1-GFP with Scs2-mRuby2 (n = 200 cortical Num1 patches found in either bud or mother cell).
Figure 1—figure supplement 1
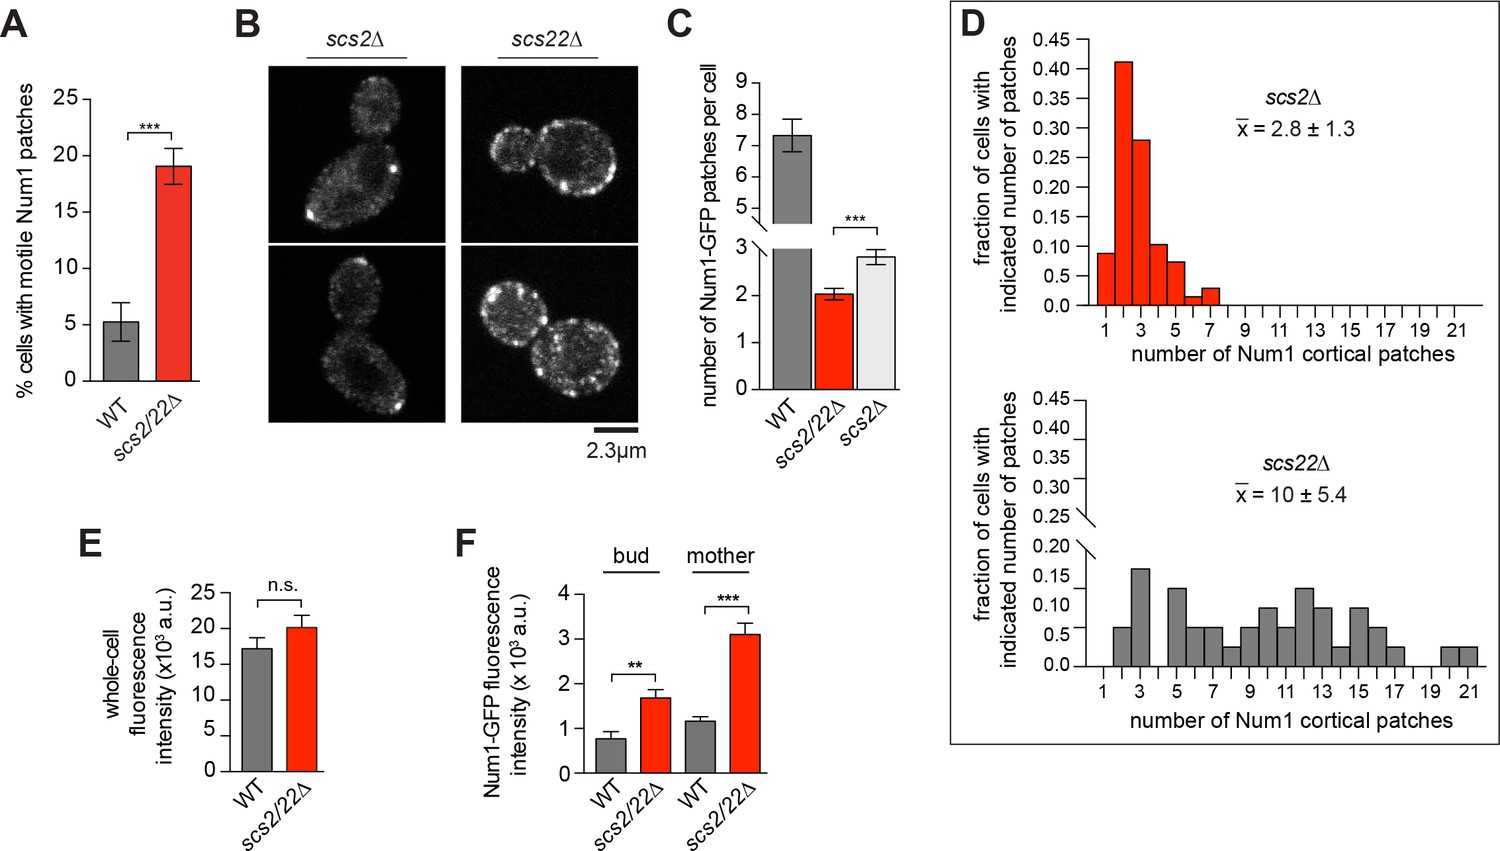
Num1-GFP localization in scs2∆ and scs22∆ single mutants and scs2/22∆ double mutant.
(A) Percentage of cells exhibiting motile Num1 patches during a ≥3-min movie in WT and scs2/22∆ backgrounds. Error bars are SEP (n ≥ 171 for each strain). ***p<0.0001 determined by unpaired t test. (B) Confocal images of live cells expressing Num1-GFP in single mutants of scs2∆ and scs22∆. (C) Average number of cortical patches per cell in each indicated strain (n ≥ 40 cells per strain). Error bars are SEM. ***p<0.0001 by unpaired t test. (D) Histogram of relative frequency of cortical Num1 patches in single mutants of scs2∆ (n = 68) and scs22∆ (n = 40). , average number of patches per cell. (E) Total whole-cell fluorescence intensity of WT and scs2/22∆ double mutant expressing Num1-GFP (n ≥ 79 cells for each strain). Error bars depict SEM. n.s. not statistically significant by unpaired t test. (F) Fluorescence intensity measurement of Num1-GFP patches in the mother and bud cortex (n ≥ 81 foci for each). Error bars indicate SEM. **p<0.005; ***p < 0.0001 by unpaired t test.
Figure 1—figure supplement 2
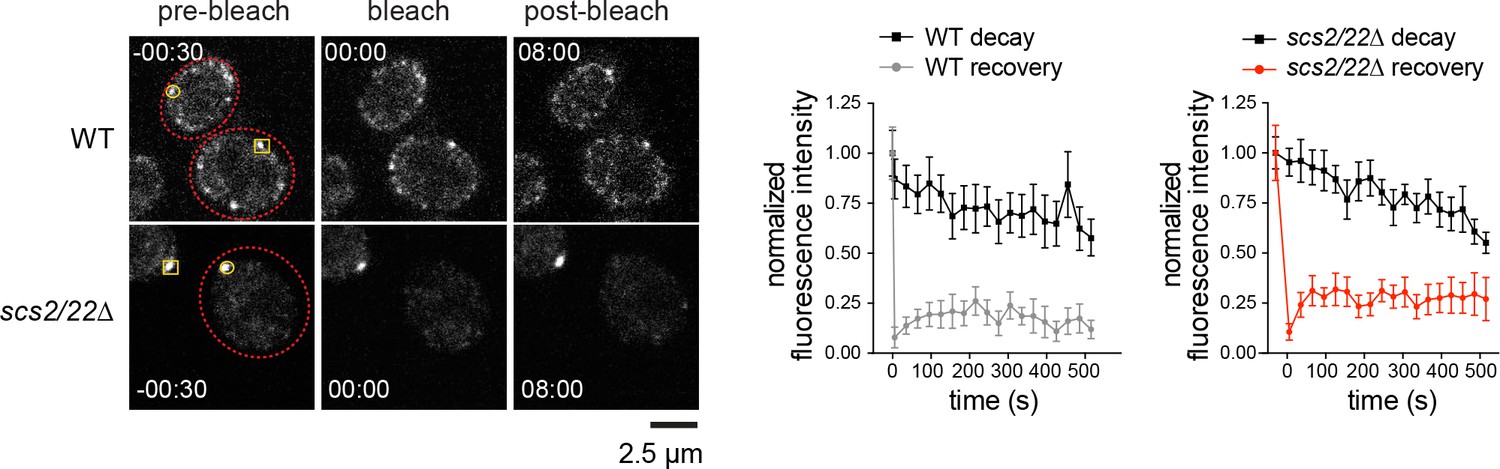
FRAP of Num1-GFP foci in WT and scs2/22∆ cells.
Photobleached foci are indicated by a circle at t = −30 s (n = 6 for WT, 10 for scs2/22∆). Non-photobleached foci (as control for fluorescence decay) are indicated by a box (n = 4 for WT, nine for scs2/22∆). Right, fluorescence intensity plots for bleached and non-bleached Num1-GFP foci. No recovery after photobleaching was observed for Num1-GFP foci in WT or scs2/22∆ cells over the course of 8 min. Error bars represent SEM.
Figure 1—figure supplement 3
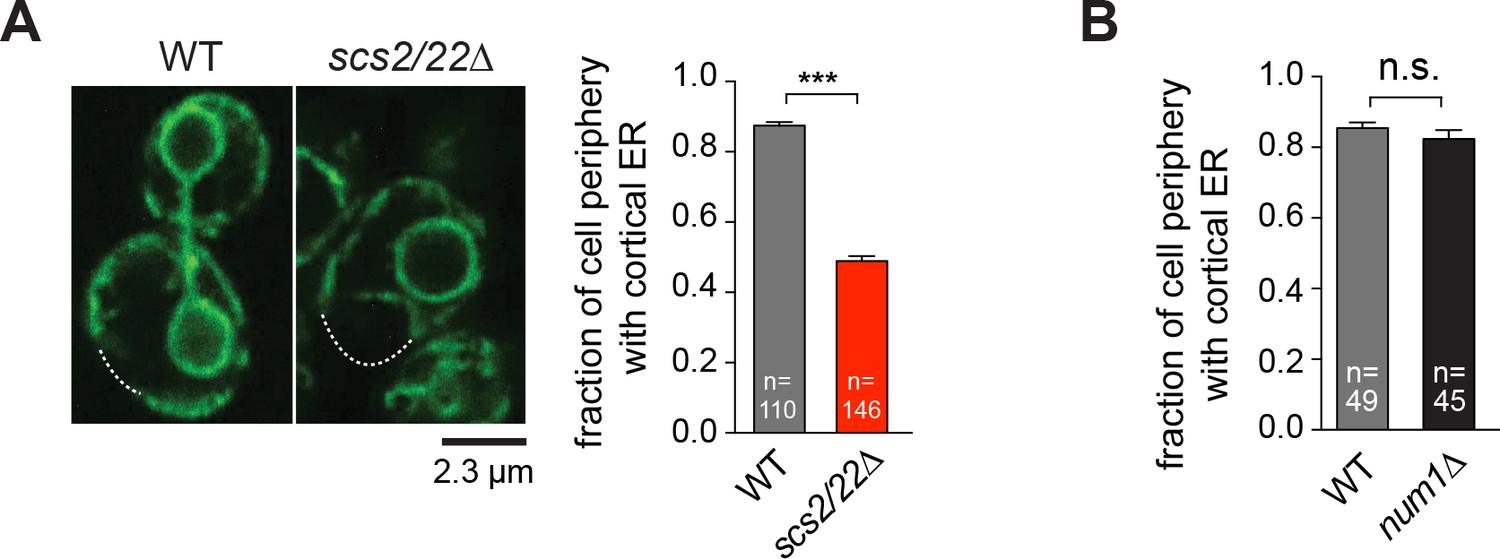
Deletion of Scs2/22 but not Num1 results in loss of cortical ER.
(A) Equatorial confocal sections of WT and scs2/22∆ cells expressing the ER-marker GFP-HDEL. Dashed lines indicate cell periphery without cortical ER. Right, plot showing fraction of cell perimeter with cortical ER labeled with GFP-HDEL in WT and scs2/22∆ cells. (B) Quantification as in (A) for WT and num1∆ cells. Error bars indicate SEM for (A) and (B). ***p<0.0001 by unpaired t test. n.s., not statistically significant.
Figure 1—figure supplement 4
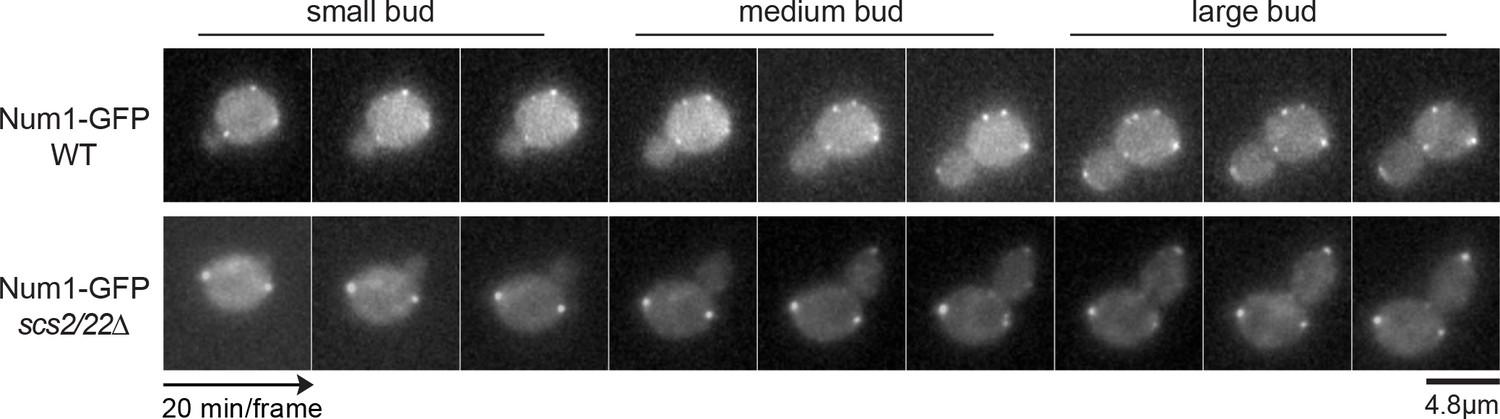
Time-lapse images of WT and scs2/22∆ cells expressing Num1-GFP.
Num1 is absent from the bud in small budded stage and accumulates at the bud tip in medium to large budded stages.
Figure 1—figure supplement 5
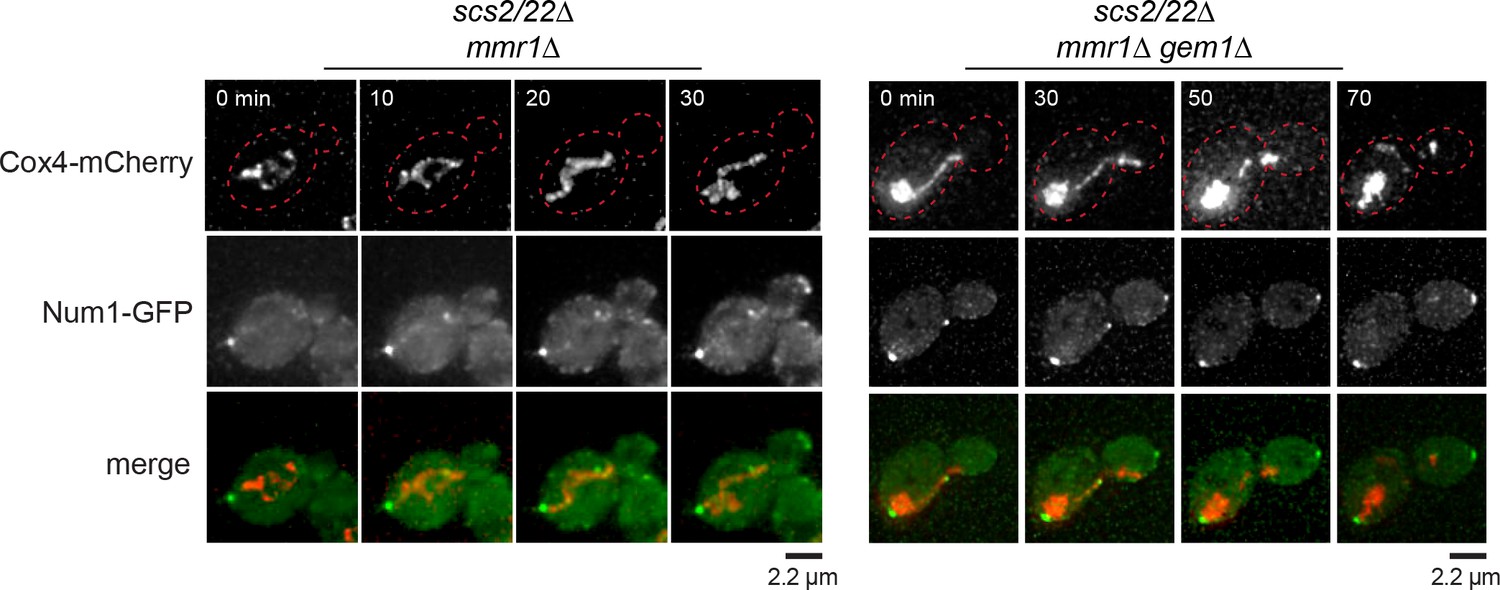
Num1-GFP clustering in scs2/22∆ is independent of mitochondria segregation into buds.
Deconvolved movie frames of mmr1∆ and mmr1∆ gem1∆ cells expressing Num1-GFP and Cox4-mCherry in the scs2/22∆ background. Cell cortex is outlined with red dotted line. Time is in minutes.
Figure 2 with 1 supplement
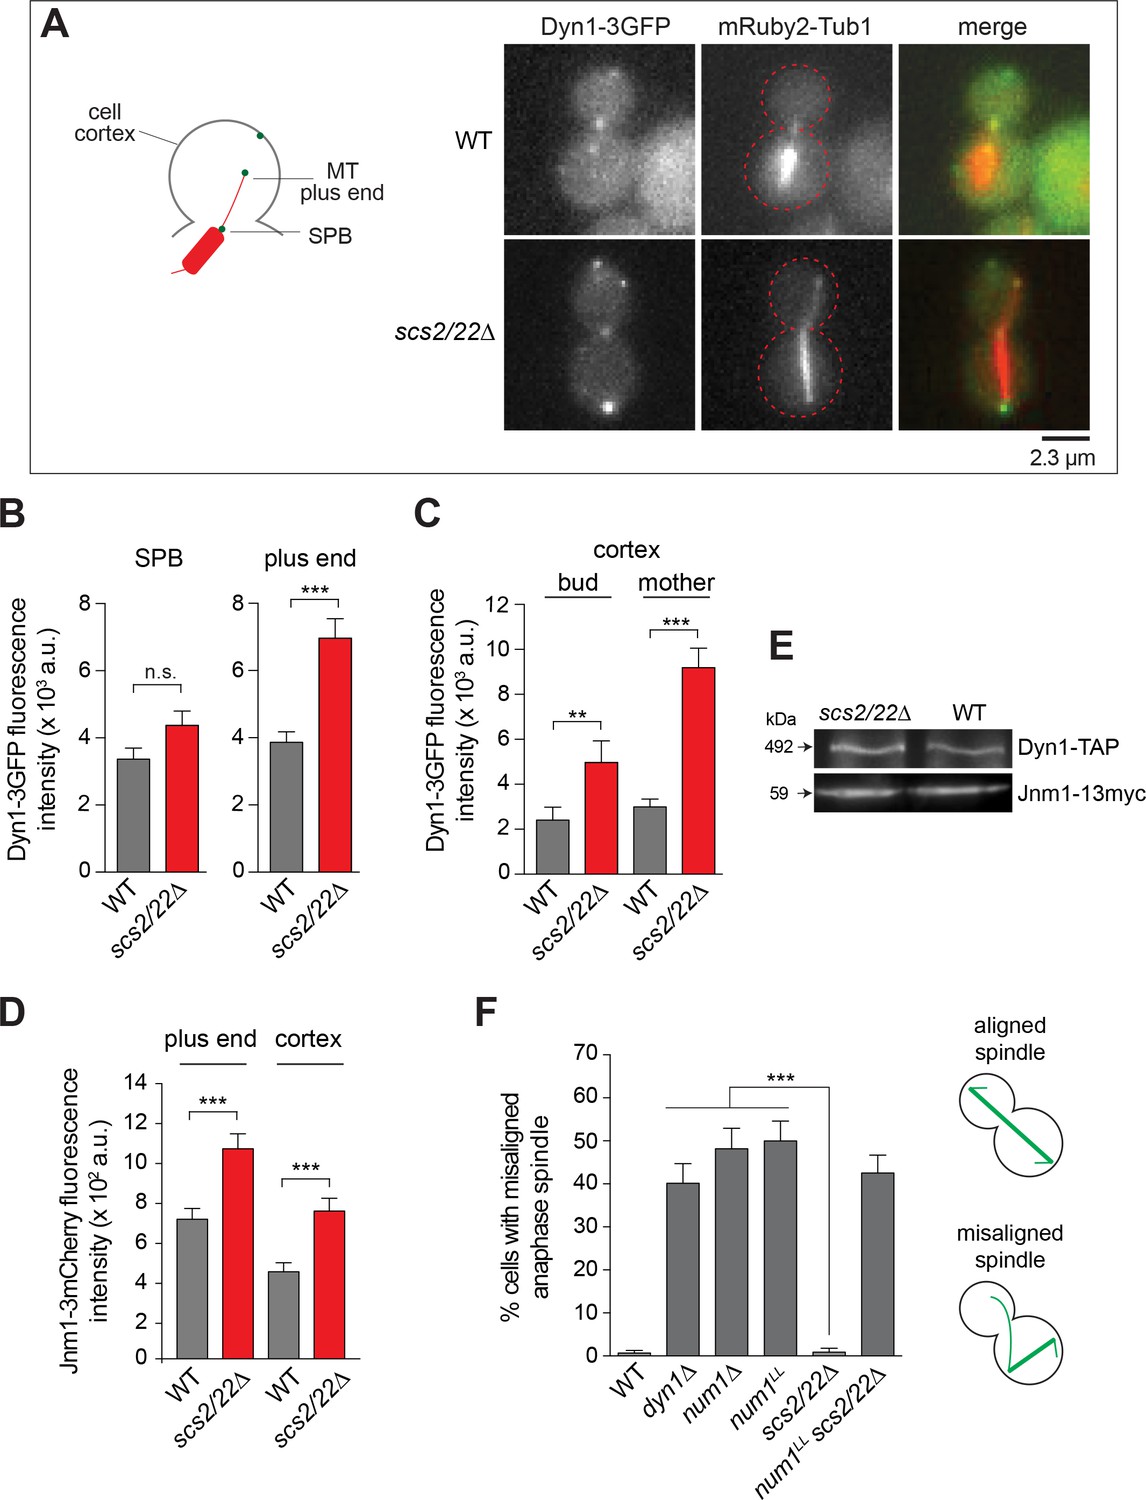
Dynein localization and function in scs2/22∆ cells.
(A) Wide-field images of live cells expressing Dyn1-3GFP and mRuby2-Tub1 in WT and scs2/22∆ cells. (B and C) Dyn1-3GFP fluorescence intensity at the SPB (n ≥ 32), plus end (n ≥ 60), and cortex (n ≥ 110). Error bars depict the standard error of the mean (SEM). n.s., not statistically significant; **p<0.005; ***p<0.0001 by unpaired t test. (D) Jnm1-3mCherry fluorescence intensity at the plus end (n ≥ 50) and cortex (n ≥ 29). Error bars indicate SEM. ***p<0.0001 by unpaired t test. (E) Western blots of Dyn1-TAP and Jnm1-13myc levels in total cell lysates of indicated strains. (F) Percentage of misaligned anaphase spindle (n > 110 for each strain). Error bars indicate the standard error of proportion (SEP). ***p<0.0001 by one-way ANOVA test.
Figure 2—figure supplement 1
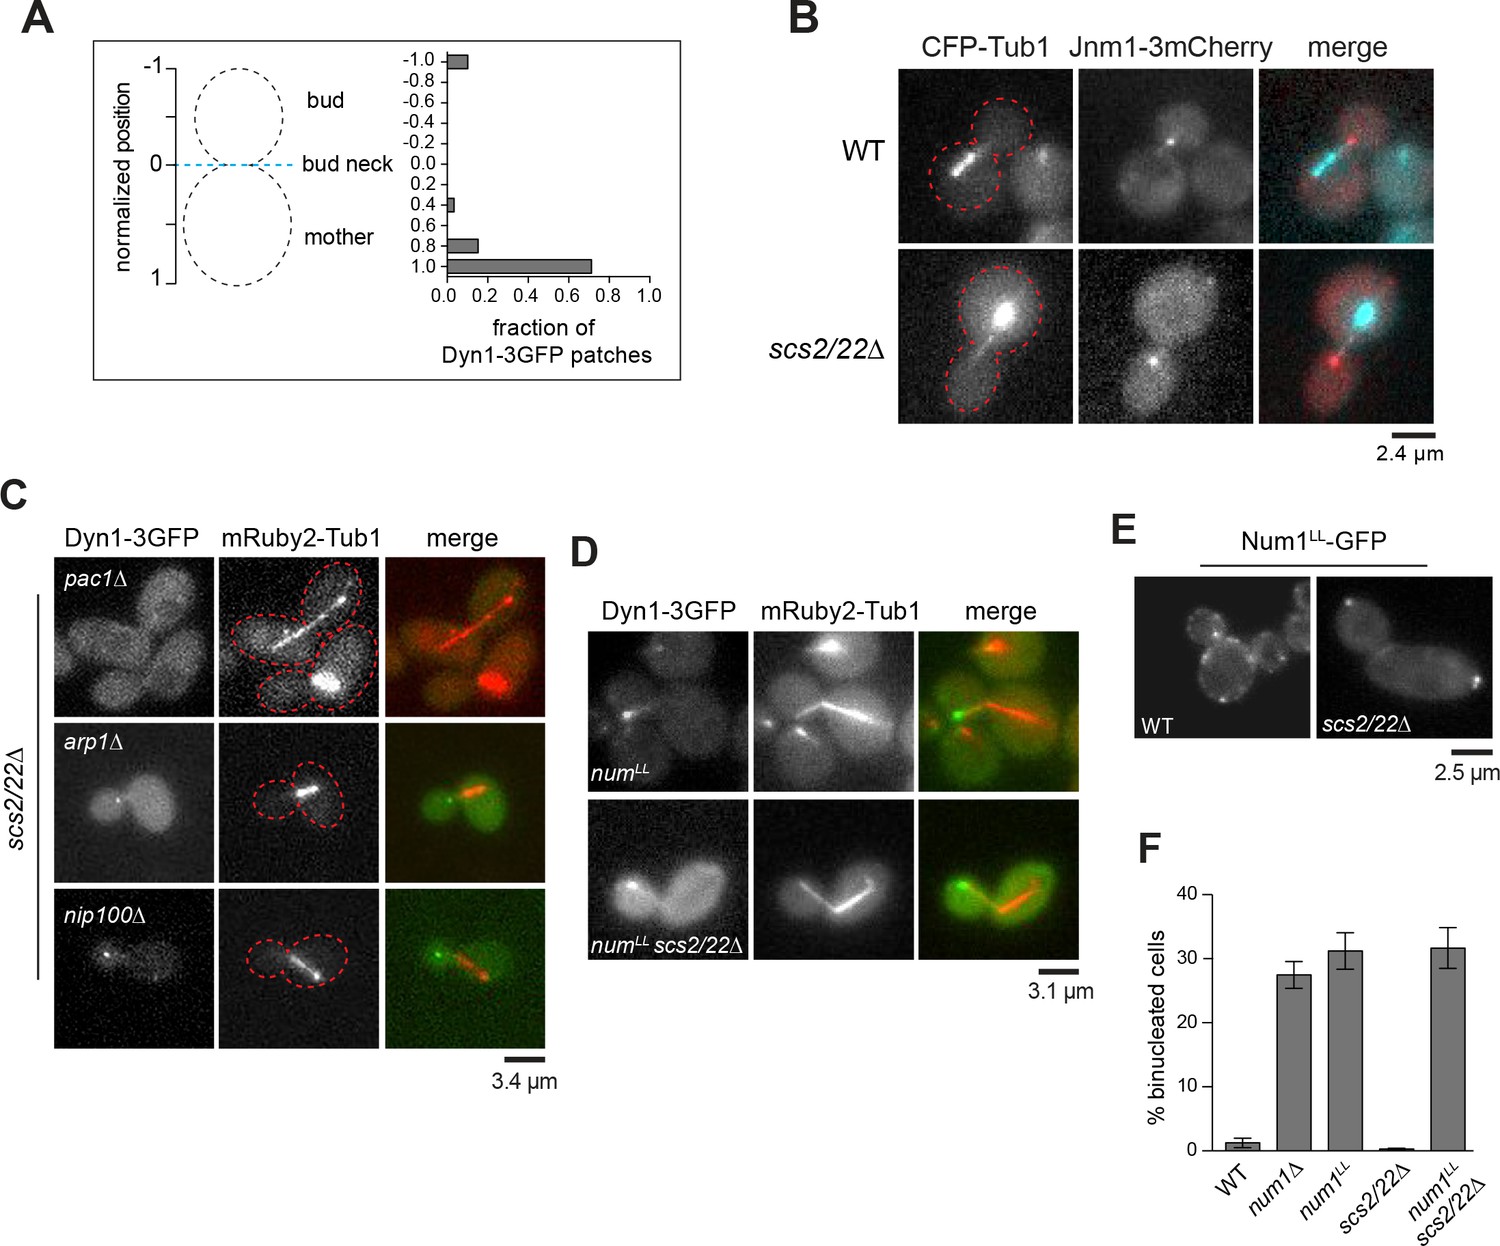
Dynein and dynactin localization in scs2/22∆.
(A) Distribution of cortical Dyn1-3GFP foci in scs2/22∆ cells. The position of each patch was normalized as in Figure 1C (59 foci were analyzed). (B) Wide-field images of Jnm1-3mCherry and CFP-Tub1 in WT and scs2/22∆ cells. (C) Wide-field images showing loss of cortical Dyn1-3GFP in scs2/22∆ cells upon deletion of Arp1, Nip100/p150Glued, and Pac1/LIS1. (D–F) Num1LL-GFP localization and effects of num1LL on dynein localization and function in scs2/22∆. (D) num1LL and num1LL scs2/22∆ cells expressing Dyn1-3GFP and mRuby2-Tub1. (E) Wide-field images showing cortical localization of Num1LL-GFP in WT and scs2/22∆ cells. (F) Cold nuclear segregation assay for indicated strains (n ≥ 221 cells per strain). Cultures were grown at 16°C for 15 hr, fixed and stained with DAPI and then imaged. Error bars indicate SEP.
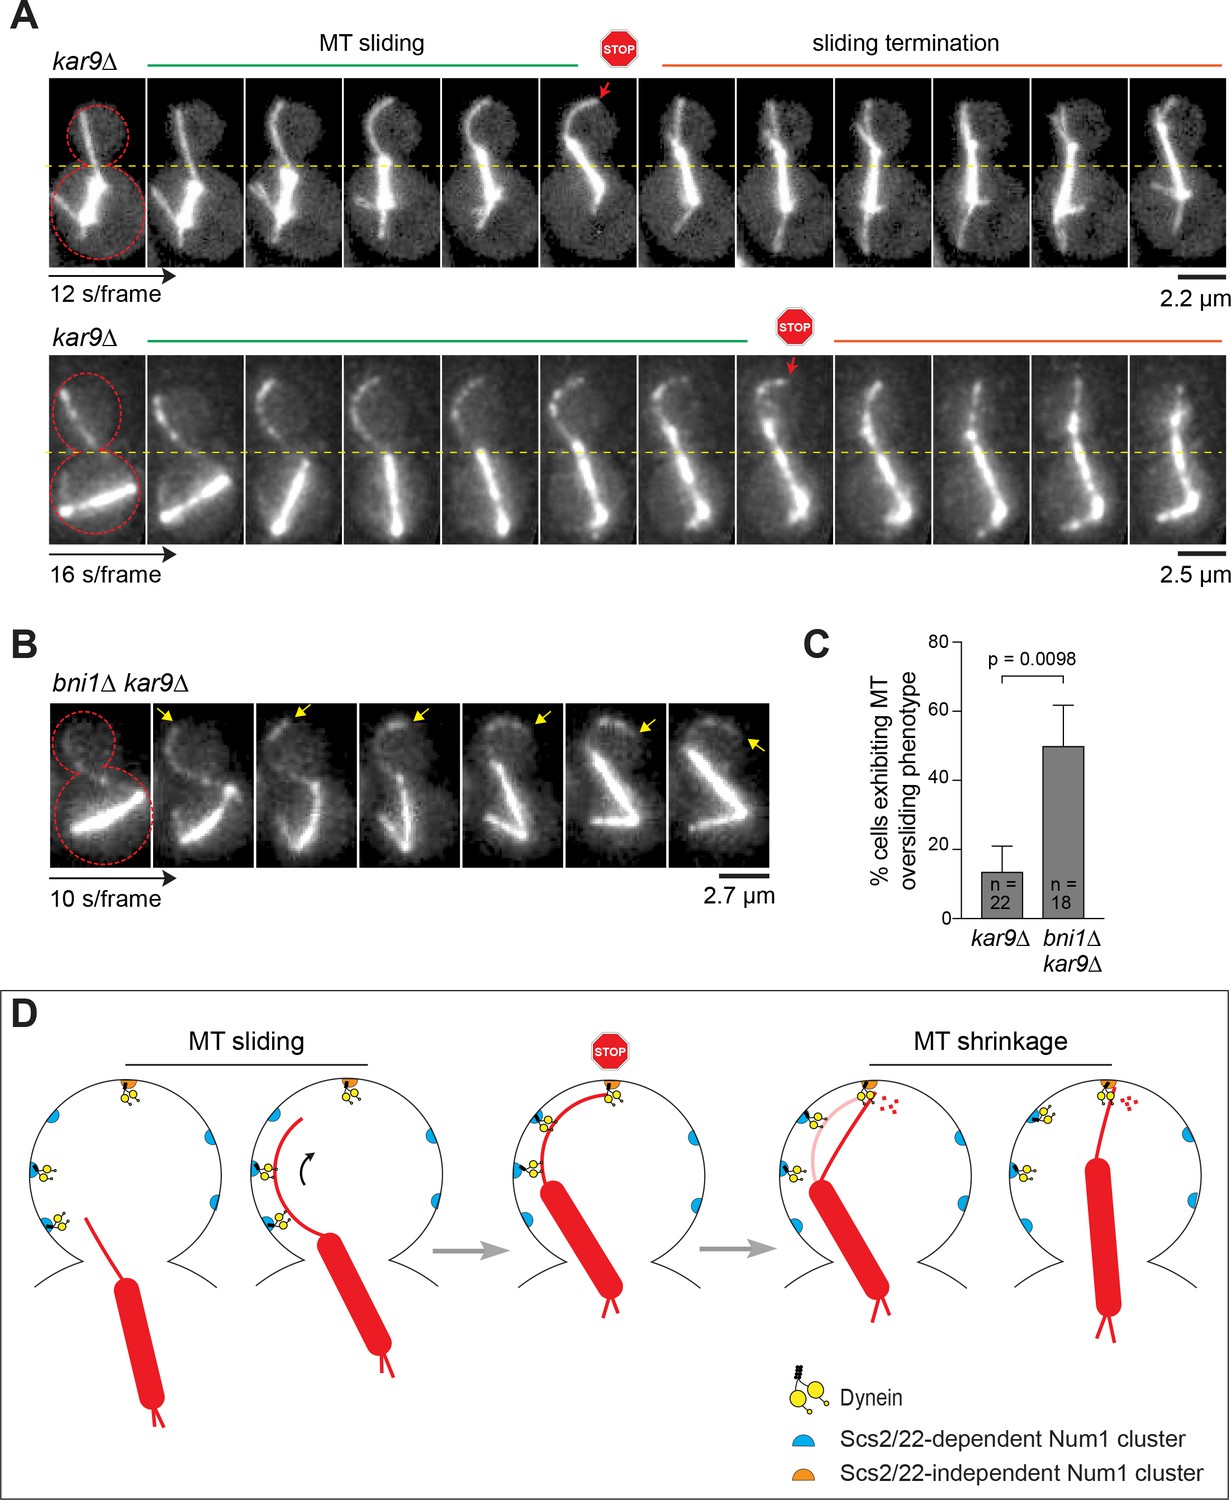
Figure 3 with 1 supplement

Dynein mediates spindle correction via capture-shrinkage mechanism in scs2/22∆ cells.
(A) Representative movie frames of mRuby2-Tub1 showing dynein-dependent spindle correction via sliding or capture-shrinkage mechanism in kar9∆ and scs2/22∆ kar9∆ cells during a 10-min movie. No spindle correction was observed in num1LL scs2/22∆. Dashed line marks the bud neck position. (B) Quantification of spindle correction mechanisms for kar9∆ (n = 30), scs2/22∆ kar9∆ (n = 63), dyn1∆ scs2/22∆ (n = 138), num1LL scs2/22∆ (n = 91), and dyn1K2424A scs2/22∆ (n = 99). Error bars depict SEP. (C) Kymograph analysis of Dyn1-3GFP and mRuby2-Tub1 in scs2/22∆ kar9∆ showing persistence of dynein at the bud tip during a MT shrinkage event. Green arrow, position of bud tip; red arrow, initial contact of Dyn1-3GFP with the bud tip; yellow arrow, start of spindle movement. (D) Percentage of spindle correction by end-on capture-shrinkage mechanism in kar9∆, scs2/22∆ kar9∆, kar3∆ scs2/22∆ kar9∆, and kip3∆ scs2/22∆ kar9∆ during a 10-min movie. Error bars indicate SEP (n ≥ 65). **p<0.005 by unpaired t test. (E) Histogram of the duration of plus end attachment at the bud tip (∆t) for each indicated strain. , average duration of contact (n ≥ 25 per strain).
Figure 3—figure supplement 1

Dynein motor activity is required for capture-shrinkage of astral MT plus ends in scs2/22∆.
(A) Movie frames of mRuby2-Tub1 showing defective spindle translocation into the bud neck in the absence of dynein or dynein motor activity. Horizontal dashed line marks the position of the bud neck. Arrowheads indicate MT buckling events. (B) Anaphase astral MT length for each indicated strain (n ≥ 38 MTs per strain). Plot shows mean ± SEM. ***p<0.0001 by one-way ANOVA test. (C) Dyn1K2424A-3YFP localization in WT and scs2/22∆ backgrounds. Arrowheads indicate dynein foci at the cortex, SPB, and MT plus ends.
Figure 4 with 1 supplement
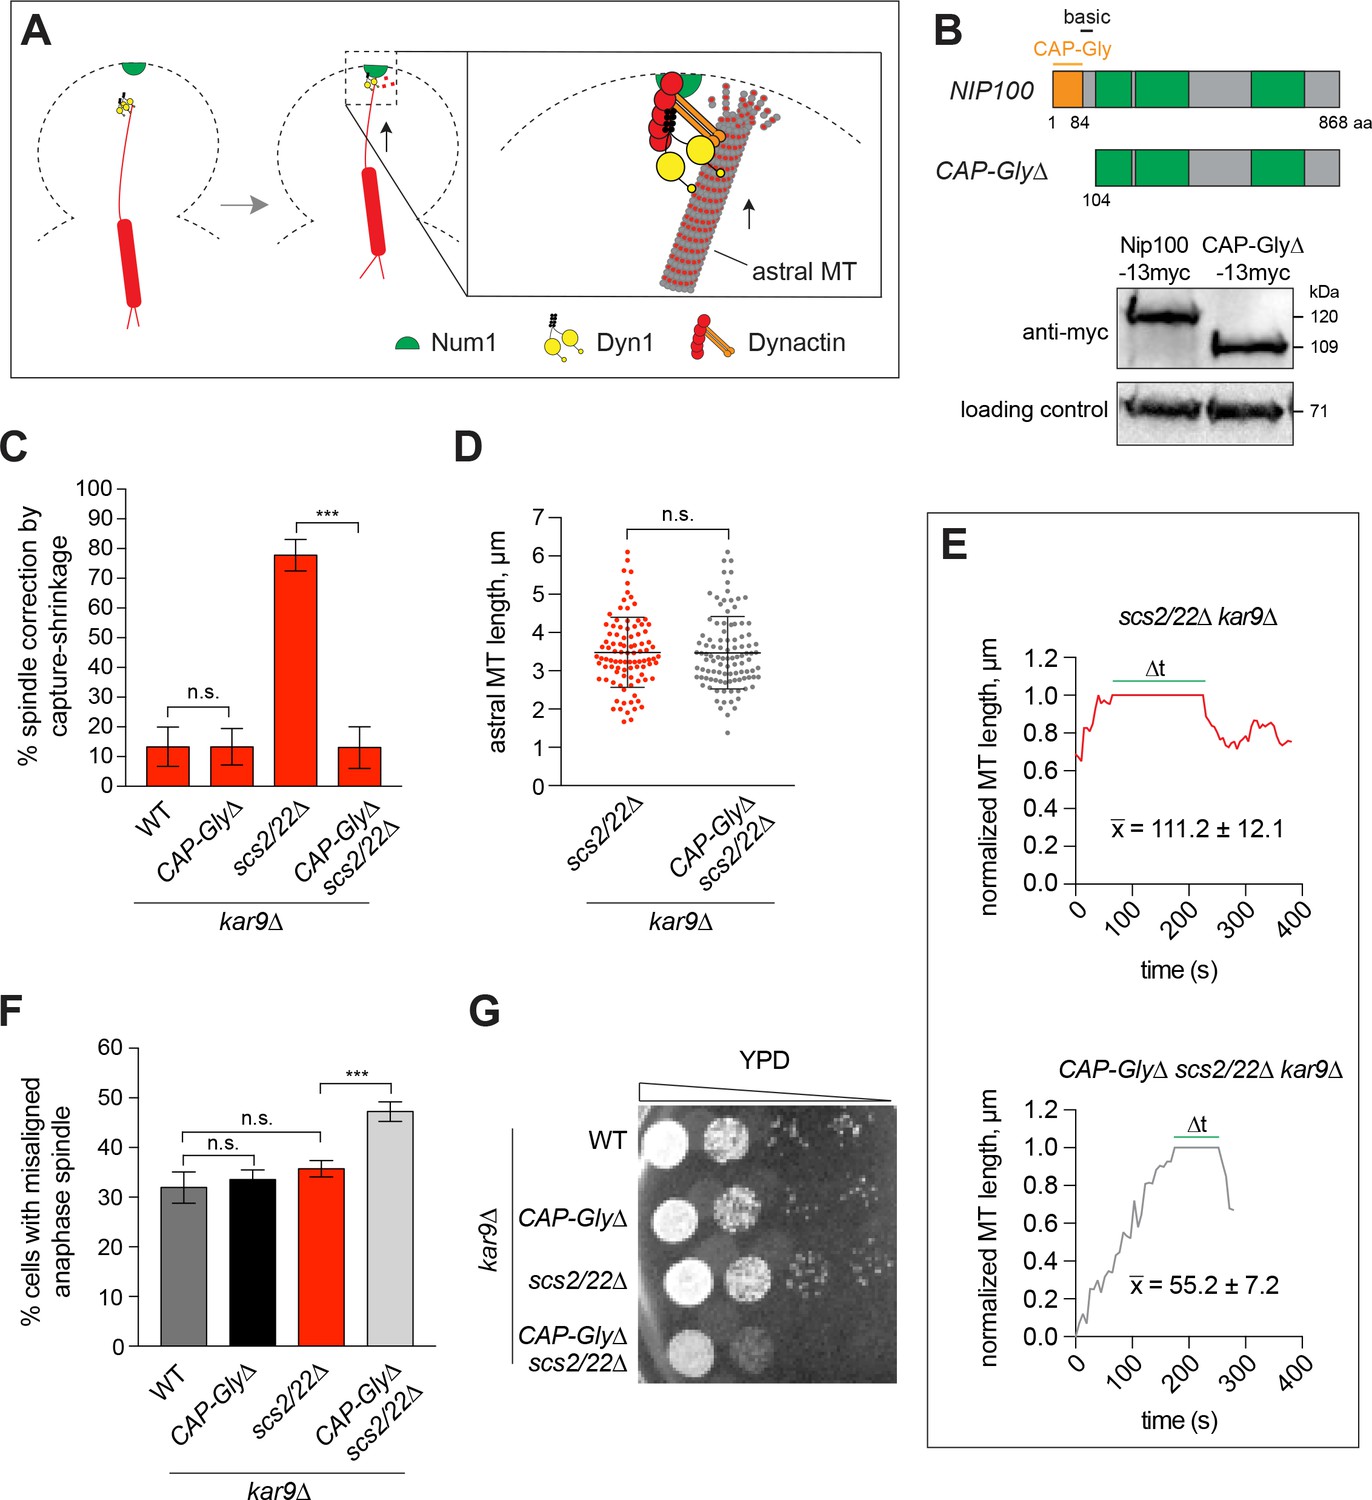
End-on capture-shrinkage of astral MT plus ends at the bud tip requires the CAP-Gly domain of Nip100/p150Glued.
(A) Model showing MT tethering by Nip100/p150Glued during MT capture-shrinkage at the bud tip. (B) Schematic diagram of full-length and truncated Nip100/p150Glued. Western blot showing the expression levels of full-length Nip100-13myc in WT cells and CAP-Gly∆-13myc in scs2/22∆ cells. (C) Spindle correction events that occurred via MT capture-shrinkage at the bud tip for each indicated strain during a 10-min movie (23 ≤ n ≤ 63 events per strain). Percentage was normalized as in Figure 3B. Error bars depict SEP. n.s., not statistically significant; ***p<0.0001 by one-way ANOVA test. (D) Quantification of astral MT length (mean ± SD, n ≥ 95 for each strain). n.s., not statistically significant by unpaired t test. (E) Representative traces showing the position of the MT plus end relative to the bud neck (position = 0) and the bud tip (position = 1) over time. , average duration of contact (∆t) between the plus end and the bud tip (n ≥ 21). (F) Percentage of cells displaying a misaligned anaphase spindle phenotype for each indicated strain (n ≥ 216 cells per strain). Error bars indicate SEP. n.s., not statistically significant; ***p<0.0001 by one-way ANOVA test. (G) CAP-Gly∆ mutation displays synthetic growth defects with scs2/22∆ mutation. Serial dilutions of indicated strains in the kar9∆ background were spotted on rich medium plate and grown for 2 days at 30°C.
Figure 4—figure supplement 1

CAP-Gly domain is required for MT tethering during capture-shrinkage mechanism at the bud tip.
(A) Histogram of the duration of plus end attachment at the bud tip (∆t) in CAP-Gly∆ scs2/22∆ kar9∆ background. , average ∆t (n = 21). (B) Wide-field images of Dyn1-3GFP and mRuby2-Tub1 in scs2/22∆ and CAP-Gly∆ scs2/22∆ cells. (C) Quantification of Dyn1-3GFP fluorescence intensity at the plus end and cortex. Error bars indicate SEM. n.s., not statistically significant by unpaired t test.
Figure 5 with 2 supplements
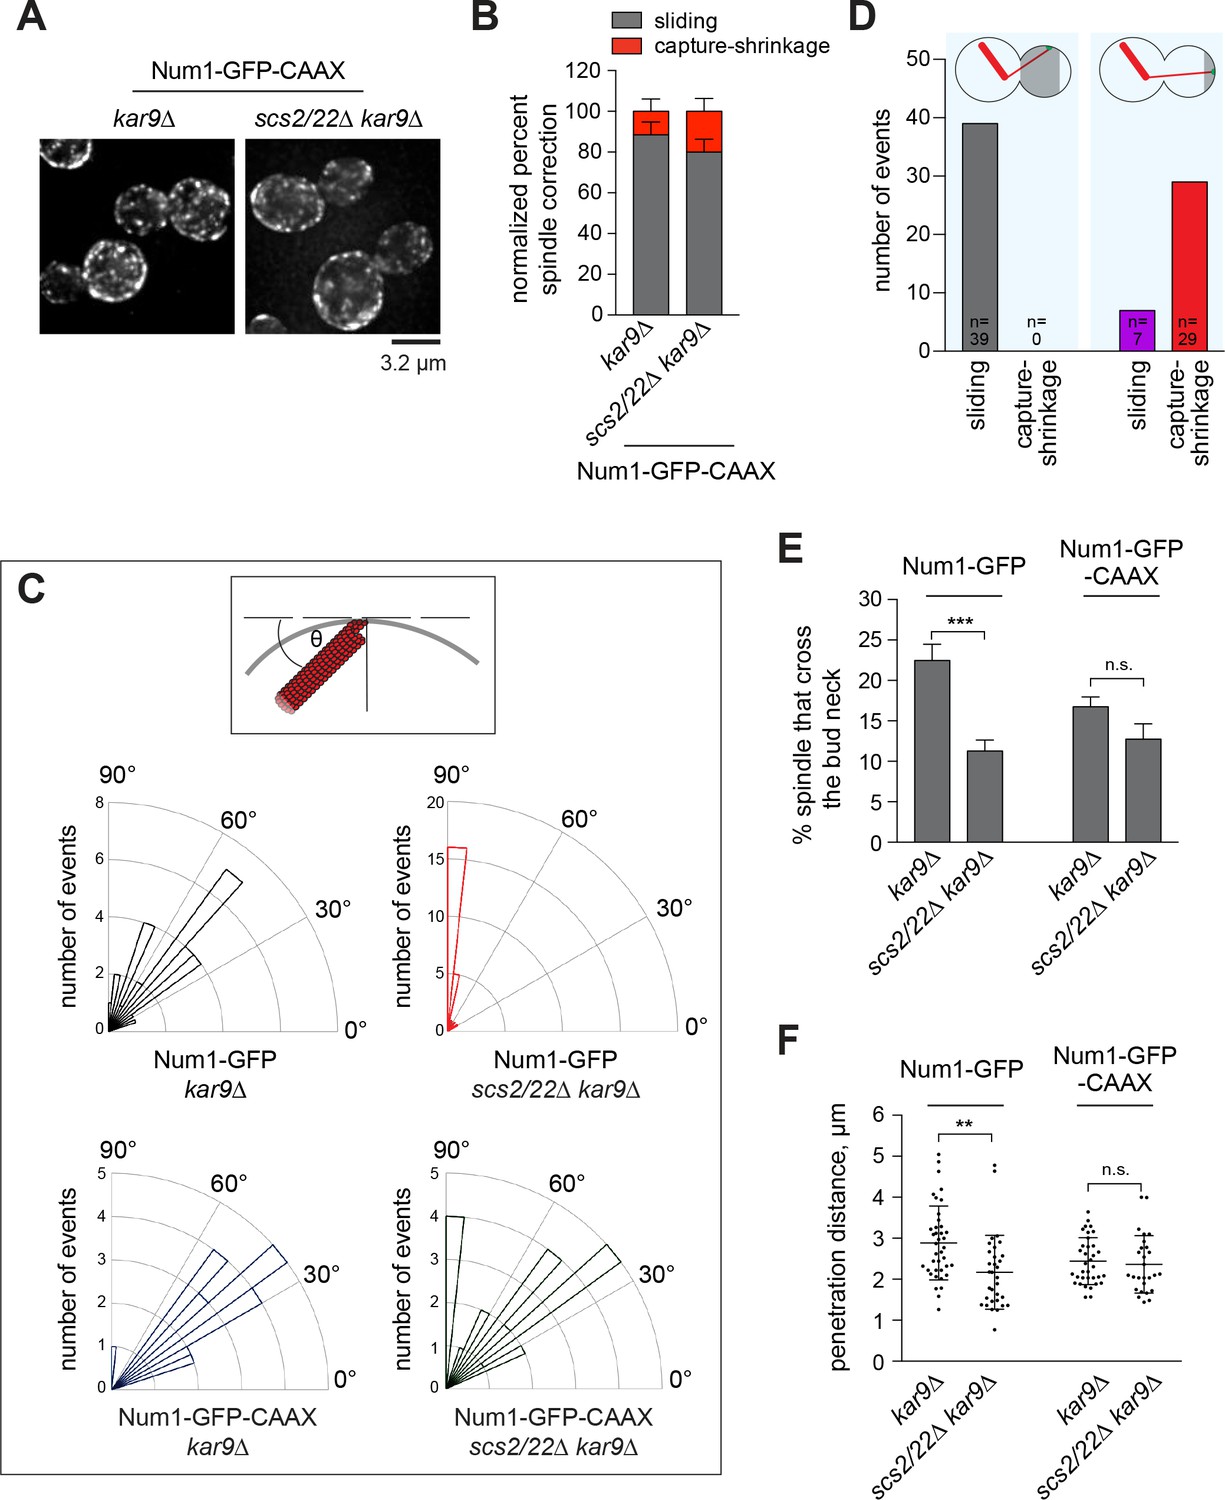
Lateral Num1 patches promote dynein-dependent MT sliding.
(A) Maximum intensity projections of deconvolved wide-field images of kar9∆ and scs2/22∆ kar9∆ cells expressing Num1-GFP-CAAX. (B) Quantification of spindle correction mechanisms (n ≥ 26 cells per strain). Error bars indicate SEP. (C) Top, schematic showing the angle of interaction between the astral MT and the bud cortex. Bottom, rose histograms of the angle of interaction for each indicated strain (n ≥ 26 per strain). (D) Plot depicting the frequency of observing MT sliding or capture-shrinkage for MT-Num1 interaction occurring within the proximal three quarters versus the distal quarter of the bud cortex. (E) Percentage of HU-arrested spindles that crossed the bud neck over the course of a 10 min movie. Error bars indicate SEP (n ≥ 298 per strain). n.s., not statistically significant. ***p<0.0001 by unpaired t test. (F) Penetration distance of HU-arrested spindles. Penetration distance is defined as the farthest distance traveled by the preanaphase spindle moving across the bud neck during a 10 min video. Error bars indicate SD (n ≥ 27). n.s., not statistically significant. **p<0.005 by unpaired t test.
Figure 5—figure supplement 1
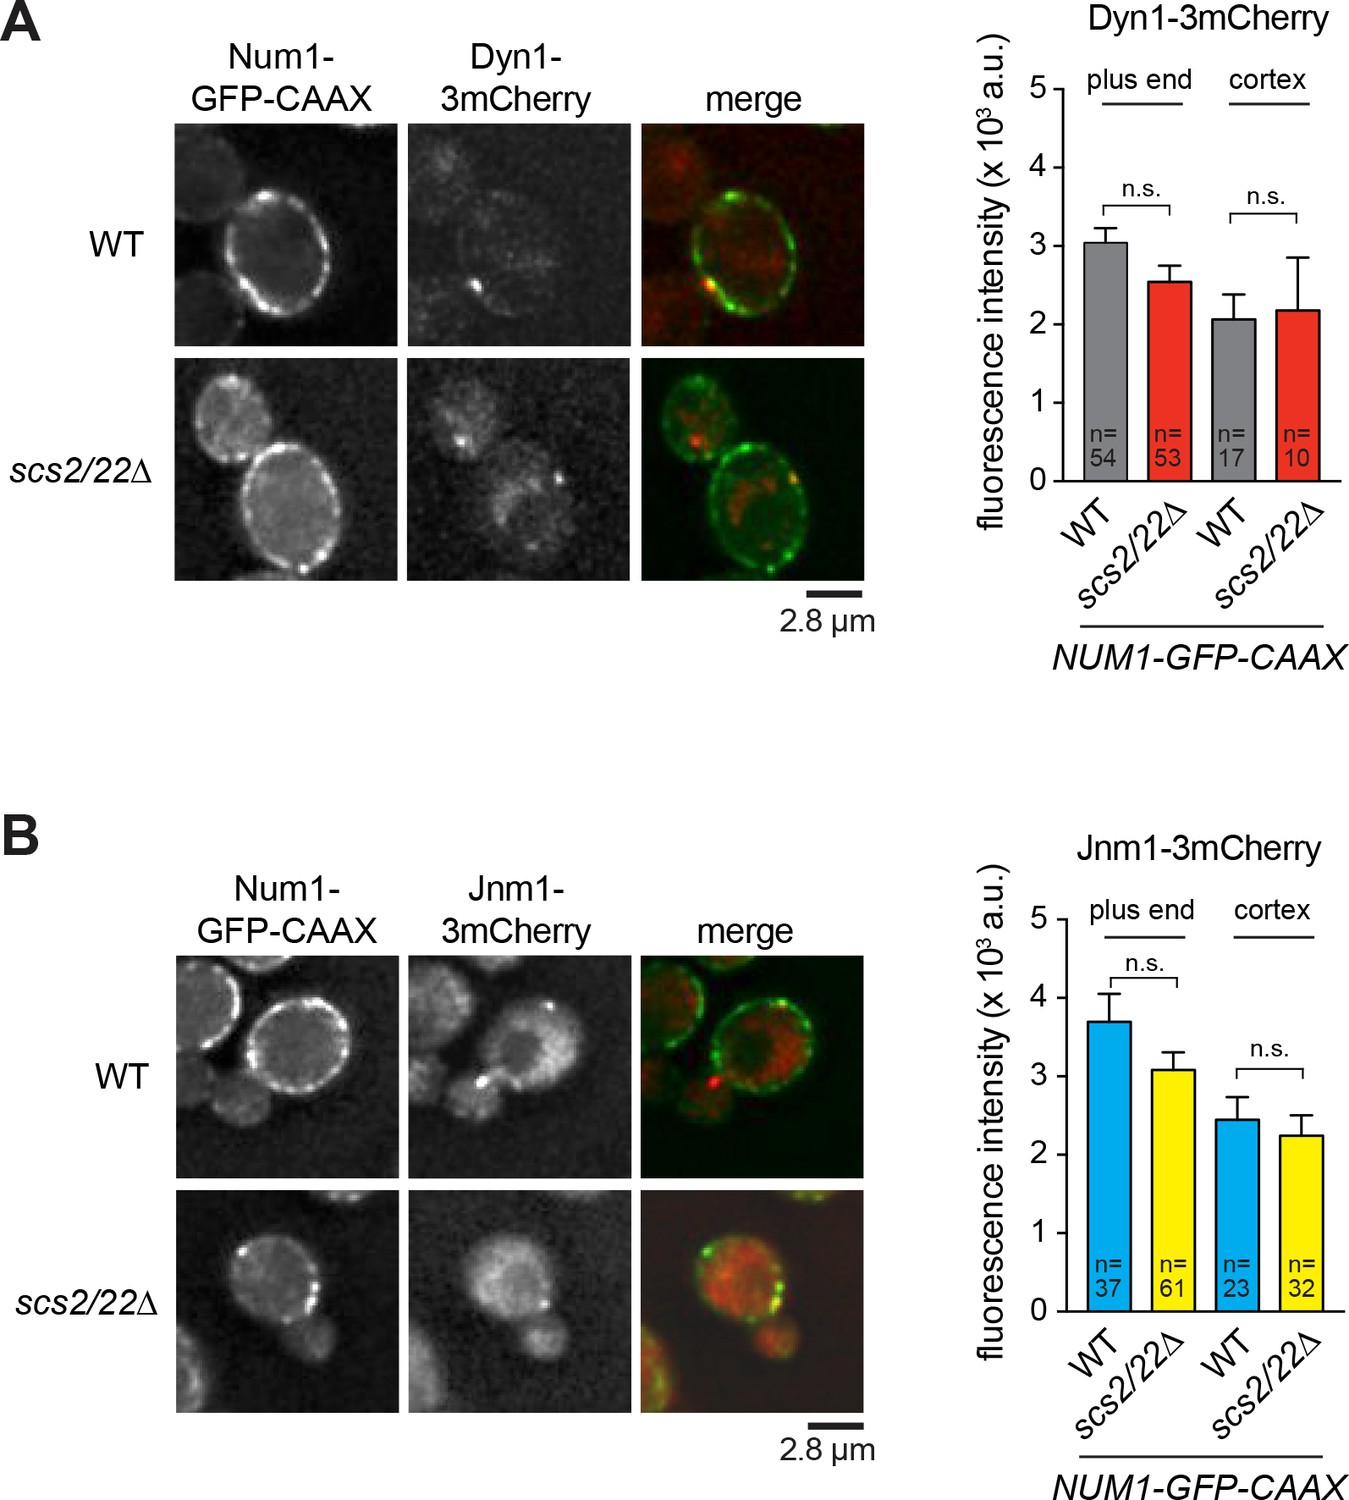
Colocalization of cortical dynein and dynactin foci with Num1-GFP-CAAX patches.
Deconvolved wide-field single focal plane images of NUM1-GFP-CAAX and NUM1-GFP-CAAX scs2/22∆ cells expressing Dyn1-3mCherry (A) or Jnm1-3mCherry (B). Right, fluorescence intensity of individual Dyn1-3mCherry and Jnm1-3mCherry foci. Error bars indicate SEM. n.s., not statistically significant by unpaired t test.
Figure 5—figure supplement 2
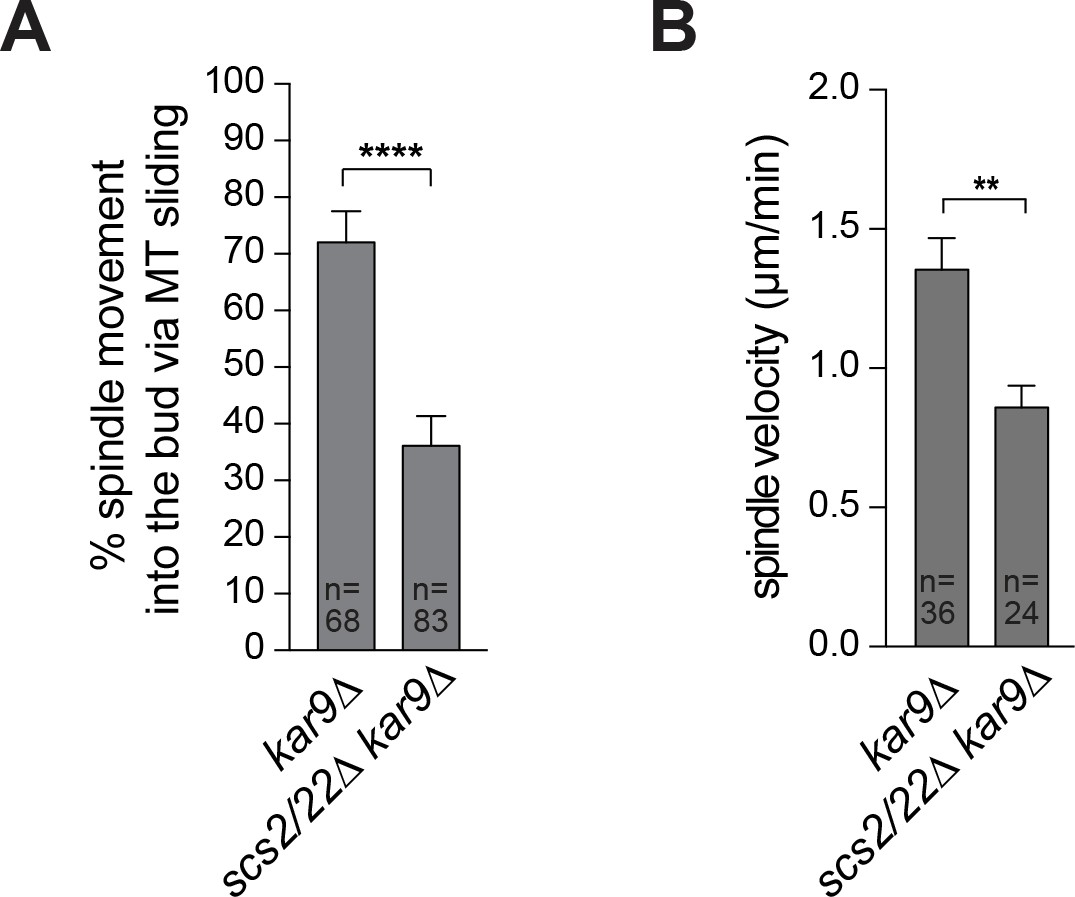
Loss of Scs2/22 results in defective MT sliding along the bud cortex.
(A) Percentage of HU-arrested spindles that crossed the bud neck by MT sliding over the course of a 10 min movie. Error bars indicate SEP. ****p<0.0001 by unpaired t test. (B) Quantification of the velocity of spindle movements in (A). Error bars are SEM. **p<0.005 by unpaired t test.
Figure 6 with 1 supplement
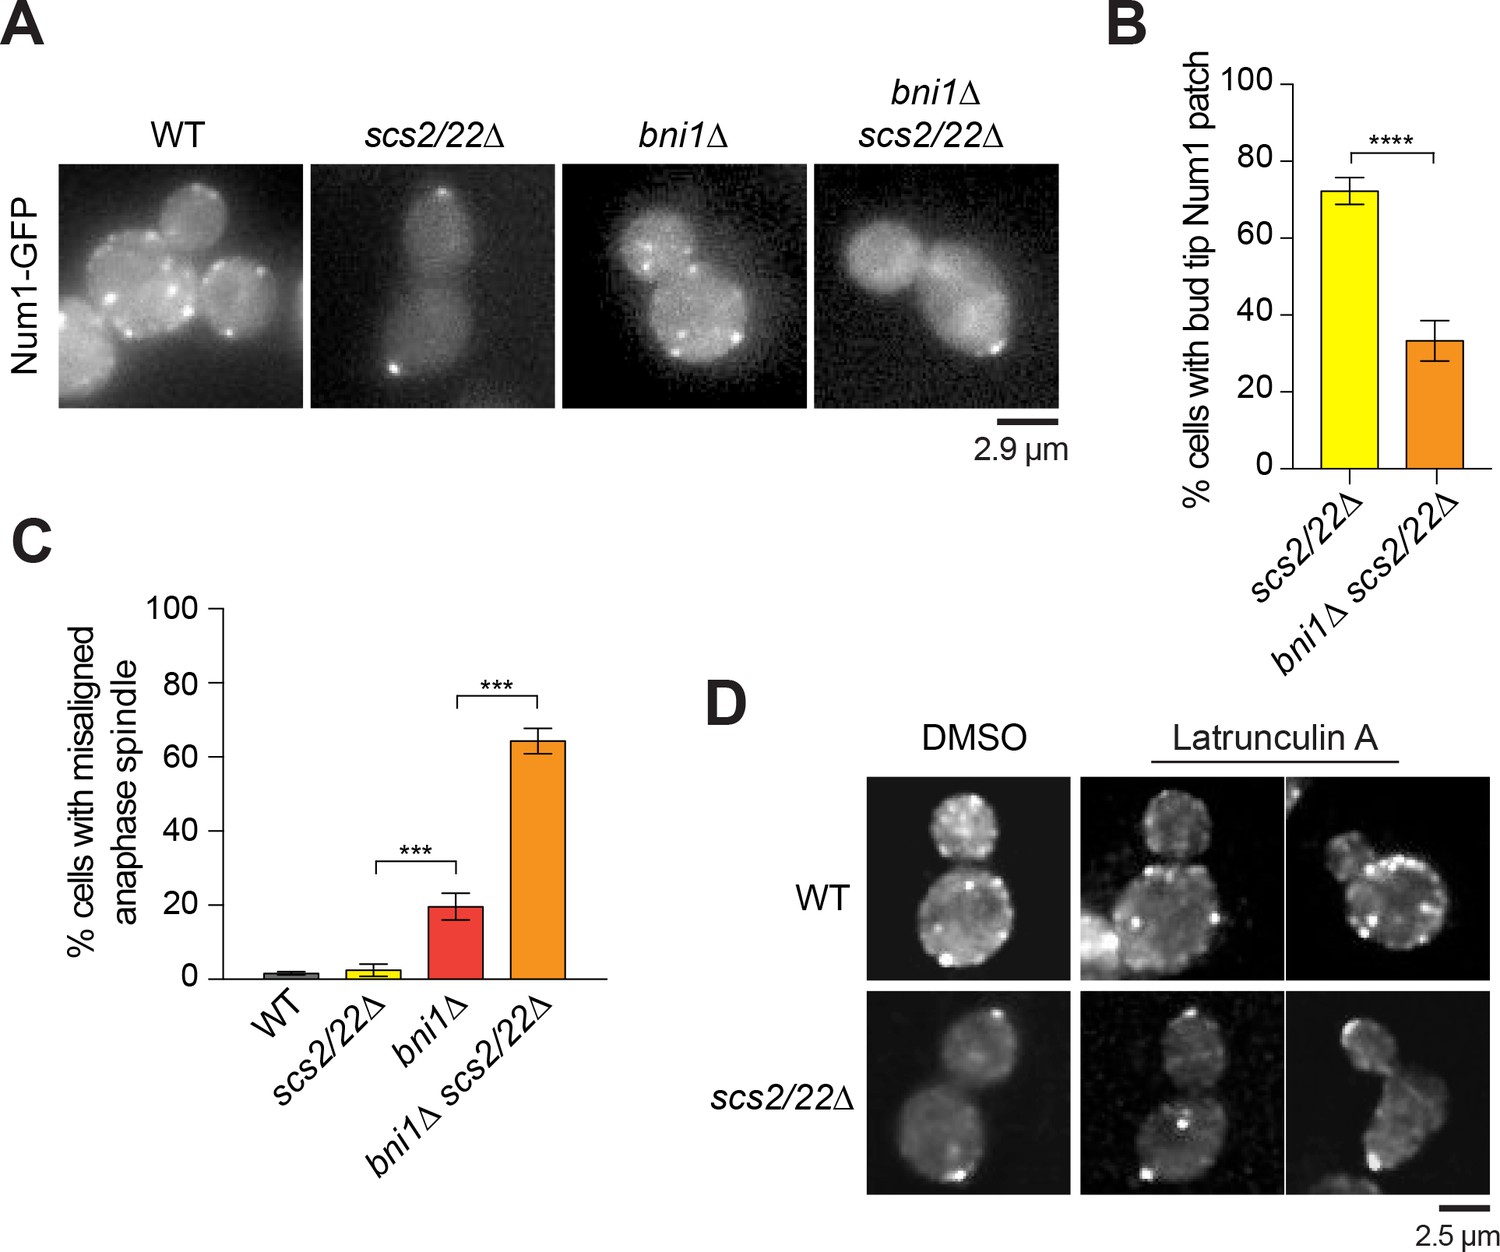
Num1 localization at the bud tip in scs2/22∆ requires Bni1.
(A) Wide-field images of Num1-GFP in WT, scs2/22∆, bni1∆, and bni1∆ scs2/22∆ cells. Each image is a maximum intensity projection of 7 optical sections spaced 0.5 µm apart. (B) Percentage of cells with Num1-GFP patch at the bud tip is decreased in bni1∆ scs2/22∆ mutant relative to scs2/22∆ mutant (n ≥ 81 cells per strain). Error bars indicate SEP. ****p<0.0001 by unpaired t test. (C) Percentage of misaligned anaphase spindle for WT, scs2/22∆, bni1∆, and bni1∆ scs2/22∆ cells (n ≥ 83 per strain). Error bars indicate SEP. ***p<0.0001 by one-way ANOVA test. (D) Num1-GFP localization in WT and scs2/22∆ cells treated with DMSO or 200 µM latrunculin A for 20 min.
Figure 6—figure supplement 1
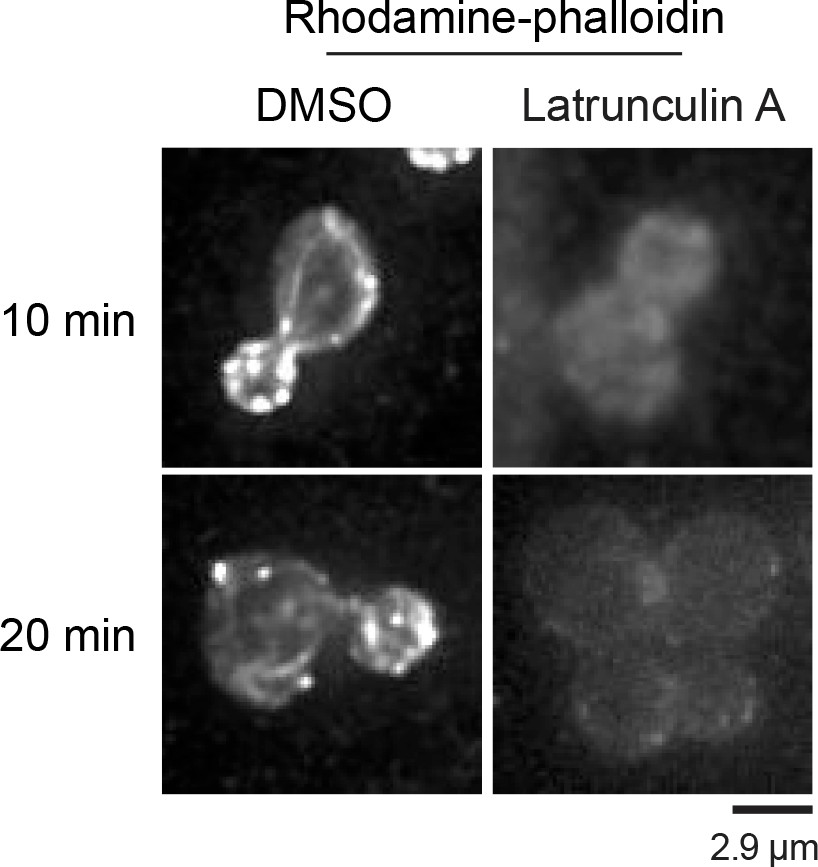
Control experiment showing F-actin disassembly by latrunculin A.
Rhodamine-phalloidin staining of WT cells treated with DMSO or 200 µM latrunculin A for 10 min (top row) and 20 min (bottom row).
Figure 7
Proposed mechanism for Num1 regulation of dynein pulling force along the bud cortex.
(A) Movie frames of representative MT sliding events in kar9∆ background. Top, confocal; bottom, deconvolved wide-field. Each frame is a maximum intensity projection of 7–9 optical sections spaced 0.5 µm apart. Red arrows indicate the transition from side-on to end-on conformation at the MT capture site. (B) Movie frames of MT oversliding phenotype in the bni1∆ kar9∆ background. Each frame is a maximum intensity projection of wide-field images with five optical sections spaced 0.5 µm apart. Yellow arrows indicate the position of the MT plus end. (C) Frequency of observing MT oversliding phenotype during spindle correction in kar9∆ and bni1∆ kar9∆ cells. Error bars indicate SEP. (D) Model showing regulation of dynein pulling mechanism by two spatially distributed populations of Num1. (Step 1) ER-associated Num1 mediates lateral dynein-dependent MT-cortex interaction, pulling the astral MT along the bud cortex toward the bud tip. (Step 2) MT plus end is captured by dynein anchored at the bud tip by Scs2/22-independent Num1, stopping MT sliding. (Step 3) The motor activity of dynein induces MT depolymerization at the bud tip, causing the plastered astral MT to shorten and straighten out. As the MT shrinks, the spindle is moved closer to the bud tip, further aligning the spindle along the mother-bud axis. For clarity, plus end-targeted dynein and cortical ER are omitted from the diagram. See Videos 9–12 and text for further discussion.
Videos
Video 1
Loss of Scs2/22 alters Num1 distribution along the cell cortex.
Full 3D reconstructions of confocal stacks showing Num1-GFP localization in single WT (top row) and scs2/22∆ (bottom row) cells. Each stack consists of 18 optical sections spaced 0.3 µm apart encompassing the entire thickness of the cell.
Video 2
Loss of Scs2/22 alters dynein pulling mechanism during spindle correction.
Num1-GFP (left) and mRuby2-Tub1 (middle) showing lateral MT sliding (kar9∆, top) and end-on MT capture-shrinkage at a Num1 site (scs2/22∆ kar9∆, bottom) as the spindle translocates into the bud neck during spindle correction. Merge image shows MT in red and Num1 in green. Each frame is a maximum intensity projection of 3 optical sections spaced 0.5 µm apart. Movie was captured at 10 s intervals.
Video 3
Astral MT undergoes capture-shrinkage but not sliding at the bud tip in scs2/22∆ kar9∆ cells.
Full 3D time-lapse images displayed in XY and XZ views showing end-on interaction of the astral MT plus end in scs2/22∆ kar9∆ cells. Each frame is a maximum intensity projection of 7 µm (cell 1) or 9 µm (cell 2) optical sections spaced 0.5 µm apart. Movie was captured at 5 or 7 s intervals.
Video 4
Dynein anchorage at the bud tip is required for end-on capture-shrinkage of astral MT.
Top, Dyn1-3GFP persists at the bud tip cortex during shrinkage of a captured astral MT plus end in a scs2/22∆ kar9∆ cell. Bottom, Dyn1-3GFP accumulates at the MT plus end but fails to attach to the bud tip to mediate MT capture-shrinkage in a num1LL scs2/22∆ cell. Each frame is a maximum intensity projection of 3 optical sections spaced 0.5 µm apart. Movie was captured at 10 s intervals.
Video 5
Dynein motor activity but not Kip3 or Kar3 is required for MT capture-shrinkage.
Top, movement and realignment of anaphase spindle into the bud neck upon end-on interaction of the astral MT plus end with the bud tip in a kar3∆ scs2/22∆ kar9∆ or kip3∆ scs2/22∆ kar9∆ cell. Bottom, captured astral MT plus ends fail to undergo shrinkage at the bud tip to mediate spindle realignment in dyn1K2424A scs2/22∆ cells. Each frame is a maximum intensity projection of 3 optical sections spaced 0.5 µm apart. Movie was captured at 10 s intervals.
Video 6
CAP-Gly domain is required for MT tethering during capture-shrinkage of astral MT plus end.
Movie frames of CAP-Gly∆ scs2/22∆ kar9∆ cells expressing mRuby2-Tub1 showing failure to initiate MT capture-shrinkage at the bud tip (cell 1) or failure to maintain stable interaction between the plus end and the bud tip during a MT capture-shrinkage event (cell 2). Each frame is a maximum intensity projection of 3 optical sections spaced 0.5 µm apart. Movie was captured at 10 s intervals.
Video 7
Lateral Num1 patches restore astral MT sliding in scs2/22∆ kar9∆ cells.
Time-lapse images of mRuby2-Tub1 in kar9∆ and scs2/22∆ kar9∆ cells expressing Num1-GFP-CAAX showing astral MT sliding along the bud cortex as the anaphase spindle translocated into the bud neck during its realignment. Each frame is a maximum intensity projection of 3 optical sections spaced 0.5 µm apart. Movie was captured at 10 s intervals for 6 min.
Video 8
Bni1 is required for Num1 localization at the bud tip in scs2/22∆ cells.
Time-lapse images of Num1-GFP and mRuby2-Tub1 in the bni1∆ scs2/22∆ background. Each frame is a maximum intensity projection of 5 optical sections spaced 0.5 µm apart. Movie was captured at 10 s intervals.
Video 9
Astral MT stops sliding upon reaching the bud tip.
Time-lapse images of mRuby2-Tub1 in kar9∆ background showing examples of MT sliding events being terminated at the bud tip. Each frame is a maximum intensity projection of 7 optical sections spaced 0.5 µm apart. Movie was captured at 5 s intervals.
Video 10
Astral MT stops sliding when the plus end encounters a Num1 cluster at the bud tip.
Time-lapse images of Num1-GFP and mRuby2-Tub1 in kar9∆ showing an example of MT sliding being halted when the plus end of the sliding MT reaches a Num1 cluster at the bud tip. Arrow indicates the position of the Num1 cluster (visible in the initial frames before photobleaching) where stoppage of MT sliding occurs. Each frame is a maximum intensity projection of deconvolved wide-field images with five optical sections spaced 0.5 µm apart. Movie was captured at 15 s intervals. Note that mRuby2 fluorescence (mRuby2-Tub1) appears to crossover slightly into the GFP channel (Num1-GFP).
Video 11
A second example of MT sliding stoppage occurring when the plus end encounters a Num1 patch at the bud tip.
Time-lapse images of Num1-GFP and mRuby2-Tub1 in kar9∆ ist2∆ background showing a clear example of MT sliding being halted when the plus end of the sliding MT reaches a Num1 patch at the bud tip. KAR9 and IST2 deletions did not affect Num1 localization in WT cells (data not shown). Each frame is a maximum intensity projection of 3 optical sections spaced 0.5 µm apart. Movie was captured at 10 s intervals.
Video 12
Astral MT slides past the bud tip instead of stopping upon reaching the bud tip in bni1∆ kar9∆ cells.
Time-lapse images of mRuby2-Tub1 showing three examples of MT oversliding phenotype at the bud tip in the bni1∆ kar9∆ background. Each frame is a maximum intensity projection of 5 optical sections spaced 0.5 µm apart. Movie was captured at 10 s intervals.
Tables
Table 1
Viability of scs2/22∆ mutant in combination with kar9∆, dyn1∆, or cin8∆ mutant.
https://doi.org/10.7554/eLife.36745.012| Mutant combination | Number of tetrads analyzed | Number of predicted double or triple mutants | Viability of mutants | |
|---|---|---|---|---|
| Viable | Microcolony | |||
| scs2/22∆ | 22 | 16 | 16 | 0 |
| scs2/22∆ kar9∆ | 13 | 5 | 5 | 0 |
| scs2/22∆ dyn1∆ | 22 | 9 | 9 | 0 |
| scs2/22∆ cin8∆ | 29 | 17 | 17 | 0 |
| dyn1∆ cin8∆ | 10 | 7 | 0 | 7 |
-
For scs2/22∆ and scs2/22∆ dyn1∆ combinations, YWL4865 was crossed with YWL521. For scs2/22∆ kar9∆ combination, YWL4865 was crossed with YWL4949. For scs2/22∆ cin8∆ and dyn1∆ cin8∆ combinations, YWL3955 was crossed with YWL4866 and YWL504, respectively. The resulting diploid strains were sporulated and tetrads were dissected.
Table 2
Parameters of MT dynamics for free astral MTs (i.e. unattached to cortex) in kar9∆ and scs2/22∆ kar9∆ mutants.
https://doi.org/10.7554/eLife.36745.026| kar9∆ | scs2/22∆ kar9∆ | |
|---|---|---|
| Growth rate (µm/min) | 1.38 ± 0.12 (n = 70) | 1.07 ± 0.07 (n = 61) |
| Shrinkage rate (µm/min) | 1.63 ± 0.12 (n = 59) | 1.70 ± 0.14 (n = 67) |
| Catastrophe frequency (event/min) | 0.56 ± 0.07 (n = 19) | 0.42 ± 0.09 (n = 17) |
| Rescue frequency (event/min) | 0.59 ± 0.08 (n = 18) | 0.40 ± 0.06 (n = 16) |
Key resources table
| Reagent type (species) or resource | Designation | Source or reference | Identifiers | Additional information |
|---|---|---|---|---|
| Antibody | anti-c-Myc (mouse monoclonal) | BioLegend | BioLegend:626802; RRID:AB_2148451 | (1:250 or 500 or 1000) |
| Antibody | Rabbit IgG | GenScript | GenScript:A01008; RRID:AB_2732863 | (1:5000) |
| Antibody | HRP goat anti-mouse IgG | BioLegend | BioLegend:405306; RRID:AB_315009 | (1:10000) |
| Antibody | HRP goat anti-rabbit IgG | Jackson Immuno Research Labs | Jackson ImmunoResearch Labs: 111-035-144; RRID:AB_2307391 | (1:10000) |
| Antibody | anti-Sac1 (rabbit polyclonal) | Charles Barlowe Lab | NA | (1:2000) |
| Gene (Saccharomyces cerevisiae) | NUM1 | NA | SGD:S000002557 | Systematic name: YDR150W |
| Gene (S. cerevisiae) | SCS2 | NA | SGD:S000000922 | Systematic name: YER120W |
| Gene (S. cerevisiae) | SCS22 | NA | SGD:S000007228 | Systematic name: YBL091C-A |
| Gene (S. cerevisiae) | DYN1 | NA | SGD:S000001762 | Systematic name: YKR054C |
| Gene (S. cerevisiae) | NIP100 | NA | SGD:S000006095 | Systematic name: YPL174C |
| Gene (S. cerevisiae) | JNM1 | NA | SGD:S000004908 | Systematic name: YMR294W |
| Gene (S. cerevisiae) | ARP1 | NA | SGD:S000001171 | Systematic name: YHR129C |
| Gene (S. cerevisiae) | KAR9 | NA | SGD:S000006190 | Systematic name: YPL269W |
| Gene (S. cerevisiae) | BNI1 | NA | SGD:S000005215 | Systematic name: YNL271C |
| Gene (S. cerevisiae) | MMR1 | NA | SGD:S000004180 | Systematic name: YLR190W |
| Gene (S. cerevisiae) | GEM1 | NA | SGD:S000000046 | Systematic name: YAL048C |
| Gene (S. cerevisiae) | PAC1 | NA | SGD:S000005795 | Systematic name: YOR269W |
| Gene (S. cerevisiae) | CIN8 | NA | SGD:S000000787 | Systematic name: YEL061C |
| Gene (S. cerevisiae) | KIP3 | NA | SGD:S000003184 | Systematic name: YGL216W |
| Gene (S. cerevisiae) | KAR3 | NA | SGD:S000006345 | Systematic name: YPR141C |
| Chemical compound, drug | Hydroxyurea | Thermo Fisher Scientific | Thermo Fisher Scientific: AC151680250 | (200 mM) |
| Chemical compound, drug | Latrunculin A | Millipore Sigma | Millipore Sigma:L5163 | (200 µM) |
| Chemical compound, drug | Hygromycin B | Gold Biotechnology | Gold Biotechnology: H-270–5 | (400 µg/ml) |
| Chemical compound, drug | G-418 sulfate | Gold Biotechnology | Gold Biotechnology: G-418–10 | (400 µg/ml) |
| Software, algorithm | NIS-Elements | Nikon | RRID:SCR_014329 | |
| Software, algorithm | ImageJ | NIH | RRID:SCR_003070 | |
| Software, algorithm | Prism 7 | GraphPad | RRID:SCR_002798 | |
| Software, algorithm | Illustrator | Adobe | RRID:SCR_010279 | |
| Software, algorithm | MATLAB | MathWorks | RRID:SCR_001622 | |
| Other | Rhodamine-phalloidin | Cytoskeleton | Cytoskeleton:PHDR1 | (1.4 µM) |
| Other | Protease inhibitor cocktail tablet | Millipore Sigma | Millipore Sigma:5892970001 | (1 tablet per 7 ml) |
Additional files
-
Supplementary file 1
Yeast strains used in this study.
- https://doi.org/10.7554/eLife.36745.035
-
Transparent reporting form
- https://doi.org/10.7554/eLife.36745.036
Download links
A two-part list of links to download the article, or parts of the article, in various formats.
Downloads (link to download the article as PDF)
Open citations (links to open the citations from this article in various online reference manager services)
Cite this article (links to download the citations from this article in formats compatible with various reference manager tools)
Cortical dynein pulling mechanism is regulated by differentially targeted attachment molecule Num1
eLife 7:e36745.
https://doi.org/10.7554/eLife.36745


