Downregulation of ribosome biogenesis during early forebrain development
- Boston Children’s Hospital, United States
- Harvard Medical School, United States
Figures
Figure 1 with 1 supplement
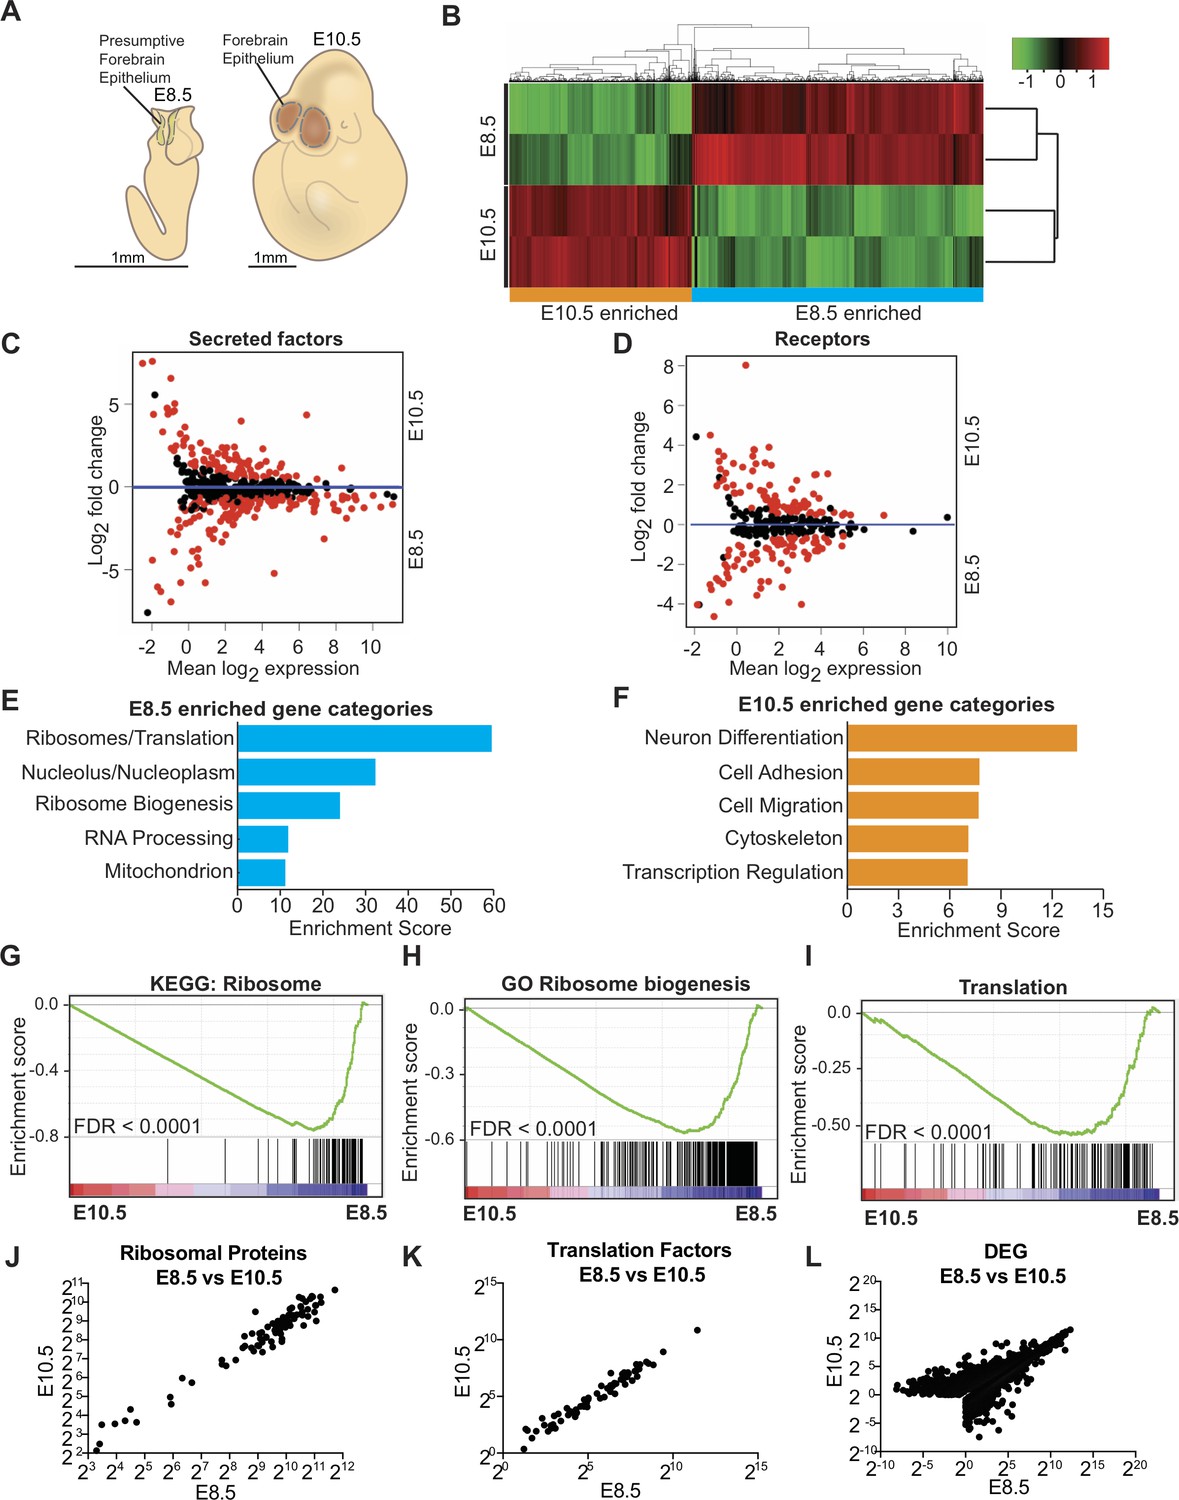
Transcriptome analysis of microdissected forebrain epithelium reveals downregulation of genes encoding protein biosynthetic machinery.
(A) Schematic of E8.5 embryo with open forebrain neural tube (left) and E10.5 embryo (right). Shaded regions encircled by dotted line denote developing forebrain epithelium microdissected for RNAseq. (B) Heatmap and hierarchical clustering of ~3900 differentially expressed genes (q < 0.05): 2375 genes were enriched in E8.5 and 1523 genes were enriched in E10.5. Each biological replicate contained tissue pooled from one litter of embryos. Red and green indicate relatively higher and lower expression, with gene FPKM values log2 transformed, centered and scaled by rows for display purposes. (C, D) MA plot displaying genes encoding secreted factors (C), and receptors (D). Each dot represents a single gene. Red dots denote differentially expressed genes as identified by Cuffdiff (q < 0.05). Genes below blue line (y = 0) are enriched in E8.5. (E) Functional annotation clustering of E8.5 neuroepithelium enriched genes revealed overrepresentation of genes encoding ribosomal proteins, ribosome biogenesis and translation factors. The top five enriched functional clusters are shown. (F) Functional annotation clustering of E10.5 neuroepithelium enriched genes shows overrepresentation of genes needed for neuron differentiation. The top five enriched functional clusters are shown. (G–I) GSEA of E8.5 versus E10.5 neuroepithelium for gene sets involved in ribosome biogenesis and translation. Broad Institute Molecular Signatures Database Identifiers: KEGG_RIBOSOME (G), GO_RIBOSOME_BIOGENESIS (H), and TRANSLATION (I). Each line represents a single gene in the gene set. Genes on the right side are enriched in E8.5. (J–L) Correlation plots of average expression (log2 transformed FPKM) at E8.5 and E10.5 for ribosomal proteins (J), translation factors (K), and all differentially expressed genes (L). In all cases correlation was significant; ribosomal proteins (J), Spearman R = 0.91, p<0.0001; translation factors (K) Spearman R = 0.98, p<0.0001; and DEG (L), Spearman R = 0.82, p<0.0001.
Figure 1—figure supplement 1
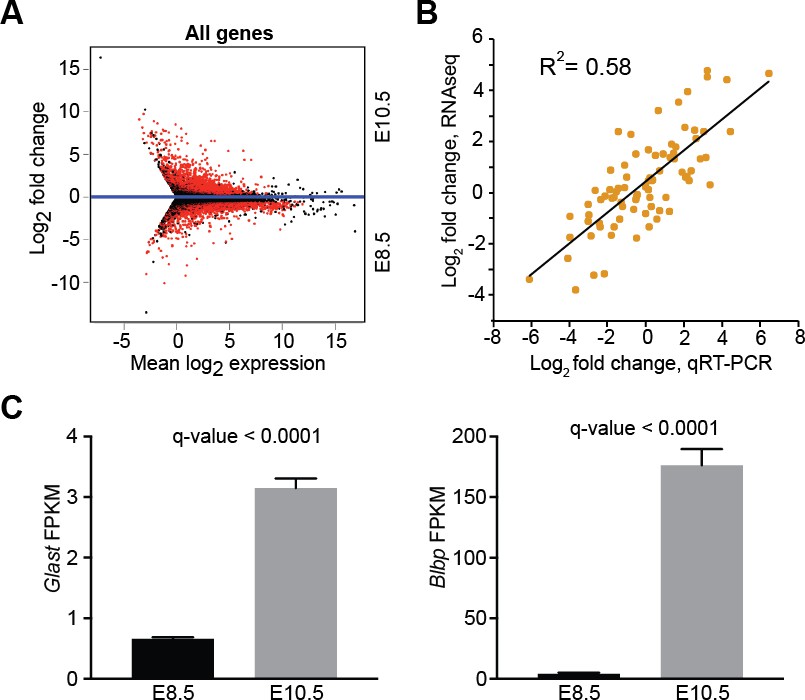
Differential gene expression between E8.5 and E10.5 neuroepithelium.
(A) MA plot displaying all expressed genes (FPKM >1) in E8.5 and E10.5 neuroepithelium. Red dots denote differentially expressed genes identified by Cuffdiff. Genes below blue line (y = 0) are enriched in E8.5. (B) Quantitative RT-PCR (qRT-PCR) validation of 75 genes showed positive correlation (R2 = 0.58) with RNAseq data. (C) RNAseq showed upregulation of glial markers, Glast (left) and Blbp (right), in E10.5 neuroepithelium; y-axis shows FPKM values.
Figure 2
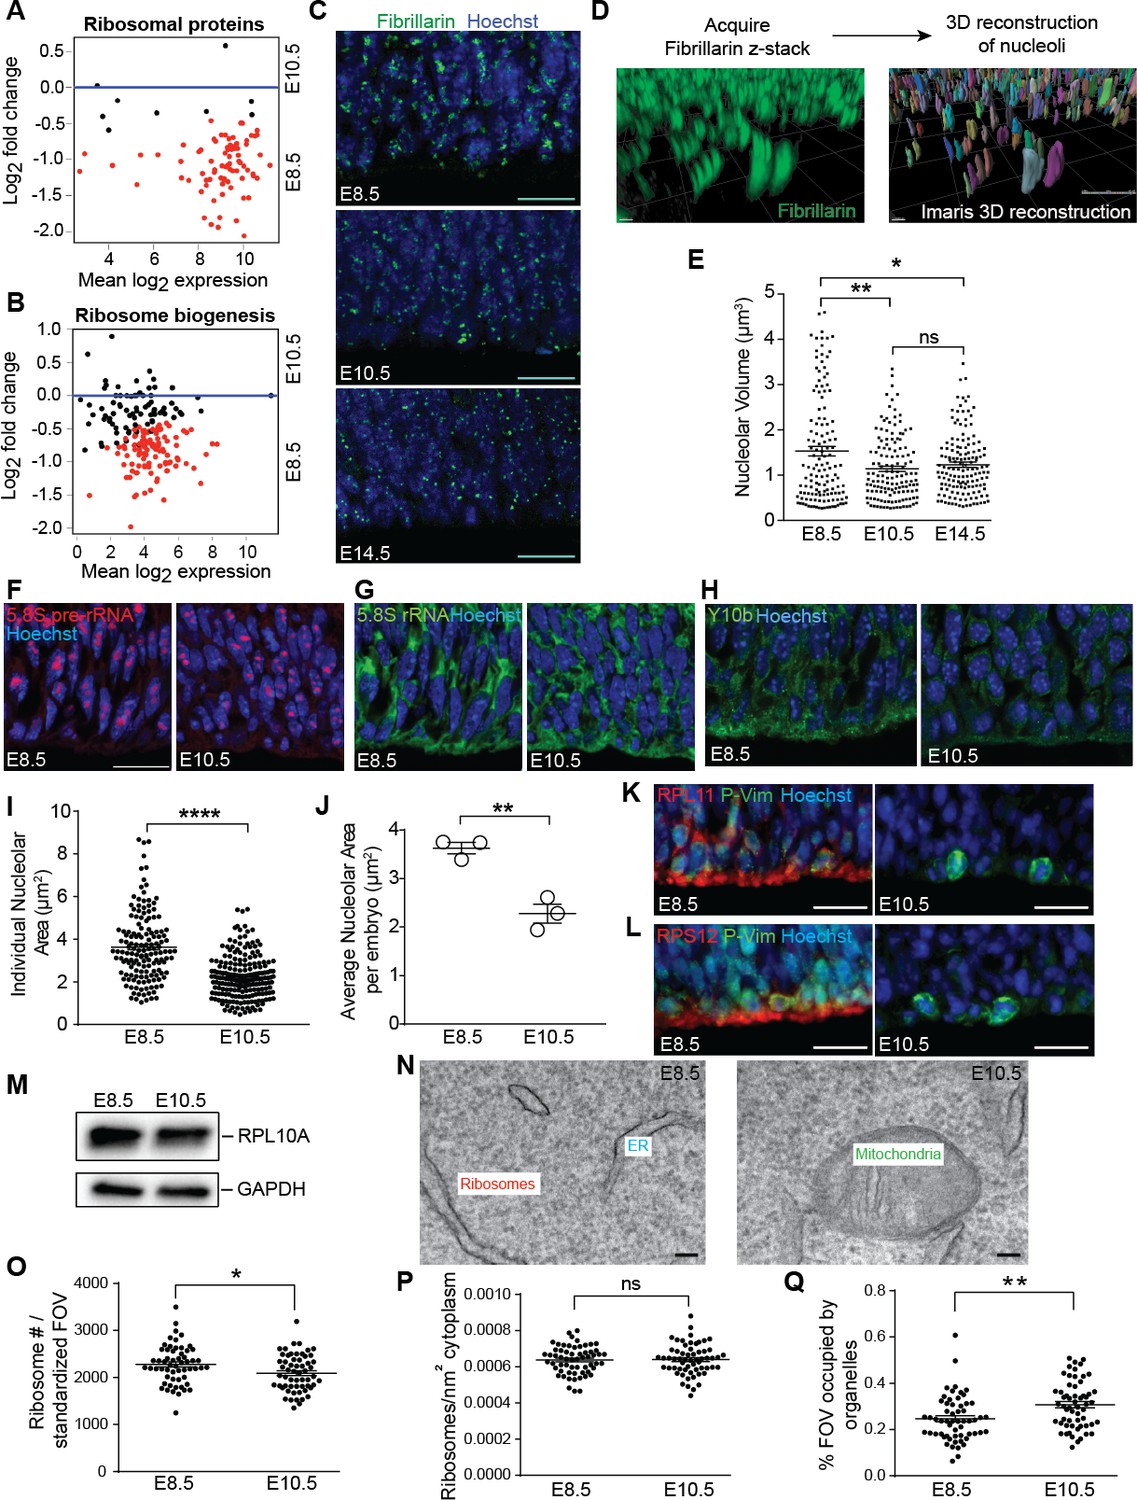
Ribosome biogenesis decreases from E8.5 to E10.5.
(A, B) MA plot displaying genes encoding ribosomal proteins (A), ribosome biogenesis factors (B). Each dot represents a single gene. Red dots denote differentially expressed genes as identified by Cuffdiff (q < 0.05). Genes below blue line (y = 0) are enriched in E8.5. (C) Immunohistochemistry of the nucleolar protein Fibrillarin (green) in E8.5, E10.5 and E14.5 neuroepithelium. Scale bar = 20 μm. (D) Example of z-stack image of Fibrillarin staining (left) and 3D reconstruction of nucleoli using Imaris (right). (E) Quantification of nucleolar volume using Imaris. Each data point represents one nucleolus. *p≤0.05, **p≤0.01, Welch’s ANOVA with Games-Howell post-hoc test. Sample size, E8.5: n = 135 from three embryos; E10.5: n = 139 from three embryos; E14.5: n = 146 from three embryos. (F, G) Representative images of fluorescent in situ hybridization of 5.8S pre-rRNA (F, red) and 5.8S total rRNA (G, green). (H) Y10b immunostaining shows higher levels of 5.8S rRNA in E8.5 than E10.5 neuroepithelium. Scale bar = 20 μm. (I) Quantification of 5.8S pre-rRNA signal shows larger nucleolar area in E8.5 compared to E10.5 neuroepithelium. Each data point represents one nucleolus. ****p≤0.0001, Welch’s t-test. Sample size, E8.5: n = 150 from three embryos; E10.5: n = 202 from three embryos. (J) Average nucleolar area in E8.5 vs. E10.5 embryo. **p≤0.01, unpaired t-test, n = 3 embryos. (K, L) RPL11 (K, red) and RPS12 (L, red) were more highly expressed along the apical surface of E8.5 than E10.5 neuroepithelium. Phospho-Vimentin (P-Vim, green) labels dividing progenitors. Scale bar = 20 μm. (M) Immuoblotting shows similar expression of RPL10A between E8.5 and E10.5. (N) Representative images of TEM in neuroepithelial cells at E8.5 and R10.5. (O–Q) Quantification of TEM ribosomal number per standardized field of view (FOV), 78,736 nm2, (O), ribosomal density in cytoplasm (P), and percent of the standard FOV occupied by membrane-bound organelles (Q). *p≤0.05, **p≤0.01, Unpaired t-test.
Figure 3
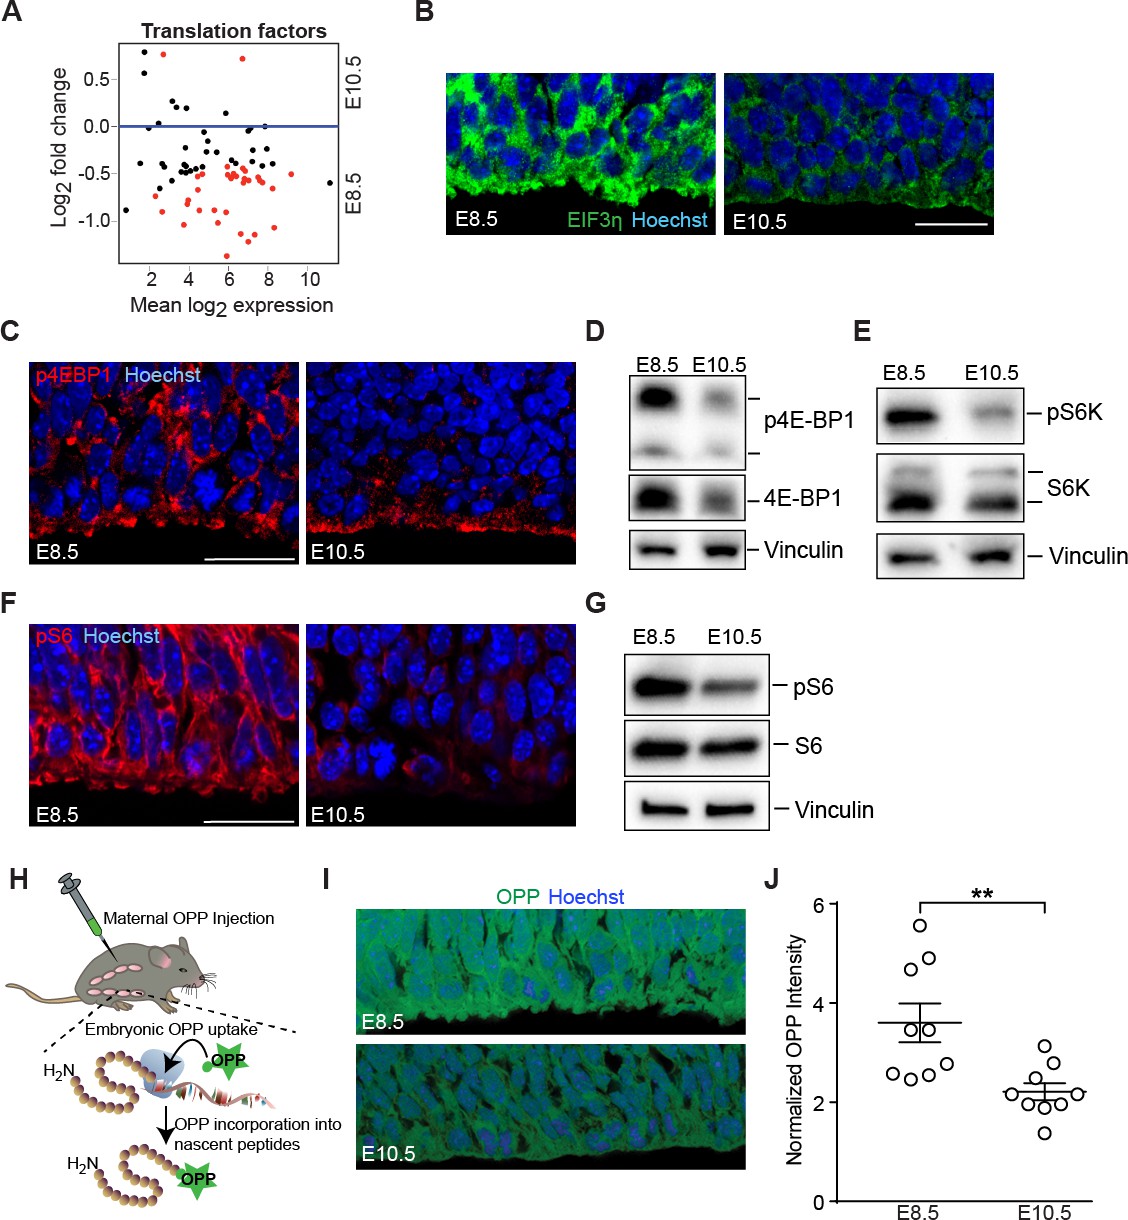
Downregulation of mTOR signaling pathway and decreased protein synthesis in E10.5 forebrain progenitors.
(A) MA plot displaying genes encoding translation factors. Each dot represents a single gene. Red dots denote differentially expressed genes as identified by Cuffdiff (q<0.05). Genes below blue line (y = 0) are enriched in E8.5. (B) Immunostaining of developing forebrain progenitors shows higher expression of the translation initiation factor EIF3η (green) in E8.5 versus E10.5 neuroepithelium. Scale bar = 20 μm. (C) Immunostaining of developing forebrain neuroepithelium shows decreased phosphorylation of 4E-BP1 (red) in E10.5 neuroepithelium. Scale bar 20 μm. (D) Immunoblotting shows decreased expression and phosphorylation of 4E-BP1 at E10.5. (E) Immunoblotting shows decreased phosphorylation of S6K at E10.5. (F) Immunostaining of developing forebrain neuroepithelium shows decreased phosphorylation of ribosomal protein S6 (red) in E10.5 neuroepithelium. Scale bar 20 μm. (G) Immunoblotting shows decreased phosphorylation of ribosomal protein S6 at E10.5. (H) Schematic of OPP injection into pregnant dams and incorporation into translating polypeptides in the embryos. (I) OPP incorporation assay in E8.5 and E10.5 developing forebrain neuroepithelium. (J) Quantification of OPP fluorescence intensity using Image J shows decreased rate of protein synthesis at E10.5. **p≤0.01 Welch’s t-test. For each age, n = 9 embryos from three litters.
Figure 4
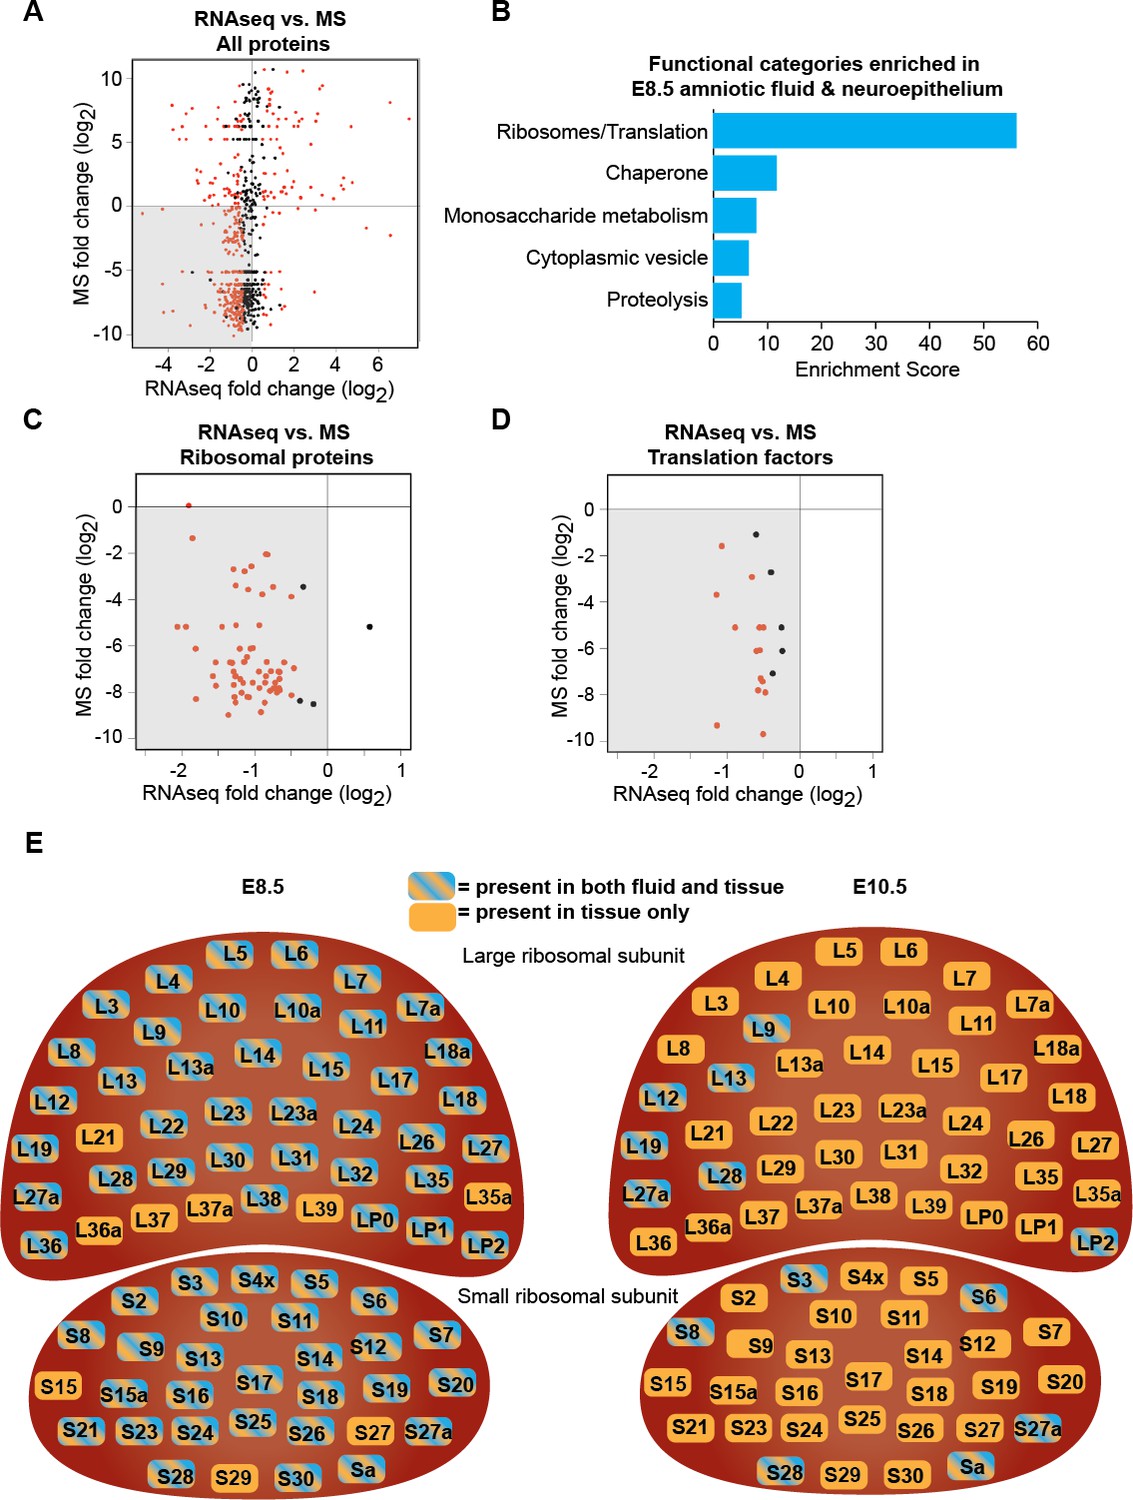
Downregulation of protein biosynthetic machinery during early forebrain development matches the AF and CSF proteomes.
(A) Plot showing all proteins/genes that are detected in both AF/CSF and the neighboring neuroepithelium. Each dot represents a single protein/gene. Red dots denote differentially expressed genes between E8.5 and E10.5 epithelium (q<0.05). Genes left of x = 0 were enriched in E8.5 epithelium whereas proteins below y = 0 were enriched in E8.5 AF. Therefore, genes/proteins in lower left quadrant (shaded) were enriched in both E8.5 epithelium and AF. MS = mass spectrometry. (B) Functional annotation clustering of genes/proteins enriched in both E8.5 epithelium and AF (genes/proteins in shaded quadrant in (A)) shows that ribosomes/translation is the most overrepresented category. (C, D) Comparison of AF/CSF proteomes with neuroepithelium transcriptome showed that most ribosomal proteins and translation factors enriched in E8.5 AF were enriched in age-matched epithelium (shaded quadrants). (E) Schematics depicting the specific ribosomal protein subunits that were detected in E8.5 AF (left) and E10.5 CSF (right). Subunits with blue and orange were detected in both fluid and tissue, whereas those in orange were only detected in tissue.
Figure 5 with 1 supplement
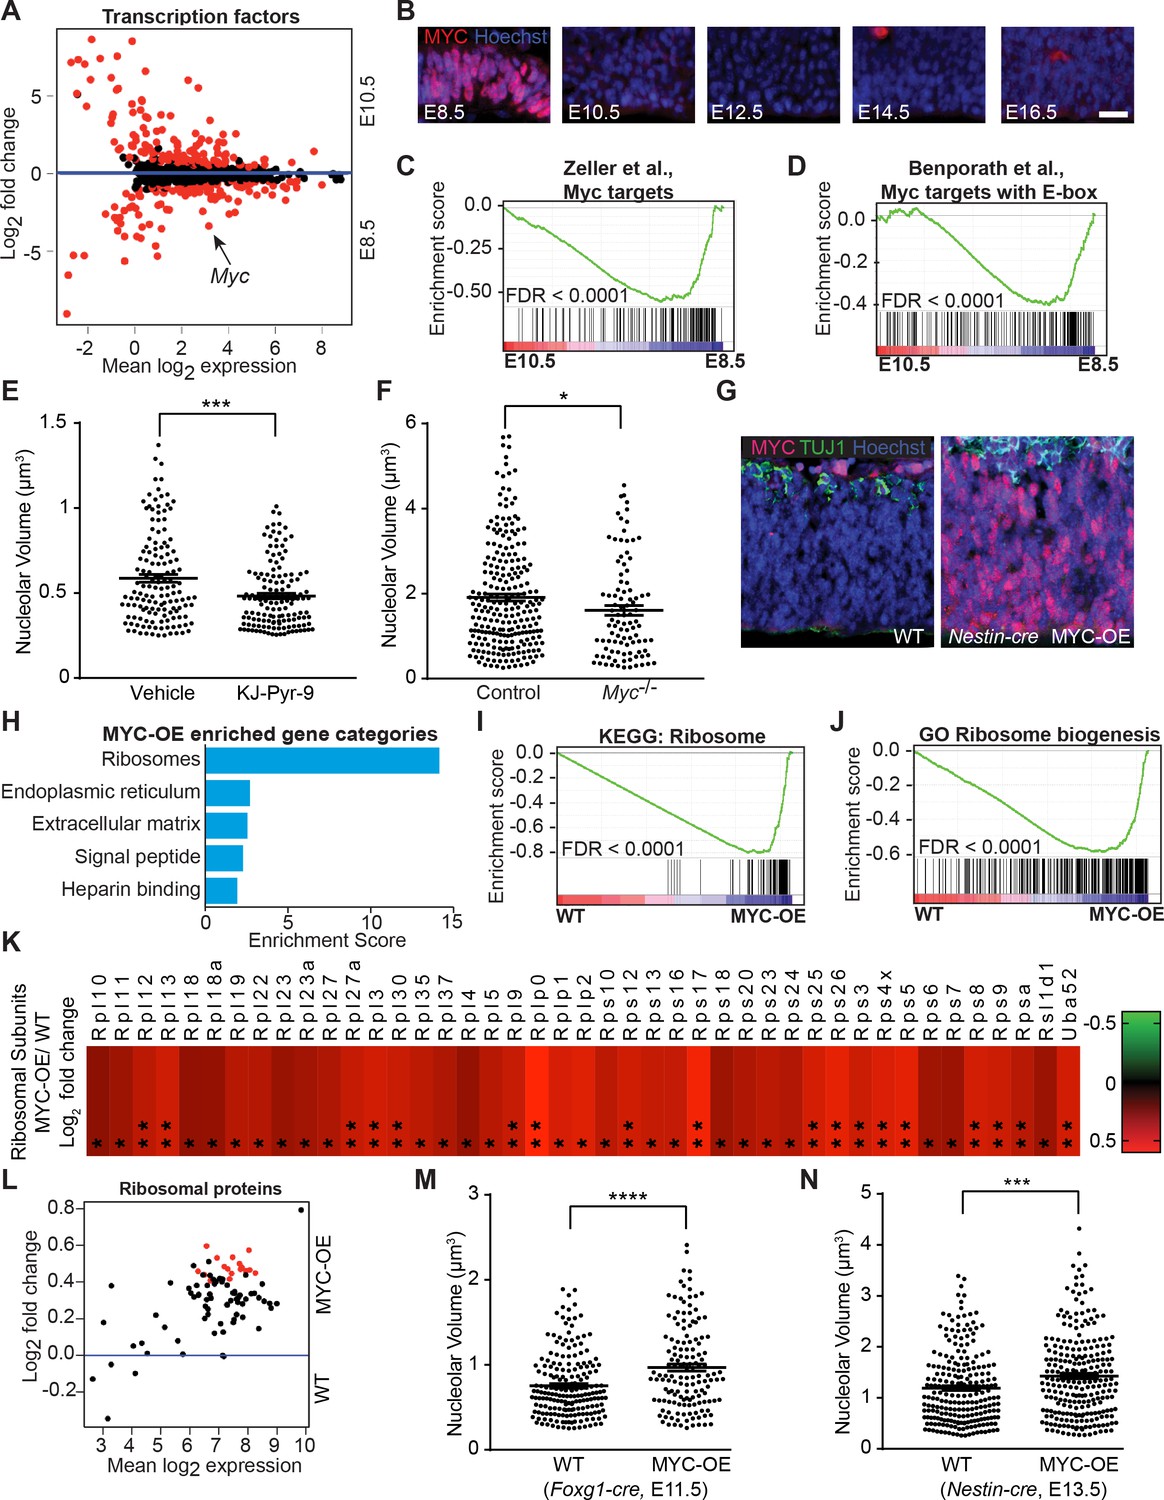
MYC modulates ribosome biogenesis in the developing forebrain.
(A) MA plot displaying genes encoding transcription factors in E8.5 and E10.5 neuroepithelium. Each dot represents a single gene. Red dots denote differentially expressed genes identified by Cuffdiff (q<0.05). Genes below blue line (y = 0) enriched in E8.5. Myc (arrow) expression is ~10 fold higher in E8.5 epithelium (FPKM: E8.5=28.73, E10.5 = 2.76). (B) MYC expression was enriched in E8.5 neuroepithelium. Once downregulated at E10.5, MYC expression remained low throughout cortical development. Scale bar = 20 μm. (C, D) GSEA of E8.5 versus E10.5 neuroepithelium for gene sets containing genes up-regulated by MYC and whose promoters are bound by MYC (C), and E-box containing MYC target genes (D). Broad Institute Molecular Signatures Database Identifiers: DANG_MYC_TARGETS_UP (C), BENPORATH_MYC_TARGETS_WITH _EBOX (D). Each line represents a single gene in the gene set; genes on the right side enriched in E8.5. (E) Quantification of nucleolar volume of E8.5 embryos treated with vehicle control or KJ-Pyr-9 for 24 hr. Each data point represents one nucleolus. ***p≤0.001, Welch’s t-test. Sample size, vehicle: n = 140 from three embryos; KJ-Pyr-9: n = 140 from three embryos. (F) Quantification of nucleolar volume of Myc-/- compared to controls (wild type and heterozygous littermates) in E8.5 neuroepithelium. *p≤0.05 Unpaired t-test. Sample size, controls: n = 238 from five embryos; Myc-/-: n = 97 from two embryos. (G) Immunostaining shows overexpression of MYC (red) in the developing cortex of E12.5 MYC-OE (right) embryos from the Nestin-cre x StopFLMYC cross. TUJ1 (green) staining labels neurons. (H) Functional annotation clustering of the 105 MYC-OE enriched genes shows overrepresentation of genes encoding ribosome constituents. The top five enriched functional clusters are shown. (I, J) GSEA of WT versus MYC-OE apical progenitors for gene sets involved in ribosome biogenesis. Broad Institute Molecular Signatures Database Identifiers: KEGG_RIBOSOME (I), and GO_RIBOSOME_ BIOGENESIS (J). Each line represents a single gene in the gene set, genes on the right side are enriched in MYC-OE. (K) Heatmap of the 43 ribosomal protein genes that are differentially expressed between MYC-OE and WT apical progenitors (* q < 0.3, **q < 0.1). All ribosomal proteins are more highly expressed in MYC-OE. Red and green indicate relatively higher and lower expression, with gene FPKM values log2 transformed. (L) MA plot displaying genes encoding ribosomal proteins in E13.5 apical progenitors. Each dot represents a single gene. Red dots denote differentially expressed genes as identified by Cuffdiff (q<0.1). Genes above blue line (y = 0) are enriched in MYC-OE. (M) Quantification of nucleolar volume of WT and MYC-OE (Foxg1-cre driven) forebrain progenitors at E11.5. Each data point represents one nucleolus. ****p≤0.0001, Welch’s t-test. Sample size, WT: n = 194 from four embryos; MYC-OE: n = 144 from three embryos. (N) Quantification of nucleolar volume of WT and MYC-OE (Nestin-cre driven) apical progenitors at E13.5. Each data point represents one nucleolus. ***p≤0.001, Welch’s t-test. Sample size, WT: n = 234 from five embryos; MYC-OE: n = 248 from five embryos.
Figure 5—figure supplement 1
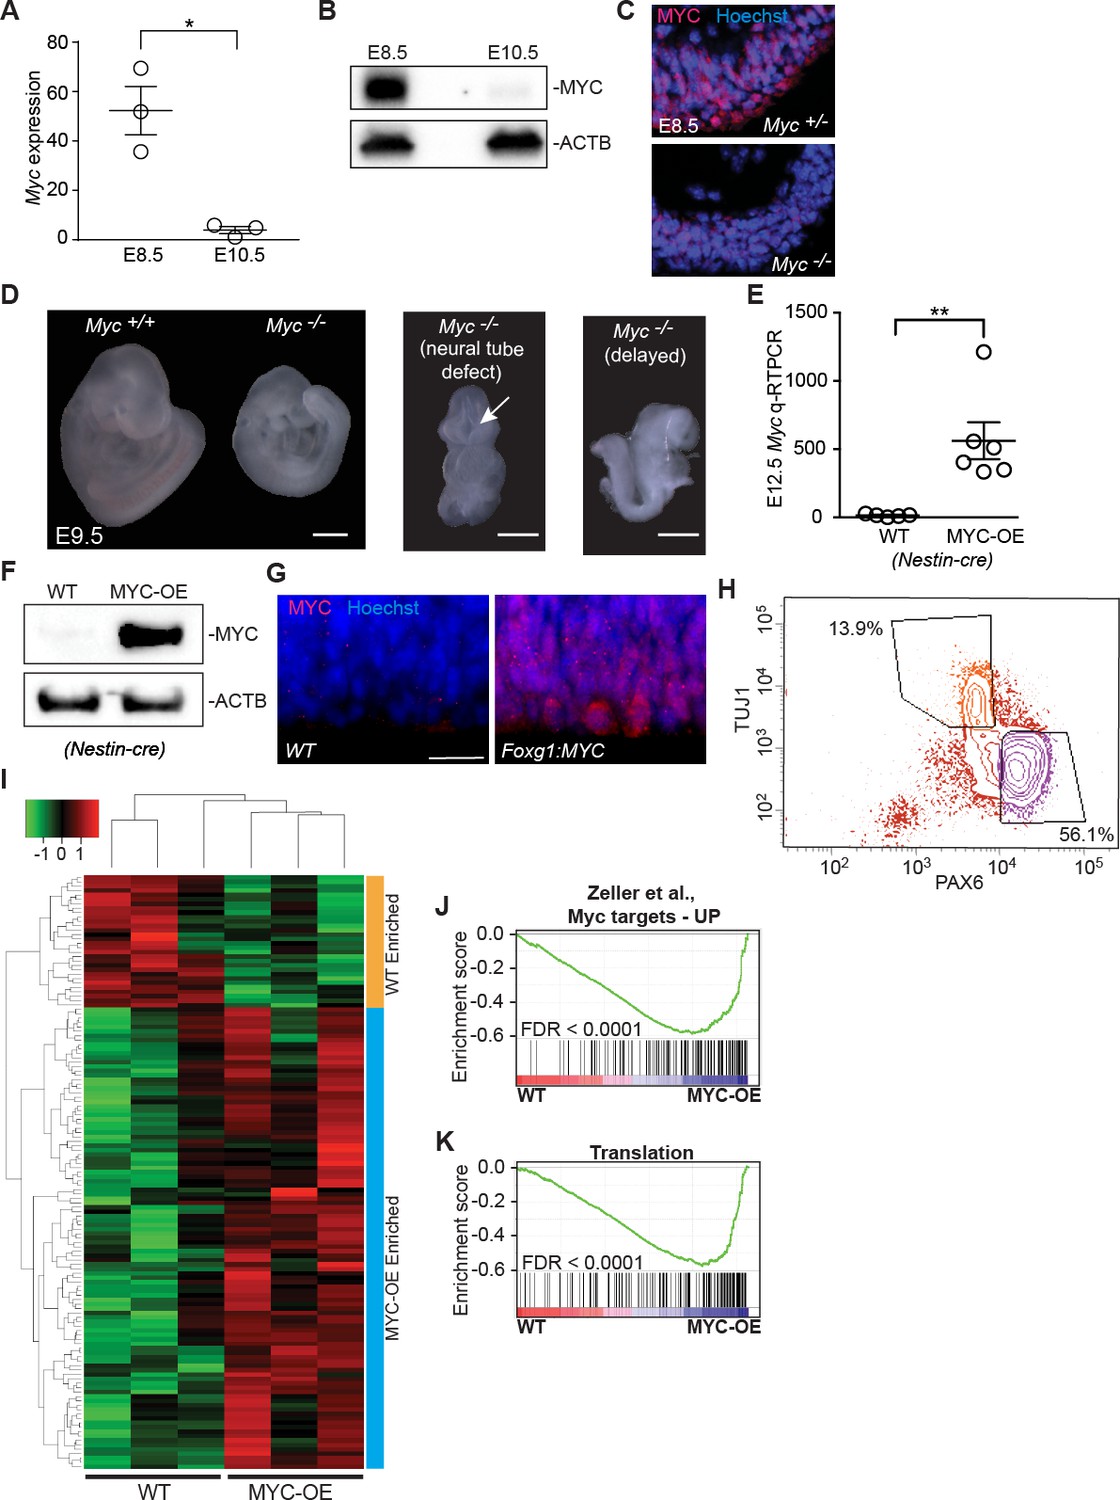
MYC expression and mouse models.
(A) Quantitative RT-PCR validated higher expression of Myc in the developing neuroepithelium of E8.5. *p<0.05, Welch’s t-test. Each data point represents multiple embryos from the same litter. (B) Immunoblotting shows higher expression of MYC in E8.5 developing forebrain. See also (Shannon et al., 2018). (C) Immunostaining confirmed specificity of MYC antibody. (D) Representative E9.5 wildtype embryo (left) and Myc-deficient littermates (Myc-/-, right panels), which show range of phenotypes (Davis et al., 1993) including small size (Myc+/+: 0%, 0/17; Myc+/-: 20%, 5/25; Myc-/-: 67%, 6/9), incomplete neural tube closure (Myc+/+: 0%, 0/17; Myc+/-: 0%, 0/25; Myc-/-: 11%, 1/9), and delayed development (Myc+/+: 12%, 2/17; Myc+/-: 4%, 1/25; Myc-/-: 22%, 2/9). Morphologically the representative Myc-/- embryos are similar to a normal E8.25 before turning, and have open neural tubes. Scale bar = 0.5 mm. (E) Quantitative RT-PCR confirms higher expression of Myc in E12.5 neuroepithelium of MYC-OE embryos than in wildtype littermates from the Nestin-cre x StopFLMYC cross. **≤0.01, Welch’s t-test, n = 5 (WT) or 6 (MYC-OE) embryos from two litters. (F) Immunoblotting confirms overexpression of MYC (top) in the developing forebrain of E12.5 MYC-OE from the Nestin-cre x StopFLMYC cross. Bottom panel shows ACTB loading control. (G) Immunostaining shows overexpression of MYC (red) in the developing cortex of E10.5 MYC-OE (right) embryos from the Foxg1-cre x StopFLMYC cross. Scale bar = 20 μm. (H) Representative FACS profile used for isolating apical progenitors form E13.5 cortex. Apical progenitors (PAX6-high, TUJ1-low) are selected using the lower right gate. Upper left gate represents neurons (PAX6-low, TUJ1-high). (I) Heatmap and hierarchical clustering of the 135 genes that are differentially expressed between MYC-OE and WT apical progenitors (q < 0.1). 105 genes are enriched in MYC-OE (Nestin-cre driven), whereas 30 genes are repressed. Each biological replicate contains cells from 2 to 4 embryos. Red and green indicate relatively higher and lower expression, with gene FPKM values log2 transformed, and centered and scaled by rows for display purposes. (J, K) GSEA of WT versus MYC-OE apical progenitors for gene sets containing genes upregulated by MYC and whose promoters are bound by MYC. Broad Institute Molecular Signatures Database Identifiers: DANG_MYC_TARGETS_UP (J) and TRANSLATION (K).
Figure 6 with 1 supplement
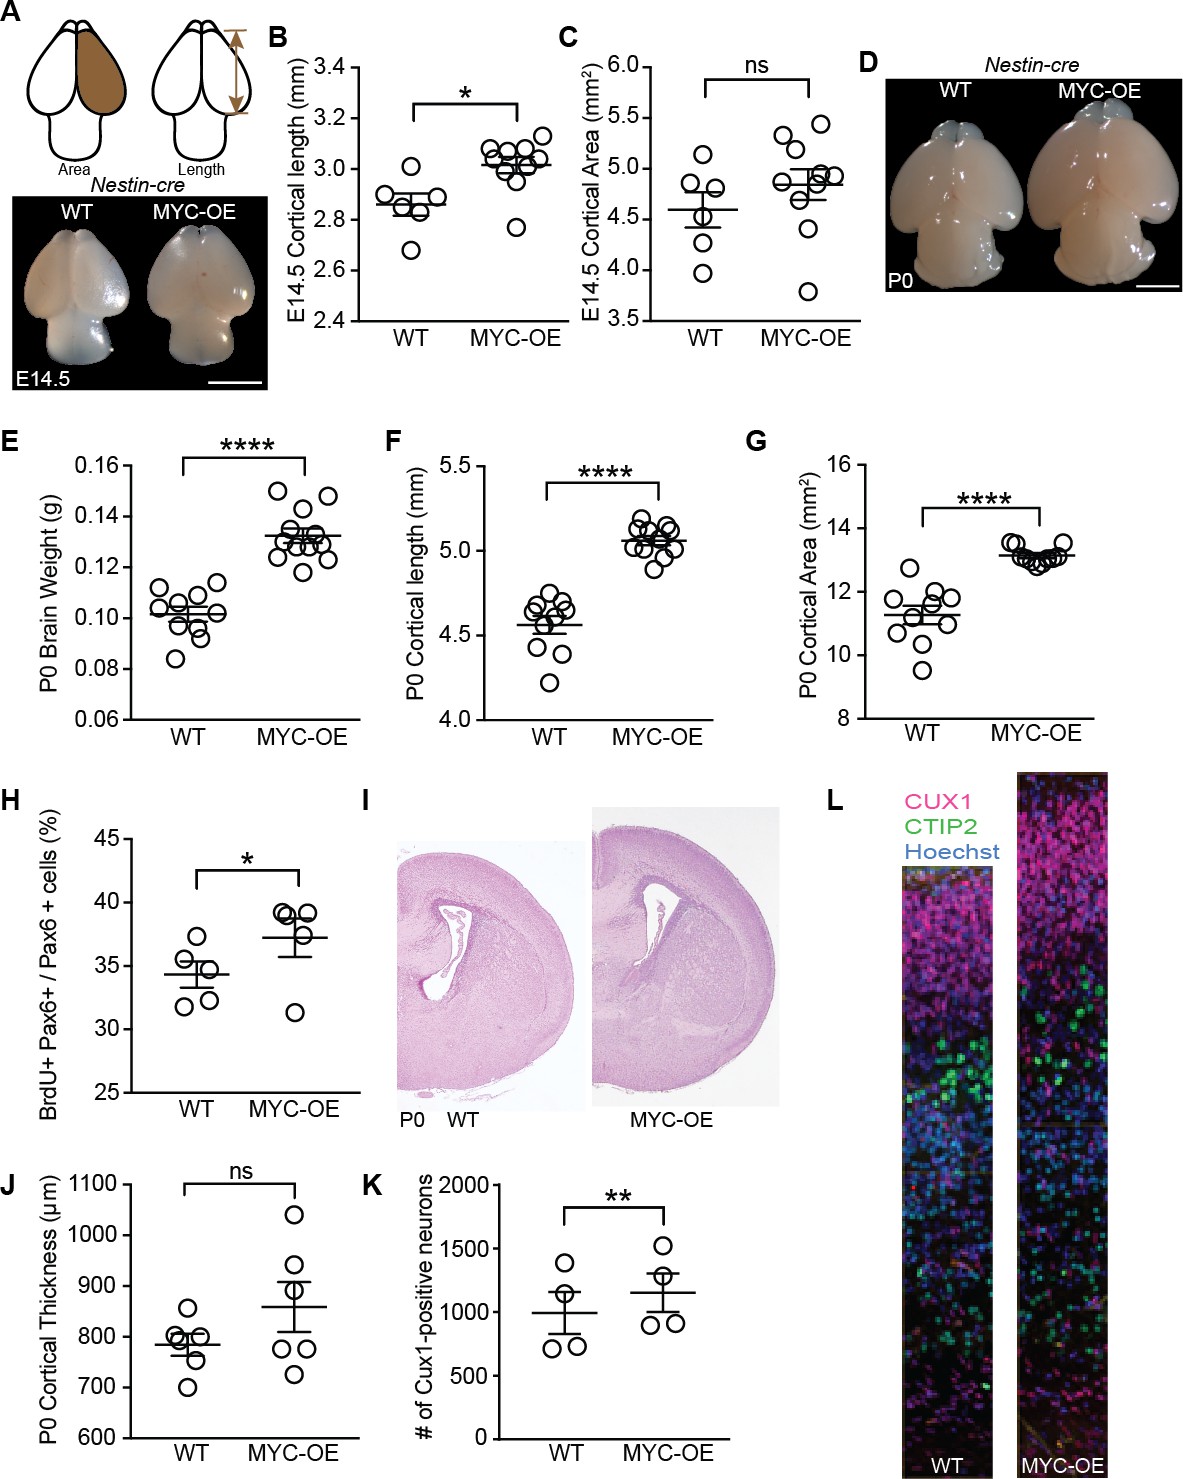
Persistent MYC expression in cortical progenitors leads to macrocephaly.
(A) Representative images of E14.5 brains from WT and MYC-OE from the Nestin-cre x StopFLMYC cross. Scale bar = 2 mm. (B) Quantification of E14.5 cortical length (olfactory bulb excluded). *p≤0.05, unpaired t-test, WT: n = 6 from two litters, MYC-OE: n = 10 embryos from two litters. (C) Quantification of E14.5 cortical area. Cortical area of one hemisphere was measured (olfactory bulb excluded). p>0.05, unpaired t-test, WT: n = 6 from two litters, MYC-OE: n = 10 embryos from two litters. (D) Representative images of P0 brains from WT and MYC-OE from the Nestin-cre x StopFLMYC cross. Scale bar = 2 mm. (E) Quantification of P0 brain weight. Olfactory bulb, medulla and pons were excluded from measurements. ****p≤0.0001, unpaired t-test, No outliers, WT: n = 10 pups from three litters, MYC-OE: n = 12 pups from three litters. (F) Quantification of P0 cortical length as in (B). ****p≤0.0001, unpaired t-test, outlier excluded by ROUT method, WT: n = 10 pups from three litters, MYC-OE: n = 11 pups from three litters. (G) Quantification of P0 cortical area as in (C). ****p≤0.0001, Welch’s t-test, outlier excluded by ROUT method, WT: n = 10 pups from three litters, MYC-OE: n = 11 pups from three litters. (H) Percent PAX6-positive progenitors that were also BrdU-positive after a 2 hr BrdU pulse at E15.5. *p≤0.05, Welch’s t-test, n = 5 embryos from three litters. (I) Representative H and E staining of WT and MYC-OE forebrain at P0. (J) Quantification of cortical thickness of P0 cortex. Thickness is measured from the ventricular surface to the pial surface in the dorsal-lateral cortex. p>0.05, unpaired t-test, n = 6 pups from five litters. (K) MYC-OE had increased number of CUX1-positive upper layer neurons at P0. **p≤0.01; paired t-test, n = 4 litters, 1–2 pairs of embryos per litter were quantified. (L) Examples of 100 μm wide cortical columns at P0 used for cell counting. CUX1: upper layer neurons (red), CTIP2: lower layer neurons (green).
Figure 6—figure supplement 1
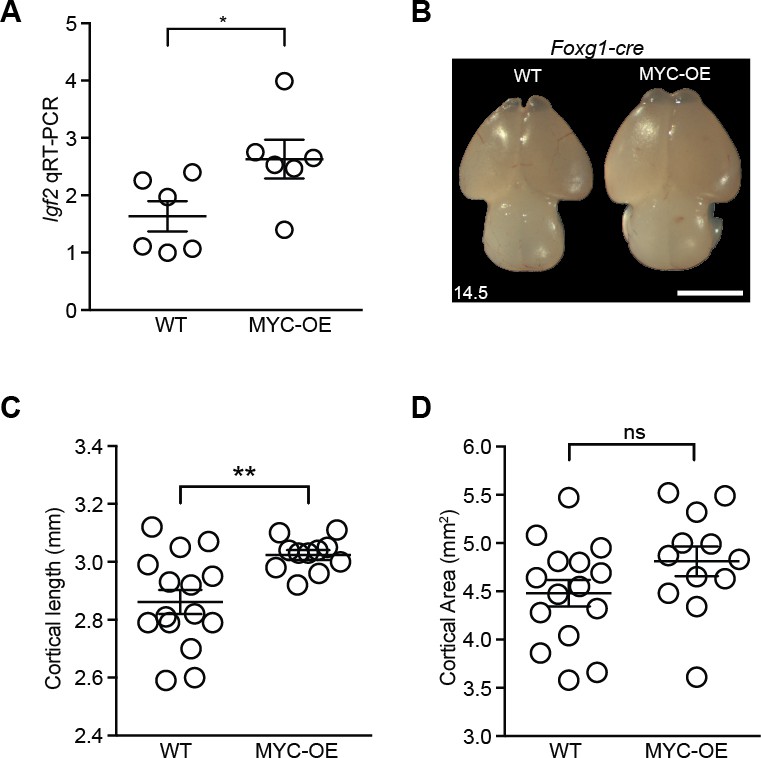
MYC overexpression in neural progenitors driven by Foxg1-cre leads to slightly longer cortex at E14.5.
(A) Quantitative RT-PCR validated higher expression of Igf2 in the developing cortex of MYC-OE embryos. *p<0.05, unpaired t-test. n = 6 embryos from two litters. (B) Representative images showing wildtype (left) and MYC-OE (right) brains at E14.5. Scale bar = 2 mm. (C) Quantification of E14.5 cortical length. The olfactory bulb was excluded from measurements. **p≤0.01, Welch’s t-test, WT: 15 embryos from six litters; MYC-OE: 12 embryos from six litters. (D) Quantification of E14.5 cortical area. Cortical area of one hemisphere was measured (olfactory bulb excluded). p>0.05, unpaired t-test, WT: 15 embryos from six litters; MYC-OE: 12 embryos from six litters. ns = not significant.
Tables
Key resources table
| Reagent type (species) or resource | Designation | Source or reference | Identifiers | Additional information |
|---|---|---|---|---|
| Strain, strain background (Mus Musculus) | Gt(ROSA)26Sortm13(CAG-MYC,-CD2*)Rsky(referred as StopFLMYC) | The Jackson Laboratory (Bar Harbor, ME) | MGI:5444670 | Maintained on a C57Bl/6 background |
| Strain, strain background (Mus Musculus) | Tg(Nes-cre)1Kln (referred as Nestin-cre) | The Jackson Laboratory | MGI:2176173 | Maintained on a C57Bl/6 background |
| Strain, strain background (Mus Musculus) | Foxg1tm1(cre)Skm(referred as Foxg1-cre) | The Jackson Laboratory | MGI:1932522 | Maintained on a C57Bl/6 background |
| Strain, strain background (Mus Musculus) | Myc-deficient mice (c-myc-/-) | Provided by Troy Baudino | Baudino et al. (2002) | Maintained on a C57Bl/6 background |
| Strain, strain background (Mus Musculus) | CD-1 IGS Mouse (referred as CD-1) | Charles River (Wilmington, MA) | Strain code: 022 | Wildtype timed pregnant mice |
| Antibody | Rabbit anti-4E-BP1 | Cell Signaling (Danvers, MA) | 9644 | 1:1000 |
| Antibody | Mouse anti-5.8S ribosomal RNA [Y10B] | Abcam (United Kingdom) | ab171119 | 1:50; antigen retrieval with steaming in citric acid |
| Antibody | Mouse anti-ACTB | Cell Signaling | 12262 | 1:2000 |
| Antibody | Rat anti-BrdU | Biorad (Hercules, CA) | MCA2060 | 1:200; antigen retrieval with steaming in citric acid |
| Antibody | Rabbit anti-MYC | Abcam | ab32072 | 1:100 for IHC, antigen retrieval with steaming in citric acid; 1:2000 for WB |
| Antibody | Rat anti-CTIP2 | Abcam | ab18465 | 1:200 |
| Antibody | Rabbit anti-CUX1 | Santa Cruz Biotechnology (Dallas, TX) | sc13024 | 1:200 |
| Antibody | Mouse anti-EIF3η | Santa Cruz Biotechnology | sc137214 | 1:100; antigen retrieval with steaming in citric acid |
| Antibody | Mouse anti-Fibrillarin | Abcam | ab4566 | 1:250; antigen retrieval with steaming in citric acid |
| Antibody | Mouse anti-GAPDH | Cell Signaling | 97166 | 1:1000 |
| Antibody | Rabbit anti-p4E-BP1 | Cell Signaling | 2855 | 1:200 for IHC; 1:1000 for WB |
| Antibody | Rabbit anti-PAX6 | Biolegend (San Diego, CA) | 901301 | 1:100; antigen retrieval with steaming in citric acid; 1:1000 for FACS |
| Antibody | Rabbit anti-pS6 | Cell Signaling | 5364 | 1:200 for IHC; 1:1000 for WB |
| Antibody | Rabbit anti-pS6K | Cell Signaling | 9234 | 1:1000 |
| Antibody | Mouse anti-pVimentin | Enzo Bioscience (Farmingdale, NY) | ADI-KAM-CC249-E | 1:400 |
| Antibody | Mouse anti-RPL10A | Novusbio (Littleton, CO) | H00004736-M01 | 1:500 |
| Antibody | Rabbit anti-RPL11 | Santa Cruz Biotechnology | sc50363 | 1:50 |
| Antibody | Rabbit anti-RPS12 | Proteintech (Chicago, IL) | 16490–1-AP | 1:50 |
| Antibody | Rabbit anti-S6 | Cell Signaling | 2217 | 1:1000 |
| Antibody | Rabbit anti-S6K | Cell Signaling | 9202 | 1:1000 |
| Antibody | Mouse anti-TUJ1 | Biolegend | 801202 | 1:100 for IHC; 1:1000 for FACS |
| Antibody | Rabbit anti-Vinculin | Cell Signaling | 13901 | 1:1000 |
| Recombinant DNA reagent | Quaser 570 coupled 5.8S pre-rRNA FISH probe | Provided by Debra Silver | 1:200 | |
| Recombinant DNA reagent | Quaser 670 coupled 5.8S total rRNA FISH probe | Provided by Debra Silver | 1:200 | |
| Commercial assay or kit | RecoverAll Total Nucleic Acid Isolation Kit for FFPE | Ambion (Foster City, CA) | AM1975 | Manufacturer's protocol |
| Commercial assay or kit | Ovation RNA-Seq System V2 | Nugen (San Carlos, CA) | 7102 | Manufacturer's protocol |
| Commercial assay or kit | Ovation Ultralow System V2 1–16 | Nugen | 0344 | Manufacturer's protocol |
| Commercial assay or kit | TruSeq RNA Library Prep Kit v2 | Illumina (San Diego, CA) | RS-122 | Manufacturer's protocol |
| Commercial assay or kit | Rneasy Micro Kit | Qiagen (Germany) | 74004 | Manufacturer's protocol |
| Commercial assay or kit | Pierce BCA Protein Assay Kit | Thermo Fisher Scientific (Waltham, MA) | 23227 | |
| Commercial assay or kit | Click-iT plus OPP protein synthesis assay kit | Thermo Fisher Scientific | C10456 | |
| Chemical compound, drug | O-propargyl-puromycin (OPP) | Life Technologies (Carlsbad, CA) | C10459 | IP injection, dosage: 50 mg/kg |
| Chemical compound, drug | KJ-Pyr-9 | Tocris (United Kingdom) | 5306 | IP injection, dosage: 10 mg/kg |
| Chemical compound, drug | 35S-Methionine | Perkin Elmer (Waltham, MA) | NEG709A | 51 μCi |
| Chemical compound, drug | 5-Bromo-2′-deoxyuridine (BrdU) | Sigma (St. Louis, MO) | B5002 | IP injection, 50 mg/kg |
| Software, algorithm | TopHat | https://ccb.jhu.edu/software/tophat/index.shtml | v2 | RNAseq analysis |
| Software, algorithm | Cufflinks | http://cole-trapnell-lab.github.io/cufflinks/ | v2 | RNAseq analysis |
| Software, algorithm | DAVID | https://david.ncifcrf.gov/ | v6.7, 6.8 | RNAseq analysis |
| Software, algorithm | GSEA | http://software.broadinstitute.org/gsea/index.jsp | v2 | RNAseq analysis |
| Software, algorithm | R Studio | Rstudio, Inc. | v0.99 | RNAseq analysis |
| Software, algorithm | Prism | GraphPad | v7 | Statistical analysis |
| Software, algorithm | FIJI (Image J) | https://fiji.sc/# | v1 | Image analysis |
| Software, algorithm | Imaris | Bitplane | Image analysis |
Additional files
-
Supplementary file 1
E8.5 vs E10.5 neuroepithelium RNA sequencing data: All genes (sheet 1), differentially expressed genes (DEG, sheet 2), DAVID functional annotation clustering (FAC, sheet 3 and 4), gene lists used for MA plot (sheet 5–10).
- https://doi.org/10.7554/eLife.36998.011
-
Supplementary file 2
WT vs MYC-OE apical progenitors RNA sequencing data: All genes (sheet 1), DEG (sheet 2), FAC of MYC-OE enriched genes (sheet 3), ribosomal protein genes used for MA plot in Figure 5L (Sheet 4), 53 genes that are enriched in both E8.5 and MYC-OE (Sheet 5).
- https://doi.org/10.7554/eLife.36998.012
-
Transparent reporting form
- https://doi.org/10.7554/eLife.36998.013
Download links
A two-part list of links to download the article, or parts of the article, in various formats.
Downloads (link to download the article as PDF)
Open citations (links to open the citations from this article in various online reference manager services)
Cite this article (links to download the citations from this article in formats compatible with various reference manager tools)
Downregulation of ribosome biogenesis during early forebrain development
eLife 7:e36998.
https://doi.org/10.7554/eLife.36998


