Changes in the genetic requirements for microbial interactions with increasing community complexity
- University of California, San Diego, United States
- Jacobs School of Engineering, University of California San Diego, United States
Figures
Figure 1 with 7 supplements
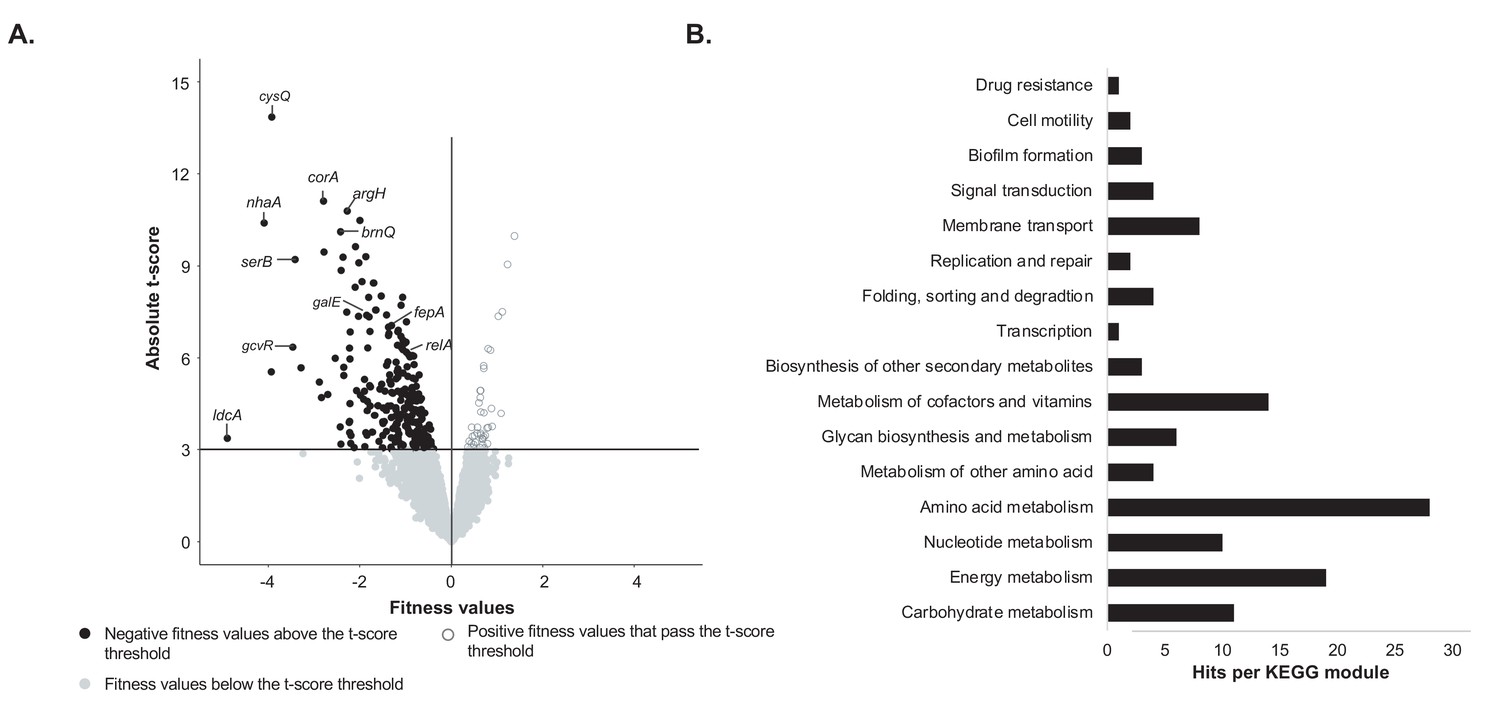
Identification of genes important for growth of E. coli alone on cheese curd agar (Figure 1—source data 1).
(A) The pooled E. coli RB-TnSeq library Keio_ML9 (Wetmore et al., 2015) was grown alone on cheese curd agar (CCA). Gene fitness values were calculated for 3298 genes at days 1, 2, and 3 along with a t-score, which assesses how reliably the fitness value differs from 0. The fitness values obtained at the three timepoints are displayed on a single volcano plot (3 points per gene). A t-score threshold of absolute(t-score)≥3 was used to identify genes with strong fitness effects. 97% of the genes fell below this threshold and have no strong and significant fitness effect. Black dots represent genes with strong negative fitness effects. Altogether, they represent 160 different genes that are associated with a significant fitness value for at least one timepoint. (B) These 160 genes were mapped to the KEGG BRITE Database for functional analysis and identification of required functions for E. coli growth on CCA. 84 of the 160 genes had hits when mapped to the KEGG BRITE database.
-
Figure 1—source data 1
RB-TnSeq analysis of E. coli’s growth alone on 10% cheese curd agar, pH7.
- https://doi.org/10.7554/eLife.37072.012
Figure 1—figure supplement 1
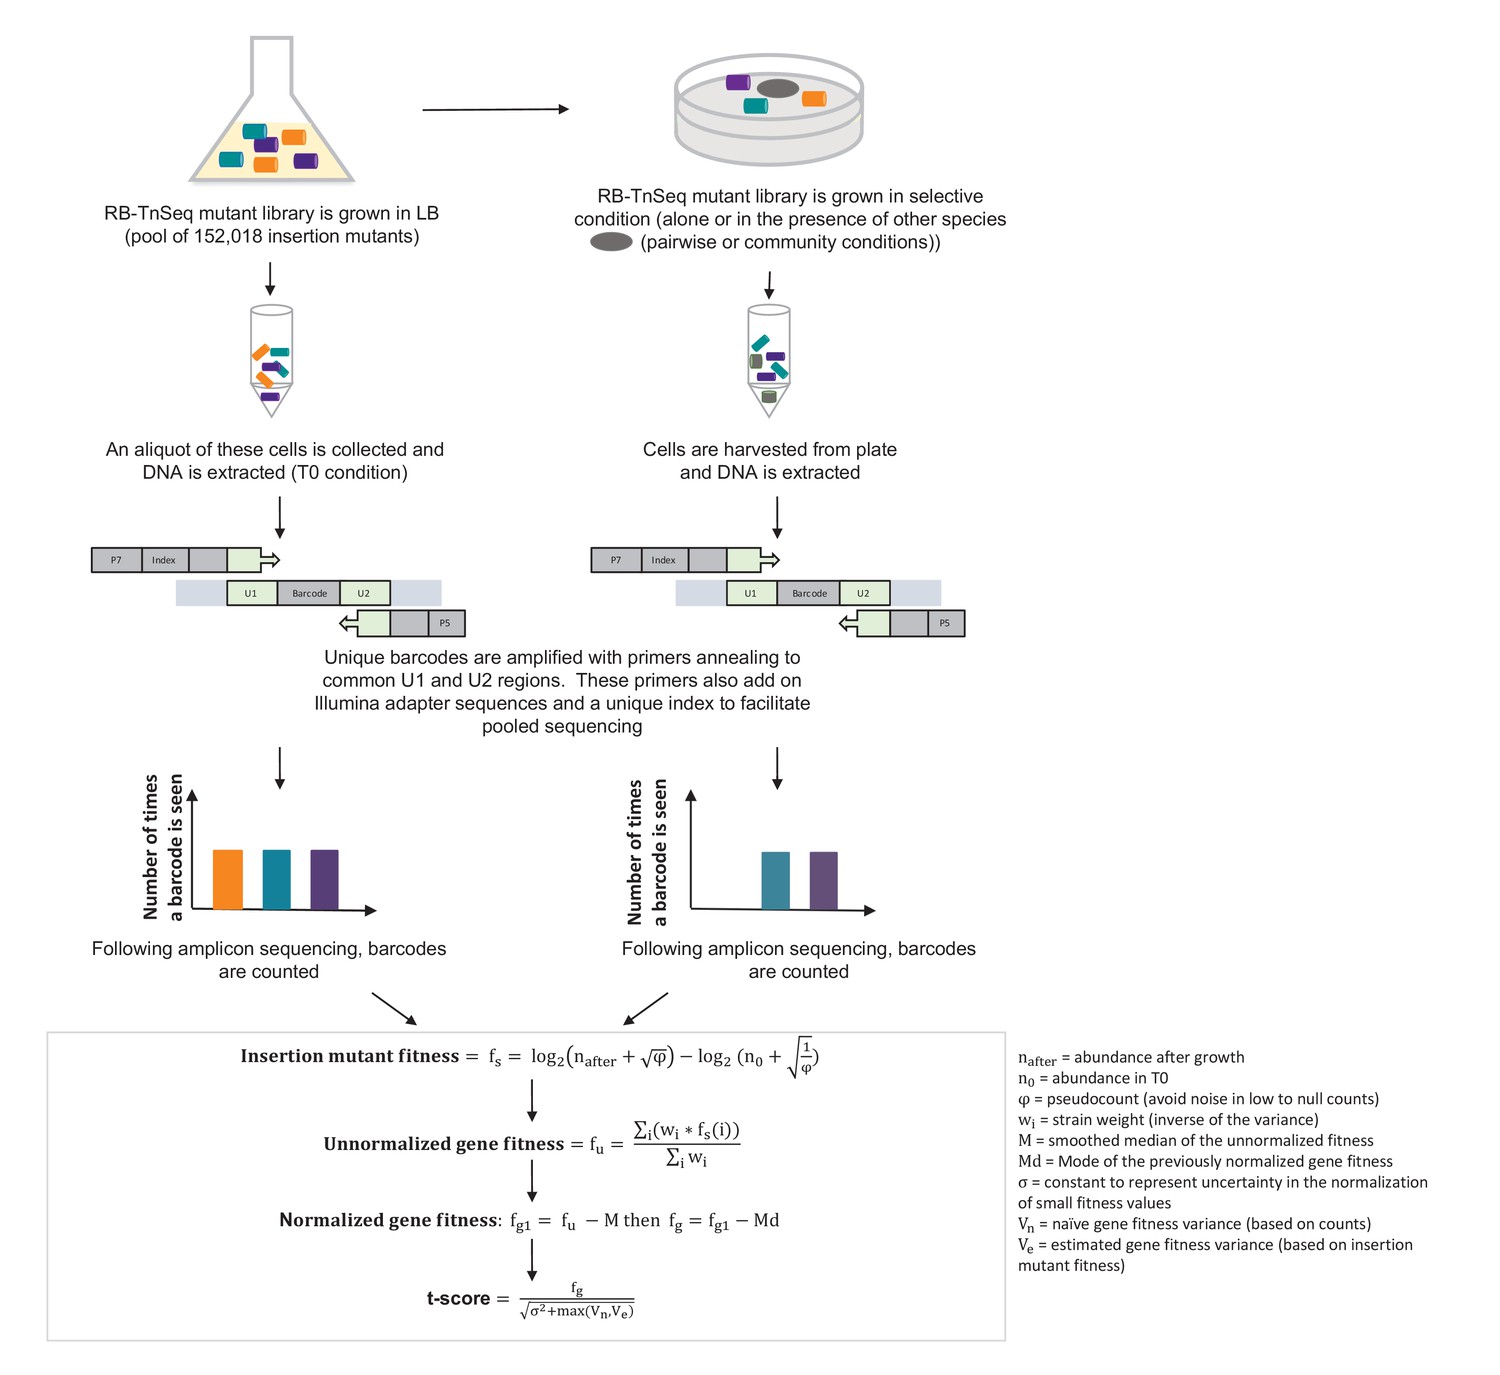
Pipeline of RB-TnSeq experiment using the E. coli Keio M9 library: from experimental set-up to normalized gene fitness and t-score calculation.
Calculation of gene fitness from the Illumina sequencing files was performed using the Perl script BarSeqTest.pl from (Wetmore et al., 2015). The detailed description of the pipeline can be found in (Wetmore et al., 2015).
Figure 1—figure supplement 2
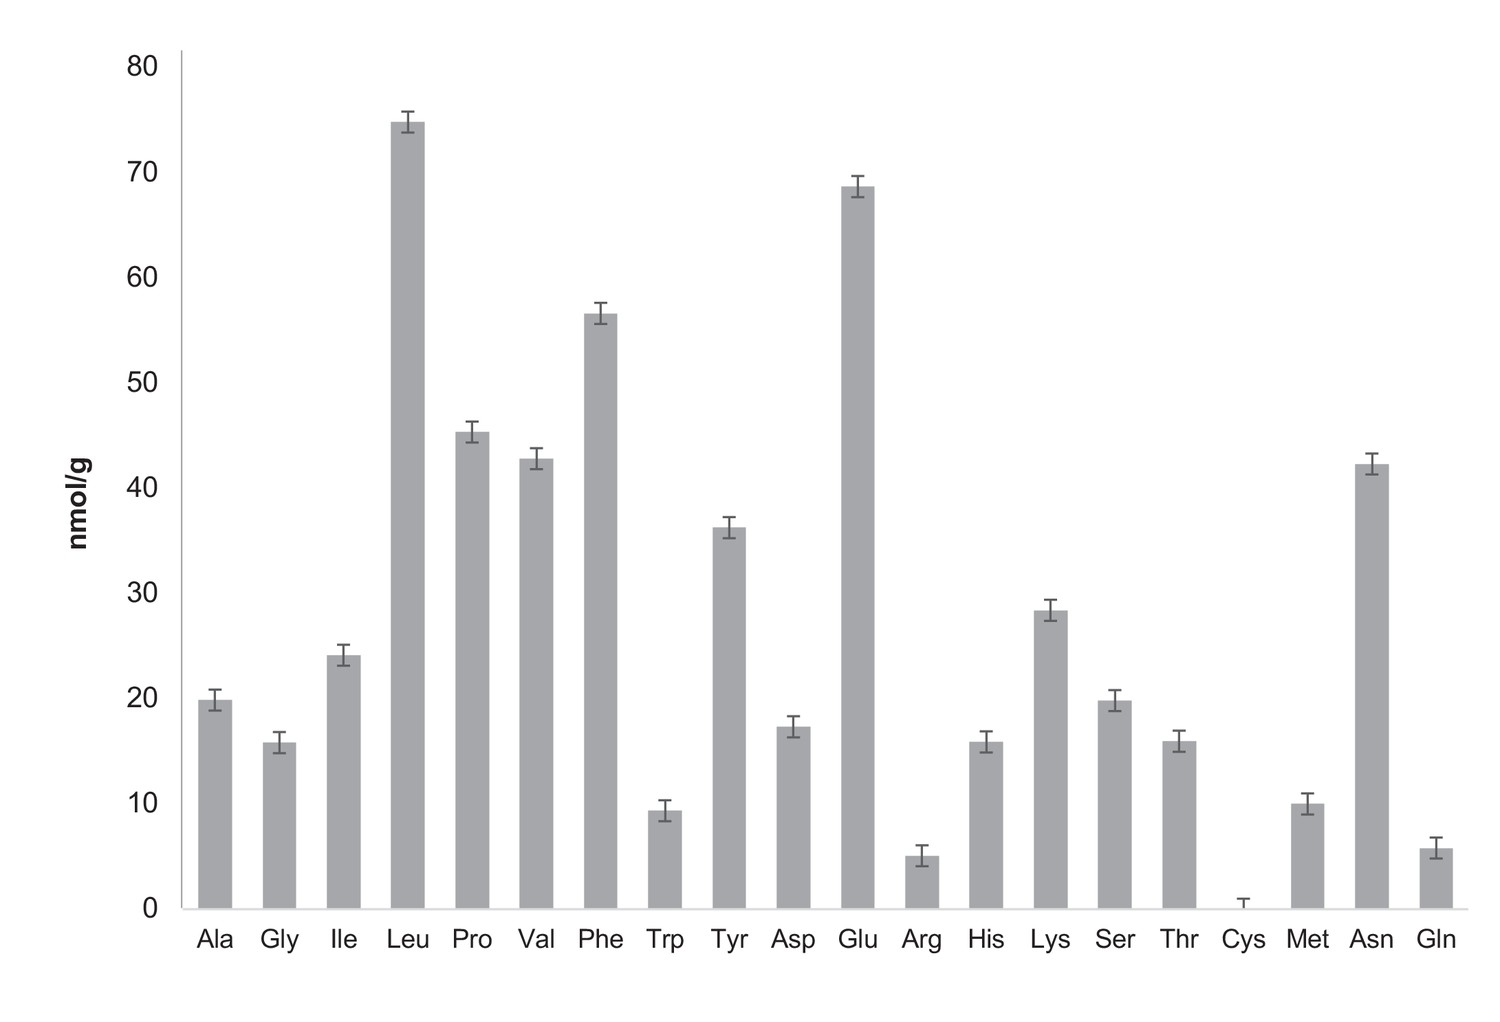
Quantification of free amino acids in CCA.
Free amino acid characterization and quantification have been carried out by the Proteomics and Mass Spectrometry Facility of the Donald Danforth Plant Science Center and each analysis has been performed in triplicate. Samples were prepared as recommended by the Proteomics and Mass Spectrometry Facility of the Donald Danforth Plant Science Center instructions. For free amino acid analysis, 150 mg CCA was frozen in liquid nitrogen and ground in the presence of 600 μL of water:chloroform:methanol (3:5:12 v/v). Tubes were then centrifuged at full speed for two minutes and supernatant was recovered in a new 2 mL eppendorf tube. A second extraction with 600 uL of water:chloroform:methanol was performed followed by a two minute centrifugation at maximum speed. Supernatant was then recovered and combined with the previous supernatant in a 2 mL eppendorf tube. Then 300 uL of chloroform and 450 uL of water were added before centrifugation at full speed for two minutes. The upper phase was recovered and transferred to a new tube. Samples were dried in a speedvac overnight and stored at −20°C. The total concentration of free amino acids in CCA is 75.3 nmol/mL. Analysis of total amino acids was also performed by the Proteomics and Mass Spectrometry Facility of the Donald Danforth Plant Science Center. It highlights that free aminos are a very small fraction of total amino acid whose concentration is 16.5 ± 2.97 μmol/mL (six times less than the LB concentration measured by Sezonov et al. (2007)). Ala: alanine, Gly: glycine, Ile: isoleucine, Leu: leucine, Pro: proline, Val: valine, Phe: phenylalanine, Trp: tryptophan, Tyr: tyrosine, Asp: aspartate, Glu: glutamate, Arg: arginine, His: histidine, Lys: lysine, Ser: serine, Thr: threonine, Cys: cysteine, Met: methionine, Asn: asparagine, Gln: glutamine.
Figure 1—figure supplement 3
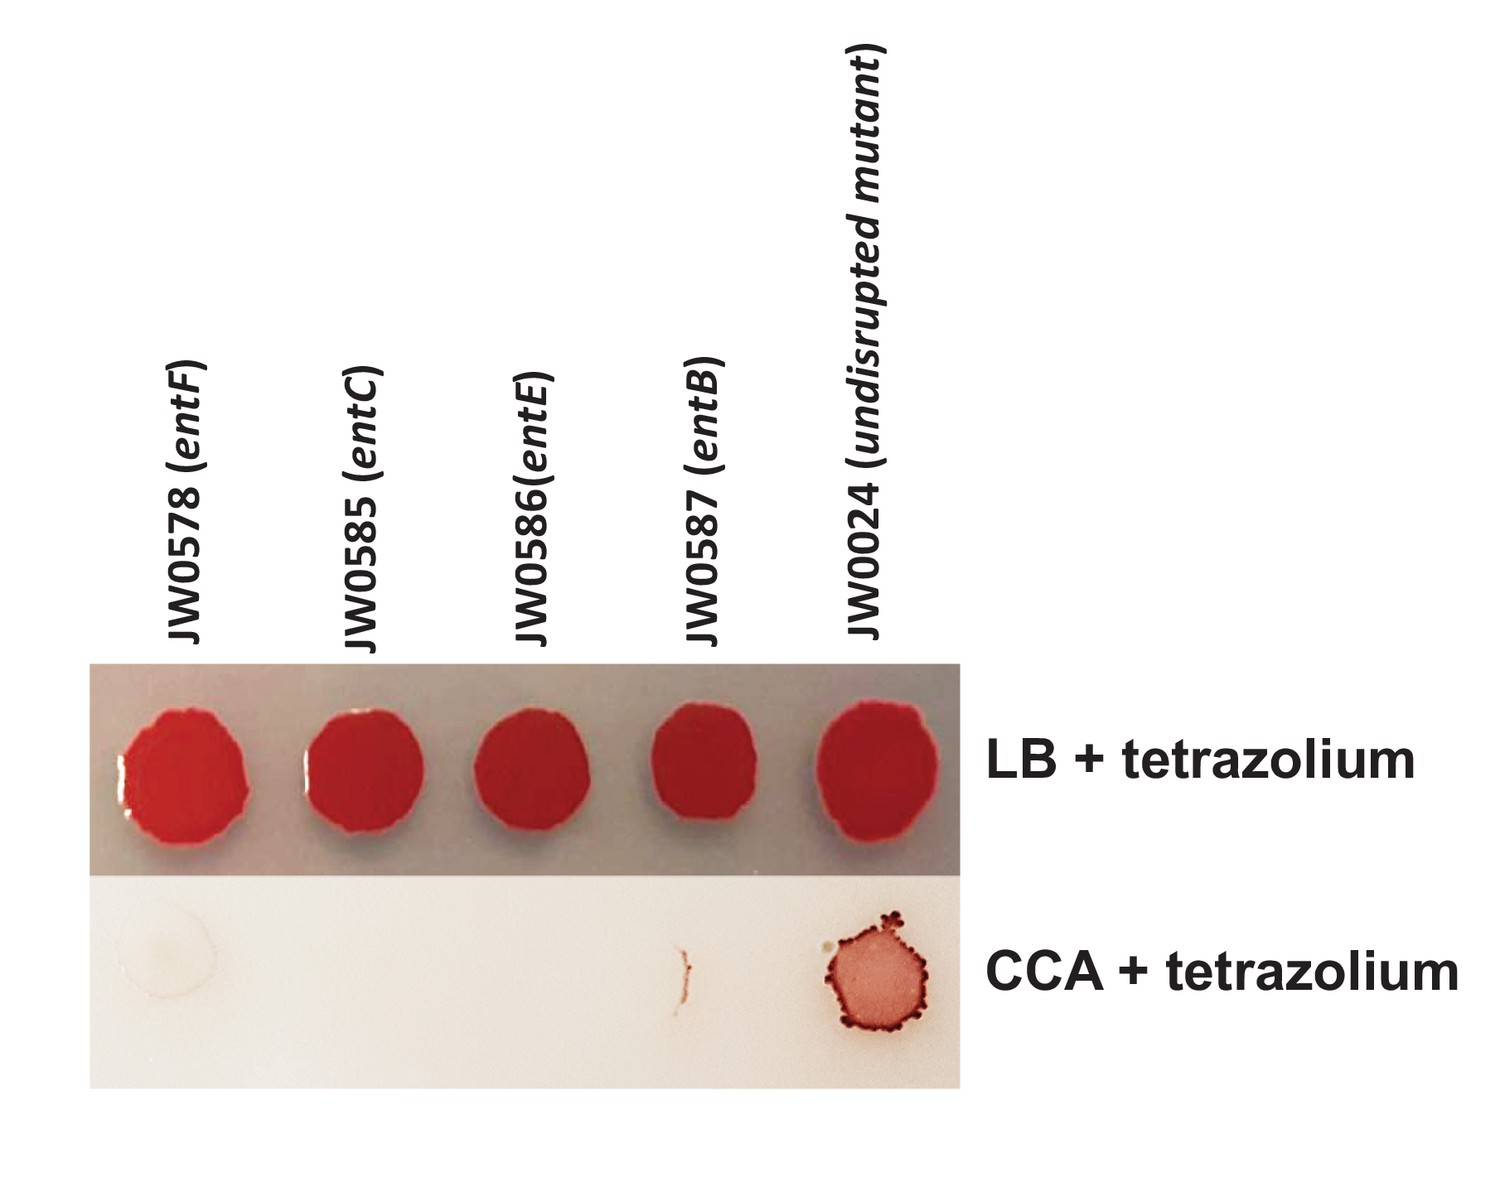
Comparison of individual growth of enterobactin biosynthesis mutants on LB and CCA.
5% tetrazolium solution (100 uL/L of medium) was added to the media to color colonies and make them visible on CCA. We selected 4 mutants of enterobactin biosynthesis from the Keio collection. 5 μL of each mutant culture was spotted on either LB-tetrazolium or CCA-tetrazolium and grown at room temperature for 3 days. The wild-type strain JW0024 was used as a control.
Figure 1—figure supplement 4
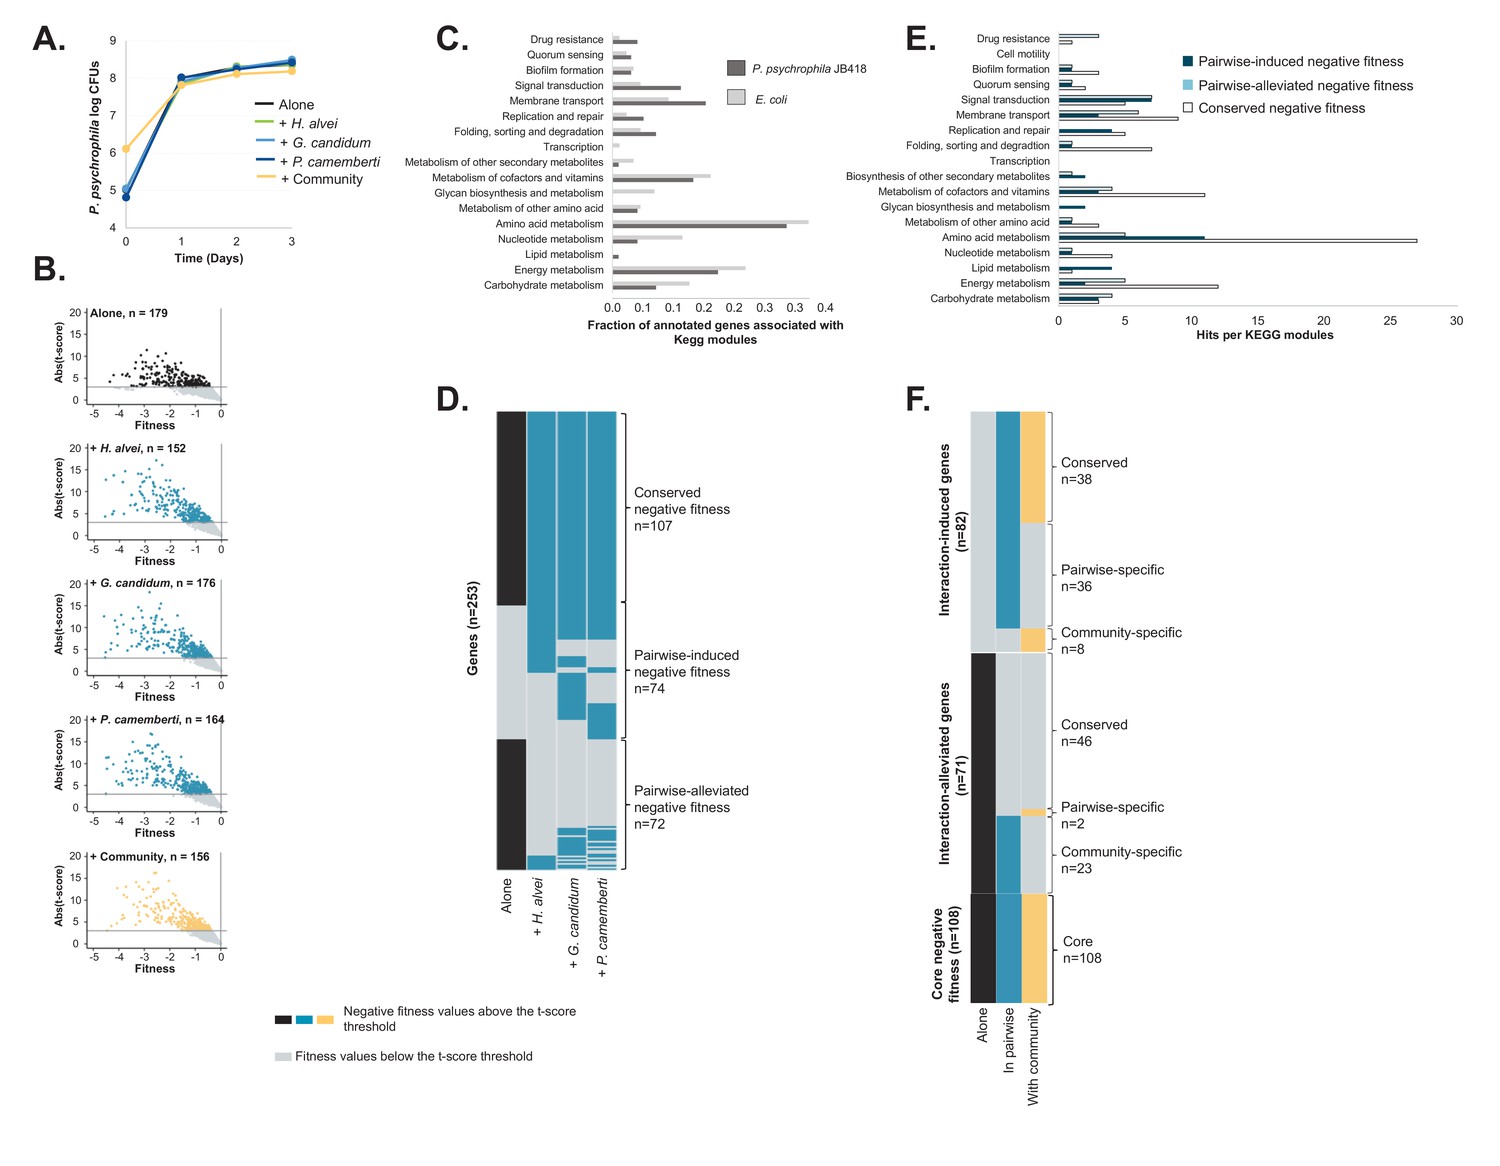
RB-TnSeq experiments using the P. psychrophila JB418 library.
(A) We grew P. psychrophila JB418 alone, in pairwise conditions with H. alvei, G. candidum or P. camemberti and with the full community on CCA. (B) Using the transposon library of P. psychrophila JB418 generated in the laboratory, we identified genes with negative fitness at 1, 2 and 3 days of growth. In each volcanoplot, data from the three timepoints have been grouped. We identified 179 genes important for P. psychrophila JB418, 152 genes important for growth with H. alvei, 176 genes with G. candidum, 164 with P. camemberti and 156 genes important for growth with the community (Source data 5). (C) We annotated P. psychrophila JB418 using KEGG KOALA Blast (Kanehisa et al., 2016). 98 of the 179 genes important for growth alone were attributed a KEGG annotation. To compare the relative importance of functions for growth alone observed for P. psychrophila JB418 and for E. coli we represented, per KEGG module, the ratio between the number of hits for the module and the number of genes with KEGG annotation. (D) For P. psychrophila JB418, we then compared the genes with negative fitness for growth alone and the genes with negative fitness for growth in pairwise. We identified three categories: (i) the core negative fitness: genes with negative fitness for growth alone and all the pairwise conditions, (ii): Pairwise-induced negative fitness: genes with negative fitness in at least one pairwise condition but no negative fitness alone and, (iii): pairwise-alleviated: genes with negative fitness in growth alone and no negative fitness in at least one pairwise condition. (E) We further investigated the KEGG functions associated with the core negative fitness, pairwise-induced negative fitness and pairwise alleviated negative fitness. (F) We then compared the community-induced negative fitness and community-alleviated negative fitness for P. psychrophila JB418 with the pairwise-induced and pairwise-alleviated negative fitness.
-
Figure 1—figure supplement 4—source data 1
RB-TnSeq analysis of P. psychrophila’s growth alone, in pairwise conditions and with the community on 10% cheese curd agar, pH7.
- https://doi.org/10.7554/eLife.37072.008
Figure 1—figure supplement 5
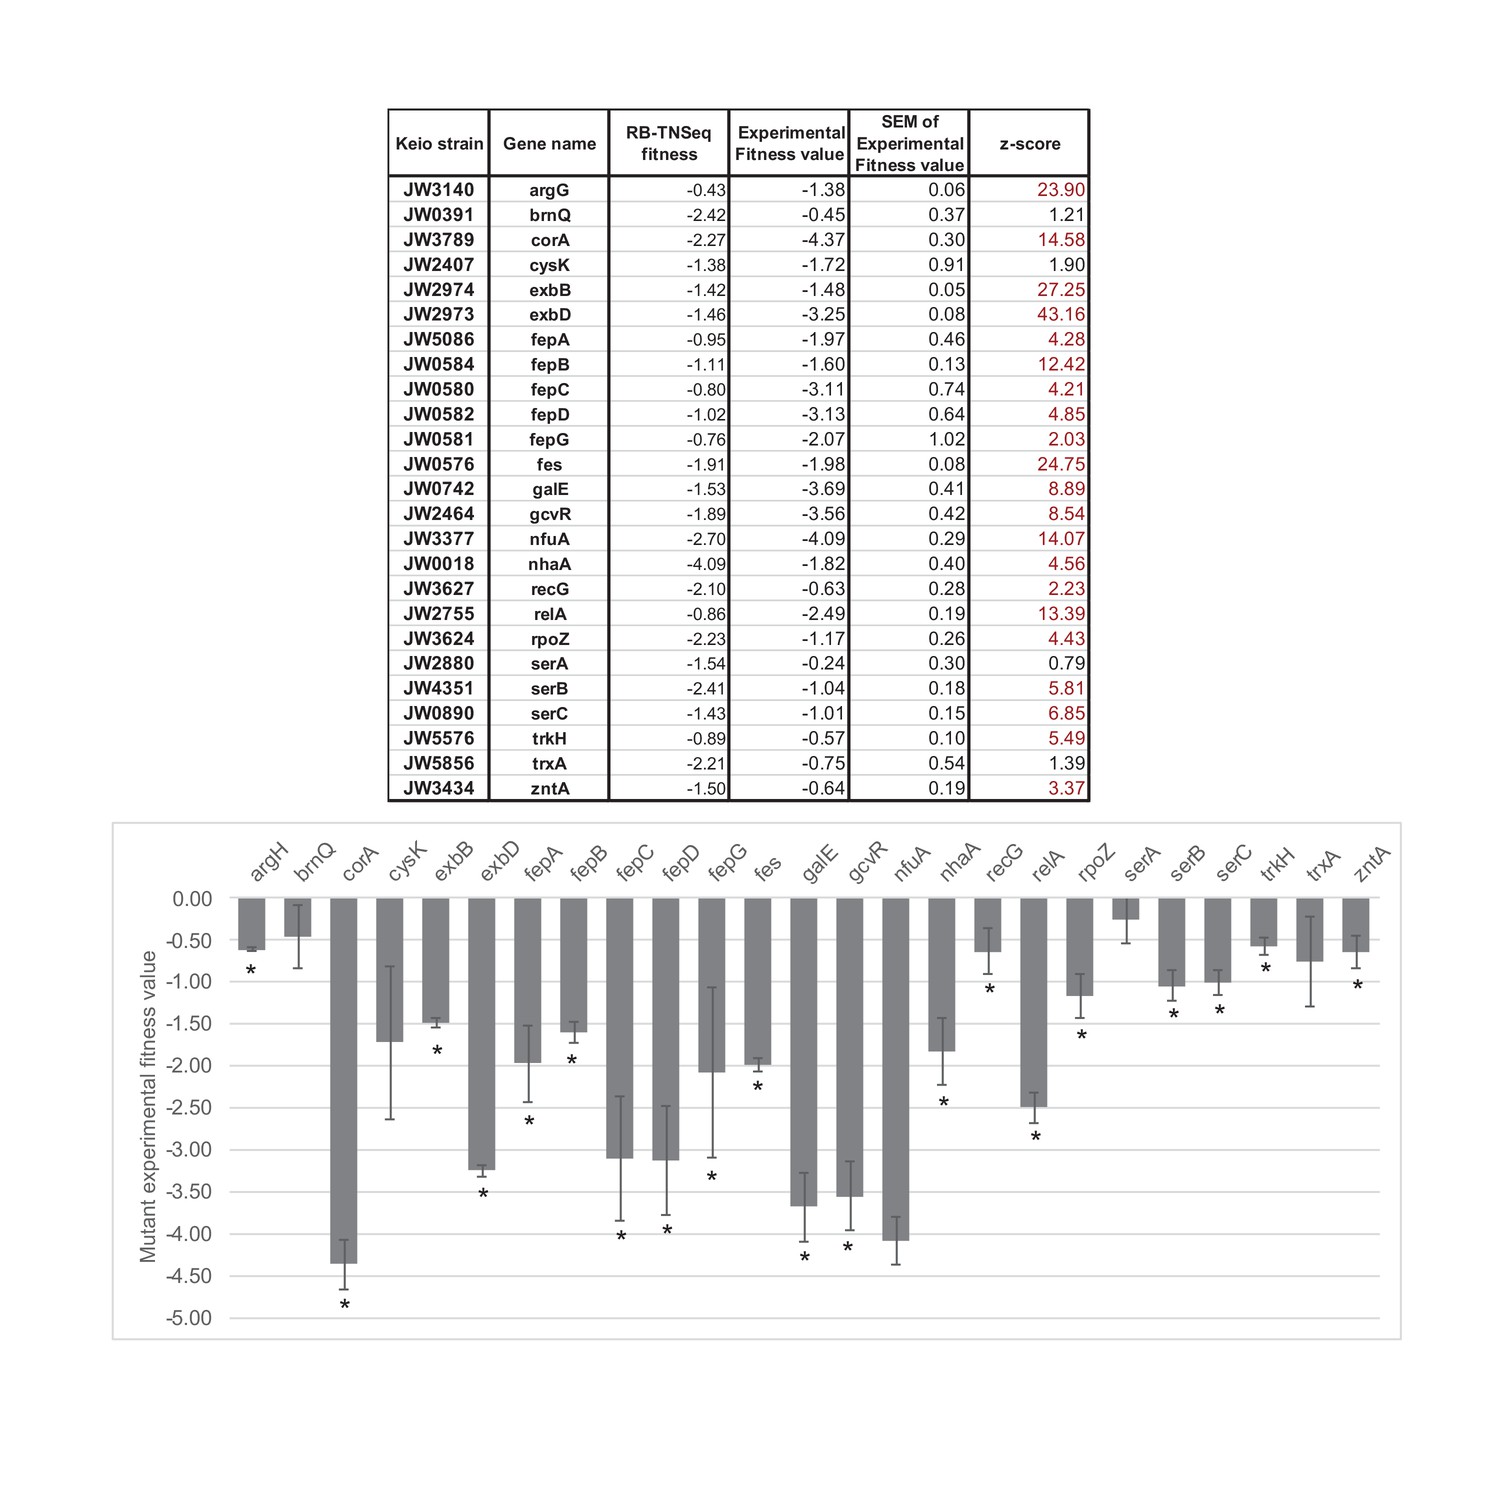
Competitive assays of 25 mutants of the Keio collection (Baba et al., 2006).
Competition assays between single knockouts and the wild-type strain have been carried out for 25 strains associated with genes identified as important for E. coli growth using RB-TnSeq (Significant fitness lower than -1 after 1 day of growth). * highlights fitness values different from 0 with a confidence higher than 95%. The competitive assays were performed in at least triplicates. SEM stands for: standard deviation of the mean: , where is the standard deviation and the number of replicates. Then, where is the experimental fitness value (average of the replicates).
Figure 1—figure supplement 6

Map of the JB418_ECP1 transposon library generated in P. psychrophila JB418.
We built a barcoded-transposon library in the cheese isolate P. psychrophila JB418. 272,329 insertions were mapped to the genome and 143,491 barcodes were located in the central region of a gene. The median of number of insertion mutants per gene is 18, similar to E. coli’s library. 4811 genes have at least one insertion in the central part of the gene, thus the library covers 83% of P. psychrophila JB418 genome. On the chromosome and the plasmids, each bar represents the number of insertions per kb.
Figure 1—figure supplement 7

Quality assessment of all RB-TnSeq experiments.
For each RB-TnSeq experiment different parameters are calculated to assess the quality of each RB-TnSeq experiment. If all quality parameters are met, then the gene fitness values can be further analyzed. These parameters include: (i) median gene has at least 50 counts (gMed ≥50), (ii) the median of the absolute difference in fitness between the two halves of the gene is less or equal to 0.5 (mad12 ≤0.5), (iii) the Spearman correlation in fitness between the two halves of the gene is at least 0.1 (cor12 ≥0.1), (iv) the correlation between gene GC content and fitness is less or equal to 0.2 (gccor ≤0.2), (v) the Spearman correlation of adjacent genes on different insertion mutants is not greater than 0.25 (adjcor ≤0.25), and (vi): the sample is not a T0 sample. More details about these metrics can be found in the supplementary material of Wetmore et al. 2015. All of our RB-TnSeq experiments met the required criteria (quality-test = TRUE).
Figure 2 with 2 supplements

E. coli genes with negative fitness during growth in pairwise conditions (Figure 2—source data 1).
(A) We grew E. coli in pairwise conditions on CCA with either H. alvei, G. candidum or P. camemberti. Asterisks indicate significant differences in growth of E. coli as compared to growth alone at day 3 (Dunnett’s test, adjusted p-value≤5%) (B) Using the E. coli RB-TnSeq library, we identified genes with negative fitness in each pairwise condition at three timepoints (days 1, 2, 3). Each volcano plot shows fitness values of all 3298 genes at all timepoints (three points per gene). We identified 145 genes with a negative fitness in the presence of H. alvei in at least one timepoint, 131 genes in pairwise culture with G. candidum and 142 genes in pairwise culture with P. camemberti. Altogether, they constitute 153 genes with negative fitness in pairwise conditions. (C) Comparing these genes (dark blue) to the 160 genes with a negative fitness during E. coli growth alone (black), we obtained a total of 235 unique genes and identified 78 genes that have a negative fitness both during growth alone and all pairwise conditions (conserved negative fitness), 75 genes that have a negative fitness in at least one pairwise condition but not alone (pairwise-induced negative fitness) and 82 genes with a negative fitness in growth alone but not in at least one pairwise condition (pairwise-alleviated negative fitness). (D) We selected a gene to illustrate conserved negative fitness (corA, 37 insertion mutants), pairwise-induced negative fitness (lpoB, 31 insertion mutants), and to illustrate pairwise-alleviated negative fitness (argH, 50 insertion mutants). For each gene, we display the number of sequencing reads for associated insertion mutants in the T0 sample, in growth alone day 3 and growth with G. candidum day 3. These sequencing reads are the raw data accounting for mutant abundance and used for fitness calculation (f represents each gene's fitness value). While reads are not rarefied in the fitness calculation pipeline, we used rarefied reads for the purpose of the figure. Asterisks indicate genes with significant fitness values (consistent decrease in the number of reads per insertion mutant in the condition compared to T0). (E) We mapped the genes associated with conserved, pairwise-induced, and pairwise-alleviated negative fitness to the KEGG BRITE database. 41/75, 45/82 and 33/77 genes had hits.
-
Figure 2—source data 1
RB-TnSeq analysis of E. coli’s growth in pairwise conditions on 10% cheese curd agar, pH7.
- https://doi.org/10.7554/eLife.37072.016
Figure 2—figure supplement 1
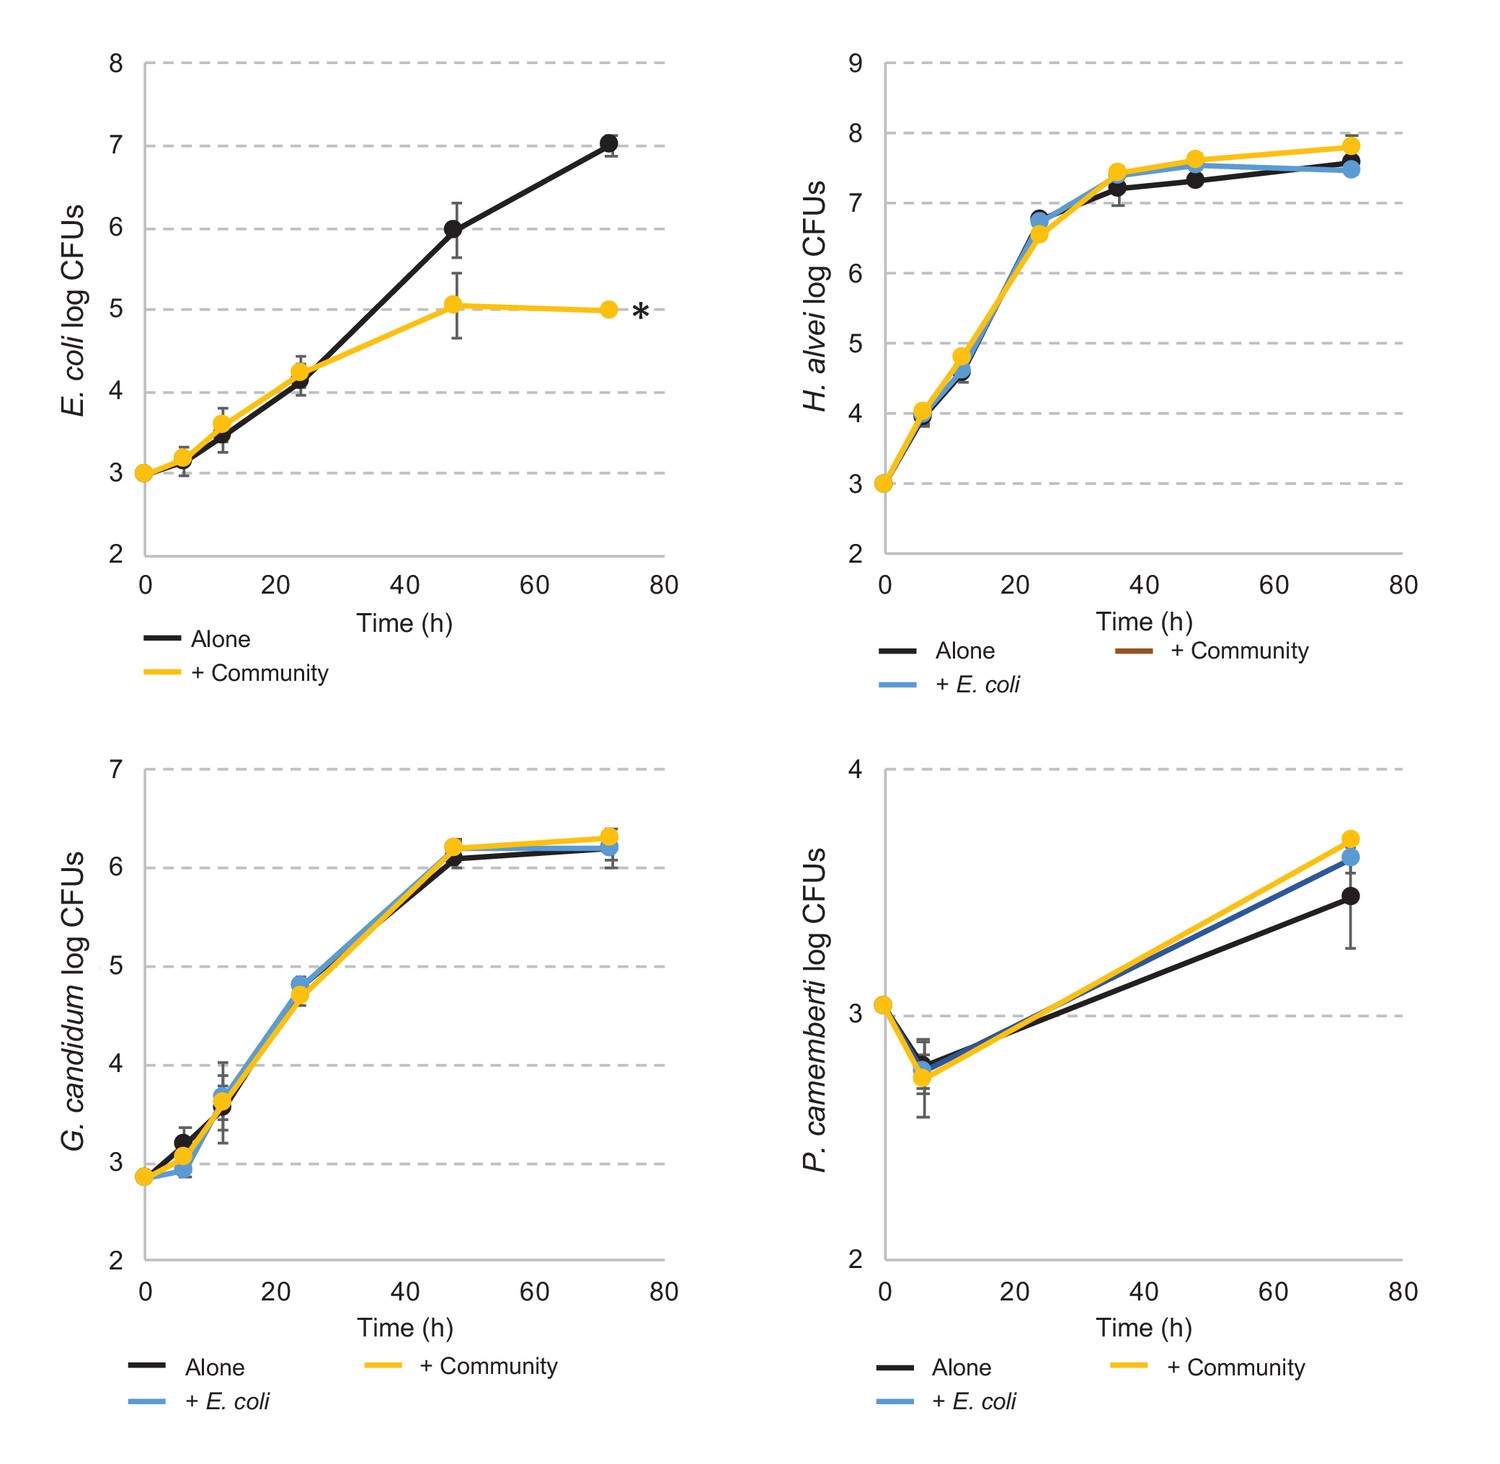
E. coli and community member growth curves alone, in pairwise conditions or during community growth.
Each graph represents the growth over time of E. coli, H. alvei, G. candidum, or P. camemberti alone, in pairwise growth or with the community. Assays have been performed in triplicates. Dunnett's tests have been performed for each species at day three to compare the number of CFUs of that species in interactive conditions versus growth alone. * adjusted p-value≤5%.
Figure 2—figure supplement 2
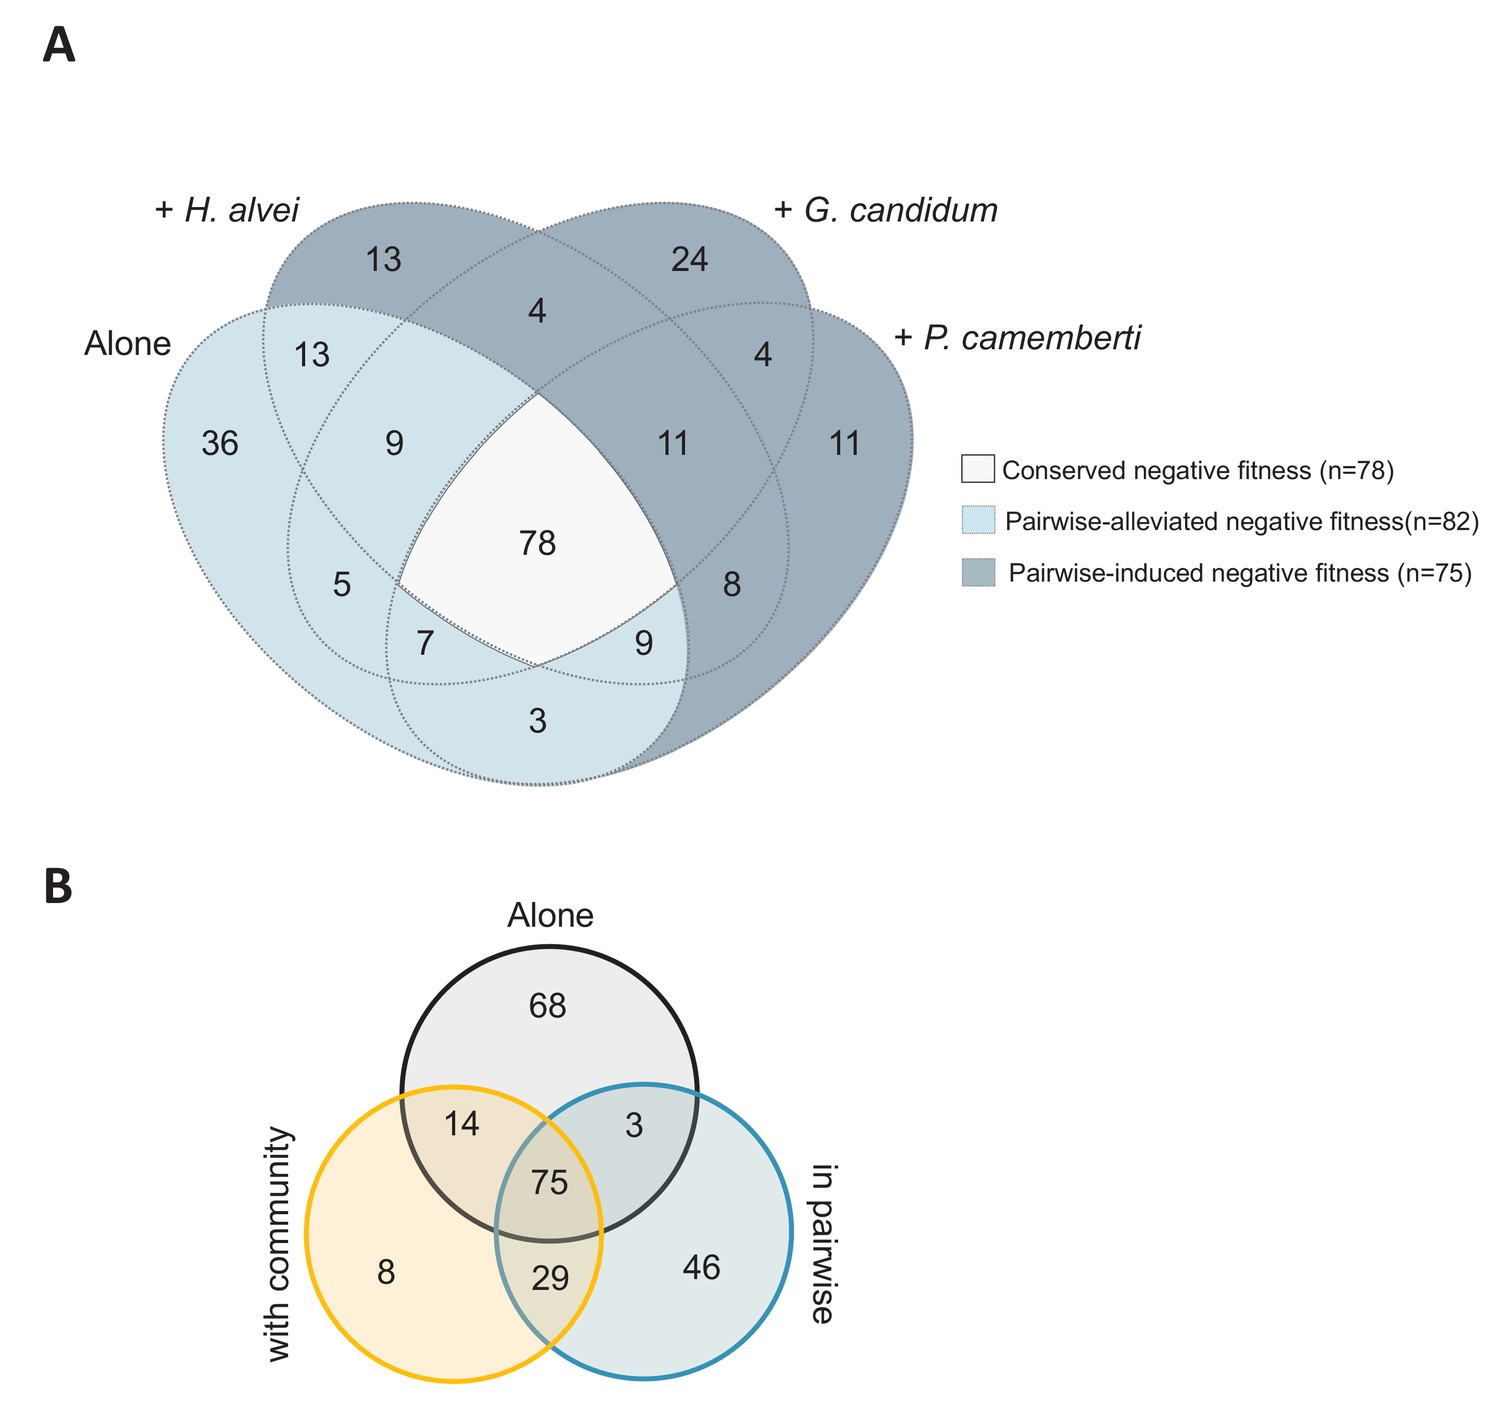
Comparison of the genes important for E. coli growth alone, in each pairwise condition or with the community.
(A) Venn diagram of genes with negative fitness during growth alone or in each pairwise condition. The genes are detailed in Figure 2—source data 1. (B) Venn diagram of genes with negative fitness during growth alone, in pairwise conditions and with the community. The genes are detailed in Figure 3—source data 1.
Figure 3
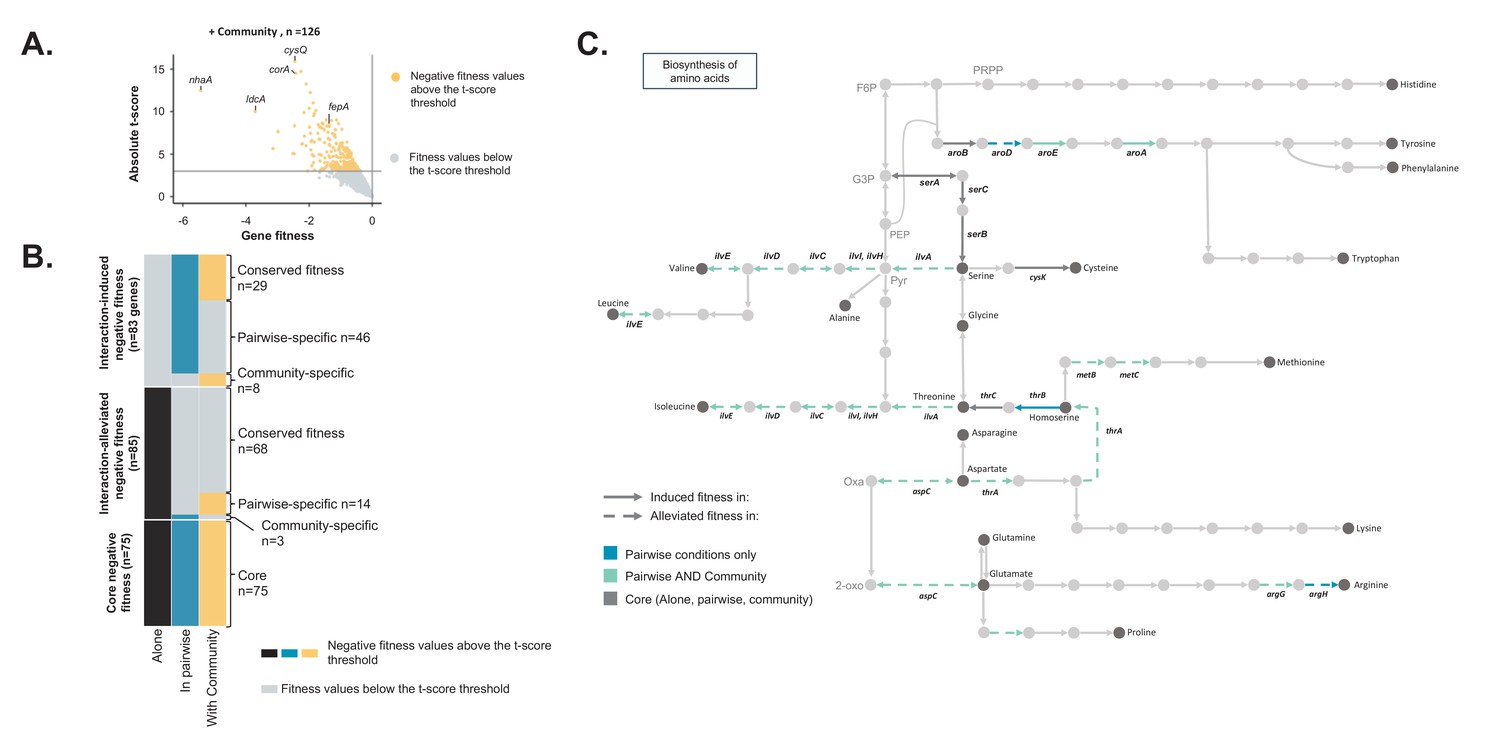
Comparison of E. coli genes with negative fitness within the community and in pairwise conditions (Figure 3—source data 1).
(A) Using the E. coli RB-TnSeq library, we identified genes required to grow with the community (H. alvei + G. candidum + P. camemberti). During growth with the community, we identified a total of 126 genes with a negative fitness. (B) We compared the pairwise-induced and community-induced genes (Interaction-induced genes) as well as the pairwise-alleviated and community-alleviated genes (Interaction-alleviated genes) to identify conservation of interactions from pairwise to community and emergence of higher-order interactions. (C) Within the alleviated negative fitness, genes associated with numerous amino acid biosynthetic pathways were identified. F6P: fructose-6-phosphate, PRPP: 5-phospho-ribose-1-di-phosphate, G3P: Glyceraldehyde-3-phosphate, PEP: phosphoenol-pyruvate, Pyr: Pyruvate, Oxa: Oxaloacetate, 2-oxo: 2-oxoglutarate.
-
Figure 3—source data 1
RB-TnSeq analysis of E. coli’s growth with the community on 10% cheese curd agar, pH7.
- https://doi.org/10.7554/eLife.37072.018
Figure 4 with 1 supplement

Differential expression analysis of E. coli during interactive and non-interactive growth conditions (Figure 4—source data 1).
We used RNASeq to investigate E. coli gene expression at three timepoints (1, 2 and 3 days) during growth on CCA alone, in pairwise conditions (with H. alvei, G. candidum or P. camemberti) and with the community. (A) Using DESeq2 (Love et al., 2015), we identified up and downregulated genes during growth in each pairwise condition compared to growth alone as well as up and downregulated genes during growth with the community compared to growth alone. Differential expression analysis has been performed at three timepoints, however, we displayed the results of the three timepoints on a single volcano plot. Only genes associated with an adjusted p-value lower than 1% (Benjamini-Hochberg correction for multiple testing) and an absolute logFC higher than one were considered differentially expressed. (B) We regroup any genes upregulated in at least one pairwise condition as a single set of pairwise-upregulated genes and did the same for pairwise-downregulated genes. Then, we performed functional enrichment analysis on KEGG pathways for pairwise-downregulated genes, community-downregulated genes, pairwise-upregulated genes and community-upregulated genes. Functional enrichment was performed using the R package clusterProfiler (Yu et al., 2012) and only the KEGG pathways enriched with an adjusted p-value lower than 5% (Benjamini-Hochberg correction for multiple testing) were considered. (C) We compared pairwise-upregulated genes with community-upregulated genes and pairwise-downregulated genes with community-downregulated genes to identify if expression regulation from pairwise conditions is conserved in the community context and if we observe specific changes in pairwise or community conditions. (D) Within the genes specifically upregulated during growth with the community, we observed the upregulation of multiple genes associated with the nitrogen starvation response. Most of these genes were also downregulated in pairwise conditions.
-
Figure 4—source data 1
Differential expression analysis of E. coli’s growth in pairwise and with the community versus growth alone.
- https://doi.org/10.7554/eLife.37072.021
Figure 4—figure supplement 1
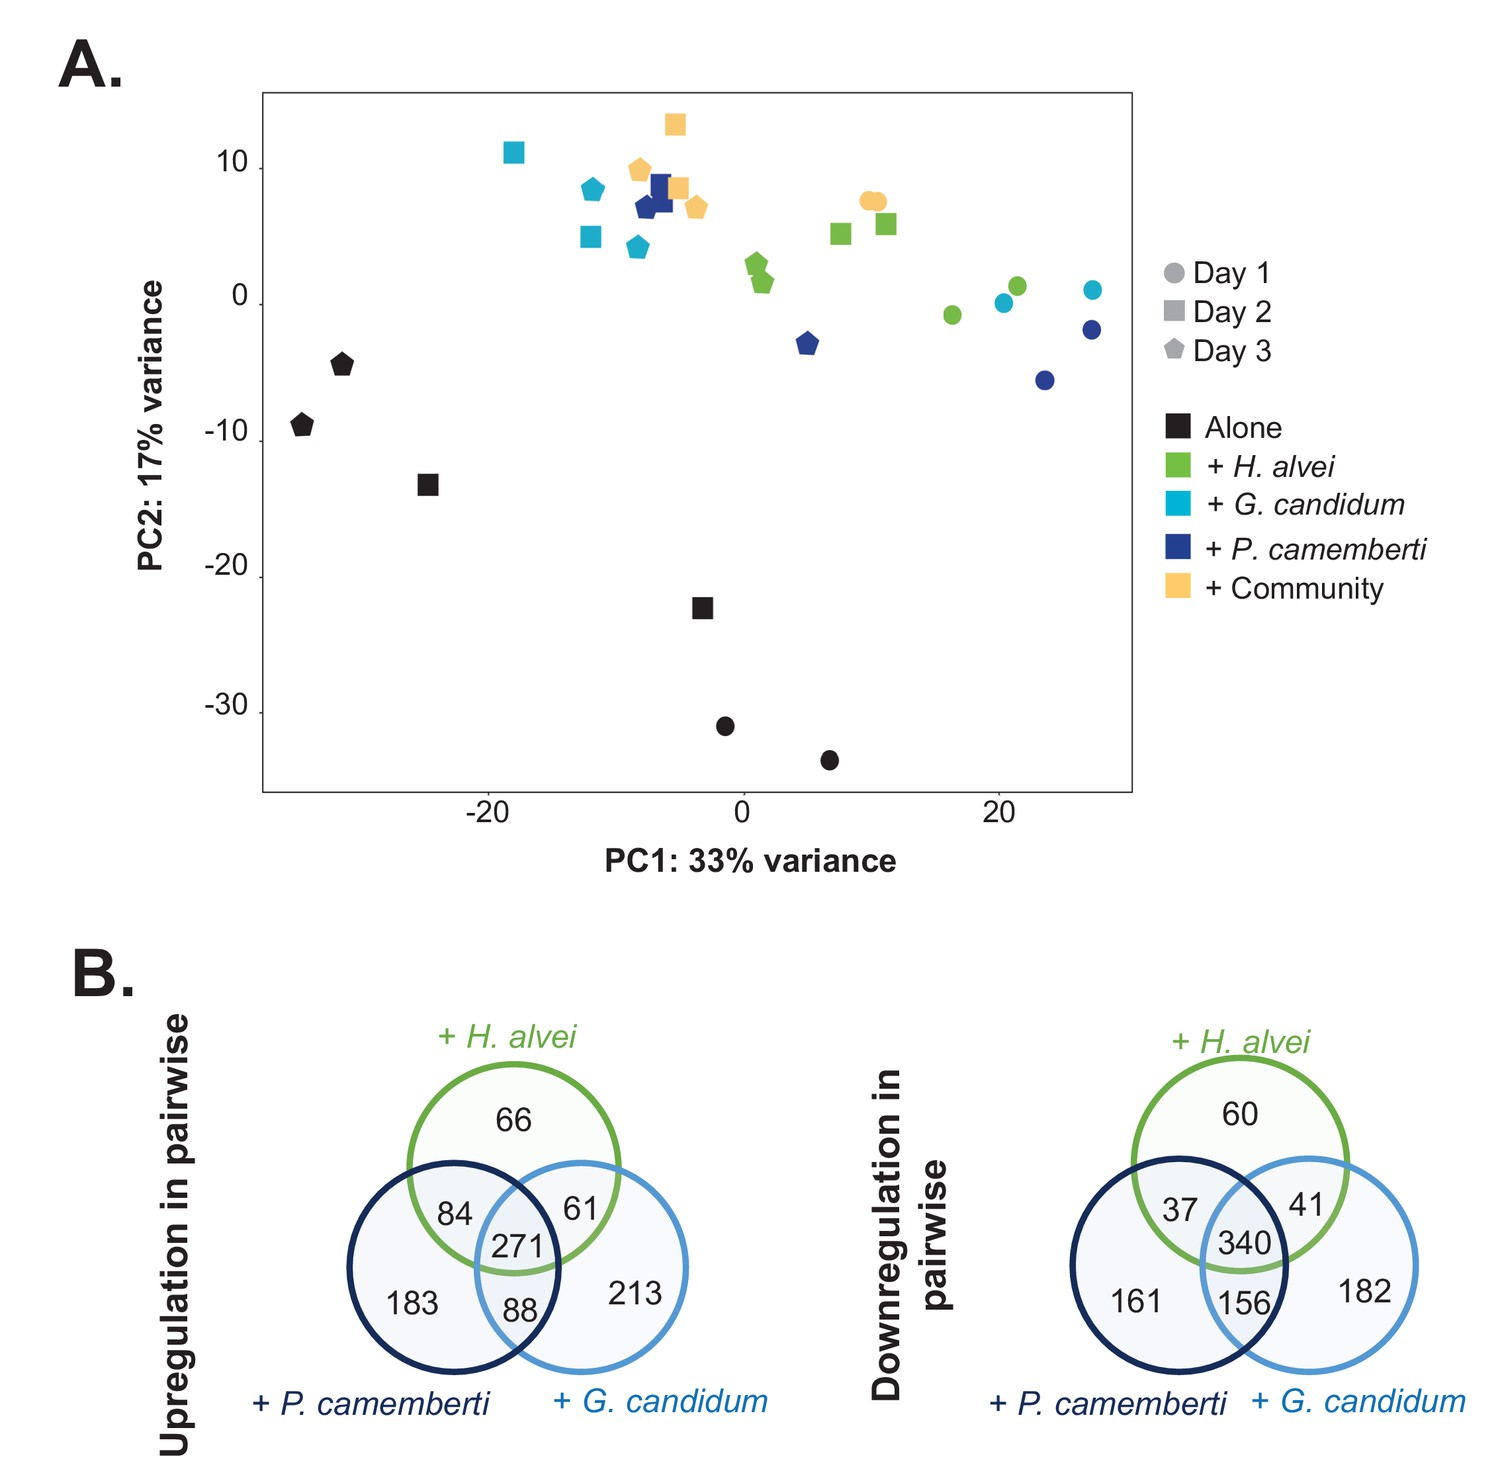
RNASeq analysis of E. coli gene expression during growth alone and in pairwise conditions.
We used RNASeq to investigate E. coli gene expression at three timepoints (1, 2 and 3 days) during growth on CCA alone, in pairwise conditions (with H. alvei, G. candidum or P. camemberti) and with the community. (A) We carried out a principal component analysis on the rlog transformed expression data (Love et al., 2015). (B) For each pairwise condition, we identified up and downregulated genes compared to alone at each timepoint. Then, for each pairwise condition, we pooled together upregulated genes at any timepoint and did the same for downregulated genes. Comparing the up or downregulated genes in the different pairwise conditions, we observe overlapping as well as specific responses depending on the partner.
Author response image 1
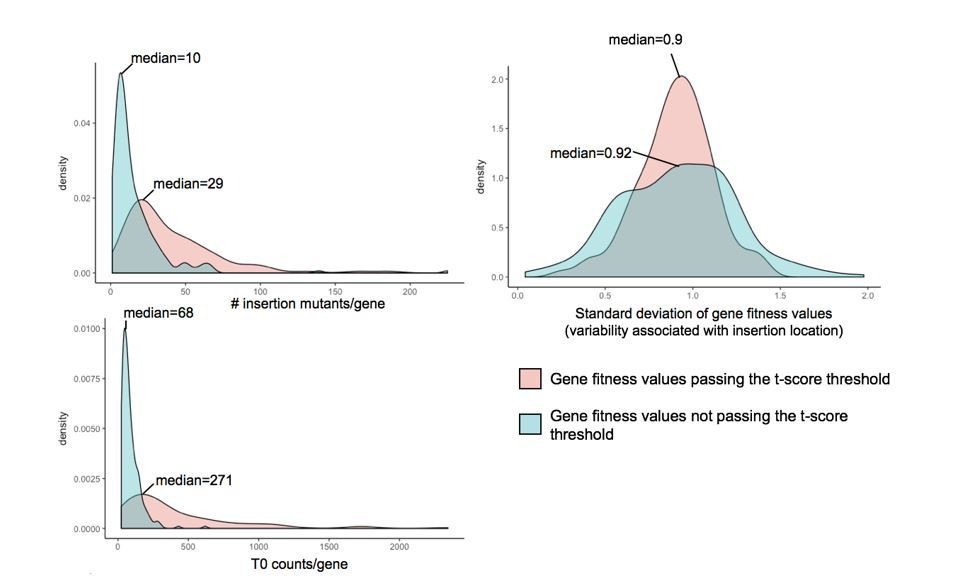
Investigation of parameters potentially influencing variability in gene fitness calculation.
Here, we compare (i) the number of insertion mutants/gene, (ii) the number of counts/gene in the T0 sample and (iii) the variability associated with insertion location, for genes with fitness values that pass the t-score threshold and genes with strong fitness values (fitness values >0.5 or <-0.5) that don’t pass the t-score threshold.
Author response image 2
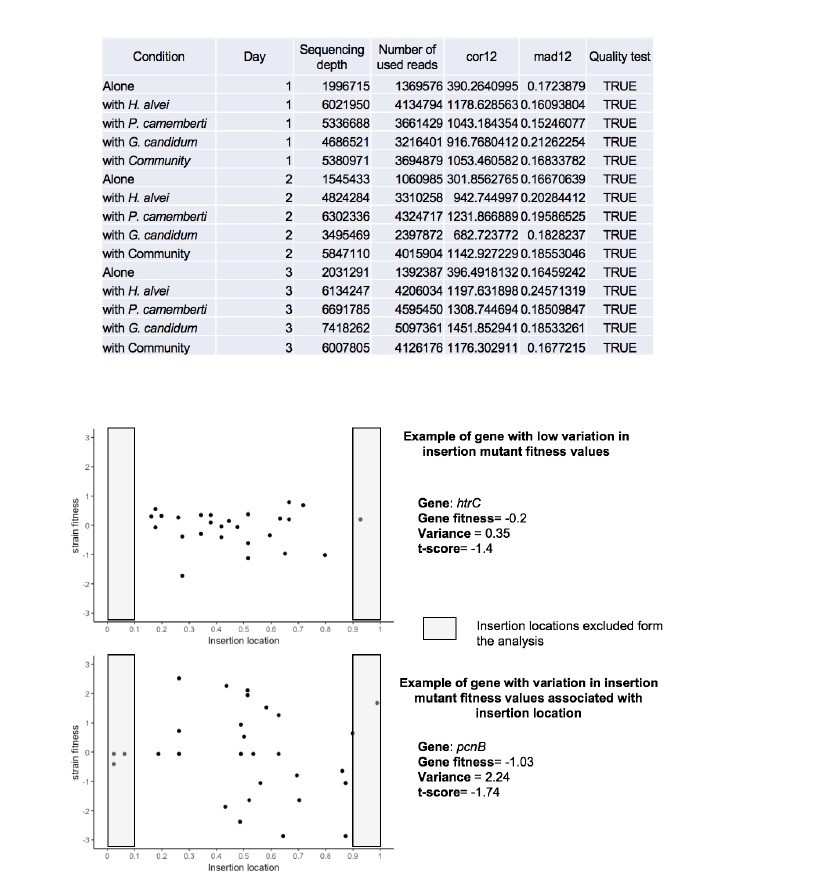
Insertion location and variability of gene fitness values.
Upper-part: Quality parameters generated along with gene fitness calculation indicate low variability in gene fitness values associated with insertion location. Lower-part: Examples of insertion mutants’ fitness as a function of the insertion location in the gene showing low (plot1) and high (plot2) variability due to insertion location.
Tables
Key resources table
| Reagent type (species) or resource | Designation | Source or reference | Identifiers | Additional information |
|---|---|---|---|---|
| Library, strain background (Escherichia coli K12) | Keio collection | PMID: 16738554 | CGSC, RRID:SCR_002303 | Collection of 3,818 E. coli knockout strains |
| Library, strain background (Escherichia coli K12) | Keio_ML9 | PMID: 25968644 | RB-TnSeq library of E. coli K12 BW25113 (152,018 pooled insertion mutants) | |
| Library, strain background (Pseudomonas psychrophila) | JB418_ECP1 | this paper | RB-TnSeq library generated in the P. psychrophila JB418 strain isolated from cheese (272,329 pooled insertion mutants) | |
| Strain, strain background (Escherichia coli K12) | Keio ME9062 | PMID: 16738554 | CGSC#: 7636 | Parent strain of the Keio collection mutants. Also referred as E. coli K12 BW25113 |
| Strain, strain background (Hafnia alvei) | Hafnia alvei JB232 | this paper | Strain isolated from cheese | |
| Strain, strain background (Geotrichum candidum) | Geotrichum candidum | Danisco - CHOOZIT | GEO13 LYO 2D | Industrial starter for cheese production |
| Strain, strain background (Penicillium camemberti) | Penicllium camemberti | Danisco - CHOOZIT | PC SAM 3 LYO 10D | Industrial starter for cheese production |
| Strain, strain background (P. psychrophila) | Pseudomonas psychrophila JB418 | this paper | Strain isolated from cheese | |
| Strain, strain background (E. coli) | E. coli APA766 | PMID: 25968644 | donor WM3064 which carries the pKMW7 Tn5 vector library containing 20 bp barcodes | |
| Sequence-based reagent | NEBNext Multiplex Oligos for Illumina (Set 1); NEBNext multiplex Oligos for Illumina (Set 2) | New England Biolabs | NEB #E7335 (lot 0091412);, NEB #E7500 (lot 0071412) | |
| Sequence-based reagent | Nspacer_barseq_pHIMAR; P7_MOD_TS_index3 primers | PMID: 25968644 | Primers for transposon-insertion sites amplication for P. psychrophila RB-TnSeq library characterization | |
| Sequence-based reagent | BarSeq_P1; BarSeq_P2_ITXXX | PMID: 25968644 | Primers for RB-TnSeq PCR (amplification of the barcode region of the transposon) | |
| Commercial assay or kit | NEBNext Ultra DNA Library Prep Kit for Illumina | New England Biolabs | NEB #E7645 | |
| Commercial assay or kit | MinElute purification kit | Qiagen | ID:28004 | |
| Commercial assay or kit | Turbo DNA-free kit | AMBION, Life Technologies | AM1907 | |
| Commercial assay or kit | MEGAclear Kit Purification for Large Scale Transcription Reactions | AMBION, Life Technologies | AM1908 | |
| Commercial assay or kit | Ribo-Zero rRNA removal kit (bacteria); Ribo-Zero rRNA removal kit (yeast) | Illumina | MRZMB126; MRZY1306 | |
| Commercial assay or kit | NEBNextUltraTM RNA Library Prep Kit for Illumina | New England Biolabs | NEB #E7770 | |
| Software, algorithm | Geneious | http://www.geneious.com | ||
| Software, algorithm | Perl | https://www.perl.org/ | ||
| Software, algorithm | R | https://www.r-project.org/ | ||
| Other | MapTnSeq.pl; DesignRandomPool.pl; BarSeqTest.pl | PMID: 25968644 | Perl scripts for RB-TnSeq library characterization and RB-TnSeq analysis - https://bitbucket.org/berkeleylab/feba | |
| Other | DESeq2 | PMID: 25516281 | R package for RNASeq analysis |
Table 1
E. coli strains used during the study.
https://doi.org/10.7554/eLife.37072.022| Experiment | E. coli strain(s) | Reference |
|---|---|---|
| RB-TnSeq | E. coli Keio_ML9 library | (Wetmore et al., 2015) |
| Growth assays | E. coli JW0024 strain (undisrupted mutant) | (Baba et al., 2006) |
| Competition assays | WT: Keio ME9062 Mutants: (Figure 1—figure supplement 5) | (Baba et al., 2006) |
Table 2
Organization of CFU’s quantification for growth assays.
https://doi.org/10.7554/eLife.37072.023| E. coli + H. alvei JB232 | LB (E. coli + H. alvei JB232 CFUs) LB-kanamycin (50 µg/ml) (E. coli CFUs) |
|---|---|
| E. coli + G. candidum | LB-kanamycin:cycloheximide (50 µg/ml and 10 µg/ml) (E. coli CFUs) LB-chloramphenicol (G. candidum CFU’s) |
| E. coli + P. camemberti | LB-kanamycin:cyclohexamide (50 µg/ml and 10 µg/ml) (E. coli CFUs) LB-chloramphenicol (50 µg/ml)(P. camemberti CFU’s) |
| E. coli + Community | LB-cyclohexamide (10 µg /mL) (E. coli and H. alvei JB232 CFU’s), LB-kanamycin:cyclohexamide (50 µg/ml and 10 µg/ml) (E. coli CFU’s) and LB-chloramphenicol (50 µg/ml) (G. candidum and P. camemberti CFU’s) |
Additional files
-
Supplementary file 1
Differential expression analysis of E. coli growth in community versus pairwise conditions.
We used RNASeq to investigate changes in E. coli gene expression between growth in the community and in each pairwise conditions (with H. alvei, G. candidum or P. camemberti). Using DESeq2 (Love et al., 2015), we identified up and downregulated genes during growth in community versus growth in each pairwise condition individually. Only genes associated with an adjusted p-value lower than 1% (Benjamini-Hochberg correction for multiple testing) and an absolute log of fold change higher than one were considered differentially expressed.
- https://doi.org/10.7554/eLife.37072.024
-
Transparent reporting form
- https://doi.org/10.7554/eLife.37072.025
Download links
A two-part list of links to download the article, or parts of the article, in various formats.
Downloads (link to download the article as PDF)
Open citations (links to open the citations from this article in various online reference manager services)
Cite this article (links to download the citations from this article in formats compatible with various reference manager tools)
Changes in the genetic requirements for microbial interactions with increasing community complexity
eLife 7:e37072.
https://doi.org/10.7554/eLife.37072


