Lysine-14 acetylation of histone H3 in chromatin confers resistance to the deacetylase and demethylase activities of an epigenetic silencing complex
- Brigham and Women’s Hospital, United States
- Harvard Medical School, United States
- Johns Hopkins University School of Medicine, United States
- University of Leicester, United Kingdom
Figures
Figure 1

The CoREST complex and its H3 substrate histone modifications.
(A) The CoREST complex (LHC) represses gene transcription by erasing histone modifications on nucleosomes. LSD1 demethylates H3K4me2 and HDAC1 deacetylates multiple Kac sites on histones which are activating marks. (B) The sequence of the N-terminal histone H3 tail and the Kme2 and Kac modifications studied in this paper. The short recognition sequence of F40 sortase is labelled in green.
Figure 2 with 3 supplements
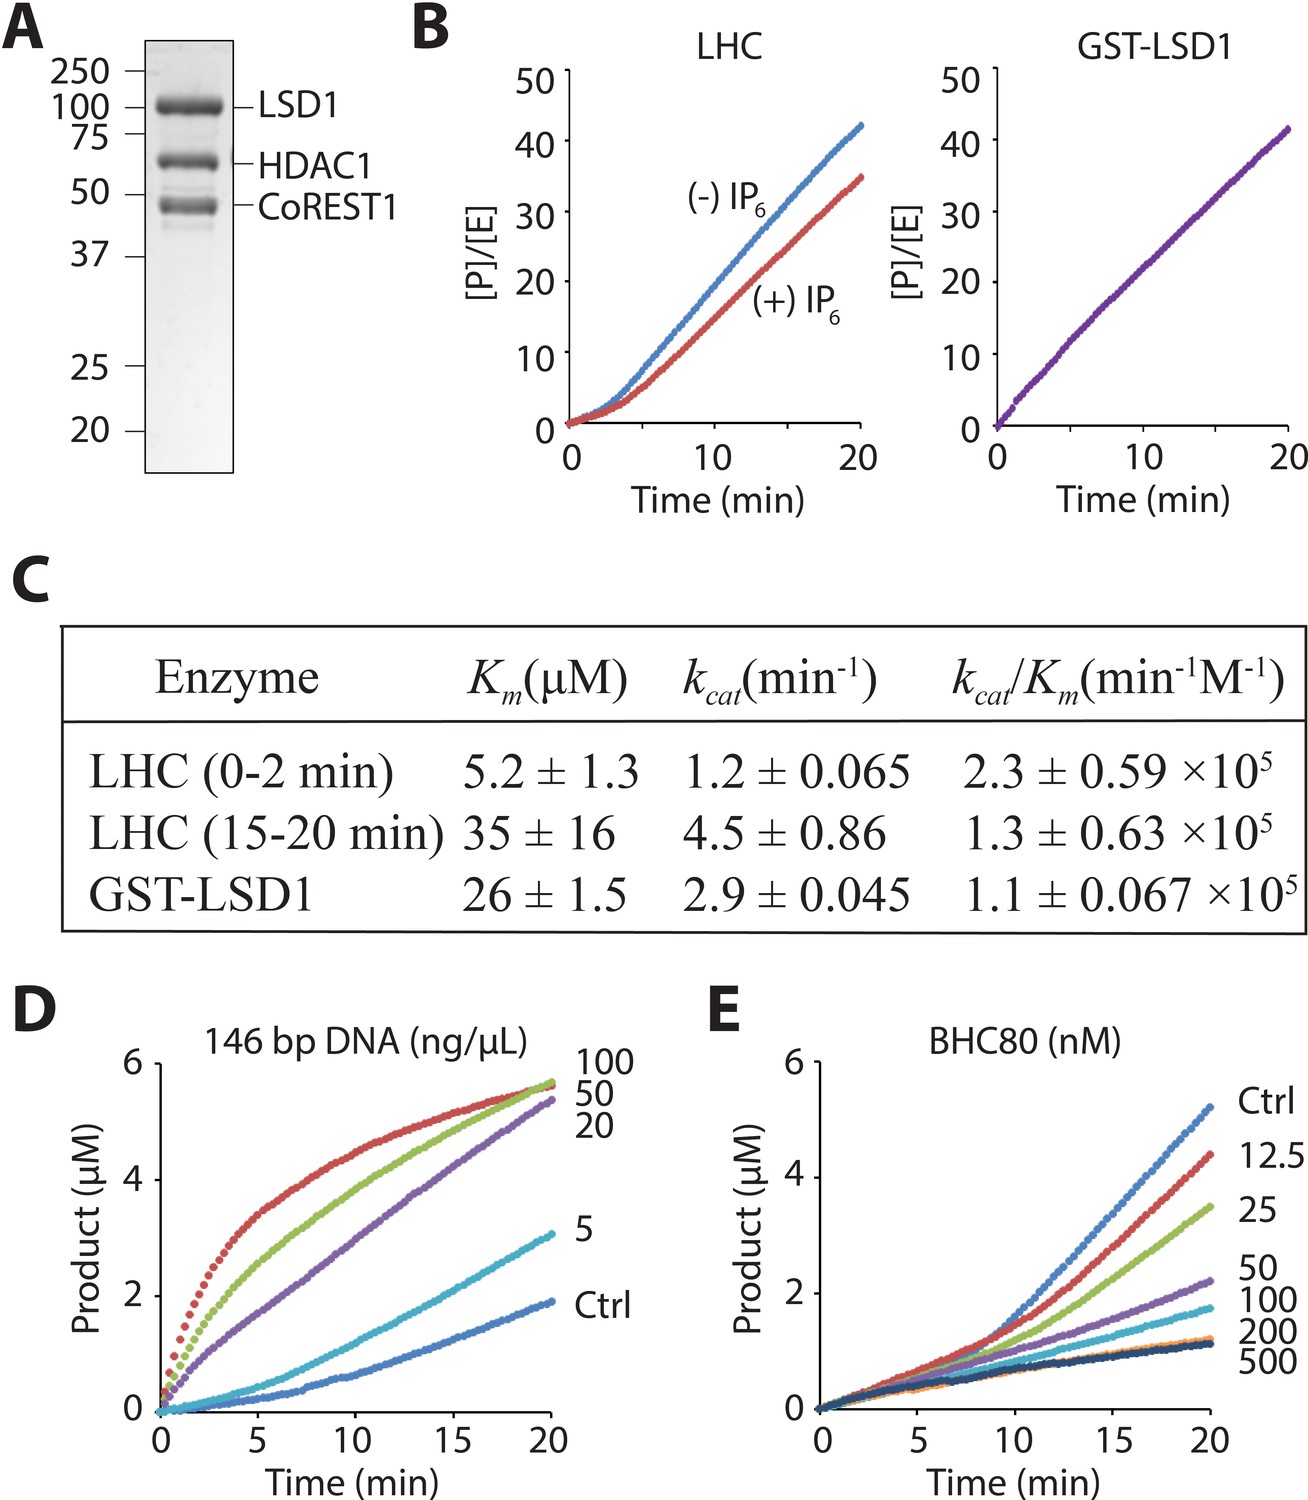
LHC purity and its demethylase activity with H3 tail peptide substrate.
(A) Coomassie-stained SDS-PAGE of the purified ternary CoREST complex LHC. (B) Demethylation of 100 μM H3K4me2 H3 tail peptide (aa1-21) peptide by LHC (130 nM) exhibits a bi-phasic activity. In the presence of 100 μM InsP6, the first phase becomes longer. In contrast, the demethylation by GST-LSD1 (88 nM) exhibits a linear activity that best matches the second phase of LHC as shown in panel C. The y-axis is shown as [Product]/[Enzyme]. (C) Summary of the steady-state kinetic parameters of peptide demethylation by LHC and GST-LSD1. (p<0.05 for Km and p<0.005 for kcat of the first phase vs. the second phase); (n = 3 for all measurements); kinetic parameters shown are ± S.E.M. (D) DNA accelerates the peptide demethylation by LHC (50 nM) in a dose dependent manner. (E) BHC80 modulates the peptide demethylation by LHC (100 nM), altering the bi-phasic activity (>100 nM).
Figure 2—figure supplement 1
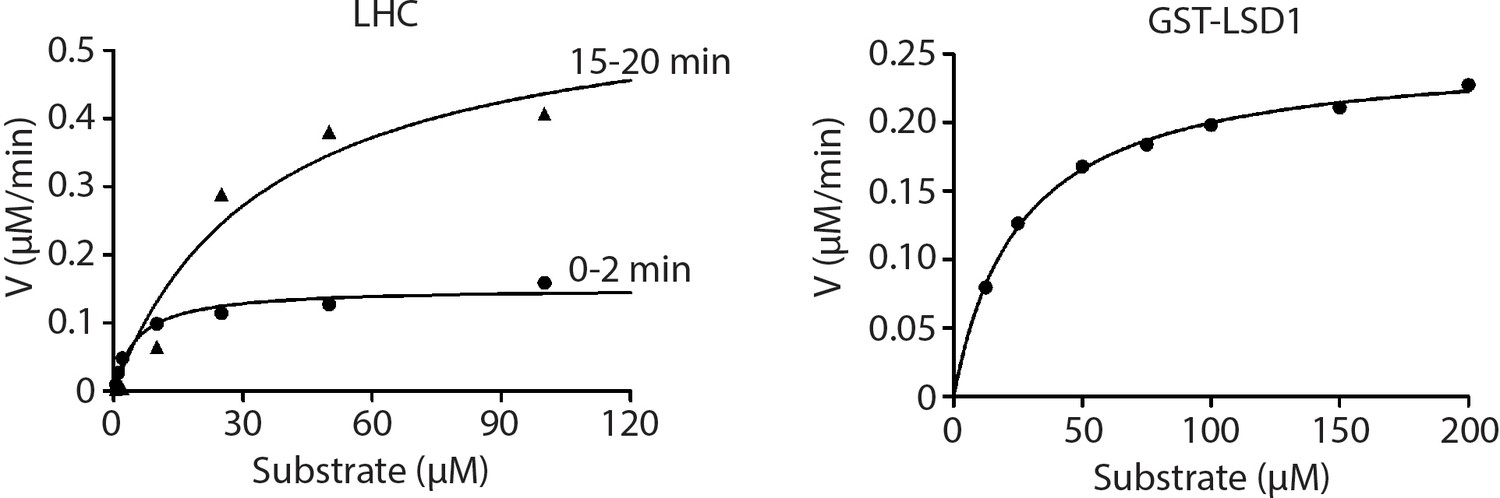
Non-linear curve fitting to the Michaelis–Menten equation was used to calculate the observed Km and kcat values of LHC and GST-LSD1.
(n = 3 for all measurements).
Figure 2—figure supplement 2
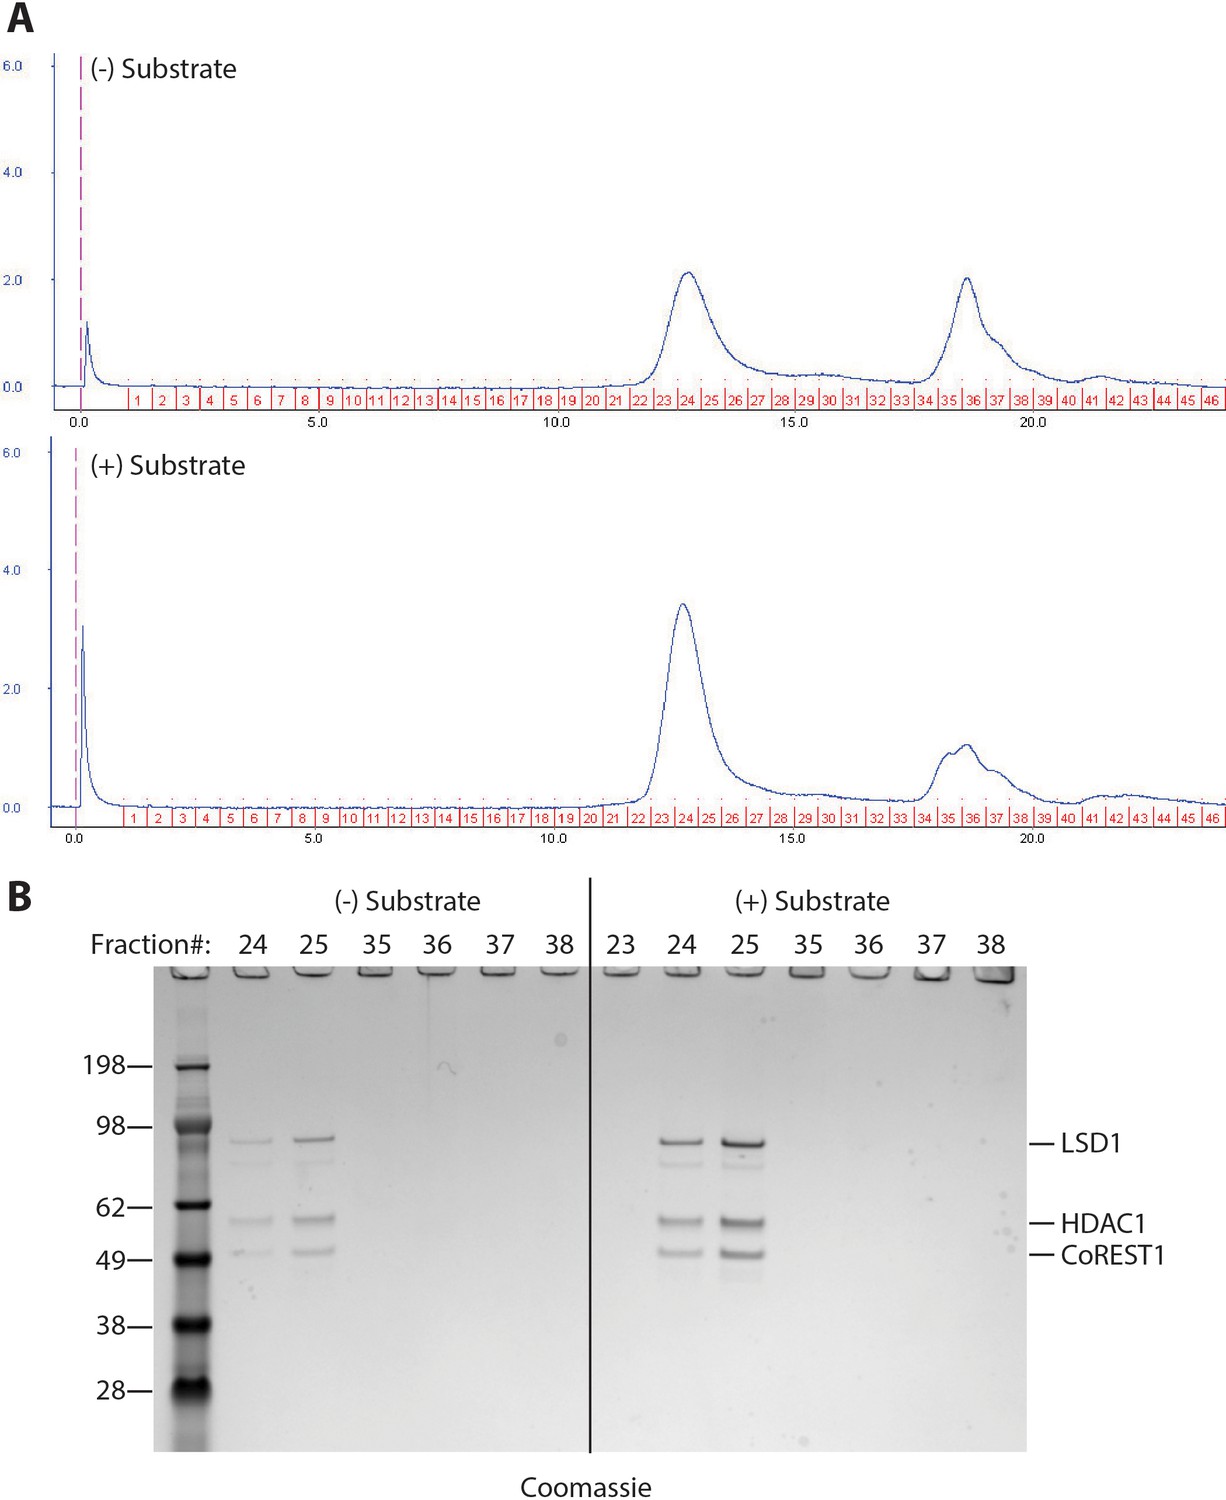
Size exclusion chromatography analysis of LHC after the demethylase reaction.
(A) Size exclusion chromatography analysis of the demethylation mixture after 20 min reaction at 25°C with LHC (200 nM) and H3 peptide substrate (60 μM). (B) SDS-PAGE analysis of the fractions from size exclusion chromatography. It demonstrated that the complex was still intact after the 20 min demethylation reaction.
Figure 2—figure supplement 3
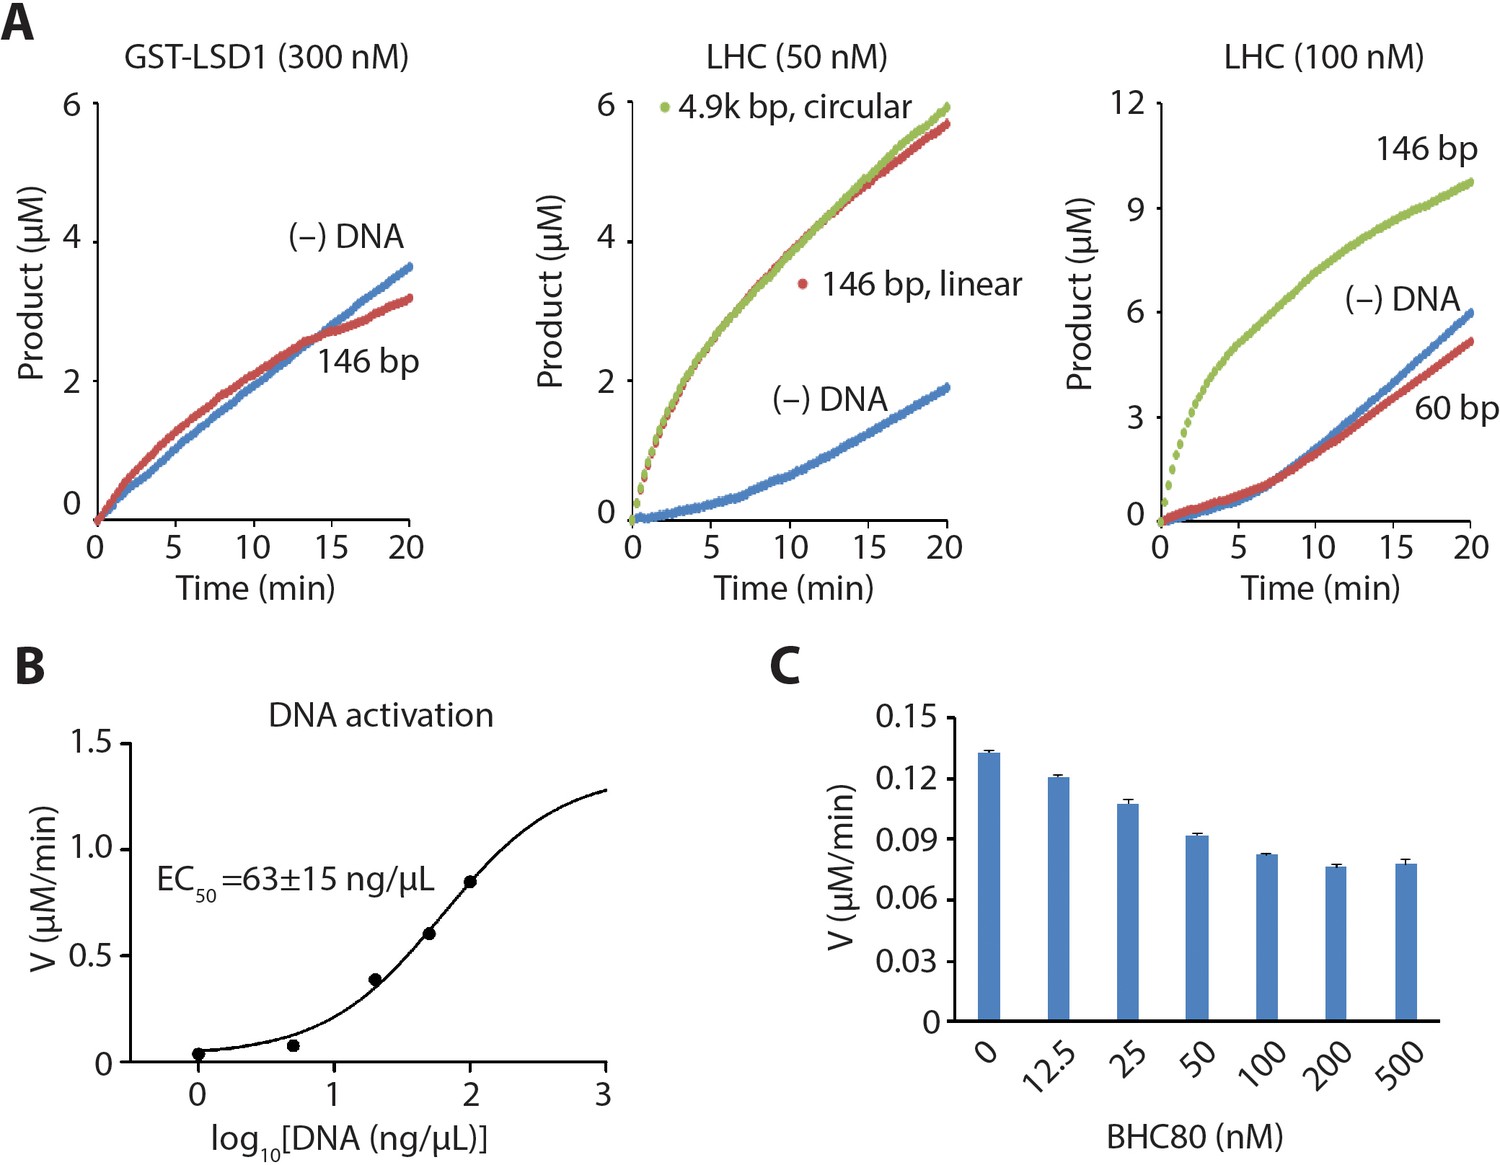
LHC demethylase activity with H3 tail peptide substrate in the presence of DNA or BHC80.
(A) dsDNA (146 bp, 50 ng/μL) addition did not alter the rate of the demethylation of H3K4me2 21aa peptide (60 μM) by GST-LSD1 (300 nM) (left). dsDNA (146 bp or 4.9 kb, 50 ng/μL) effects on H3K4me2 21aa peptide demethylation by LHC (50 nM) (middle). 60 bp dsDNA (100 ng/μL) did not alter the rate of the demethylation (right). (B) The dose-response relationship of the rate of demethylation of H3K4me2 21aa peptide (60 µM) by LHC (50 nM) vs DNA concentration. The estimated EC50 is shown. (C) Effects of BHC80 (aa331-430) on LHC (100 nM) catalyzed demethylation of H3K4me2 21aa peptide (60 µM); (n = 2 for all measurements).
Figure 3 with 1 supplement
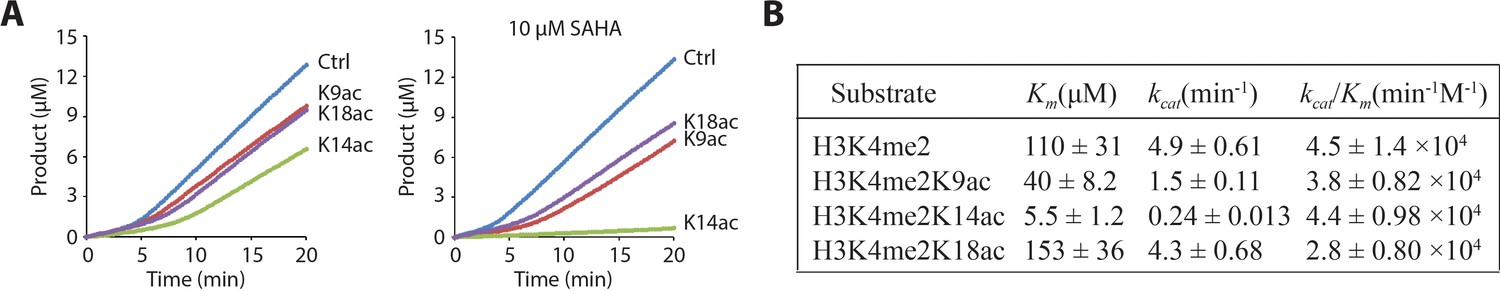
LHC demethylase activity with H3 tail peptide substrates containing Kac.
(A) Comparison of LHC-catalyzed demethylation of 100 μM peptide substrate with H3K4me2 (Ctrl), H3K4me2K9ac (K9ac), H3K4me2K14ac (K14ac), and H3K4me2K18ac (K18ac) by 100 nM LHC. The four substrates were also analyzed in the presence of 10 μM SAHA. (B) Summary of the steady-state kinetic parameters based on the initial phase (0–2 min) of the reactions in the presence of SAHA. (p<0.005 for Km and kcat of H3K4me2 peptide vs. H3K4me2K14ac peptide substrates); (n = 3 for all measurements) error bars represent S.E.M.; kinetic parameters are shown ± S.E.M.
Figure 3—figure supplement 1
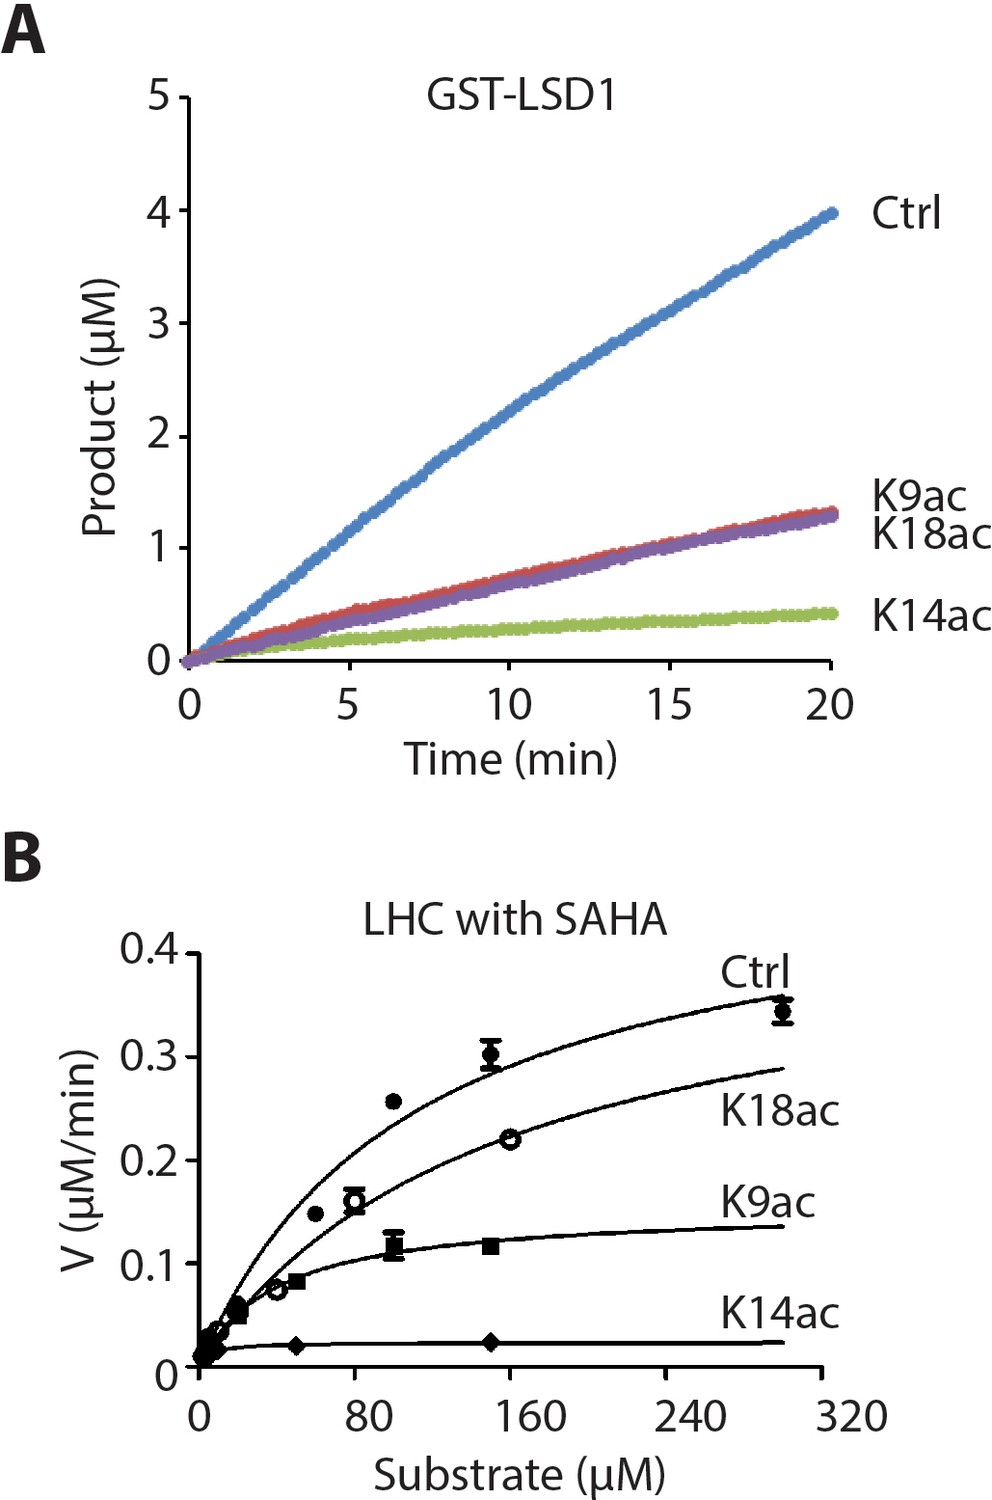
Isolated LSD1 demethylase activity with H3 tail peptide substrates containing Kac.
(A) Comparison of GST-LSD1-catalyzed demethylation of 150 μM peptide substrate with H3K4me2 (Ctrl), H3K4me2K9ac (K9ac), H3K4me2K14ac (K14ac), and H3K4me2K18ac (K18ac) by 110 nM GST-LSD1. (n = 2 for the measurements) (B) Non-linear curve fitting to the Michaelis-Menten equation was used to calculate the observed Km and kcat values of the first phase in the presence of 10 μM SAHA; (n = 3 for the measurements).
Figure 4 with 4 supplements
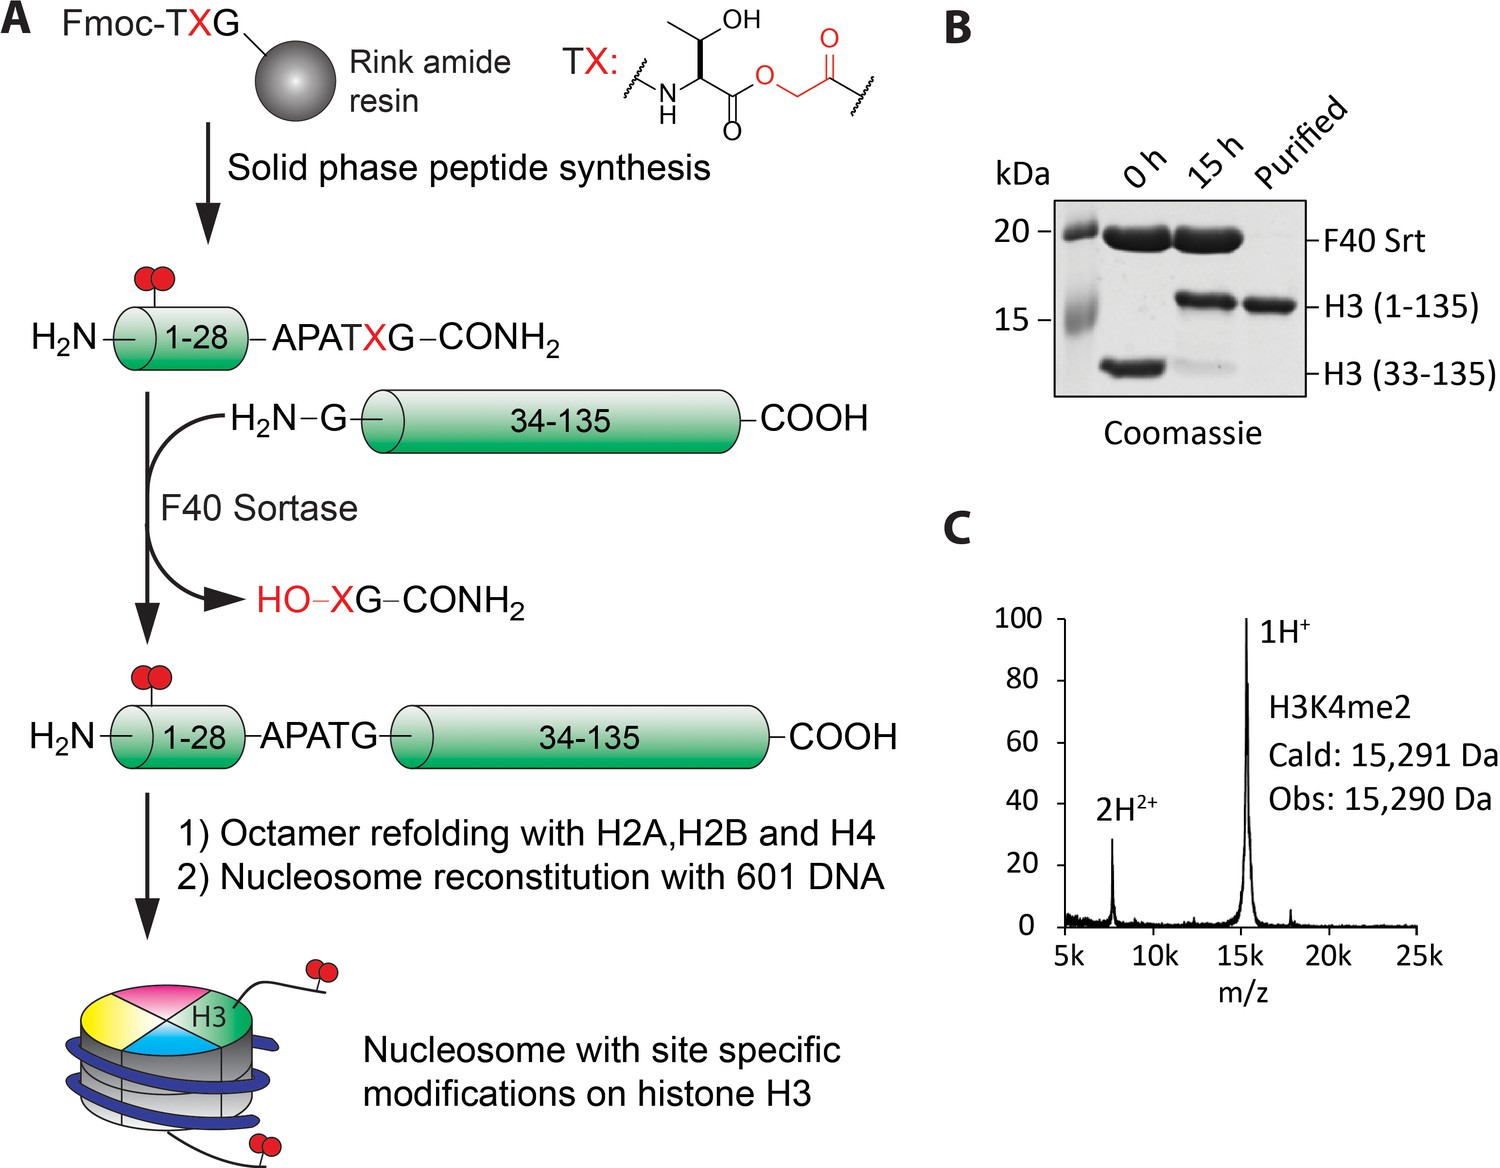
Preparation of nucleosomes with site-specific modifications using F40 sortase and depsipeptide H3 tails.
(A) Scheme for the semisynthesis of histone H3 forms and their incorporation into nucleosomes. The ester bond between Thr32 and X33 enhances ligation conversion. (B) Coomassie-stained SDS-PAGE of the sortase mediated ligation and the purified histone H3 product containing H3K4me2. (C) MALDI mass spectrum of the semisynthetic H3K4me2 modified histone H3.
Figure 4—figure supplement 1
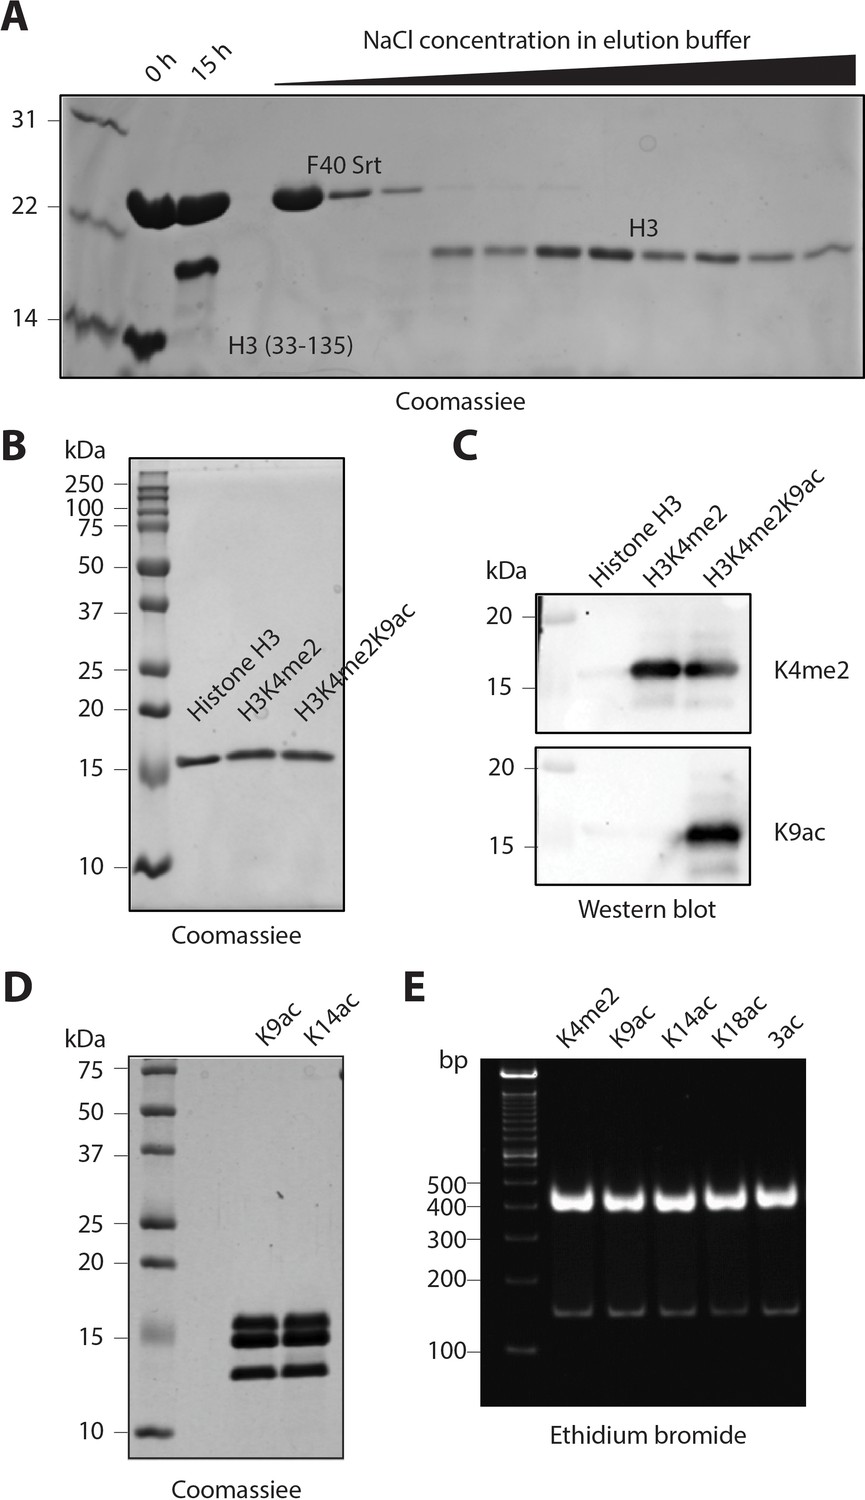
Purification and characterization of semisynthetic histone H3 and the reconstituted nucleosomes
(A) Coomassie-stained SPS-PAGE of a representative F40 sortase-mediated ligation and fractions obtained after cation exchange chromatography. After 15 hr reaction time, the crude mixture was loaded on to an SP column and eluted using a gradient of increasing NaCl from 0.1 to 0.5 M in the elution buffer. The purified fractions containing the ligated histone H3s were collected. (B) Coomassie-stained SDS-PAGE of representative semisynthetic histone H3 products. Recombinant purified unmodified H3 is shown for comparison. (C) Western blot of representative semi-synthetic histone H3s that are recognized by the histone modification-specific antibodies. (D) Coomassie-stained SDS-PAGE of representative nucleosomes. (E) Ethidium bromide stained Novex TBE gel of representative nucleosomes with 146 bp DNA.
Figure 4—figure supplement 2
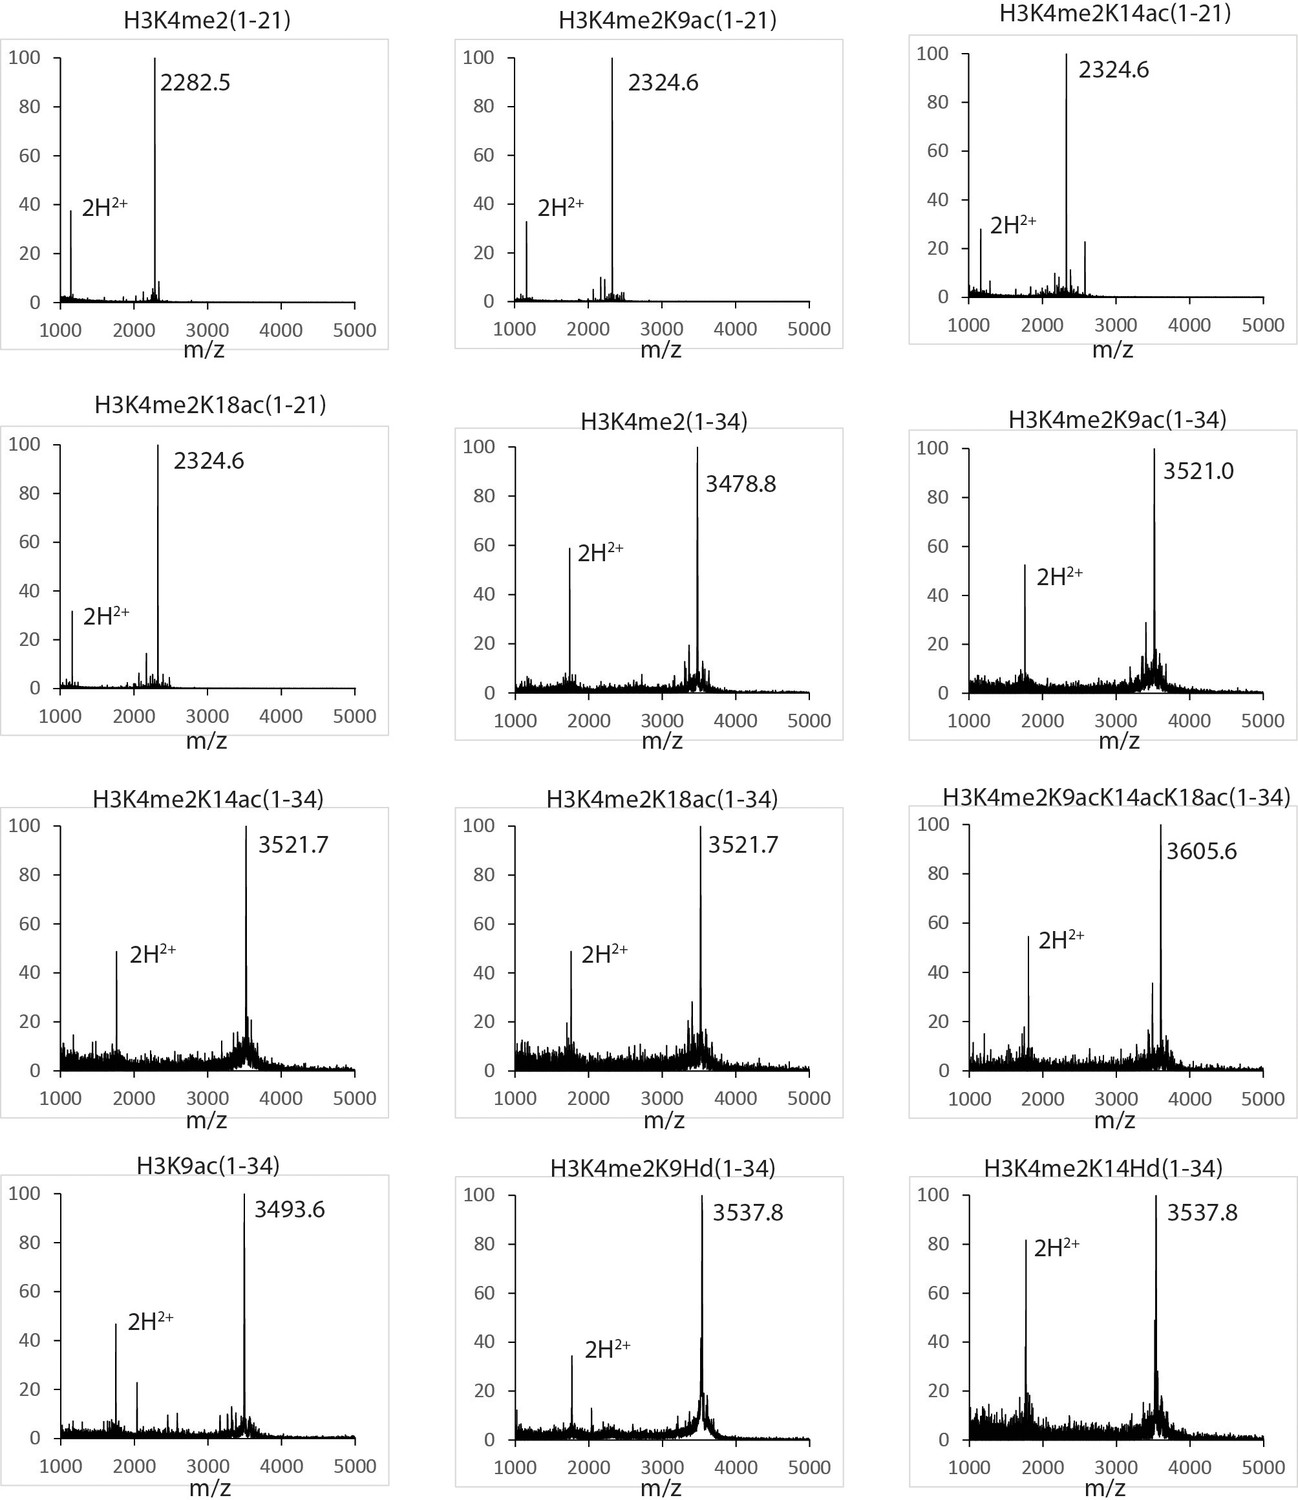
MALDI mass spectra of the histone H3 peptides in this study.
https://doi.org/10.7554/eLife.37231.011
Figure 4—figure supplement 3
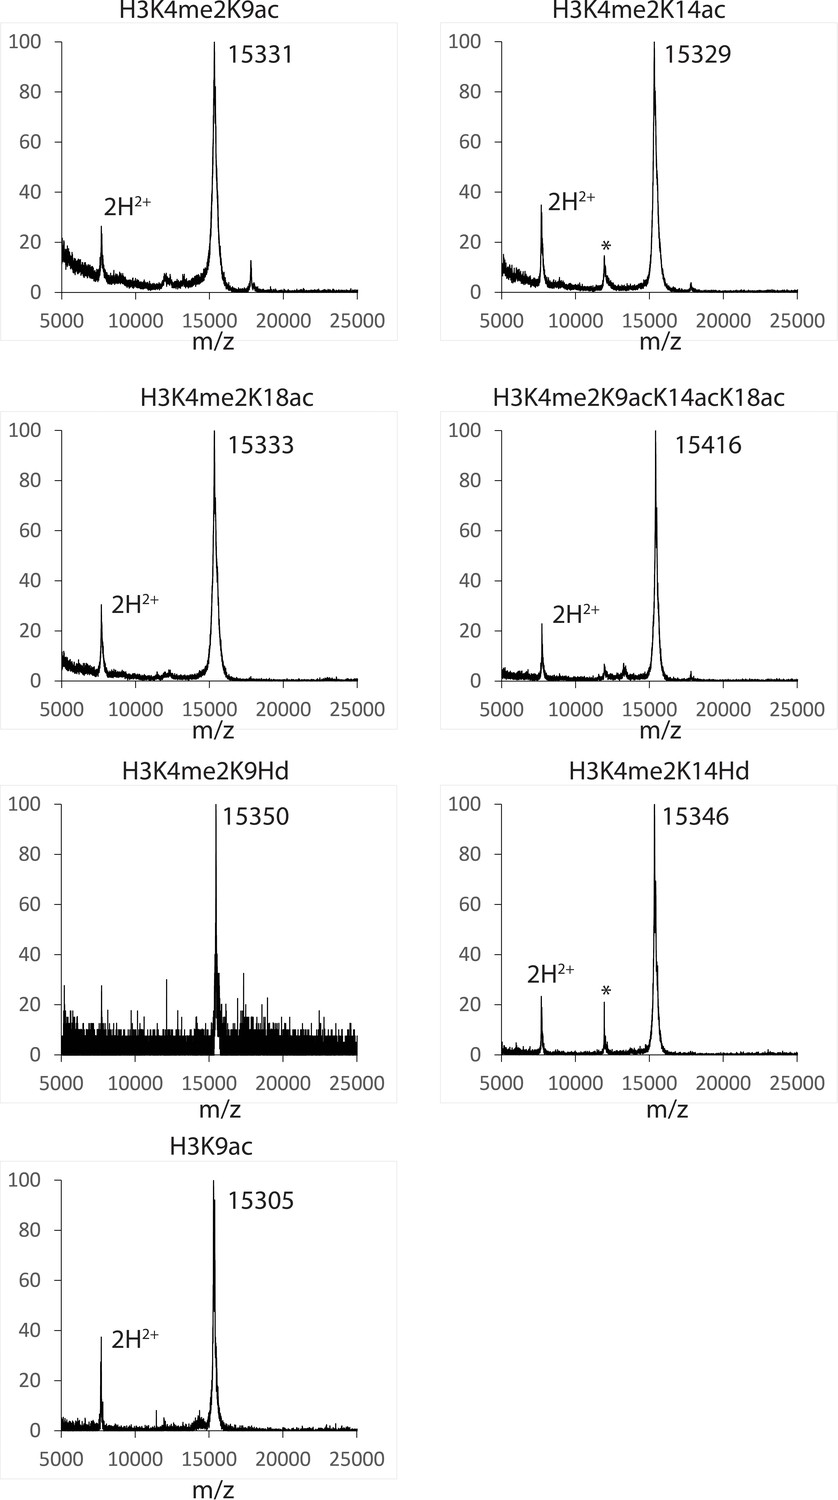
MALDI mass spectra of the semi-synthetic histone H3s in this study.
The star (*) peak indicates the impurity identified as the unligated histone H3 (aa33-135). The impurity is less than 5% based on Coomassie-stained SDS-PAGE analysis of the product samples.
Figure 4—figure supplement 4
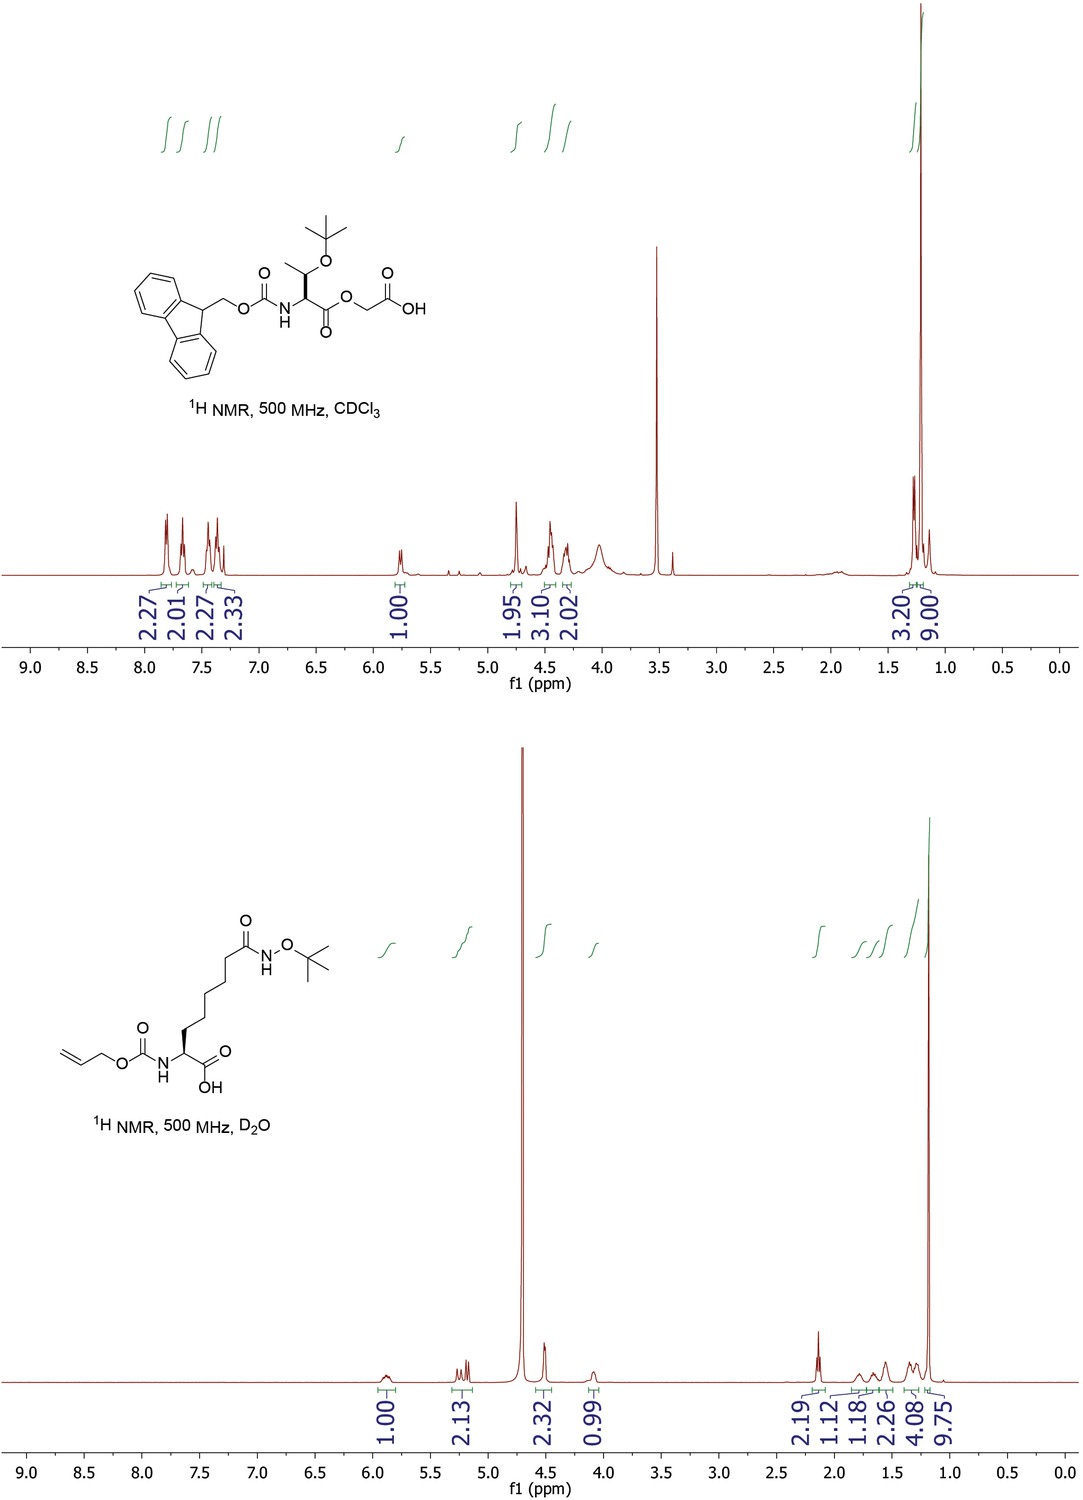
1H NMR of Fmoc-Thr(OtBu)-glycolic acid and Alloc-Asu(Hd-OtBu)-OH.
https://doi.org/10.7554/eLife.37231.013
Figure 5 with 1 supplement
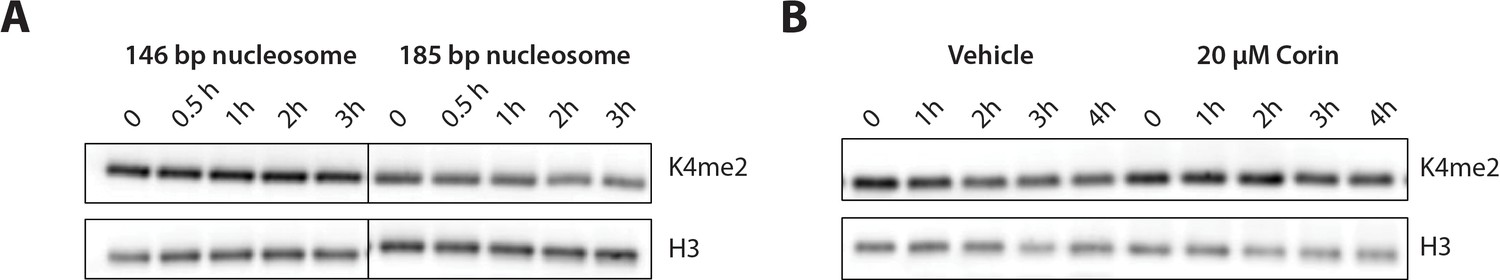
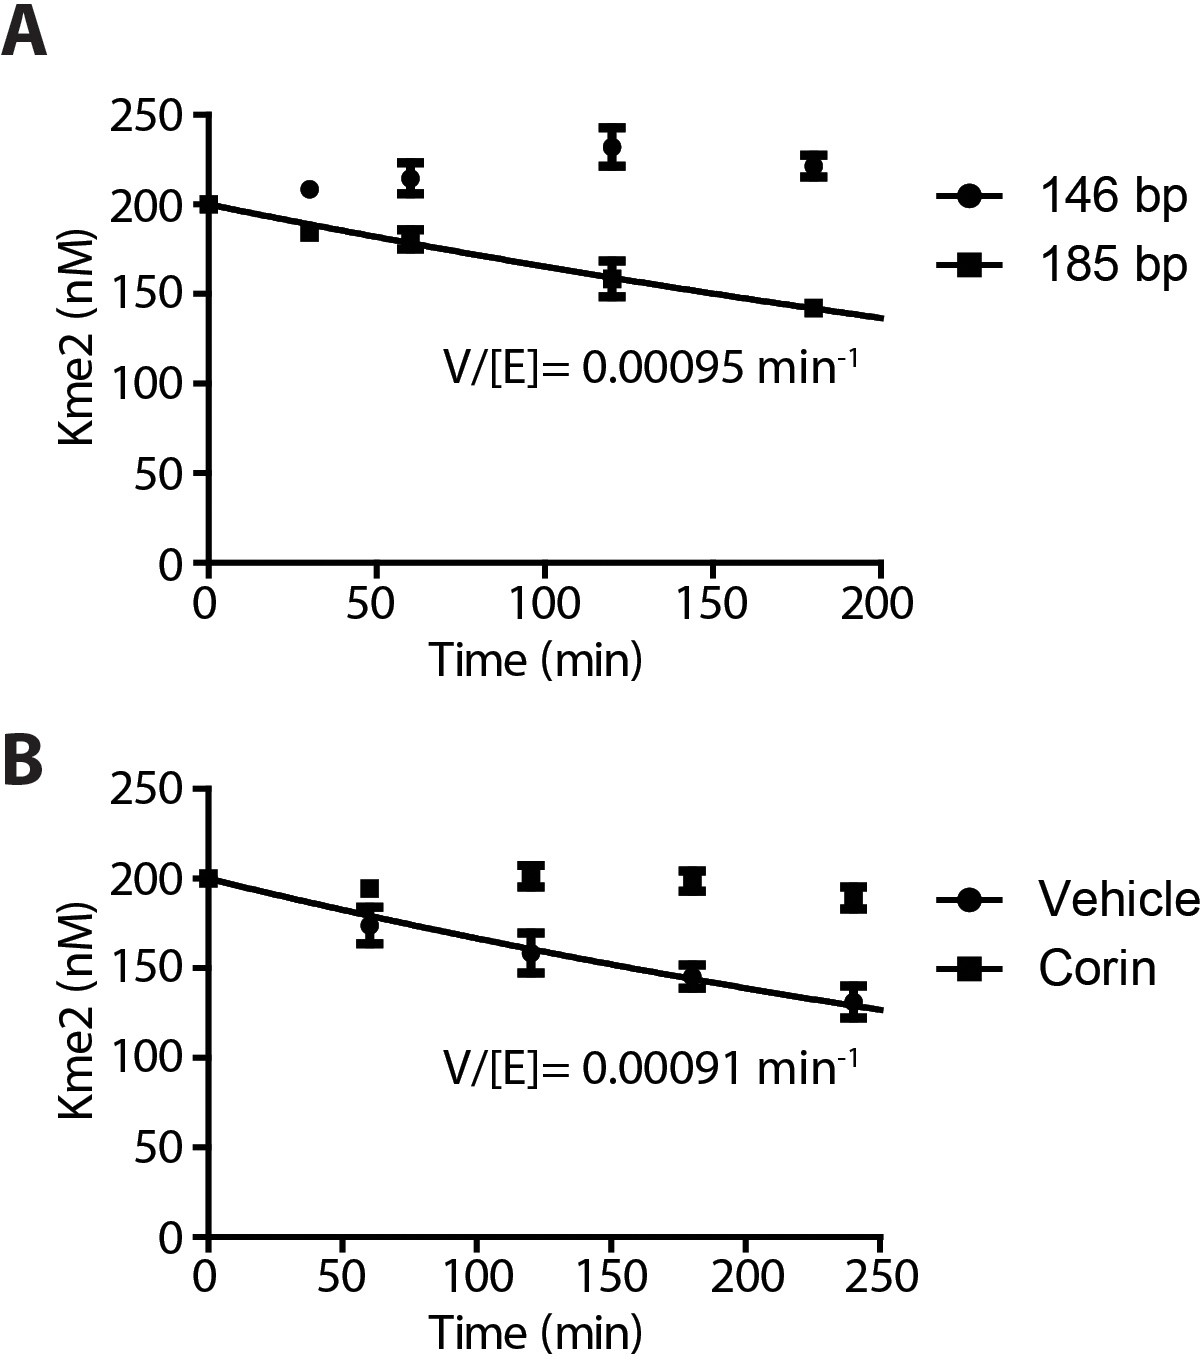
Demethylation of H3K4me2-modified nucleosomes by LHC.
(A) Demethylation of 100 nM H3K4me2 modified nucleosomes with either 146 or 185 bp nucleosomal 601 DNA by 400 nM LHC. (B) Corin inhibits the demethylation of the 185 bp H3K4me2 modified nucleosome substrate. These assays were performed three times (n = 3) in A and twice (n = 2) in B on separate occasions.
Figure 5—figure supplement 1
Demethylation kinetics of H3K4me2 nucleosomes (100 nM) by LHC (400 nM) quantified by western blots.
(A) The H3K4me2 nucleosome with 185 bp dsDNA was slowly demethylated by the CoREST complex while nucleosome demethylation with with 146 bp dsDNA was below the level of detection. (B) The LSD1 and HDAC1 dual inhibitor Corin (20 μM) inhibited the demethylation of the 185 bp nucleosome substrate; (n = 3 for A and n = 2 for B); error bars represent S.E.M.
Figure 6 with 2 supplements
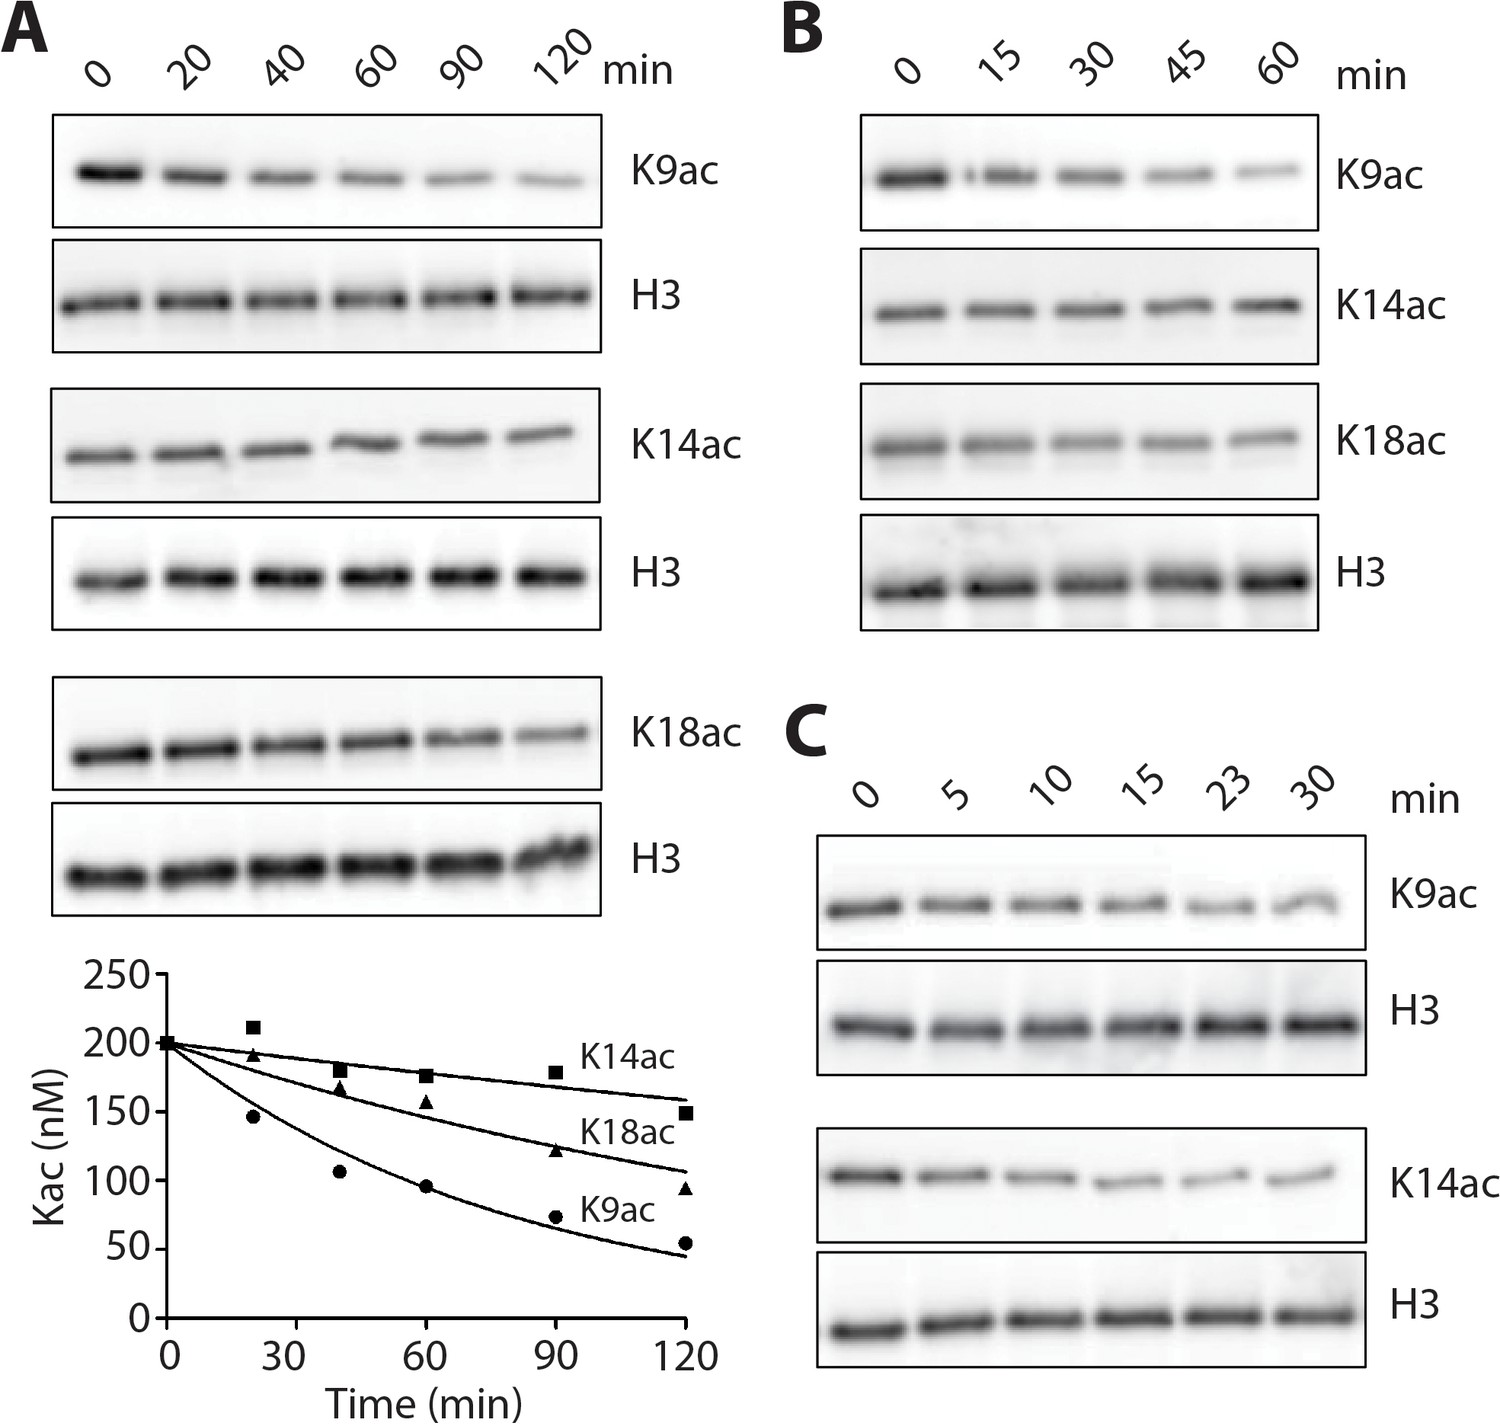
LHC deacetylation of nucleosomes and isolated histone H3 containing Kac.
(A) The deacetylation of 100 nM monoacetylated nucleosomes by 20 nM LHC. The quantified bands of Kac are measured in the plot below. (B) Deacetylation of 200 nM triacetylated H3K9acK14acK18ac nucleosomes by 40 nM LHC. (C) The deacetylation of 1 μM monoacetylated semisynthetic histone H3s possessing either K9ac or K14ac by 1 nM LHC. These assays were performed at three times (n = 3) in A and B and twice (n = 2) in C on separate occasions.
Figure 6—figure supplement 1
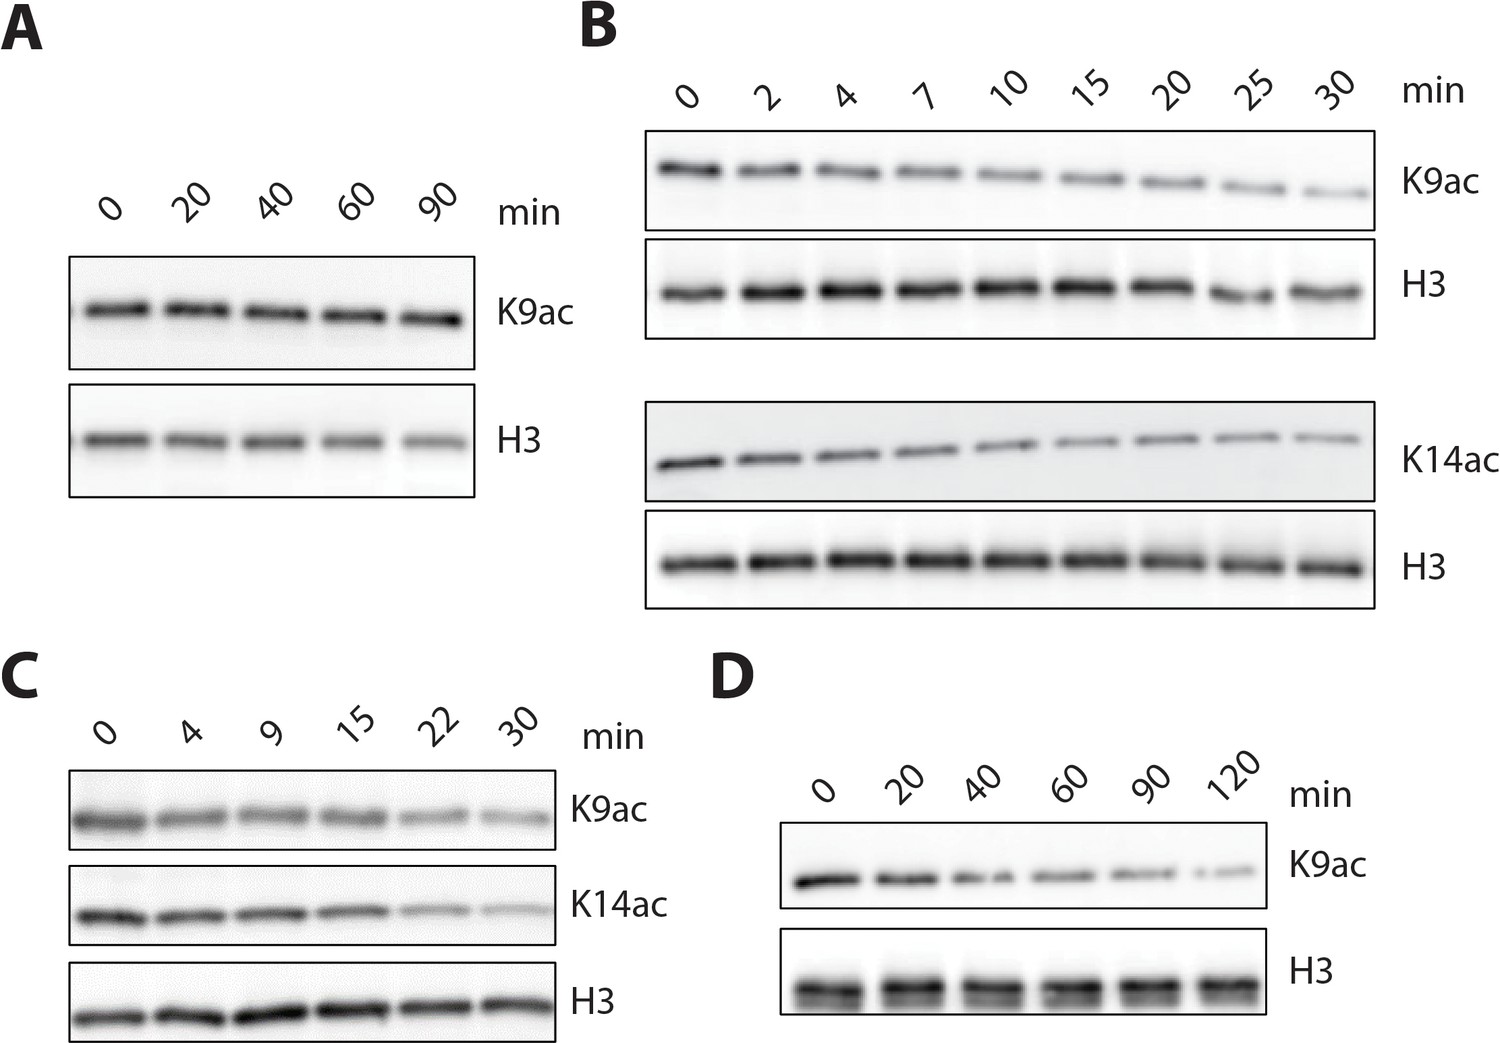
LHC and isolated HDAC1 deacetylation of nucleosomes and isolated histone H3 containing Kac.
(A) His-FLAG-HDAC1 (50 nM) showed no detectable deacetylation of H3K9ac nucleosome substrate (100 nM). (B) His-FLAG-HDAC1 (5 nM) showed robust deacetylation of both H3K9ac and H3K14ac histone H3 substrates (1 μM). (C) Deacetylation of the H3K9K14K18 triacetylated histone H3 (1 μM) by 1 nM LHC. (D) Deacetylation of 100 nM H3K9ac nucleosomes (lacking H3K4me2 modification) by 20 nM LHC. Each of these panels shows western blots with the relevant site-specific and total H3 Abs. (n = 3 for all measurements except n = 2 for A and B).
Figure 6—figure supplement 2
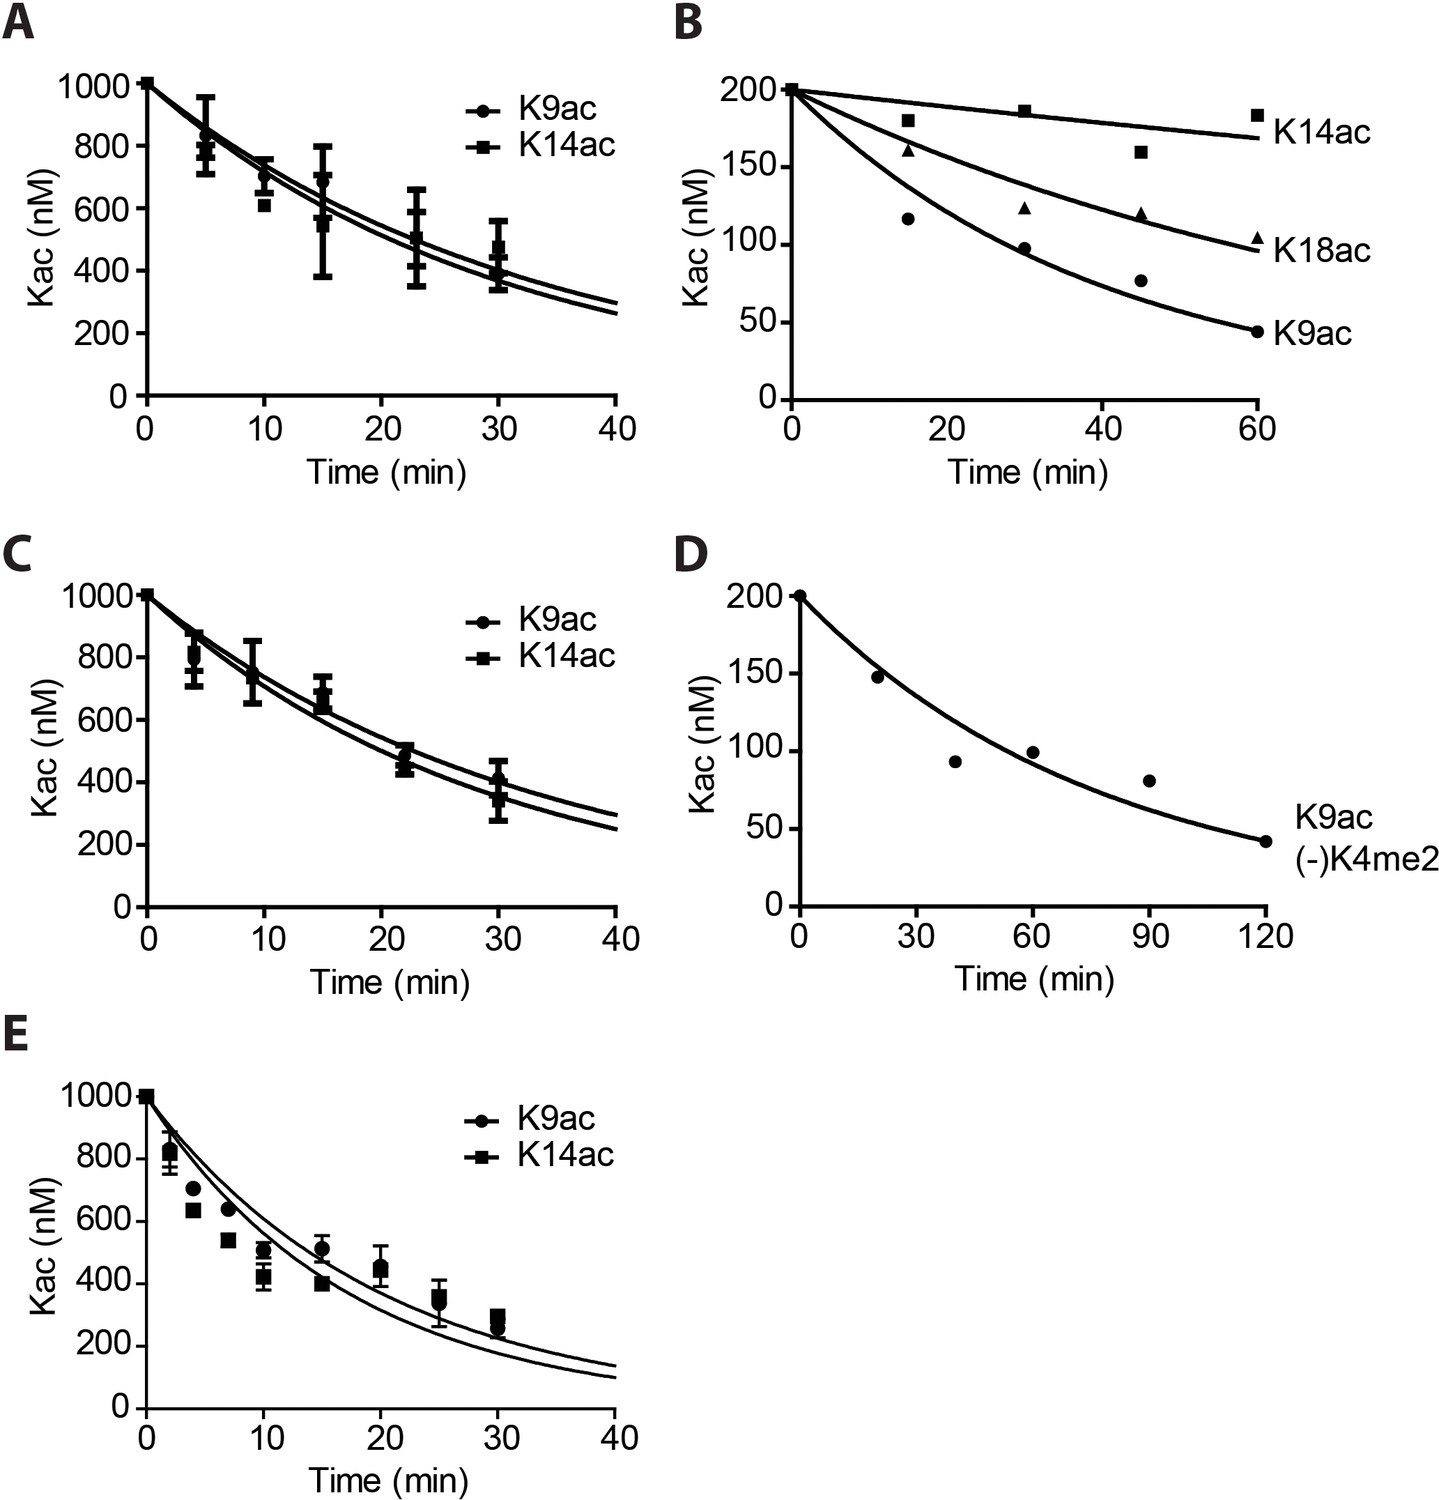
Quantification and curve fitting of the deacetylation assays.
(A) Deacetylation of 1 μM Kac histone H3 by 1 nM LHC. (B) Deacetylation of 100 nM H3K9K14K18 triacetylated nucleosomes by 40 nM LHC. (C) Deacetylation of 1 μM H3K9K14K18 triacetylated histone H3 by 1 nM LHC. (D) Deacetylation of 100 nM H3K9ac nucleosomes without H3K4me2 by 20 nM LHC. V/[E]=0.14 ± 0.0045 min−1. (E) The deacetylation of 1 μM Kac histone H3 by 5 nM His-FLAG-HDAC1; (n = 3 for all measurements except n = 2 for A and C); Error bars represent S.E.M.
Figure 7 with 1 supplement

Nucleosomes with hydroxamic acid Lys analogs were potent competitive inhibitors of LHC-catalyzed deacetylation of Kac peptide substrate.
(A) A model for nucleosomes containing hydroxamic acid acetyl-Lys analogs (KHd) on the H3 tail and coordinating to the active site Zn2+ of HDAC1 in LHC. (B) Dose-dependent inhibition of LHC catalyzed peptide deacetylation by KHd-modified nucleosomes. (C) Kac and unacetylated nucleosomes (up to 400 nM) do not inhibit LHC catalyzed peptide deacetylation. (D) Dixon plot of LHC inhibition by H3K14Hd-modified nucleosomes shows competitive inhibition versus peptide deacetylation with Ki = 35 nM. (E) Dose-dependent inhibition of LHC catalyzed peptide deacetylation by KHd-modified semisynthetic histone H3s. (F) Summary of the Ki values calculated from IC50 values, (n = 3 for all measurements); values shown are ± S.E.M.
Figure 7—figure supplement 1
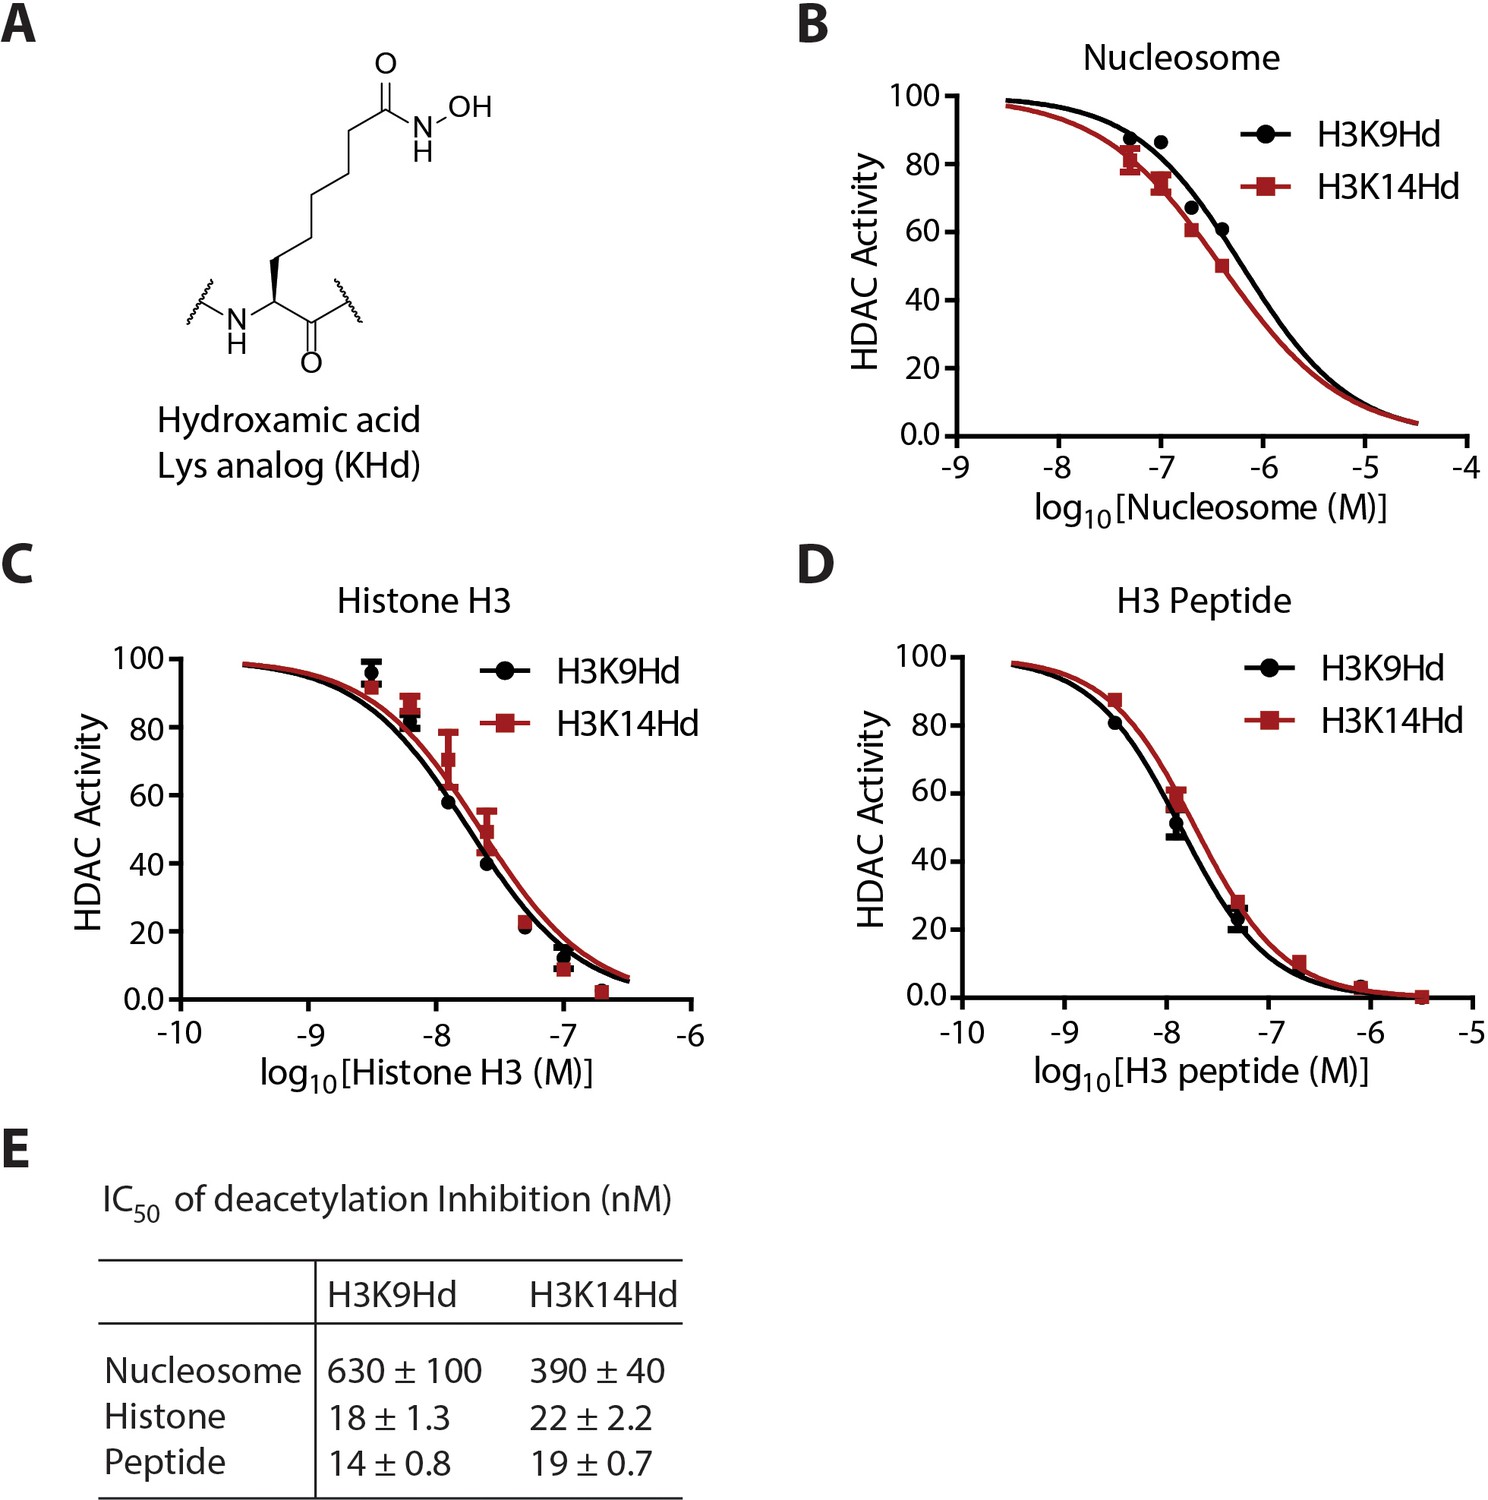
Quantification and curve fitting of the inhibition of the deacetylation assays.
(A) The chemical structure of the KHd. (B) Dose-response curves for the inhibition of LHC by H3K9Hd and H3K14Hd nucleosomes. (C) Dose-response curves for the inhibition of LHC by K9Hd and K14Hd histone H3 proteins. (D) Dose-dependent inhibition of LHC catalyzed peptide deacetylation by KHd-modified H3 synthetic peptides. (E) Summary of the IC50s of the KHd forms against LHC; (n = 3 for all measurements); error bars show S.E.M.; IC50 values shown are ± S.E.M.
Figure 8
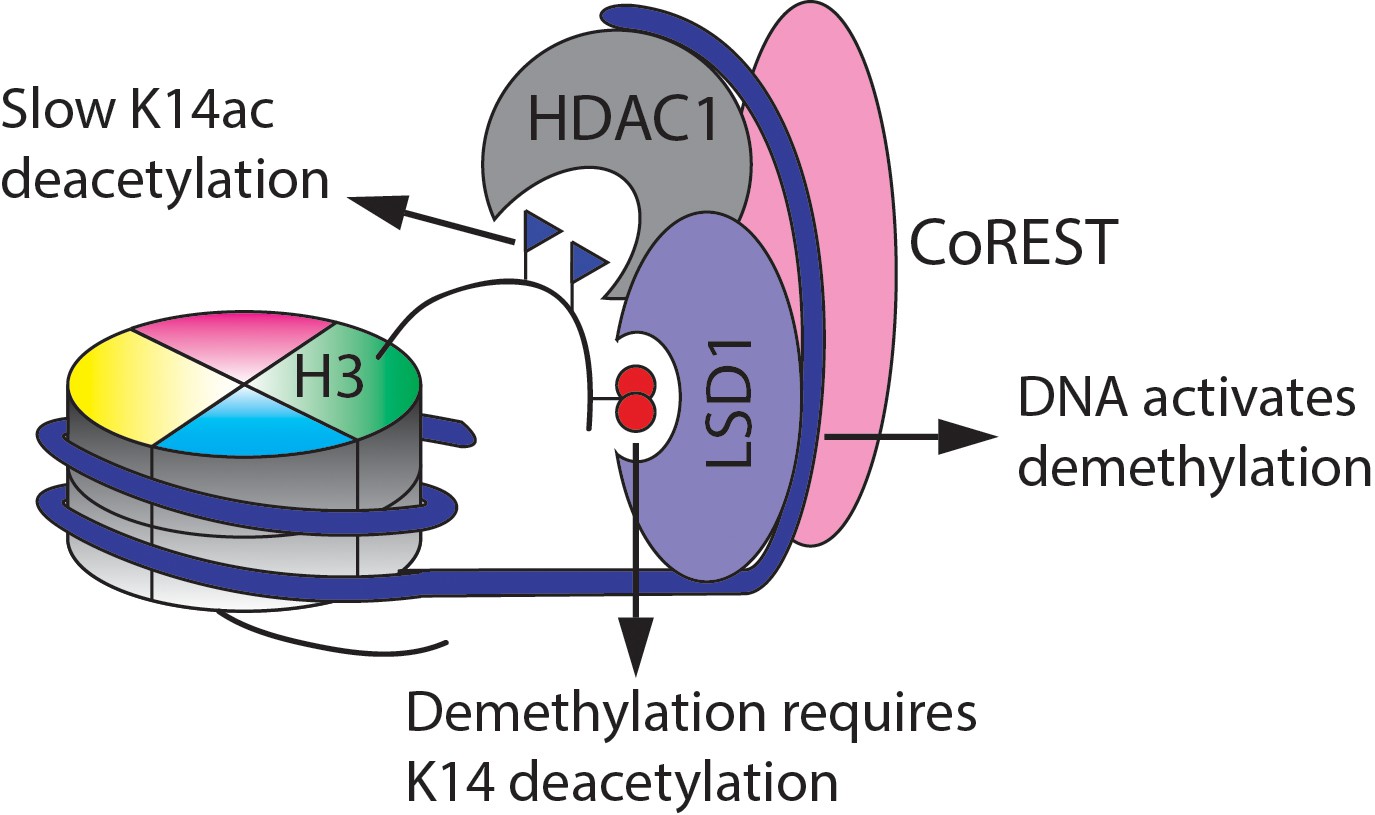
Summary of the findings here of the enzymatic activities of the CoREST complex with a modified nucleosome substrate.
https://doi.org/10.7554/eLife.37231.022Tables
Table 1
Summary of the deacetylation turnover (V/[E]) from data in Figure 6 and Figure 6—figure supplement 1 (p<0.001 for V/[E] of K9ac nucleosome vs. K14ac nucleosome substrates in both the monoacetylated and triacetylated assays); (n = 3 for all measurements except n = 2 for LHC on H3 and HDAC1 on nucleosomes; kinetic values shown are ± S.E.M.
https://doi.org/10.7554/eLife.37231.019| Substrate | V/[E] (min−1) | |||
|---|---|---|---|---|
| K9ac | K14ac | K18ac | ||
| LHC | Kac Nucleosome | 0.10 ± 0.0084 | 0.014 ± 0.0073 | 0.048 ± 0.011 |
| Kac H3 | 31 ± 3.9 | 35 ± 8.5 | - | |
| 3Kac Nucleosome | 0.11 ± 0.0071 | 0.019 ± 0.0033 | 0.058 ± 0.0022 | |
| 3Kac H3 | 31 ± 4.3 | 35 ± 2.7 | - | |
| HDAC1 | Kac Nucleosome | <0.005 | <0.005 | - |
| Kac H3 | 10 ± 0.89 | 12 ± 0.26 | - | |
Additional files
-
Transparent reporting form
- https://doi.org/10.7554/eLife.37231.023
Download links
A two-part list of links to download the article, or parts of the article, in various formats.
Downloads (link to download the article as PDF)
Open citations (links to open the citations from this article in various online reference manager services)
Cite this article (links to download the citations from this article in formats compatible with various reference manager tools)
Lysine-14 acetylation of histone H3 in chromatin confers resistance to the deacetylase and demethylase activities of an epigenetic silencing complex
eLife 7:e37231.
https://doi.org/10.7554/eLife.37231


