Ezrin enrichment on curved membranes requires a specific conformation or interaction with a curvature-sensitive partner
- Institut Curie, PSL Research University, CNRS UMR168, France
- Sorbonne Université, France
- Institut Curie, PSL Research University, CNRS UMR144, France
- Institute of Biotechnology, University of Helsinki, Finland
- Université Côte d'Azur, CNRS, Institut de Pharmacologie Moléculaire et Cellulaire, France
- Université Paris Descartes, Institut Pasteur, France
- Institut de Recherche en Infectiologie de Montpellier (IRIM), CNRS UMR 9004, France
Figures
Figure 1 with 2 supplements
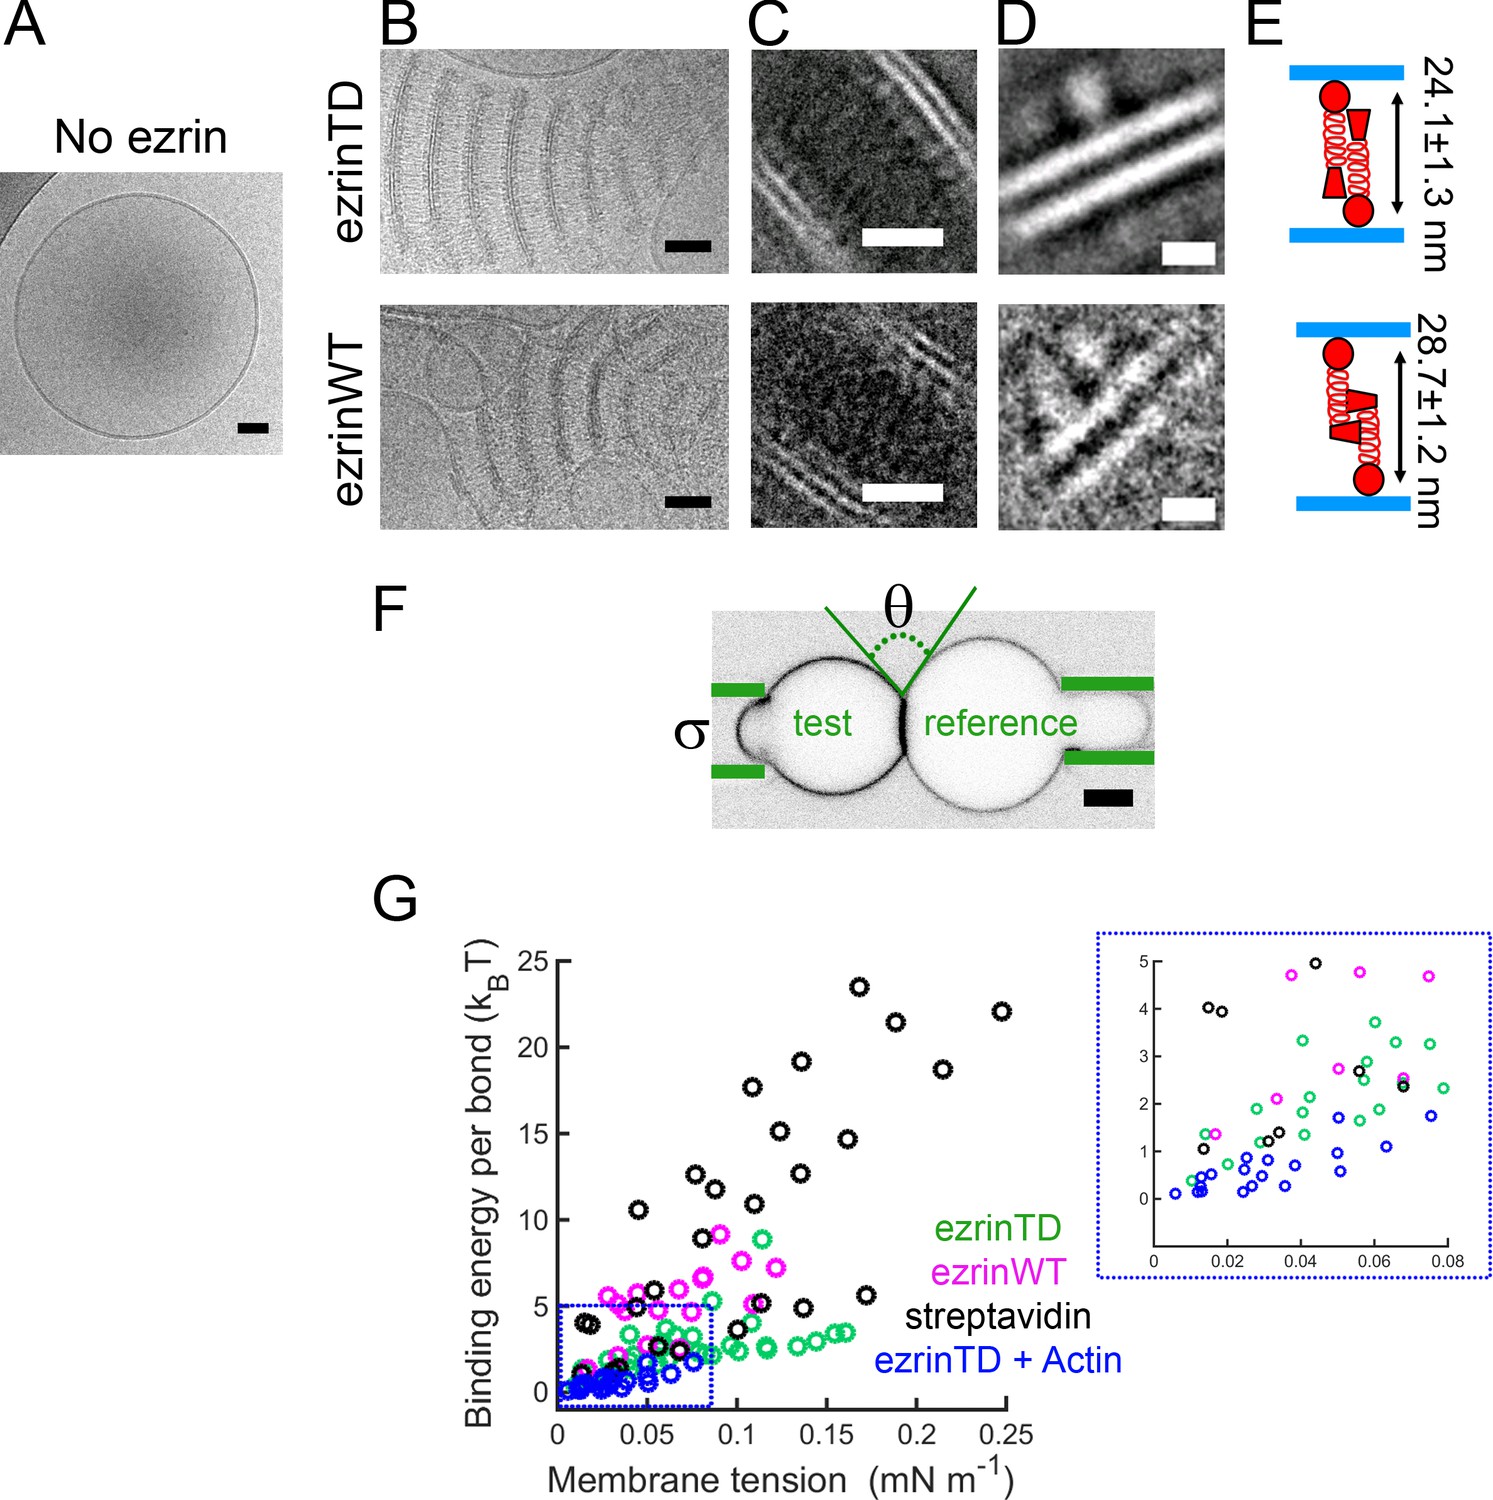
EzrinTD and ezrinWT have distinct conformations on PIP2-containing membranes.
(A) LUV in the absence of ezrin. Scale bar, 50 nm. (B) Representative cryo-electron micrographs of PIP2-membranes tethered by ezrinTD (0.2 μM) or ezrinWT (1.2 μM). Scale bars: 50 nm. (C–D) Representative two-dimensional class averages of ezrinTD- and ezrinWT-tethered membranes. Scale bars: (C) 20 nm and (D) 5 nm. (E) Cartoons illustrating ezrin-membrane tethering by ezrinTD and ezrinWT. The distances deduced from class averages as shown in (C) and (D) between the globular domains of ezrinTD and ezrinWT between two tethered membranes are 24.1 ± 1.3 nm and 28.7 ± 1.2 nm (averaged from 10 classes, mean ± standard deviation), respectively (see analysis details in the Materials and methods). The size of the globular domains of ezrinTD and ezrinWT shown in (D) are 5.4 ± 0.6 nm long by 3.5 ± 0.5 nm wide for ezrinTD (averaged from 21 classes) and 5.3 ± 0.5 nm long by 2.9 ± 0.3 nm wide for ezrinWT (averaged from 7 classes, mean ± standard deviation, see analysis details in the Materials and methods). (F) Representative confocal image of the test GUV and the reference GUV tethered by ezrinTD (inverted grayscale) in the dual micropipette assay. The green lines indicate the micropipettes. Scale bar, 5 μm. (G) Membrane tethering strengths of ezrinTD (N = 8 GUVs, n = 4 sample preparations), ezrinWT (N = 4 GUVs, n = 3 sample preparations), streptavidin bonds (N = 5 GUVs, n = 2 sample preparations) and ezrinTD in the presence of F-actin (N = 10 GUVs, n = 3 sample preparations). Inset: enlarged region indicated by the blue dotted box in (G).
Figure 1—figure supplement 1
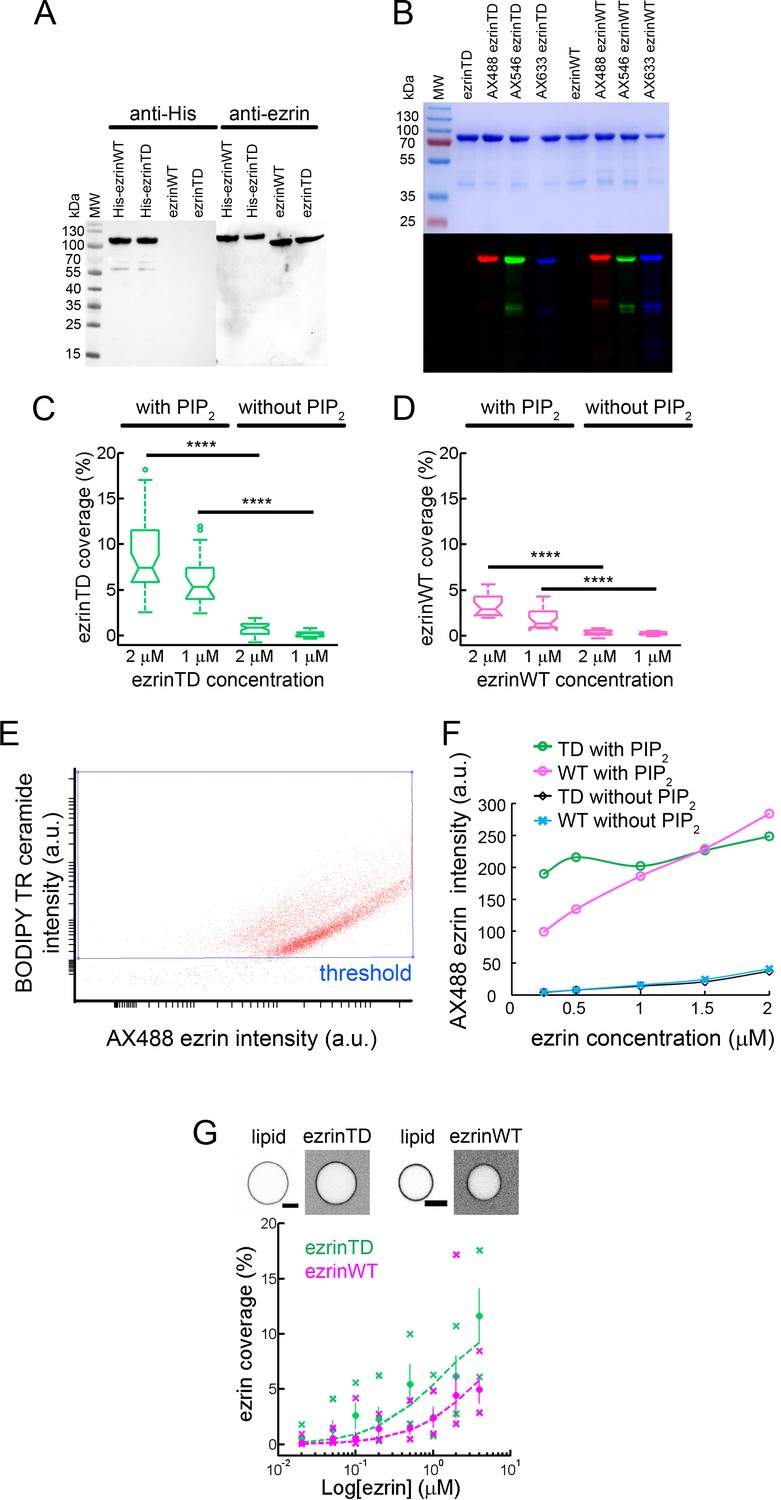
Analysis of purified recombinant ezrinTD and ezrinWT, and their binding to PIP2-containing membranes.
(A) Western blots of ezrinTD and ezrinWT before and after SUMO proteolysis of the His6 tag analyzed with anti-His or anti-ezrin antibodies. MW: molecular weight protein markers. (B) SDS-PAGE analysis of Alexa dye-labelled ezrinTD and ezrinWT detected by Coomassie blue staining (top) and fluorescence illumination (bottom). (C and D) GUV surface fraction covered with ezrinTD (C) and ezrinWT (D) in the presence and absence of PIP2. N = 34, 22, 39, 30 and N = 18, 15, 24, 20 GUVs for GUVs with PIP2 at 2 μM and 1 μM protein concentrations and GUVs without PIP2 at 2 μM and 1 μM protein concentrations, for ezrinTD and ezrinWT, respectively. n = 1 sample preparation for each lipid composition. p<0.0001 (t-test), comparing ezrin binding on GUVs with and without PIP2 at the same ezrin bulk concentration (indicated by ****). (E) Representative flow cytometry experiment showing the distribution of ezrin intensity (in a.u.) as a function of lipid fluorescence intensity (in a.u.) on the GUVs. (F) EzrinTD and ezrinWT binding to GUVs with and without PIP2 as a function of ezrin bulk concentration, as deduced from flow cytometry analysis. Number of events for all conditions N > 7600. (G) (Top) Representative confocal images of ezrinTD and ezrinWT on GUVs containing 5 mole% PIP2. Scale bars, 5 μm. Inverted grayscale images are shown. (Bottom) Representative measurement of the surface fraction of ezrinTD and ezrinWT at various ezrin bulk concentrations for n = 1 sample preparation. Statistics shown here: N = 43–78 and N = 69–79 GUVs per condition for ezrinTD and ezrinWT, respectively. Error bars indicate standard deviations, circles are mean and X symbols are maximum and minimum for each condition. Dash lines are data fitting curves.
-
Figure 1—figure supplement 1—source data 1
Source data of Figure 1—figure supplement 1C and D.
- https://doi.org/10.7554/eLife.37262.004
-
Figure 1—figure supplement 1—source data 2
Source data of Figure 1—figure supplement 1G.
- https://doi.org/10.7554/eLife.37262.005
Figure 1—figure supplement 2
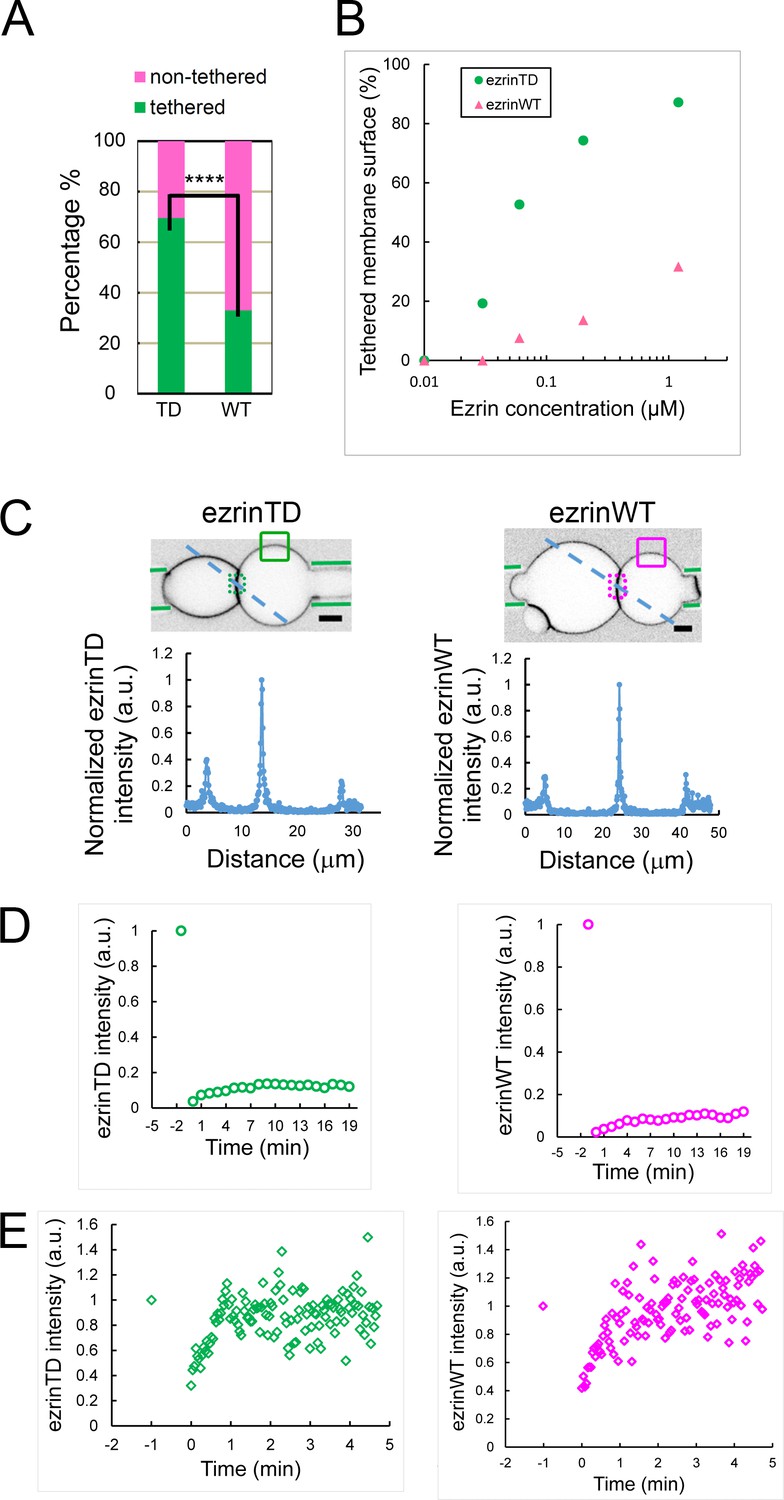
Frequency and critical concentration of membrane tethering by ezrinTD and ezrinWT.
(A) Percentages of tethered and non-tethered membranes deduced from cryo-EM. EzrinTD and ezrinWT bulk concentration: 1.2 μM. Total membrane length measured: 94728 nm (ezrinTD) and 77115 (ezrinWT) for n = 3 sample preparations. p<0.0001 (z-test), comparing the percentage of tethering of ezrinTD and ezrinWT (indicated by ****). (B) Percentages of the total membrane surface tethered by ezrinTD and ezrinWT as a function of ezrin bulk concentration. Total number of measurements are 43, 56, 49, 30 for ezrinTD at concentrations of 1.2 μM, 0.2 μM, 0.05 μM, 0.03 μM and 67, 23, and 15 for ezrinWT at concentrations of 1.2 μM, 0.2 μM and 0.06 μM, for n = 1 sample preparation. The critical concentration above which tethering occurs is deduced. (C) (Top) Representative confocal image of the test GUV and the reference GUV tethered by ezrin (inverted grayscale) in the dual micropipette assay. The green lines indicate the micropipettes. Scale bars, 5 μm. (Bottom) Normalized ezrin fluorescence intensities along a blue dotted line across the tethered interface as shown in the top image. (D) and (E) Representative fluorescence recovery after photobleaching (FRAP) experiment on ezrin-tethered membrane zones (D) and non-tethered membrane zones (E) for ezrinTD and ezrinWT. See in (C) Top, dotted boxes indicating bleaching area of tethered zones and solid lined boxes indicating bleaching area of non-tethered zones. Before FRAP experiments, ezrin surface fractions were 25.2% and 5.3% on the tethered zones for experiments shown in (D), and 5.4% and 2.2% on the non-tethered zones for experiments shown in (E), for ezrin TD and ezrinWT, respectively.
Figure 2
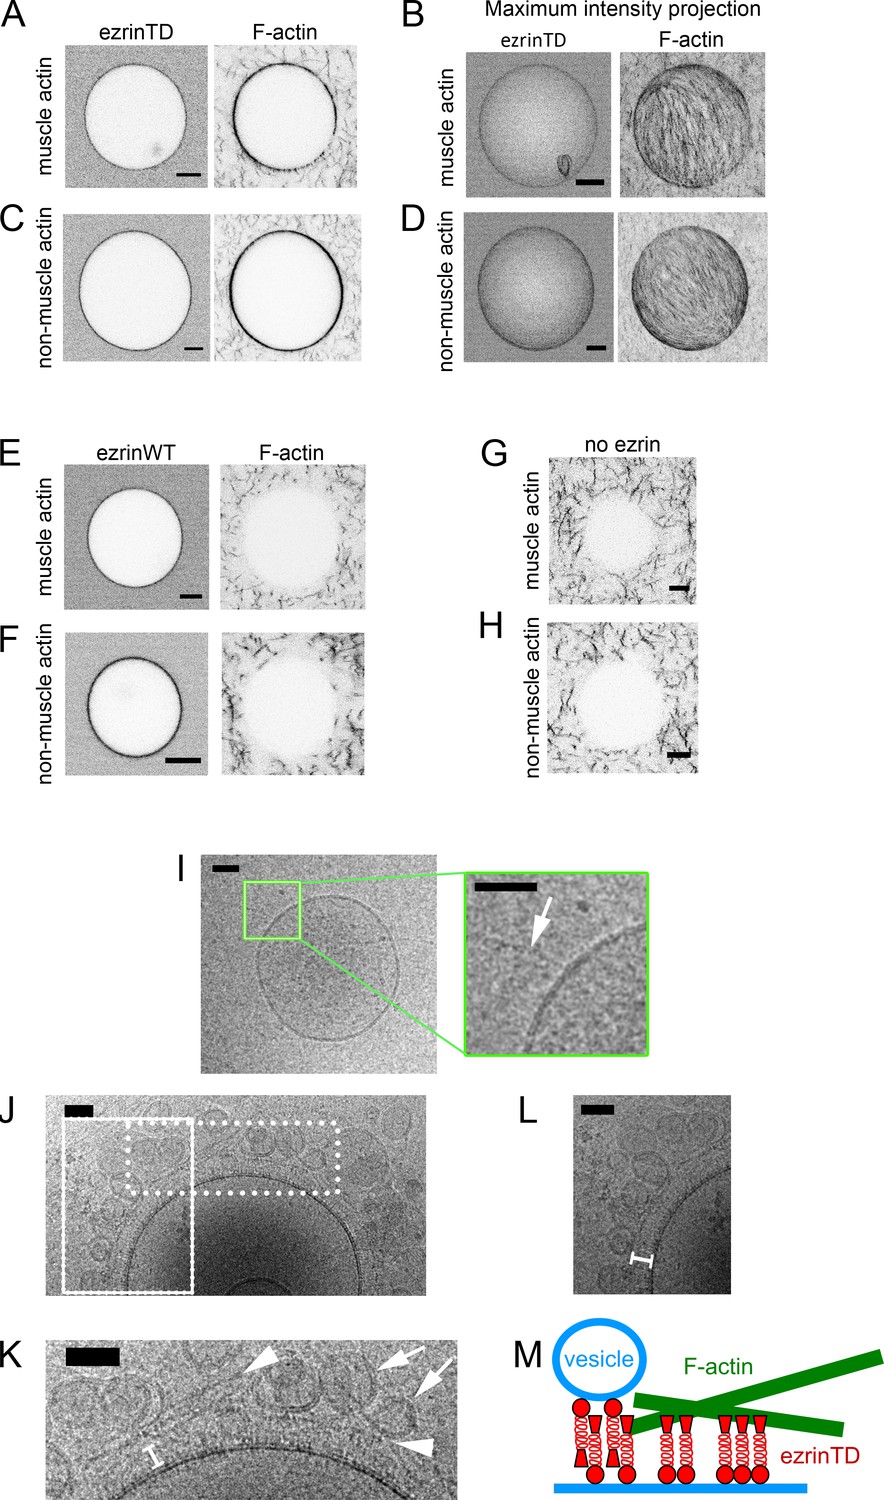
EzrinTD forming a brush-like structure bridges F-actin and the membrane.
(A–H) Representative confocal images of GUVs coated with ezrinTD (A–D), ezrinWT (E and F) or in the absence of ezrin (G and H), in the presence of muscle (A, B, E and G) or non-muscle (C, D, F and H) F-actin. (B) and (D) Maximum intensity projections of (A) and (C), respectively. The bulk concentrations of muscle and non-muscle F-actin are 0.4 μM and 0.6 μM, respectively, and the bulk concentrations of ezrinTD and ezrinWT are both 0.5 μM. Scale bars, 5 μm. Inverted grayscale images were shown. (I–L) Representative cryo-electron micrographs of PIP2-containing LUVs incubated with muscle F-actin in the absence (I) and presence (J–L) of ezrinTD. Inset in (I): enlargement of the region marked by the green rectangle. Arrow indicates F-actin. Scale bars, 50 nm. (K) and (L) Enlargements of the regions marked by the dotted and solid line rectangle in (J), respectively. In (K), arrowheads indicate F-actin and arrows indicate tethered vesicles. In (K) and (L) white brackets indicate brush-like ezrinTD assembly. EzrinTD and F-actin concentrations are 0.3 μM and 1 μM, respectively. Scale bars, 50 nm. (M) Cartoon illustrating brush-like ezrinTD assembly recruiting F-actin and tethering vesicles to membranes.
Figure 3 with 1 supplement
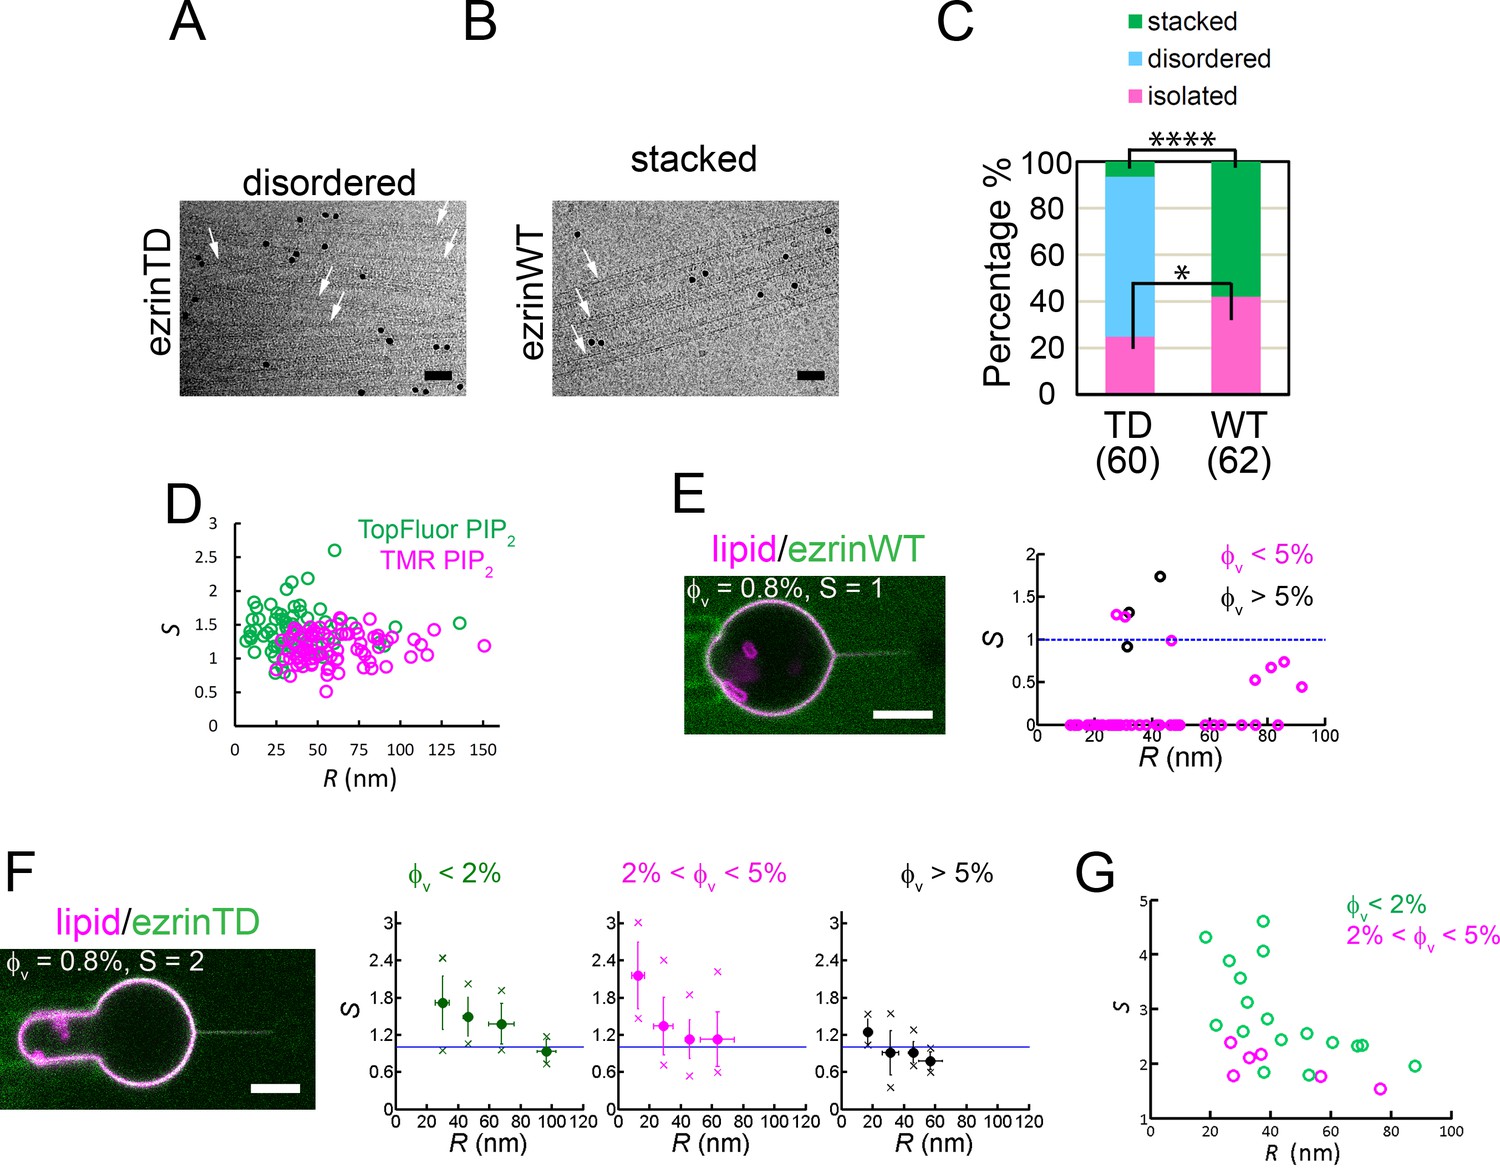
EzrinTD binds to positively curved membranes.
(A and B) Rigid lipid nanotubes assembled by ezrin: representative cryo-electron micrographs of ezrinTD inducing randomly-oriented nanotube assembly, named disordered (A) and ezrinWT inducing parallel stacks, named stacked (B). Arrows indicate some of the nanotubes in both cases. Scale bars: 50 nm. The black dots are gold particles. Protein concentrations: 1.2 μM for both ezrinTD and ezrinWT. Nanotube concentration: 0.1 g.L−1. (C) Percentages of membrane nanotubes being disordered, forming stacks or being isolated in the presence of ezrinTD or ezrinWT, deduced from cryo-EM. Numbers of tubes measured are N = 60 and N = 62 from two distinct sample preparations, for ezrinTD and ezrinWT, respectively. Statistic test (chi-square test): for stacked tubes (****) and for isolated tubes (*). (D) Absence of curvature-induced sorting of PIP2 measured using two types of fluorescently-labeled PIP2 (TopFluor PIP2 (N = 14 GUVs, n = 1 sample preparation) and TMR PIP2 (N = 23 GUVs, n = 2 sample preparations)). S: sorting ratio. R: membrane tube radius. (E) and (F) Nanotube pulling assay to probe ezrin positive membrane curvature sensing. (Left) Representative confocal images of ezrinWT (E) and ezrinTD (F) binding on a membrane nanotube pulled from a GUV aspirated in a micropipette. The nanotube is held by a bead (not fluorescent) that is trapped by optical tweezers. Scale bars, 5 μm. (Right) Sorting ratio, S, as a function of tube radius, R, for ezrinWT (E) and ezrinTD (F). φV: ezrin membrane surface fraction. Blue lines indicate S = 1. In (E), measurements were collected from N = 13 GUVs, n > 3 independent sample preparations. In (F), measurements were collected from N = 63 GUVs, n > 3 independent sample preparations. Error bars indicate standard deviations, circles are mean and X symbols are maximum and minimum for each condition, excluding S = 0 data. (G) Sorting of the FERM domain at different membrane tube radii. φV: membrane surface fraction of the FERM domain on the GUVs. S: sorting ratio. R: membrane tube radius. Measurements were collected from N = 5 GUVs, n = 2 sample preparations.
Figure 3—figure supplement 1
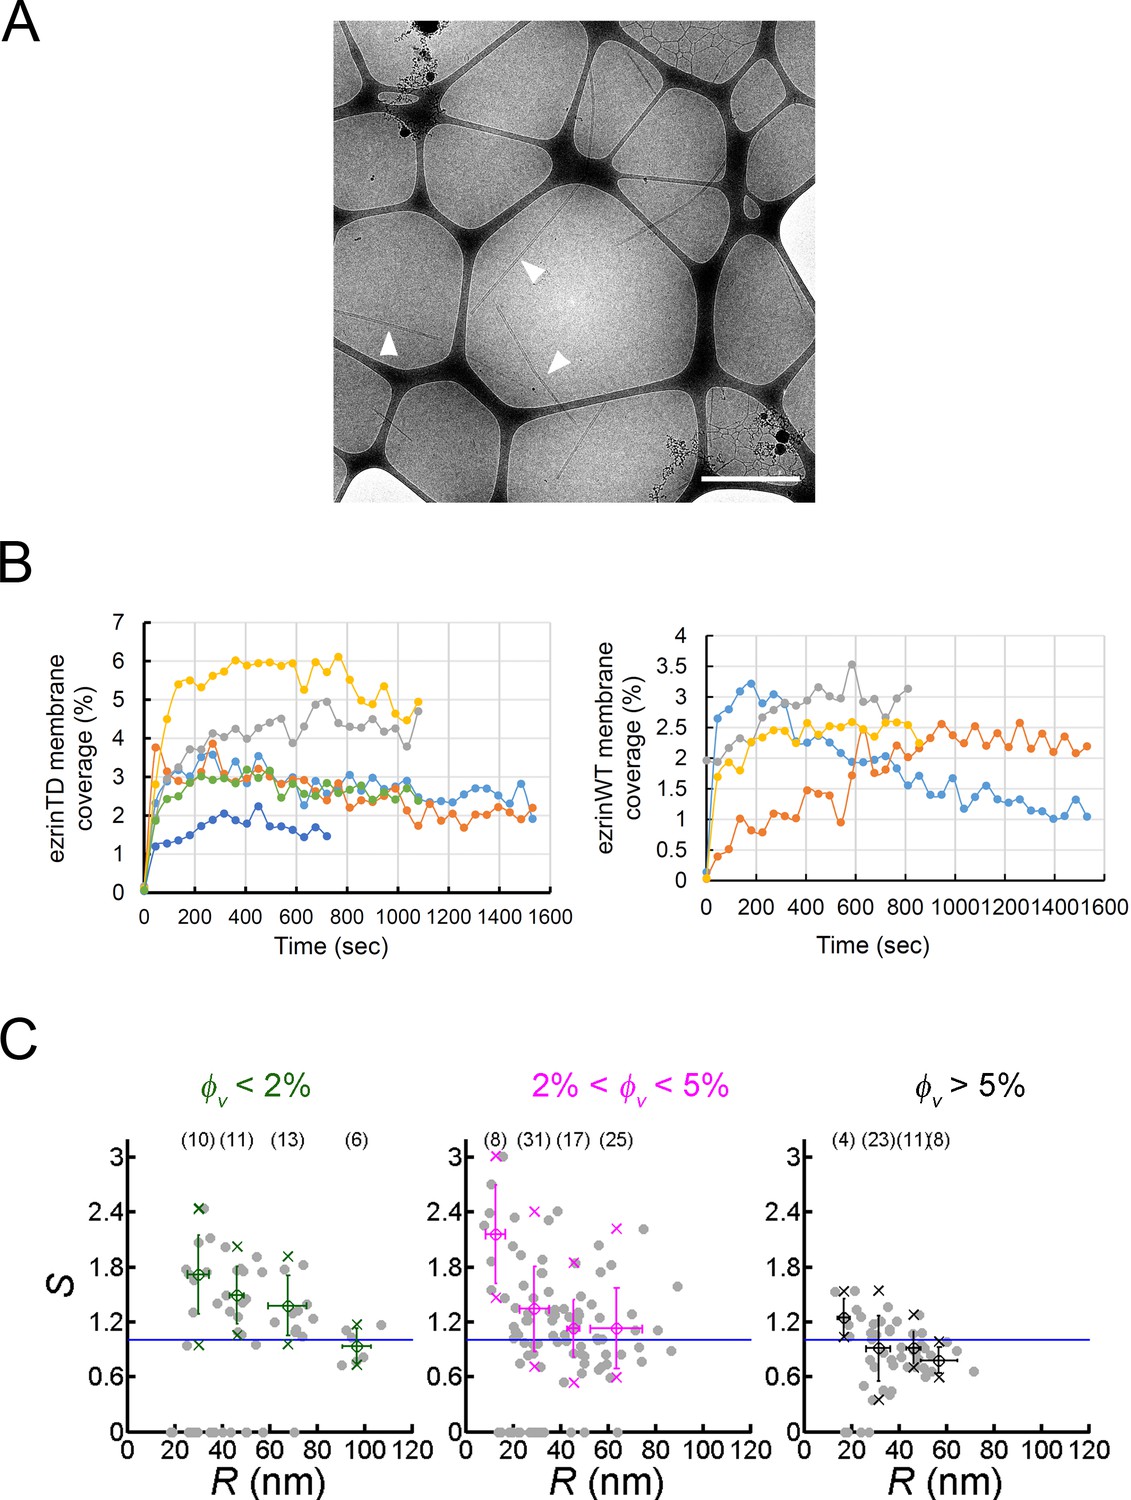
Binding of ezrin on GUVs and positive curvature-induced sorting of ezrinTD on membrane nanotubes.
(A) Galactocerebroside nanotubes in the absence of ezrin. Arrowheads indicate some of the nanotubes. Nanotube concentration: 0.1 g.L−1. Scale bar, 1 μm. (B) Time courses of ezrinTD and ezrinWT binding on PIP2-containing GUVs, showing that the steady state for protein coverage is reached generally in less than 200 s after protein injection. One curve represents an individual GUV measurement. (C) Sorting ratio, S, as a function of tube radius, R, for ezrinTD. The same figure as in Figure 3F with circles showing individual data points. φV: ezrin membrane surface fraction. Measurements were collected from N = 63 GUVs, , n > 3 independent sample preparations. Error bars indicate standard deviations, circles are mean and X symbols are maximum and minimum for each condition, data numbers were indicated in the brackets, excluding S = 0 data.
Figure 4 with 1 supplement
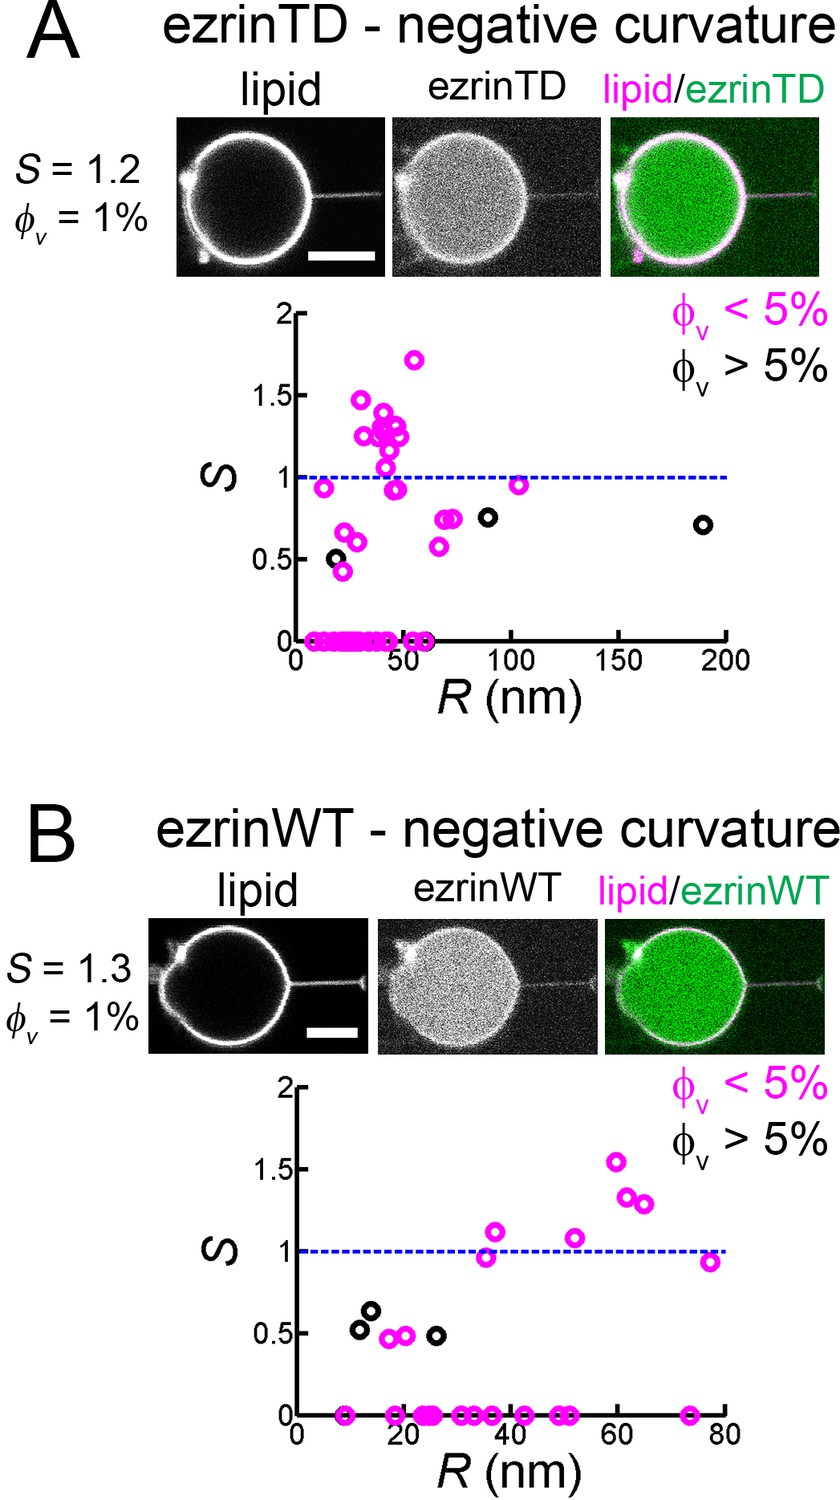
Both ezrinTD and ezrinWT do not sense negative membrane curvature.
(A) and (B) Tube pulling experiments from GUVs encapsulating ezrinTD (A) or ezrinWT (B). (Top) Representative confocal images of ezrin sorting experiments, corresponding to (A) a sorting ratio S = 1.2 at φv =1% and (B) S = 1.3 at φv=1%, respectively. Scale bars, 5 μm. (Bottom) Sorting ratio, S, as a function of membrane tube radius R and for different ezrin surface fractions on the GUVs, φv. Measurements were collected from N = 26 GUVs (n > 3 sample preparations), and N = 7 GUVs (n = 3 sample preparations), for ezrinTD and ezrinWT, respectively. Blue lines indicate S = 1.
Figure 4—figure supplement 1
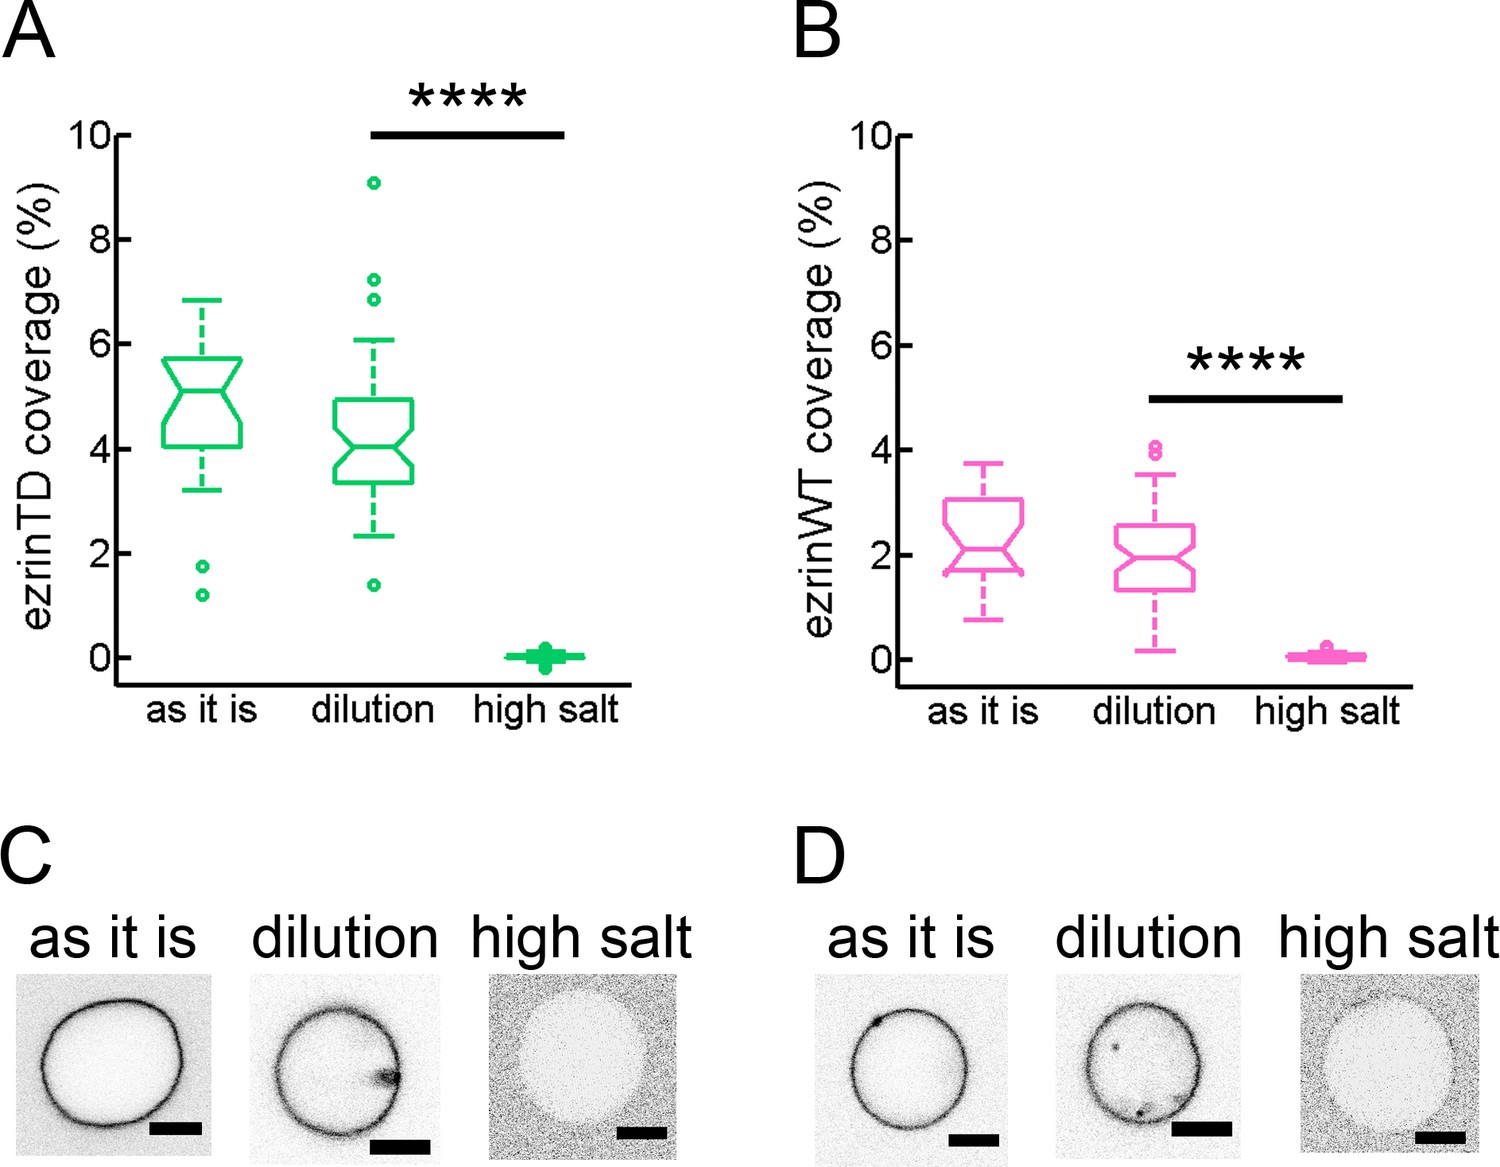
Salt-induced desorption of ezrinTD and ezrinWT bound to the outer leaflet of GUVs.
(A) and (B) Membrane coverages of ezrinTD (A) and ezrinWT (B) at different salt conditions. GUVs were first incubated with ezrin at a concentration of 0.5 μM in a sucrose buffer (60 mM NaCl, named as it is), followed by dilution either in a glucose buffer (60 mM NaCl, named dilution) or a high salt buffer (300 mM NaCl, named high salt) corresponding to the encapsulation experiments. Statistics: (A) N = 19, 46, 61 and (B) N = 18, 58, 55, for conditions ‘as it is’, ‘dilution’ and ‘high salt’, respectively. Measurements were taken from distinct GUVs for n = 2 sample preparations. p<0.0001 (t-test), comparing ezrin binding on GUVs at the buffer conditions of ‘dilution’ and ‘high salt’ (indicated by ****). We noted that the wide distribution of ezrin coverages on GUVs is due to the wide distribution of PIP2 content in GUV membranes. (C) and (D) Representative confocal images of fluorescence signals of ezrinTD (A) and ezrinWT (B) on GUVs in the corresponding experimental conditions. Inverted grayscale images are shown. Scale bars, 5 μm.
-
Figure 4—figure supplement 1—source data 1
Source data of Figure 4—figure supplement 1A and B.
- https://doi.org/10.7554/eLife.37262.014
Figure 5
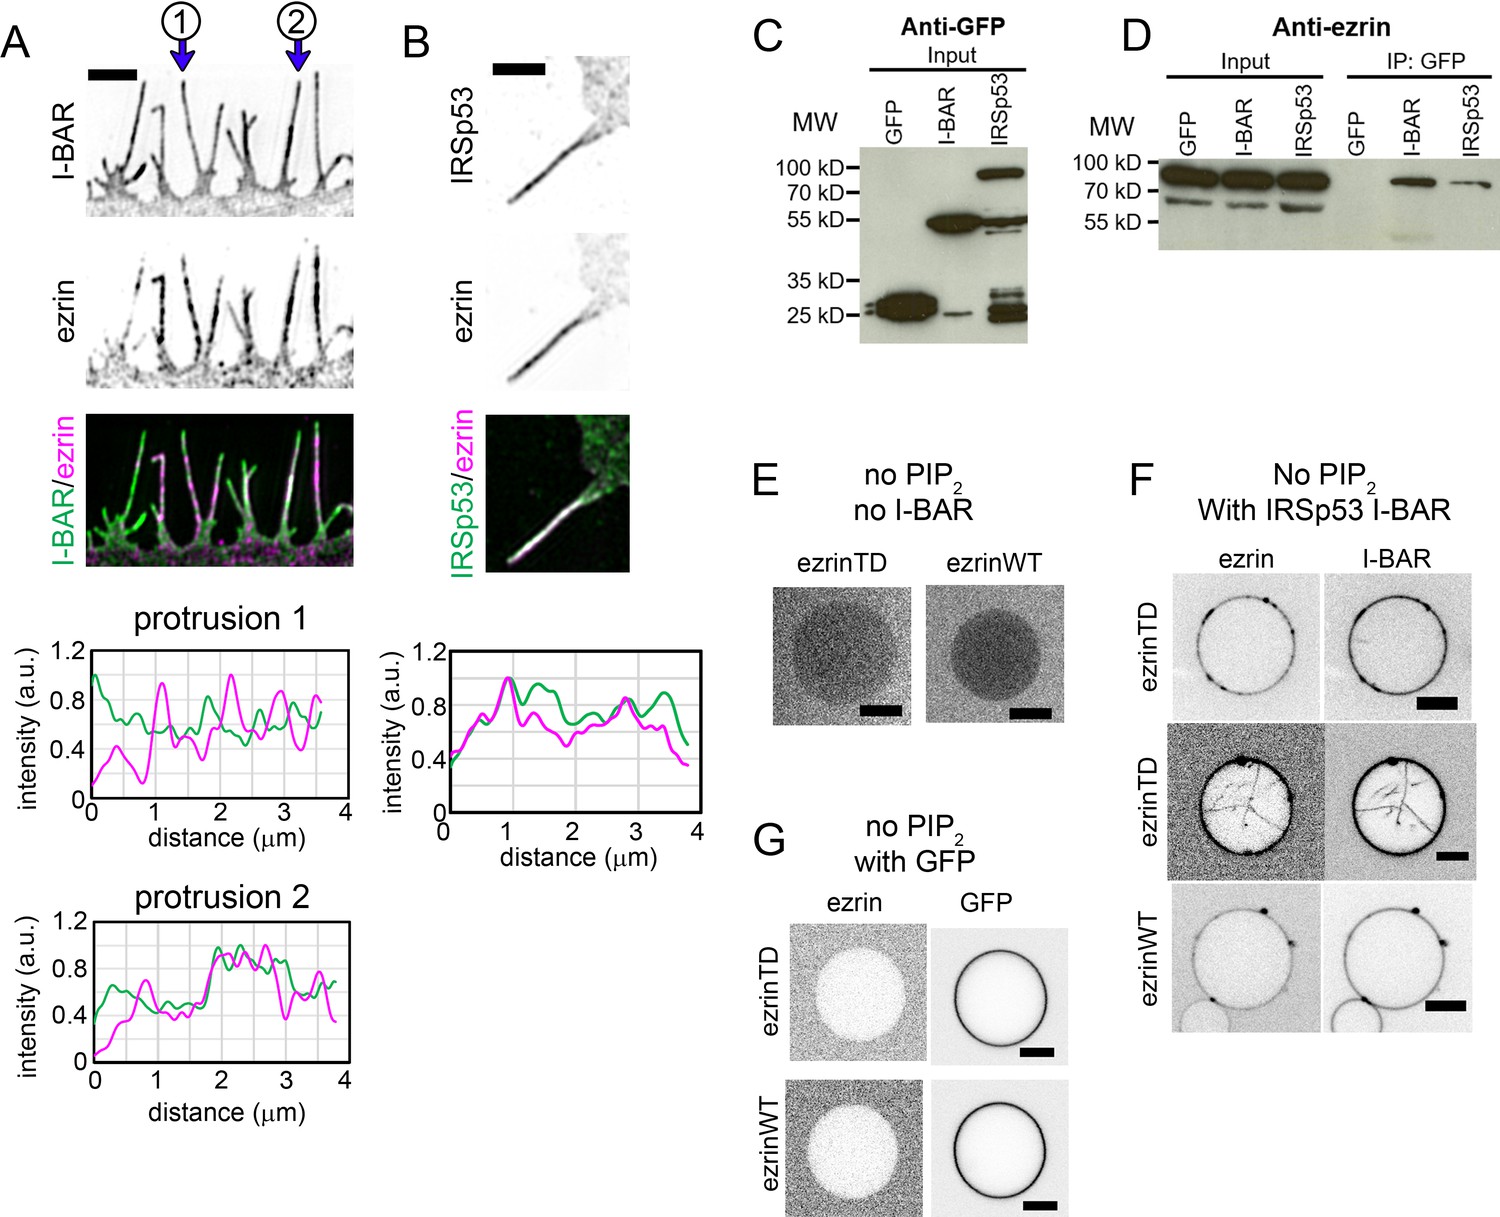
Ezrin partially colocalizes with IRSp53 in cellular protrusions and directly interacts with the I-BAR domain of IRSp53.
(A) and (B) (Top) Representative structured illumination microscopy images of cellular protrusions of LLC-PK1 cells transfected with plasmids encoding GFP-I-BAR domain (A) or GFP-IRSp53 (B), and immunolabeled for endogenous ezrin. Scale bars, 2 μm. Inverted grayscale images are shown, unless color codes are indicated in the figure. (Bottom) Normalized fluorescence intensity profiles of protrusions indicated in (A) and the protrusion in (B). The distance zero is at the tip of the protrusions and the distance goes along the protrusions until the base of the protrusions at the cell edge. (C) and (D) GFP, GFP-IRSp53 or GFP-I-BAR domain transfected HeLa cells were lysed and immunoprecipitated (IP) using GFP-trap. Cell lysates (input) and IP were analyzed by Western blot for the expression of GFP, GFP-I-BAR domain and GFP-IRSp53 using an anti-GFP antibody (C) and pull down of endogenous ezrin using an anti-ezrin antibody (D). (E–G) Representative confocal images of ezrinTD or ezrinWT binding to Ni-GUVs in the absence of both PIP2 and the I-BAR domain (E), in the absence of PIP2 but in the presence of the I-BAR domain of IRSp53 (F), or in the absence of PIP2 but in the presence of GFP (G). I-BAR domain occasionally induces tubules in the absence of PIP2 and ezrinTD is recruited in these I-BAR domain-induced tubules, as shown in (F). Protein bulk concentrations: for ezrinTD and ezrinWT, 1 μM, and for the I-BAR domain, 2 μM. Scale bars, 5 μm. Inverted grayscale images were shown.
Figure 6 with 1 supplement
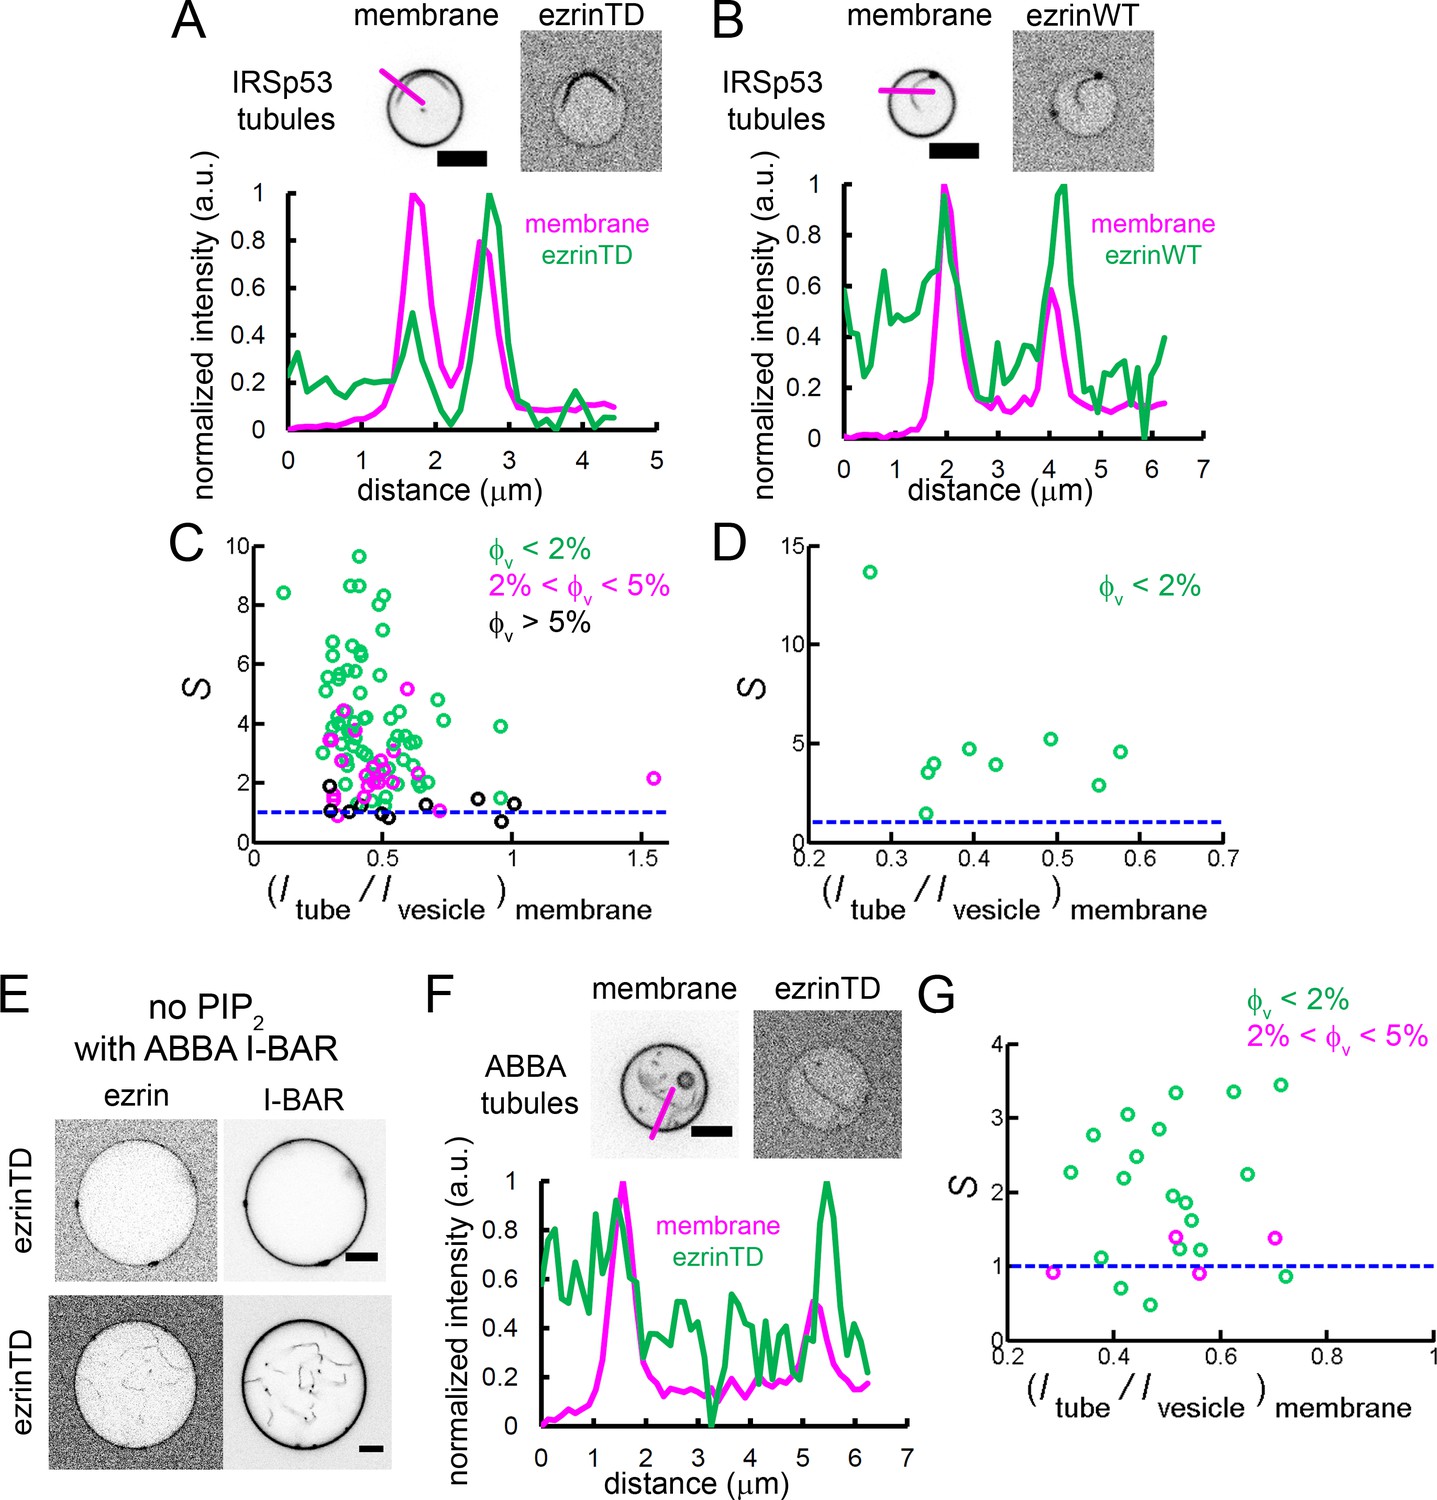
Enrichment of ezrinTD and ezrinWT in I-BAR domain induced tubules.
(A) and (B) (Top) Representative confocal images of ezrinTD (A), and ezrinWT (B) in IRSp53 I-BAR domain induced tubules. Scale bars, 5 μm. (Bottom) Normalized fluorescence intensity profiles along the line drawn from outside the GUV towards the interior of the GUV, as indicated in the top image. Inverted grayscale images are shown. (C) and (D) Sorting of ezrinTD (C) and ezrinWT (D) in IRSp53 I-BAR domain-induced membrane tubules at different membrane coverages of ezrin. corresponds to a tubule radius of about 30 nm. In (C), measurements were collected from N = 94 GUVs, n = 6 sample preparations. In (D), measurements were collected from N = 9 GUVs, n = 4 sample preparations. (E) Representative confocal image of ezrinTD binding to Ni-GUVs in the absence of PIP2 but in the presence of the I-BAR domain of ABBA. Protein bulk concentrations: ezrinTD, 1 μM, and ABBA I-BAR domain, 2 μM. Scale bars, 5 μm. Inverted grayscale images are shown. (F) (Top) Representative confocal images of ezrinTD in ABBA I-BAR domain-induced tubules. Inverted grayscale images were shown. (Bottom) Normalized fluorescence intensity profiles along the line drawn from outside the GUV towards the interior of the GUV, as indicated in the top image. (G) Sorting of ezrinTD in ABBA I-BAR domain-induced tubules at two different membrane coverages of ezrinTD. Measurements were collected from N = 19 GUVs, n = 3 sample preparations. Scale bars, 5 μm. φV: surface fraction of ezrinTD and ezrinWT on the GUVs. In (C, D and G), blue lines indicate S = 1.
Figure 6—figure supplement 1
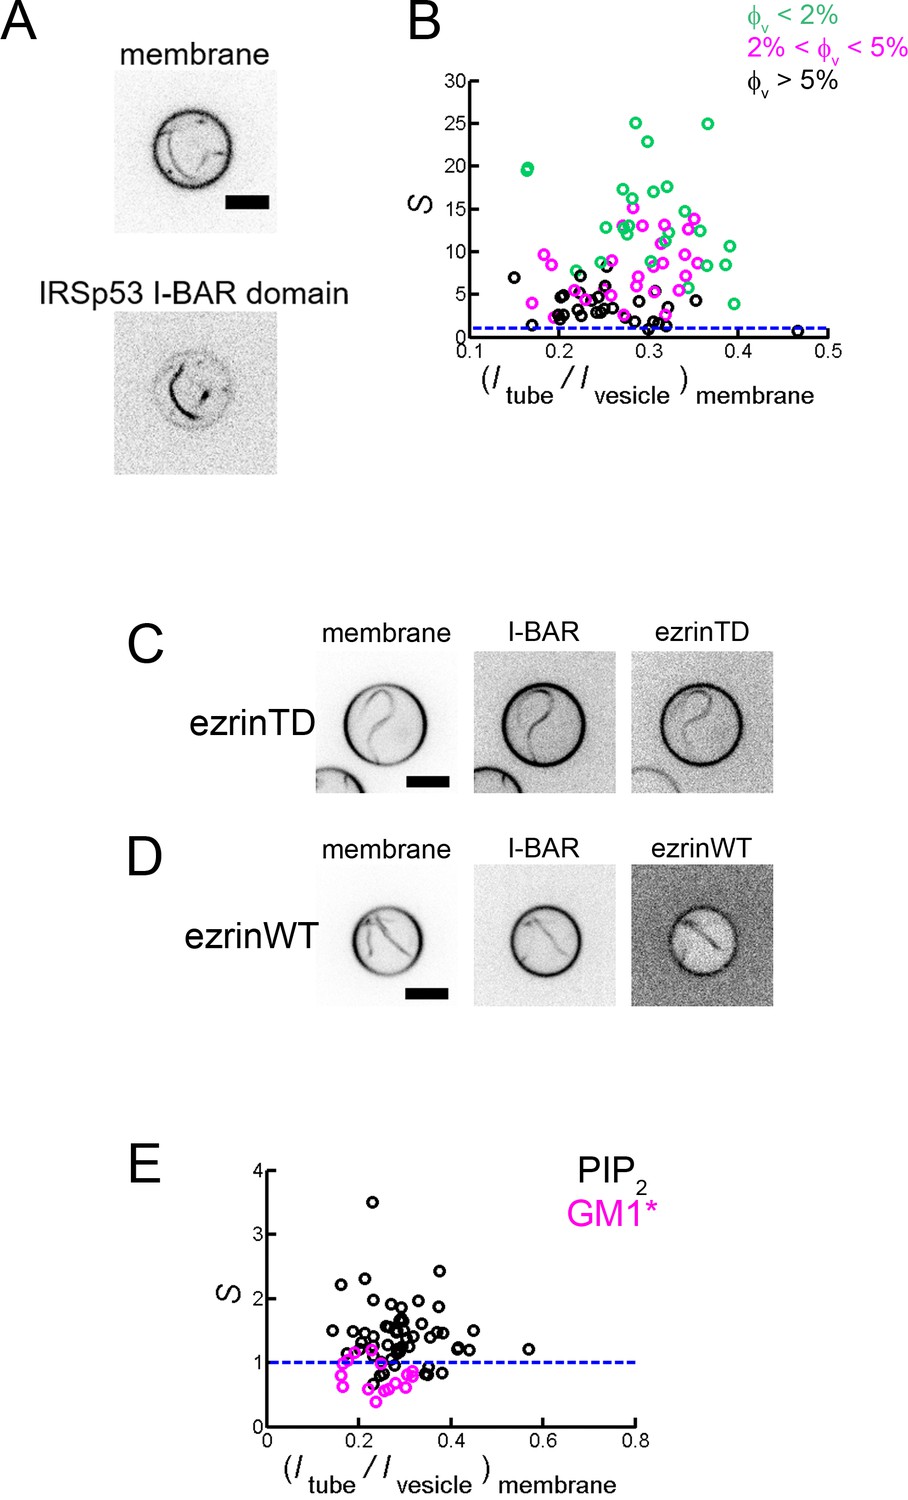
Sorting of IRSp53 I-BAR domain on self-induced membrane tubules and PIP2 enrichment in these tubules.
(A) Representative confocal images of IRSp53 I-BAR domain-induced tubules. Inverted grayscale images are shown. Scale bar, 5 μm. (B) Sorting of IRSp53 I-BAR domain on self-induced membrane tubules. Maximum sorting at corresponds to tube radius of about 20 nm. φV: surface fraction of the I-BAR domain on the GUVs. Measurements were collected from N = 69 GUVs, n = 2 sample preparations. Blue line indicates S = 1. (C) and (D) Colocalization of ezrinTD or ezrinWT with the I-BAR domain in tubules. Scale bars, 5 μm. Inverted grayscale images are shown. (E) Sorting of PIP2 (black circles) and GM1* (magenta circles) in IRSp53 I-BAR domain induced tubules. I-BAR domain concentration: 0.025 μM and 0.05 μM for PIP2 sorting and 0.025 μM and 0.1 μM for GM1* sorting. Measurements were collected from N = 55 GUVs, n = 2 sample preparations for PIP2 sorting and N = 16 GUVs, n = 2 sample preparations for GM1* sorting. Blue line indicates S = 1. Statistic test was performed using t-test on the distribution of data groups (two-sample assuming unequal variances) for PIP2 sorting and GM1* sorting, .
Author response image 1
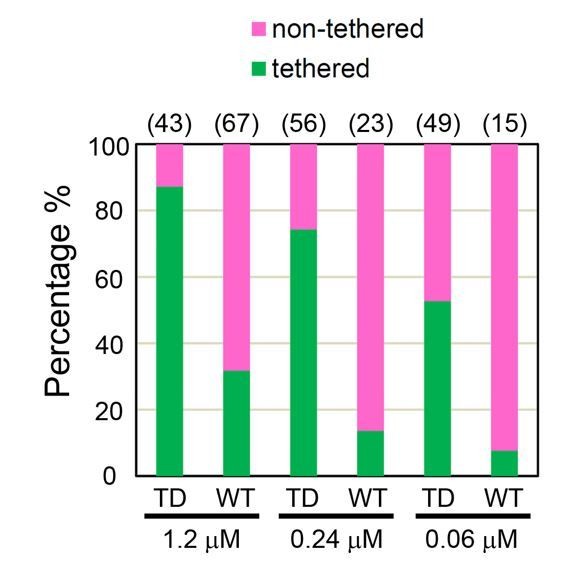
Percentages of tethered and non-tethered membranes deduced from cryo-EM at different ezrinTD and ezrinWT bulk concentrations.
The number of samples analyzed are listed on top for each condition. n = 2 experiments per condition for protein concentration at 1.2 μM and n = 1 experiment for the other conditions.
Videos
Video 1
Cryo-tomography of ezrinTD tethered membrane stacks.
Green colored structures represent tethered membrane stacks and magenta colored structures represent vesicular structures. Scale bar: 200 nm.
Video 2
Cryo-tomography of ezrinTD tethered membrane stacks.
Membranes are highlighted in yellow. Scale bar: 840 nm.
Additional files
-
Transparent reporting form
- https://doi.org/10.7554/eLife.37262.018
Download links
A two-part list of links to download the article, or parts of the article, in various formats.
Downloads (link to download the article as PDF)
Open citations (links to open the citations from this article in various online reference manager services)
Cite this article (links to download the citations from this article in formats compatible with various reference manager tools)
Ezrin enrichment on curved membranes requires a specific conformation or interaction with a curvature-sensitive partner
eLife 7:e37262.
https://doi.org/10.7554/eLife.37262


