Fitness effects of altering gene expression noise in Saccharomyces cerevisiae
- University of Michigan, United States
- CNRS UMR 7057, Université Paris Diderot, France
- University of Chicago, United States
Figures
Figure 1 with 1 supplement

A collection of TDH3 promoter alleles with incompletely correlated effects on average expression level and expression noise.
(A) Overview of experimental design used to quantify expression. The transcriptional activity of 171 different variants of the TDH3 promoter (PTDH3) inserted upstream of the YFP coding sequence was quantified using flow cytometry. After growth of six independent samples in rich medium (YPD) for each promoter variant, fluorescence intensity relative to cell size (forward scatter) was measured for ~10,000 individual cells and transformed into YFP mRNA estimates using the function shown in (B), allowing characterization of both the median and the standard deviation of expression of the reporter gene. (B) Non-linear relationship between YFP mRNA level and fluorescence intensity divided by cell size measured on a BD Accuri C6 flow cytometer. (C) Linear relationship between the logarithm of YFP mRNA level and the logarithm of fluorescence intensity divided by cell size. (B–C) YFP mRNA level was quantified by pyrosequencing and fluorescence intensity by flow cytometry in three biological replicates of eight strains expressing YFP under different variants of PTDH3. Fluorescence intensity was normalized by cell size as described in the Materials and methods section. The red line is the best fit of a function of shape to the data, with and . The blue dot represents a strain with two copies of the wild type PTDH3-YFP reporter. Data are available in Figure 1 – source data 1. (D) Median expression level and expression noise (noise strength: variance divided by median expression) for 43 PTDH3 alleles. These alleles were chosen to cover a broad range of median expression level and expression noise with an incomplete correlation between these two parameters. Colors represent different types of promoter mutations. Data are available in Source data 1. (B–D) Dotted lines show the activity of the wild type TDH3 promoter. Error bars are 95% confidence intervals calculated from at least four replicates for each genotype and are only visible when larger than dots representing data.
-
Figure 1—source data 1
Parallel measurements of fluorescence levels by flow cytometry and of YFP mRNA levels by pyrosequencing.
Pyrosequencing data were analyzed with the R script provided in Supplementary file 3. Data used to make Figure 1B–C.
- https://doi.org/10.7554/eLife.37272.006
Figure 1—figure supplement 1
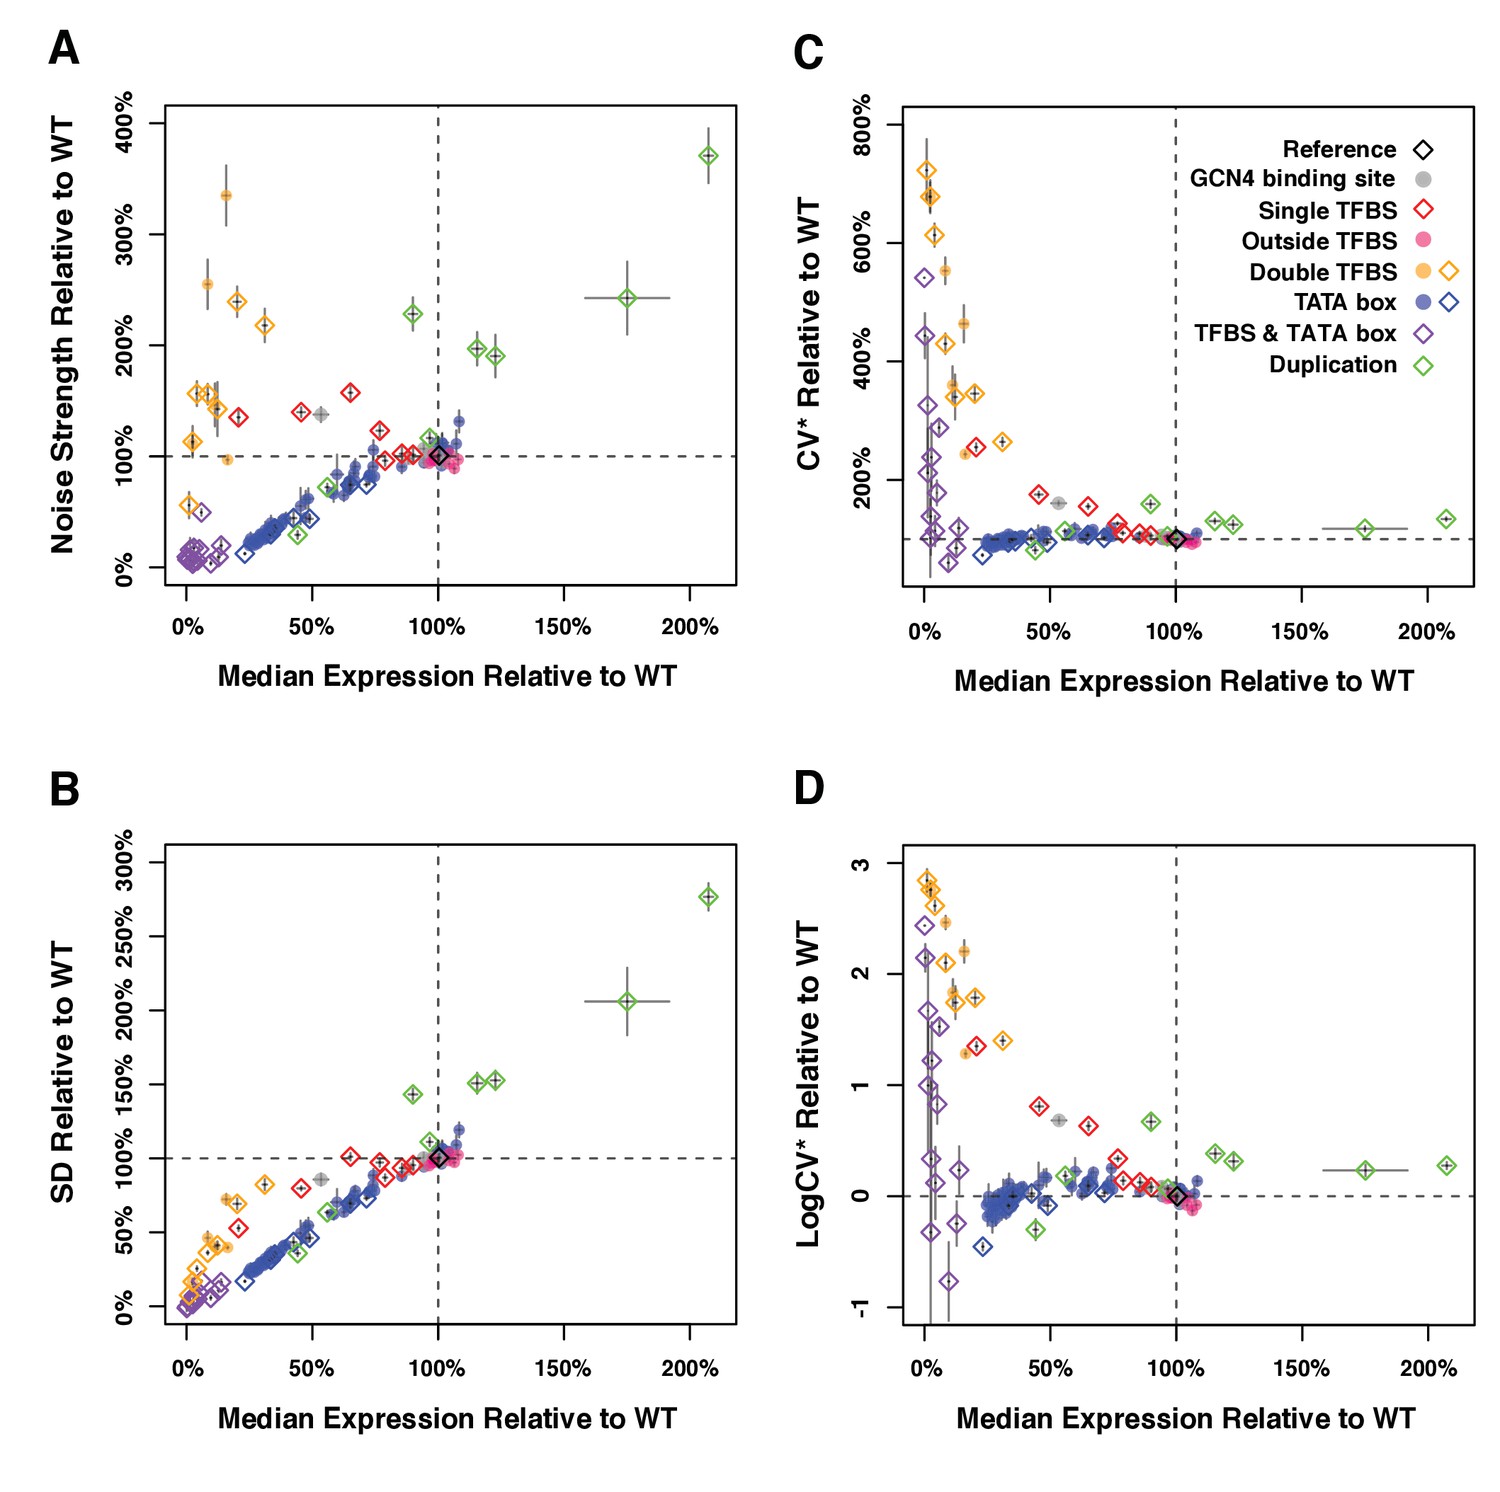
Median expression level and expression noise conferred by 171 variants of the TDH3 promoter using four different metrics of noise.
The four measures of expression noise are: (A) Noise strength, the variance divided by median fluorescence as in Figure 1 (B) SD, the standard deviation of fluorescence level among cells sharing the same genotype, (C) CV*, the standard deviation divided by median fluorescence level, and (D) LogCV*, the binary logarithm of CV*. Colors represent different categories of promoter variants based on the type of mutations they carry as indicated in (B). The dotted lines show the activity of the wild type TDH3 promoter. Open diamonds represent TDH3 promoter alleles included in the final set of 43 alleles and filled circles represent alleles not included in the final set. Error bars are 95% confidence intervals calculated from 6 replicates of each genotype. Numerical data are available in Figure 1—figure supplements 1—source data 1.
-
Figure 1—figure supplement 1—source data 1
Expression data for an initial set of 171 TDH3 promoter alleles.
Fluorescence levels were measured by flow cytometry and analyzed using the R script provided in Supplementary file 3. Data used to make Figure 1—figure supplement 1.
- https://doi.org/10.7554/eLife.37272.005
Figure 2 with 2 supplements
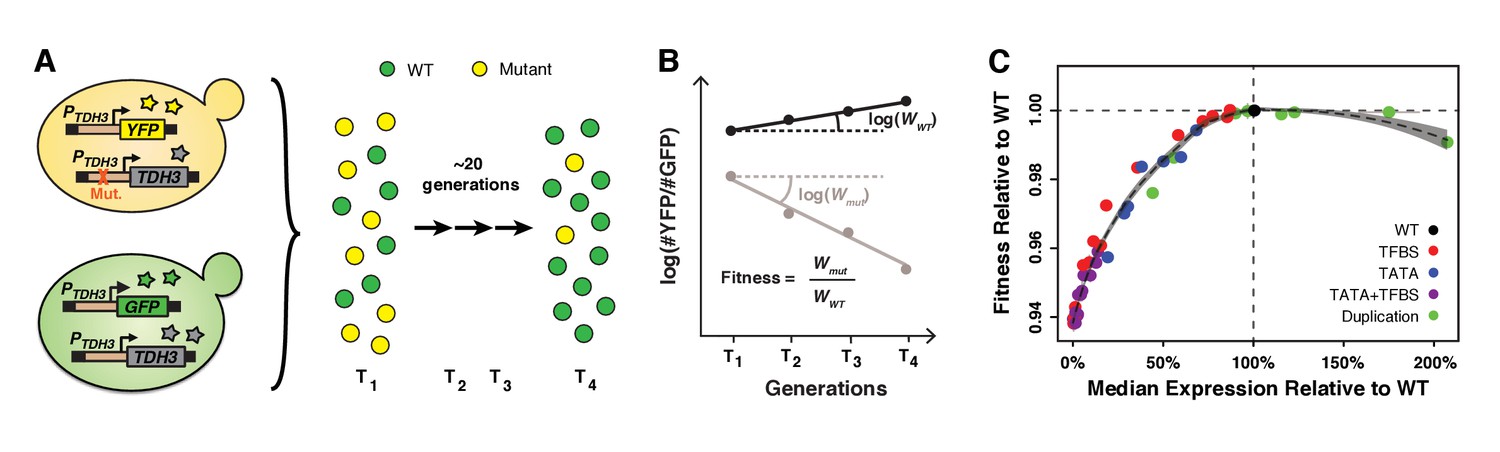
Fitness consequences of variation in TDH3 expression level.
(A) Overview of competition assays used to quantify fitness. The 43 PTDH3 alleles whose activity was described in Figure 1D were introduced upstream of the native TDH3 coding sequence in a genetic background expressing YFP under control of the wild type TDH3 promoter. A minimum of six replicate populations of the 43 strains were competed for ~20 generations in rich medium (YPD) against a common reference strain expressing GFP under control of the wild type TDH3 promoter. The relative frequency of cells expressing YFP or GFP was measured every ~7 generations using flow cytometry. (B) Competitive fitness was calculated from the change in genotype frequency over time. The relative fitness of each strain was calculated as the mean competitive fitness of that strain across replicates divided by the mean competitive fitness of the strain carrying the wild type allele of TDH3. (C) Relationship between median expression level of TDH3 and fitness in rich medium (YPD). Dots show the average median expression and average relative fitness measured among at least four replicates for each of the 43 PTDH3 alleles. Colors represent different types of promoter mutation. Error bars are 95% confidence intervals and are only visible when larger than dots. The dotted curve is the best fit of a LOESS regression of fitness on median expression, using a value of 2/3 for the parameter α controlling the degree of smoothing. The shaded area shows the 99% confidence interval of the LOESS fit. Data are available in Source data 1. Panels A and B were originally published as Figure 2A in Duveau et al. (2017a) and are reproduced here by permission of Oxford University Press [http://global.oup.com/academic].
Figure 2—figure supplement 1
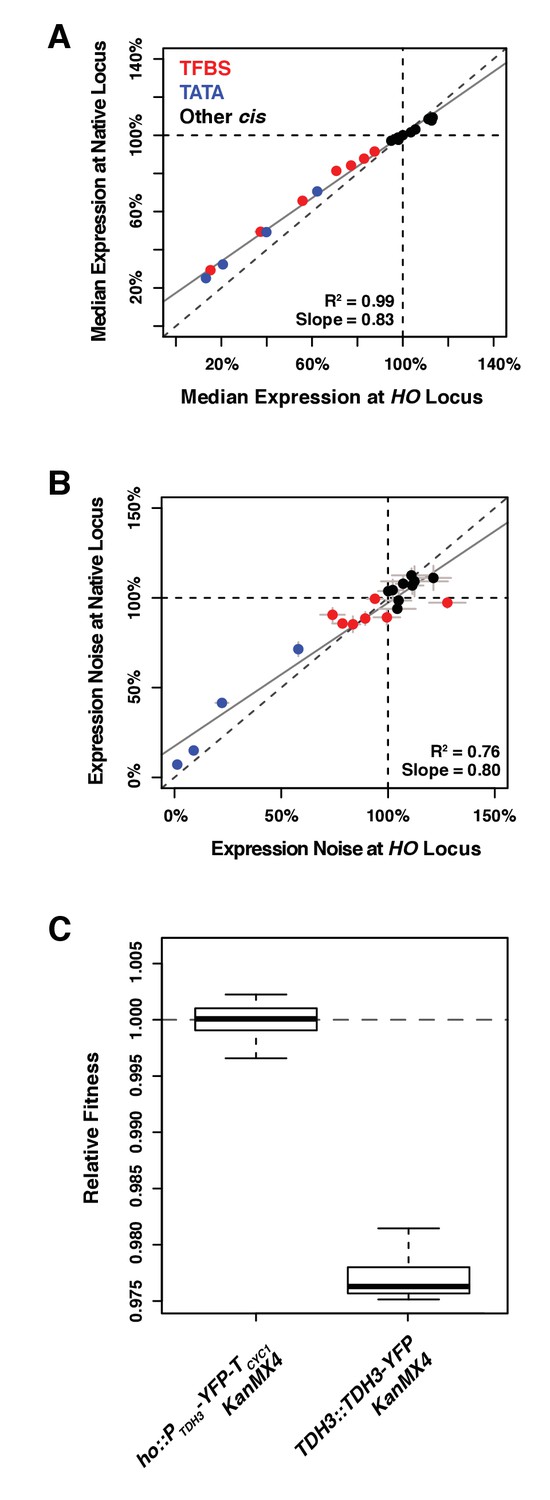
Comparing effects of 20 alleles of the TDH3 promoter on expression of the YFP reporter at HO and of expression of the TDH3-YFP fusion at the native TDH3 locus.
(A) Median expression and (B) expression noise (noise strength) were quantified in six replicates for 20 pairs of strains carrying 20 different TDH3 promoter variants inserted upstream of the YFP coding sequence at the HO locus or upstream of a TDH3-YFP gene fusion at the native TDH3 locus. Colors represent different categories of promoter variants as shown in (A). The dotted lines show the activity of the wild type TDH3 promoter and the plain lines represent least square linear fits to data. Error bars are 95% confidence intervals. (C) Fitness consequence of the fusion of the YFP fluorescent protein at the C-terminus end of TDH3. Protein fusion was achieved with the strategy described in Huh et al. (2003), using the same polypeptide spacer of 10 amino acids between the two proteins. Fitness was measured for 12 replicate populations of two different genotypes. The first genotype (left) expresses YFP and TDH3 under control of two separate copies of the TDH3 promoter. The second genotype (right) expresses the TDH3-YFP gene fusion under control of the TDH3 promoter, which caused a significant fitness reduction.
-
Figure 2—figure supplement 1—source data 1
Activity of 20 PTDH3 alleles driving expression of YFP at the HO locus compared to the activity of the same alleles driving expression of a TDH3-YFP gene fusion at the TDH3 locus.
The median and noise of activity of the 20 PTDH3 alleles were measured by flow cytometry and analyzed using the R script provided in Supplementary file 3. Data used to make Figure 2—figure supplement 1A–B.
- https://doi.org/10.7554/eLife.37272.009
Figure 2—figure supplement 2
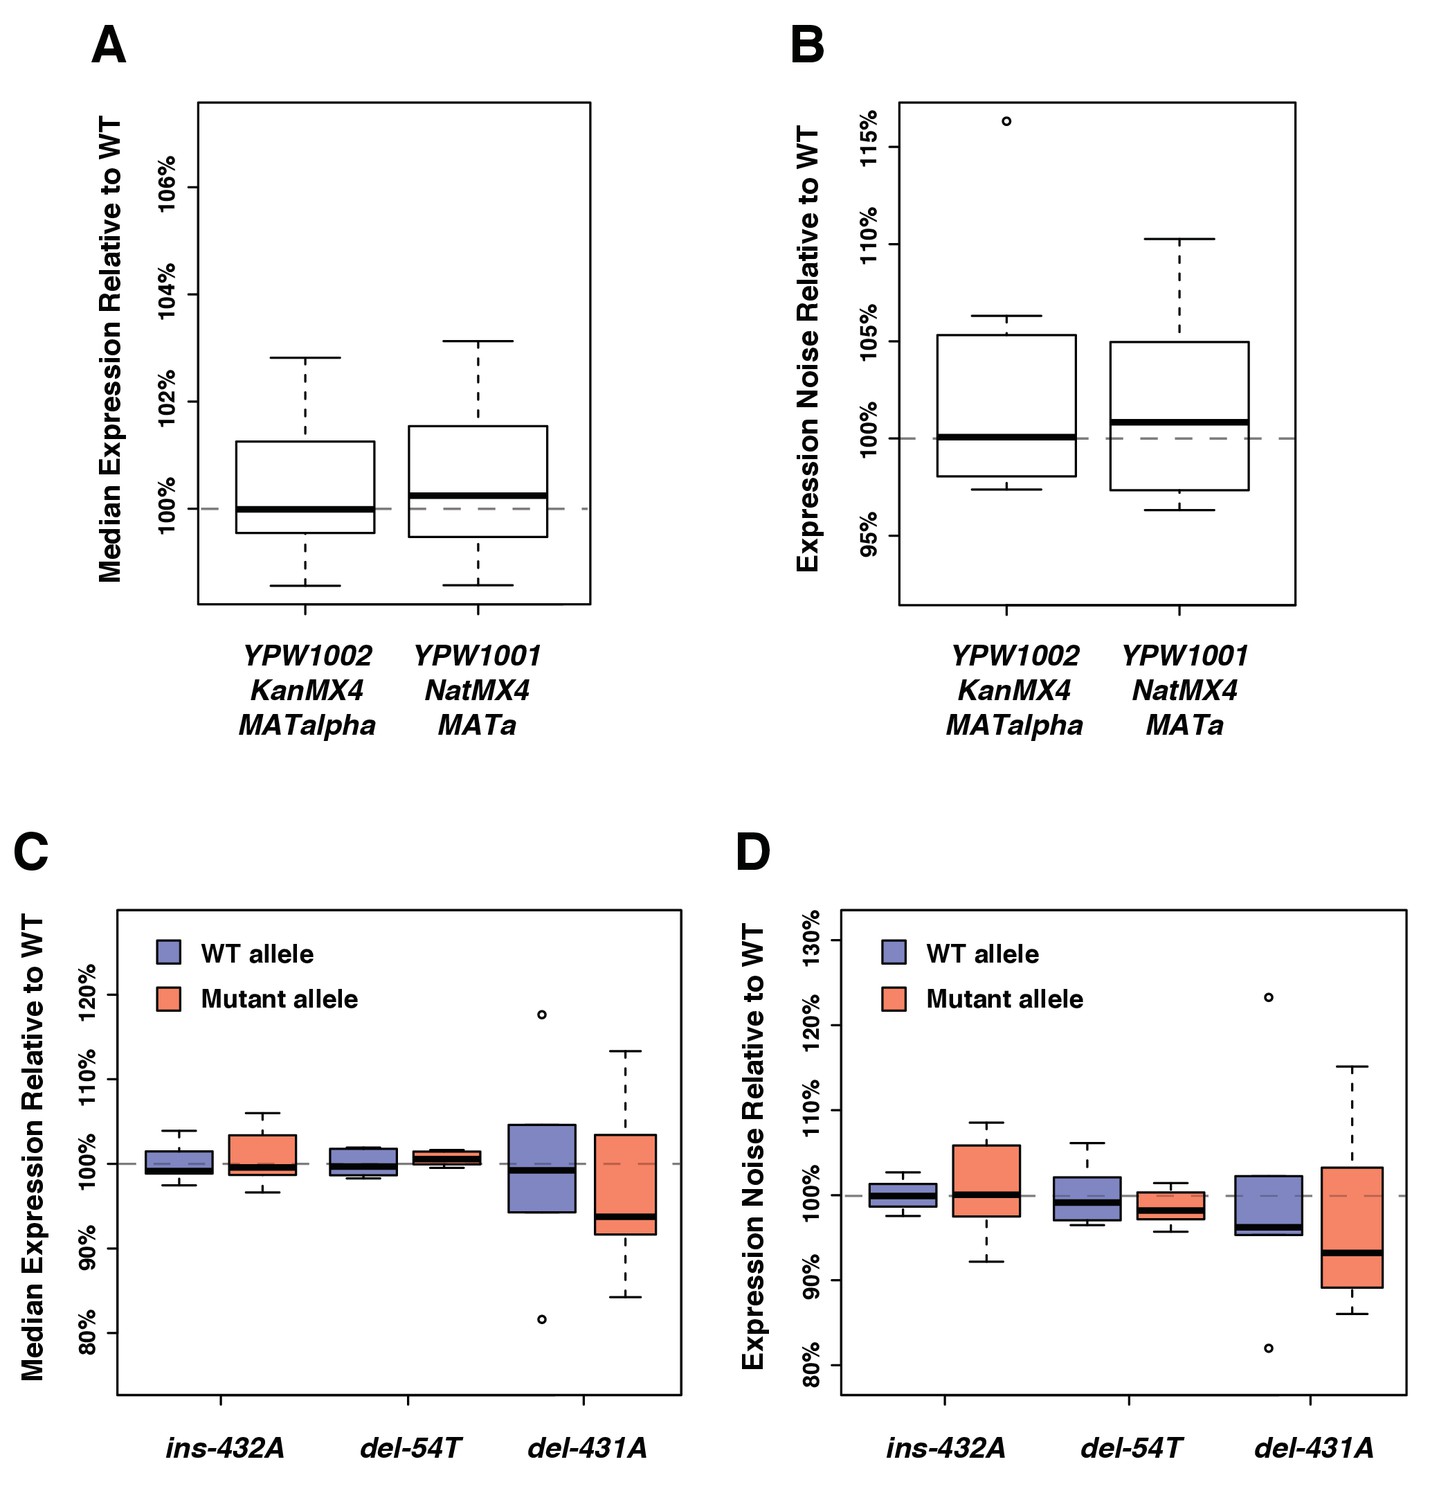
No significant impact of the genetic background on the expression of the fluorescent reporter.
(A) Differences in drug resistance marker or mating type that exist between the strains used in the expression assays and the strains used in the fitness assays do not affect median expression. (B) The genetic changes mentioned in (A) do not significantly affect expression noise (noise strength). (C) No significant impact on median expression of three indels that frequently occurred during the construction of the different PTDH3 alleles. Position of each mutation is relative to the start codon. (D) The three indels mentioned in (C) do not significantly affect expression noise (noise strength). (A–D) Thick bars represent the median across six replicates. The bottom and top lines of each box represent 25th and 75th percentiles.
Figure 3 with 8 supplements
Effect of TDH3 expression noise on fitness.
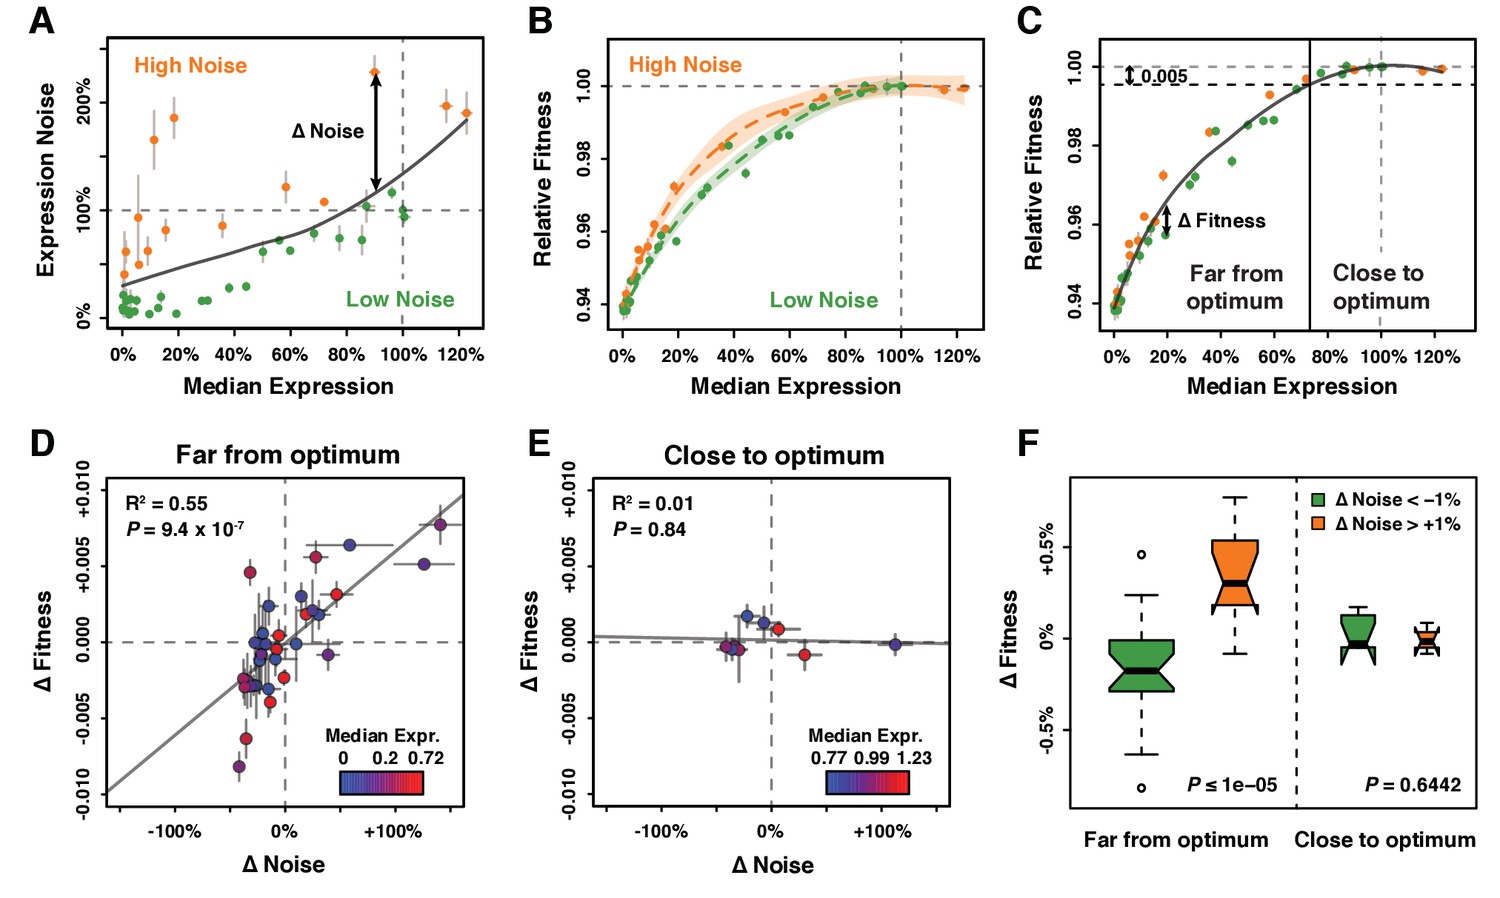
(A) Separation of the 43 PTDH3 alleles into two categories based on their effects on median expression level and expression noise (noise strength). The gray curve shows the LOESS regression of noise on median expression using a value of 2/3 for the smoothing parameter. Data points falling below the curve (green) correspond to PTDH3 alleles with low noise given their median level of activity. Data points above the curve (orange) correspond to PTDH3 alleles with high noise given their median activity. The residual of the LOESS regression (‘Δ Noise’) is a measure of noise independent of median expression. (B) Relationships between median expression level and fitness for strains with low noise (green, Δ Noise < −1%) and high noise (orange, Δ Noise >+1%). The two LOESS regressions were performed with smoothing parameter α equal to 2/3. (C) Partition of PTDH3 alleles into two groups based on the distance of their median activity to the optimal level of TDH3 expression. The expression optimum (vertical gray dotted line) corresponds to the expression level predicted to maximize fitness from the LOESS regression of fitness on median expression (gray curve). The expression level at which the predicted fitness is 0.005 below the maximal fitness was chosen as the threshold (vertical black dotted line) separating promoters with median activity ‘close to optimum’ from promoters with median activity ‘far from optimum’. The residual of the LOESS regression (‘Δ Fitness’) is a measure of fitness independent of the median TDH3 expression level. Dots are colored as in (B). (D) Relationship between Δ Noise and Δ Fitness when median expression is far from optimum. (E) Relationship between Δ Noise and Δ Fitness when median expression is close to optimum. (D–E) The best linear fit between Δ Noise and Δ Fitness is shown as a gray line, with the coefficient of determination (‘R2’) and the significance of the Pearson’s correlation coefficient (‘P’) indicated in the upper left of each panel. Dots are colored based on median expression levels of the corresponding PTDH3 alleles as indicated by color gradient. (A–E) Error bars show 95% confidence intervals calculated from at least four replicate samples and are only visible when larger than symbols representing data points. (F) Comparison of Δ Fitness between genotypes with low noise strength (green, Δ Noise < −1%) and genotypes with high noise strength (red, Δ Noise >+1%). Thick horizontal lines represent the median Δ Fitness among genotypes and notches display the 95% confidence interval of the median. Bottom and top lines of each box represent 25th and 75th percentiles. Width of boxes is proportional to the square root of the number of genotypes included in each box. Permutation tests were used to assess the significance of the difference in median Δ Fitness between genotypes with low and high noise and P-values are shown in lower right corners. For each test, the values of ΔNoise were randomly shuffled among genotypes 100,000 times. The P values shown below each plot represent the proportion of permutations for which the absolute difference in median phenotype between genotypes with low and high ΔNoise was greater than the observed absolute difference in median phenotype between genotypes with low and high ΔNoise. Data are available in Source data 1.
Figure 3—figure supplement 1

Calculation of ΔNoise and ΔFitness using four different metrics of noise.
The four metrics of noise were: (A,E,I) the variance of expression divided by the median expression (noise strength), (B,F,J) the standard deviation of expression among genetically identical cells (SD), (C,G,K) the standard deviation divided by the median expression (CV*) and (D,H,L) the binary logarithm of the standard deviation divided by the median expression (LogCV*). (A–D) Separation of the 43 PTDH3 alleles in two categories based on their effects on median expression level and each of the four metrics of expression noise. The gray curve shows the LOESS regression of noise on median expression using a value of 2/3 for the smoothing parameter. Data points falling below the curve (green) correspond to PTDH3 alleles with low noise given their median level of activity. Data points above the curve (orange) correspond to PTDH3 alleles with high noise given their median activity. The residual of the LOESS regression (‘ΔNoise’) is a measure of noise independent of median expression. (E–H) Distinct relationship between median expression level and fitness for strains with low noise (blue, ΔNoise* < −1%) and high noise (red, ΔNoise* >+1%). The two LOESS regressions were performed with smoothing parameter α equal to 2/3. (I–L) Partition of PTDH3 alleles in two groups based on the distance of their median activity to the optimal level of TDH3 expression. The expression optimum (vertical gray dotted line) corresponds to the expression level predicted to maximize fitness from the LOESS regression of fitness on median expression (gray curve). The expression level at which the predicted fitness is 0.005 below the maximal fitness was chosen as the threshold (vertical black dotted line) separating promoters with median activity ‘close to optimum’ from promoters with median activity ‘far from optimum’. The residual of the LOESS regression (‘ΔFitness’) is a measure of fitness independent of the median TDH3 expression level. (A–L) Error bars show 95% confidence intervals calculated from at least four replicate populations.
Figure 3—figure supplement 2

Relationship between median expression level and four different metrics of ΔNoise.
ΔNoise was calculated as the residuals of a LOESS regression of expression noise on median expression, using four different metrics of noise: (A) Noise strength, equal to SD2/median (B) SD, the standard deviation of expression among genetically identical cells (C) CV*, equal to SD/median and (D) LogCV*, equal to log2(SD/median). The best linear fit between median expression and ΔNoise is shown as a gray line, with the coefficient of determination (‘R2’) and the significance of the Pearson’s correlation coefficient (‘P’) indicated in the upper right. As expected, ΔNoise strength, ΔSD, ΔCV* and ΔLogCV* are all uncorrelated with median expression. Colors represent different types of mutations in the TDH3 promoter, as indicated in the lower right of panel (B). Error bars show 95% confidence intervals calculated from 4 to 6 replicates.
Figure 3—figure supplement 3

Relationship between median expression level and Δ Fitness.
ΔFitness was calculated as the residuals of a LOESS regression of fitness on median TDH3 expression. Genotypes were colored based on their level of noise measured as (A) Noise strength, equal to SD2/median (B) SD, the standard deviation of expression among genetically identical cells (C) CV*, equal to SD/median and (D) LogCV*, equal to log2(SD/median). The best linear fit between median expression and ΔFitness is shown as a gray line, with the coefficient of determination (‘R2’) and the significance of the Pearson’s correlation coefficient (‘P’) indicated in the upper right. As expected, ΔFitness is uncorrelated with median expression of TDH3. Error bars show 95% confidence intervals calculated from 4 to 6 replicates.
Figure 3—figure supplement 4
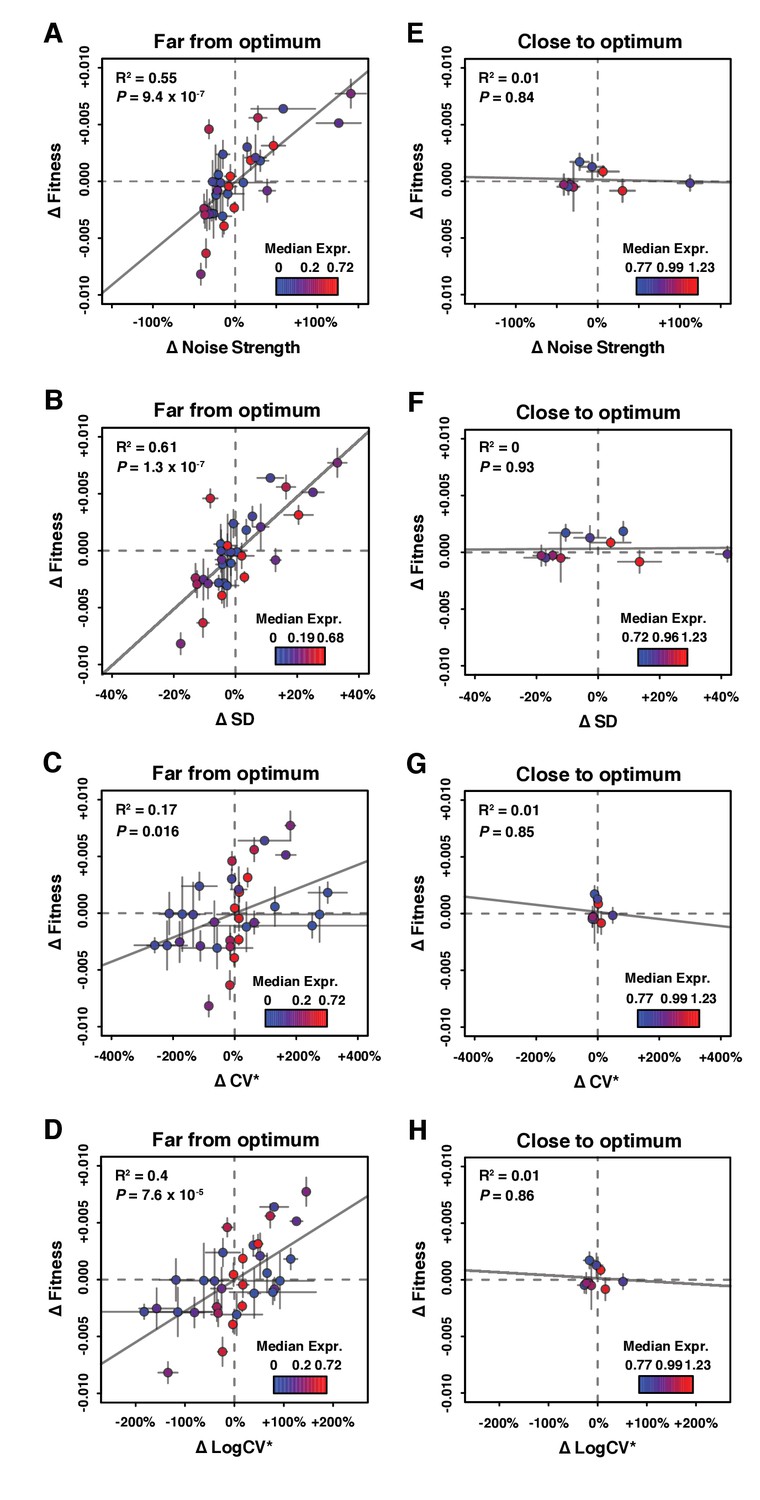
Relationship between ΔNoise and ΔFitness using four different metrics of noise.
ΔNoise was calculated as the residuals of a LOESS regression of expression noise on median expression, using four different metrics of noise: (A,E) Noise strength, equal to SD2/median (B,F) SD, the standard deviation of expression among genetically identical cells (C,G) CV*, equal to SD/median and (D,H) LogCV*, equal to log2(SD/median). (A–D) Relationship between ΔNoise and ΔFitness when median expression is far from optimum. (E–H) Relationship between ΔNoise and ΔFitness when median expression is close to optimum. (A–H) The best linear fit between ΔNoise and ΔFitness is shown as a gray line, with the coefficient of determination (‘R2’) and the significance of the Pearson’s correlation coefficient (‘P’) indicated in the upper left of each panel. Dots are colored based on median expression levels of the corresponding PTDH3 alleles as indicated by color gradient. Error bars show 95% confidence intervals calculated from at least four replicate populations.
Figure 3—figure supplement 5

Robustness of the correlation between ΔNoise and ΔFitness to variation in the smoothing parameter of the LOESS regression used to compute ΔNoise.
ΔNoise was calculated as the residuals of a LOESS regression of expression noise on median expression, using four different metrics of noise: (A,B) Noise strength, equal to SD2/median (C,D) SD, the standard deviation of expression among genetically identical cells (E,F) CV*, equal to SD/median and (G,H) LogCV*, equal to log2(SD/median). The Pearson’s Correlation Coefficient (PCC) between ΔNoise and ΔFitness was computed for 100 combinations of three parameters for (A,C,E,G) strains with a TDH3 expression level far from optimum and (B,D,F,H) strains with a TDH3 expression level close to optimum. The three parameters that were varied were (1) the smoothing parameter of the LOESS regression used to compute ΔNoise (2/6, 3/6, 4/6, 5/6 and 1), (2) the smoothing parameter of the LOESS regression used to compute ΔFitness (2/6, 3/6, 4/6, 5/6 and 1) and (3) the fitness threshold used to classify strains as far from optimum or close to optimum (0.0025, 0.005, 0.075, 0.01). For each plot, the five boxes represent the variation of PCC between ΔNoise and ΔFitness when parameter one is fixed to one of the values shown on the x-axis and the two other parameters are allowed to vary. The thick horizontal lines represent the median PCC across the 20 combinations of parameters 2 and 3. The bottom and top lines of each box represent the 25th and 75th percentiles. Parameter values used in the main figures are shown in red.
Figure 3—figure supplement 6
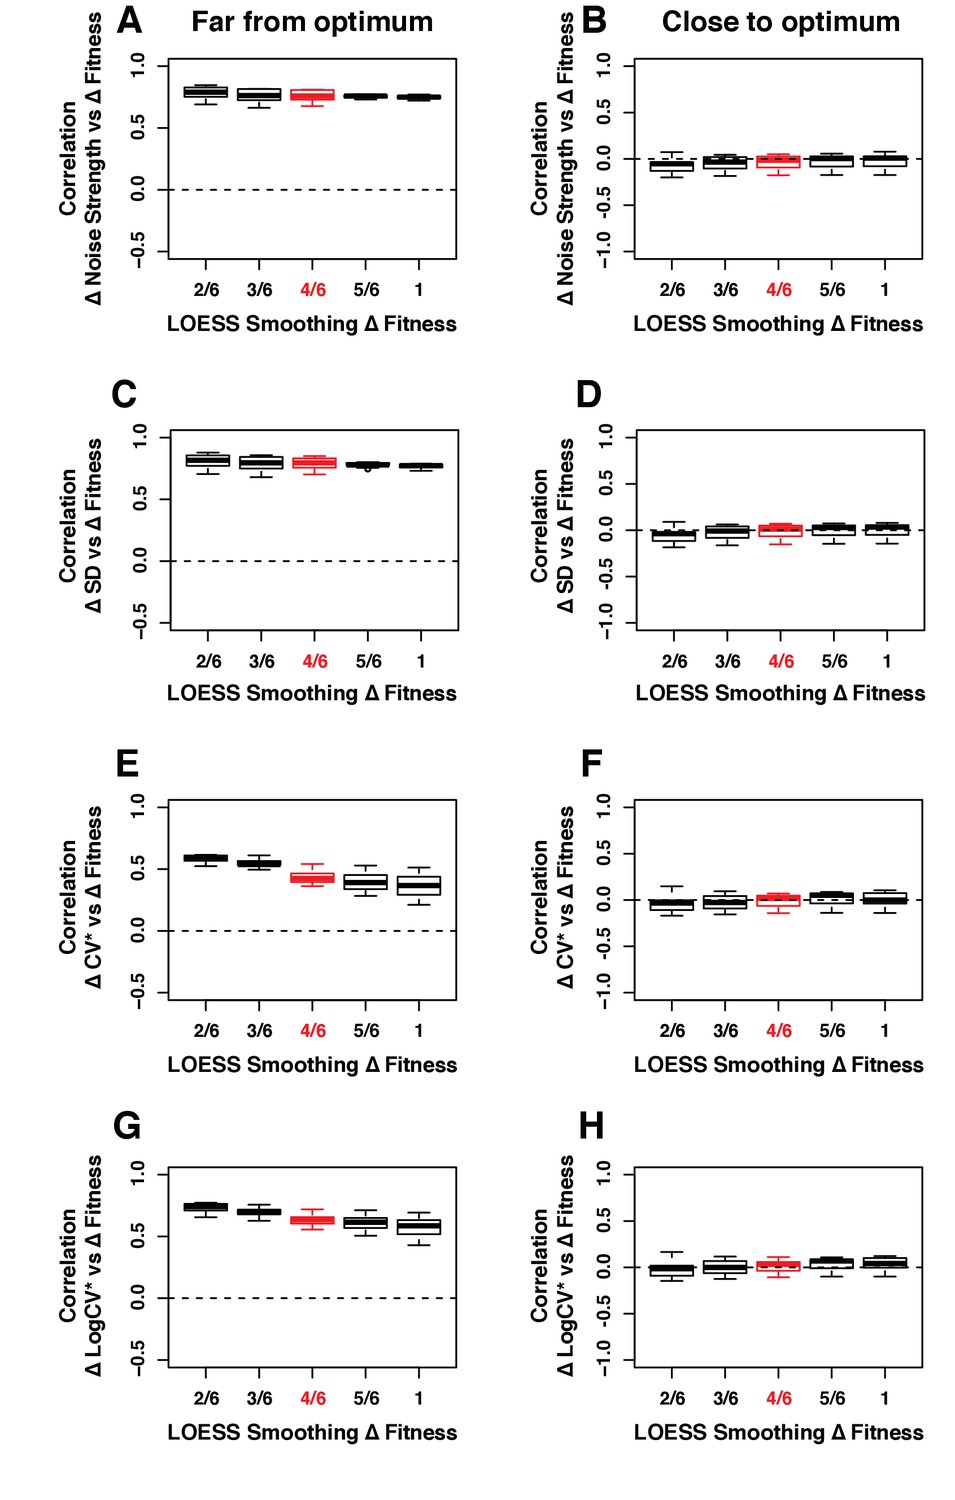
Robustness of the correlation between ΔNoise and ΔFitness to variation in the smoothing parameter of the LOESS regression used to compute ΔFitness.
ΔNoise was calculated as the residuals of a LOESS regression of expression noise on median expression, using four different metrics of noise: (A,B) Noise strength, equal to SD2/median (C,D) SD, the standard deviation of expression among genetically identical cells (E,F) CV*, equal to SD/median and (G,H) LogCV*, equal to log2(SD/median). The Pearson’s Correlation Coefficient (PCC) between ΔNoise and ΔFitness was computed for 100 combinations of three parameters for (A,C,E,G) strains with a TDH3 expression level far from optimum and (B,D,F,H) strains with a TDH3 expression level close to optimum. The three parameters that were varied were (1) the smoothing parameter of the LOESS regression used to compute ΔNoise (2/6, 3/6, 4/6, 5/6 and 1), (2) the smoothing parameter of the LOESS regression used to compute ΔFitness (2/6, 3/6, 4/6, 5/6 and 1) and (3) the fitness threshold used to classify strains as far from optimum or close to optimum (0.0025, 0.005, 0.075, 0.01). For each plot, the five boxes represent the variation of PCC between ΔNoise and ΔFitness when parameter two is fixed to one of the values shown on the x-axis and the two other parameters are allowed to vary. The thick horizontal lines represent the median PCC across the 20 combinations of parameters 1 and 3. The bottom and top lines of each box represent the 25th and 75th percentiles. Parameter values used in the main figures are shown in red.
Figure 3—figure supplement 7
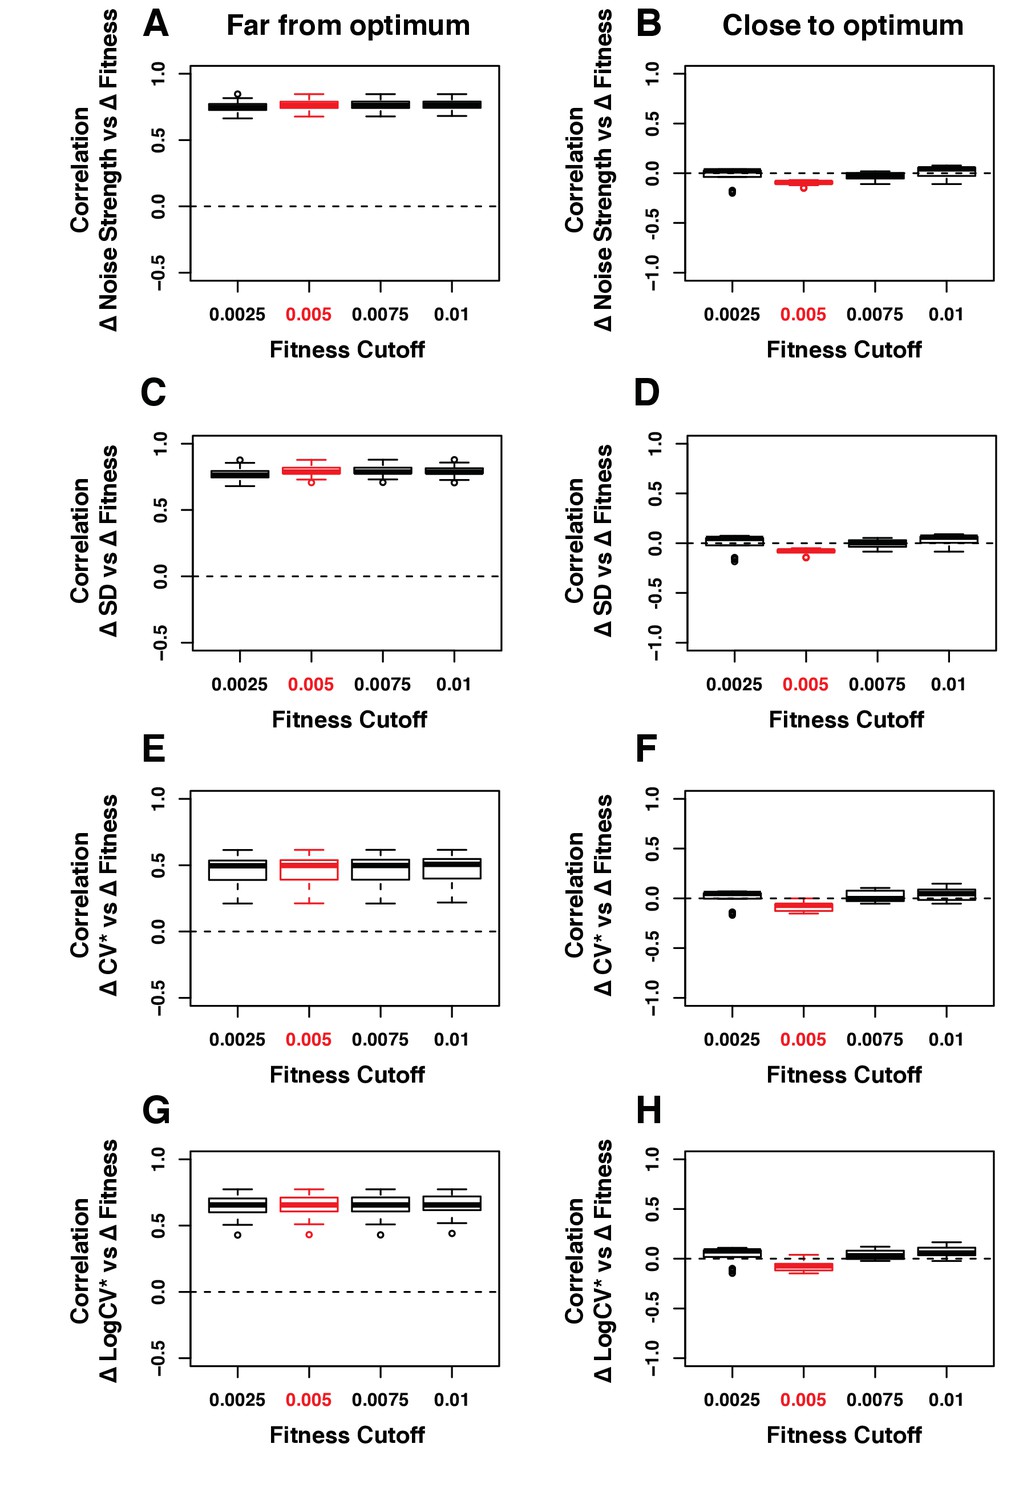
Robustness of the correlation between ΔNoise and ΔFitness to variation in the fitness threshold used to classify genotypes as far or close to optimum.
ΔNoise was calculated as the residuals of a LOESS regression of expression noise on median expression, using four different metrics of noise: (A,B) Noise strength, equal to SD2/median (C,D) SD, the standard deviation of expression among genetically identical cells (E,F) CV*, equal to SD/median and (G,H) LogCV*, equal to log2(SD/median). The Pearson’s Correlation Coefficient (PCC) between ΔNoise and ΔFitness was computed for 100 combinations of three parameters for (A,C,E,G) strains with a TDH3 expression level far from optimum and (B,D,F,H) strains with a TDH3 expression level close to optimum. The three parameters that were varied were (1) the smoothing parameter of the LOESS regression used to compute ΔNoise (2/6, 3/6, 4/6, 5/6 and 1), (2) the smoothing parameter of the LOESS regression used to compute ΔFitness (2/6, 3/6, 4/6, 5/6 and 1) and (3) the fitness threshold used to classify strains as far from optimum or close to optimum (0.0025, 0.005, 0.075, 0.01). For each plot, the five boxes represent the variation of PCC between ΔNoise and ΔFitness when parameter three is fixed to one of the values shown on the x-axis and the two other parameters are allowed to vary. The thick horizontal lines represent the median PCC across the 25 combinations of parameters 1 and 2. The bottom and top lines of each box represent the 25th and 75th percentiles. Parameter values used in the main figures are shown in red.
Figure 3—figure supplement 8
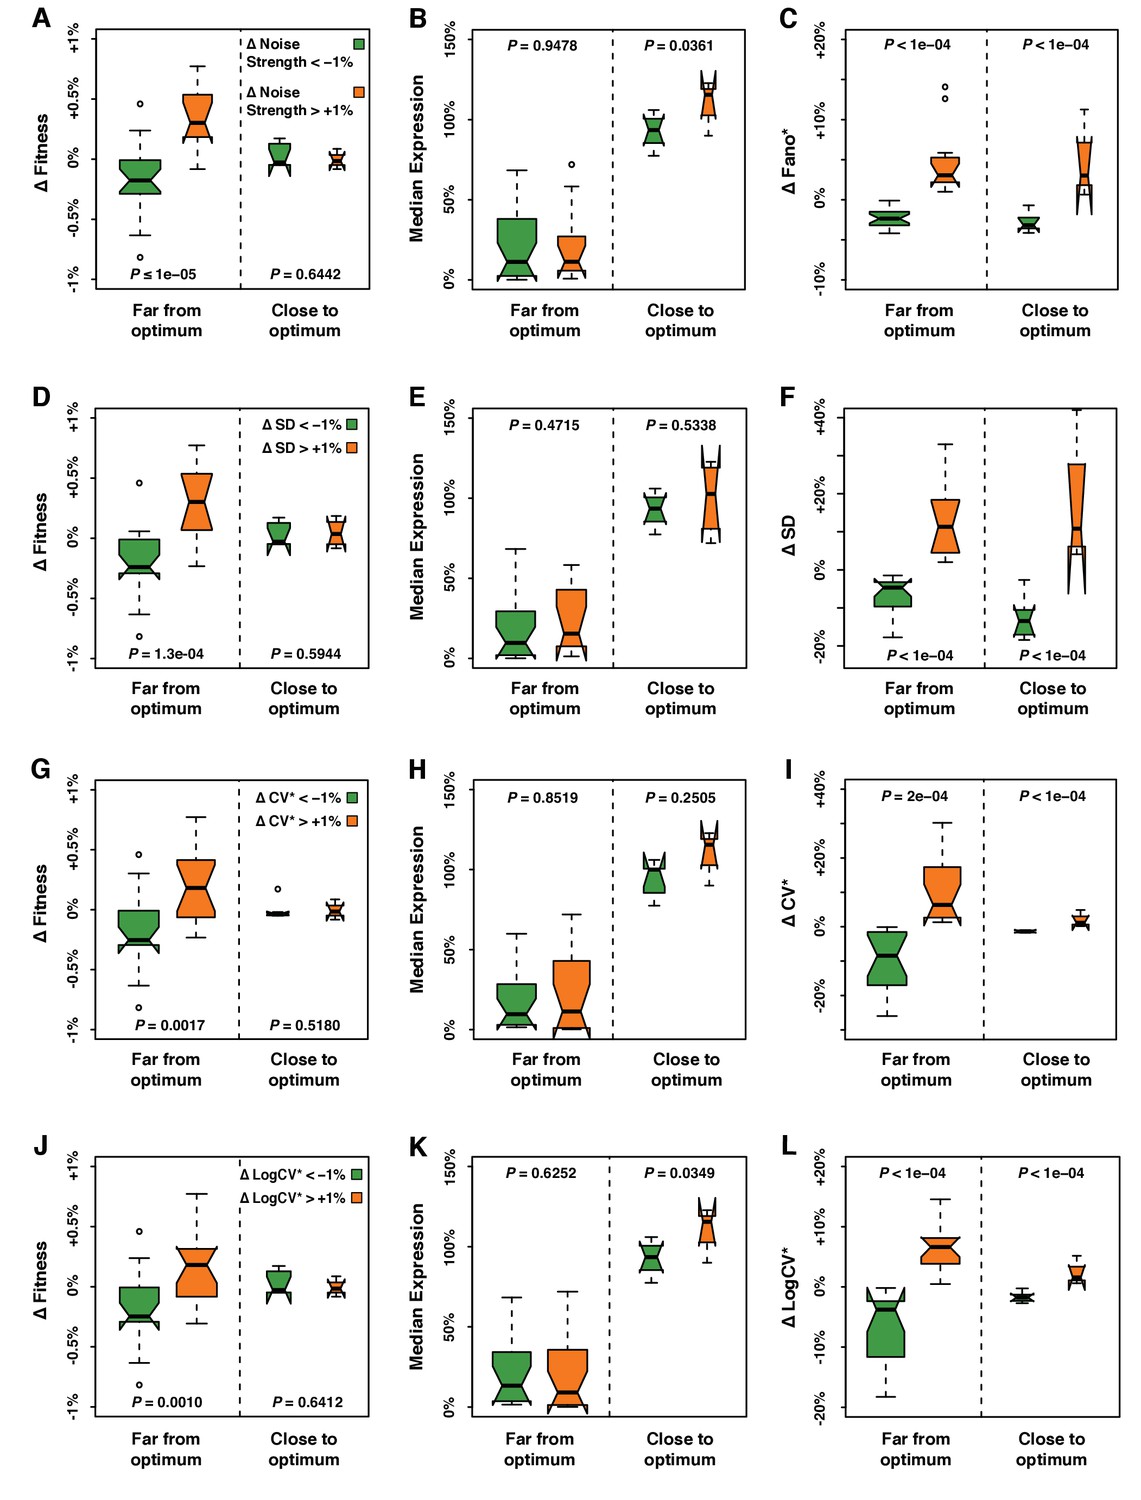
Fitness, median expression and noise of genotypes with ΔNoise above +1% compared to genotypes with ΔNoise below −1%.
ΔNoise was calculated as the residuals of a LOESS regression of expression noise on median expression using four different metrics of noise: (A–C) Noise strength, equal to SD2/median (D–F) SD, the standard deviation of expression among genetically identical cells (G–I) CV*, equal to SD/median and (J–L) LogCV*, equal to log2(SD/median). (A,D,G,J) Comparison of ΔFitness between genotypes with low ΔNoise (green) and genotypes with high ΔNoise (orange). ΔFitness was calculated as the residuals of a LOESS regression of fitness on median expression. (B,E,H,K) Comparison of median expression level between genotypes with low ΔNoise (green) and genotypes with high ΔNoise (orange). (C,F,I,L) Comparison of ΔNoise between genotypes with low ΔNoise (green) and genotypes with high ΔNoise (orange). (A–L) All comparisons were performed separately for genotypes with a median expression level close to optimum and genotypes with a median expression level far from optimum. ΔFitness, ΔNoise and the distance to the optimum expression level were determined independently for each of the four metrics of noise, as shown in Figure 3—figure supplement 1. Thick horizontal lines represent the median ΔFitness across genotypes and the notches display the 95% confidence interval of the median. The bottom and top lines of each box represent the 25th and 75th percentiles. Permutation tests were used to assess the significance of the difference in phenotypes (ΔFitness, median expression and ΔNoise) between genotypes with low ΔNoise and high ΔNoise. For each test, the values of ΔNoise were randomly shuffled among genotypes 100,000 times. The P values shown below each plot represent the proportion of permutations for which the absolute difference in median phenotype between genotypes with low and high ΔNoise was greater than the observed absolute difference in median phenotype between genotypes with low and high ΔNoise.
Figure 4 with 1 supplement
Direct competition between genotypes with different levels of noise but similar median levels of TDH3 expression in glucose.
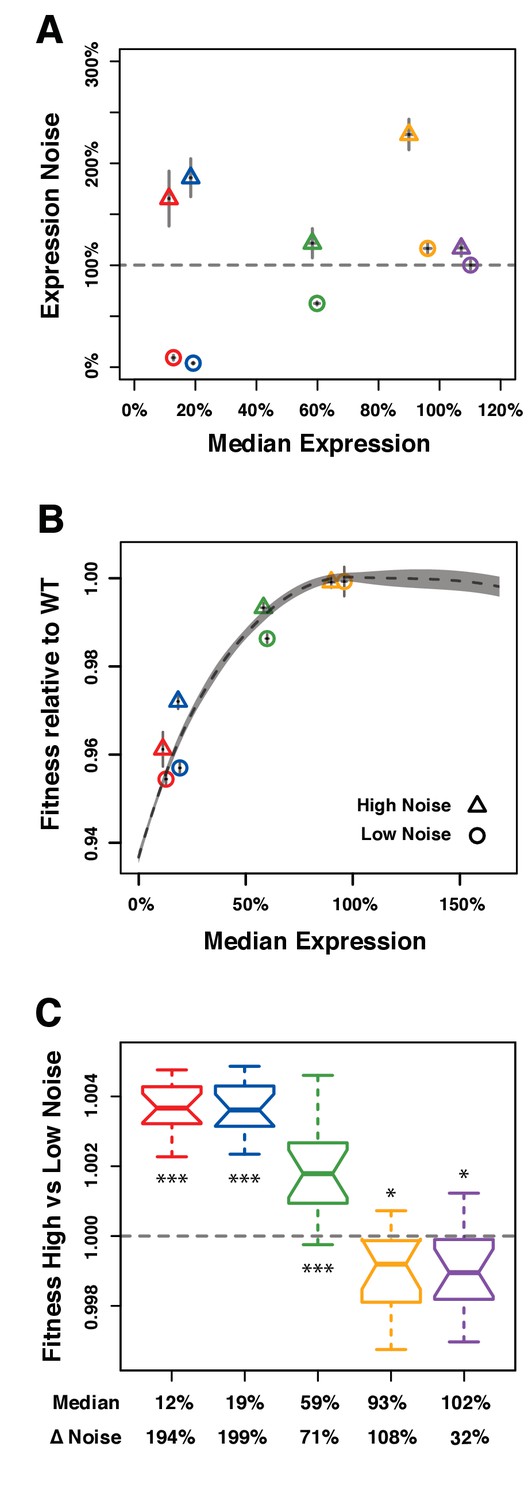
(A–C) Different colors are used to distinguish pairs of genotypes (PTDH3 alleles) with different median expression levels. (A) Median expression level and expression noise (noise strength) for five pairs of genotypes that were competed against each other. Each pair comprises one genotype with low expression noise (circle) and one genotype with high expression noise (triangle). (B) Relative fitness for four pairs of genotypes measured in competition assays against the common GFP reference strain. One pair is missing (purple in (A)) because the corresponding PTDH3 alleles were not part of the 43 alleles included in the initial competition experiment. (A–B) Error bars show 95% confidence intervals obtained from at least three replicates. (C) Competitive fitness of high noise strains relative to low noise strains measured from direct competition assays. Each box represents fitness data from 16 replicate samples. The average median expression level of the two genotypes compared is shown below each box along with the difference in expression noise between these two genotypes (ΔNoise). Thick horizontal lines represent the median fitness across replicates and notches display the 95% confidence interval of the median. The bottom and top lines of each box represent 25th and 75th percentiles. Statistical difference from a fitness of 1 (same fitness between the two genotypes) was determined using t-tests (*: 0.01 < P < 0.05; **: 0.001 < P < 0.01; ***: p<0.001). Data are available in Figure 4—source data 1.
-
Figure 4—source data 1
Fitness measured in direct competition assays between strains with low and high values of expression noise.
Competitive fitness was measured by pyrosequencing and analyzed using the R script provided in Supplementary file 3. Data used to make Figure 4.
- https://doi.org/10.7554/eLife.37272.022
Figure 4—figure supplement 1
Median expression level and expression noise for five pairs of genotypes that were competed directly against each other.
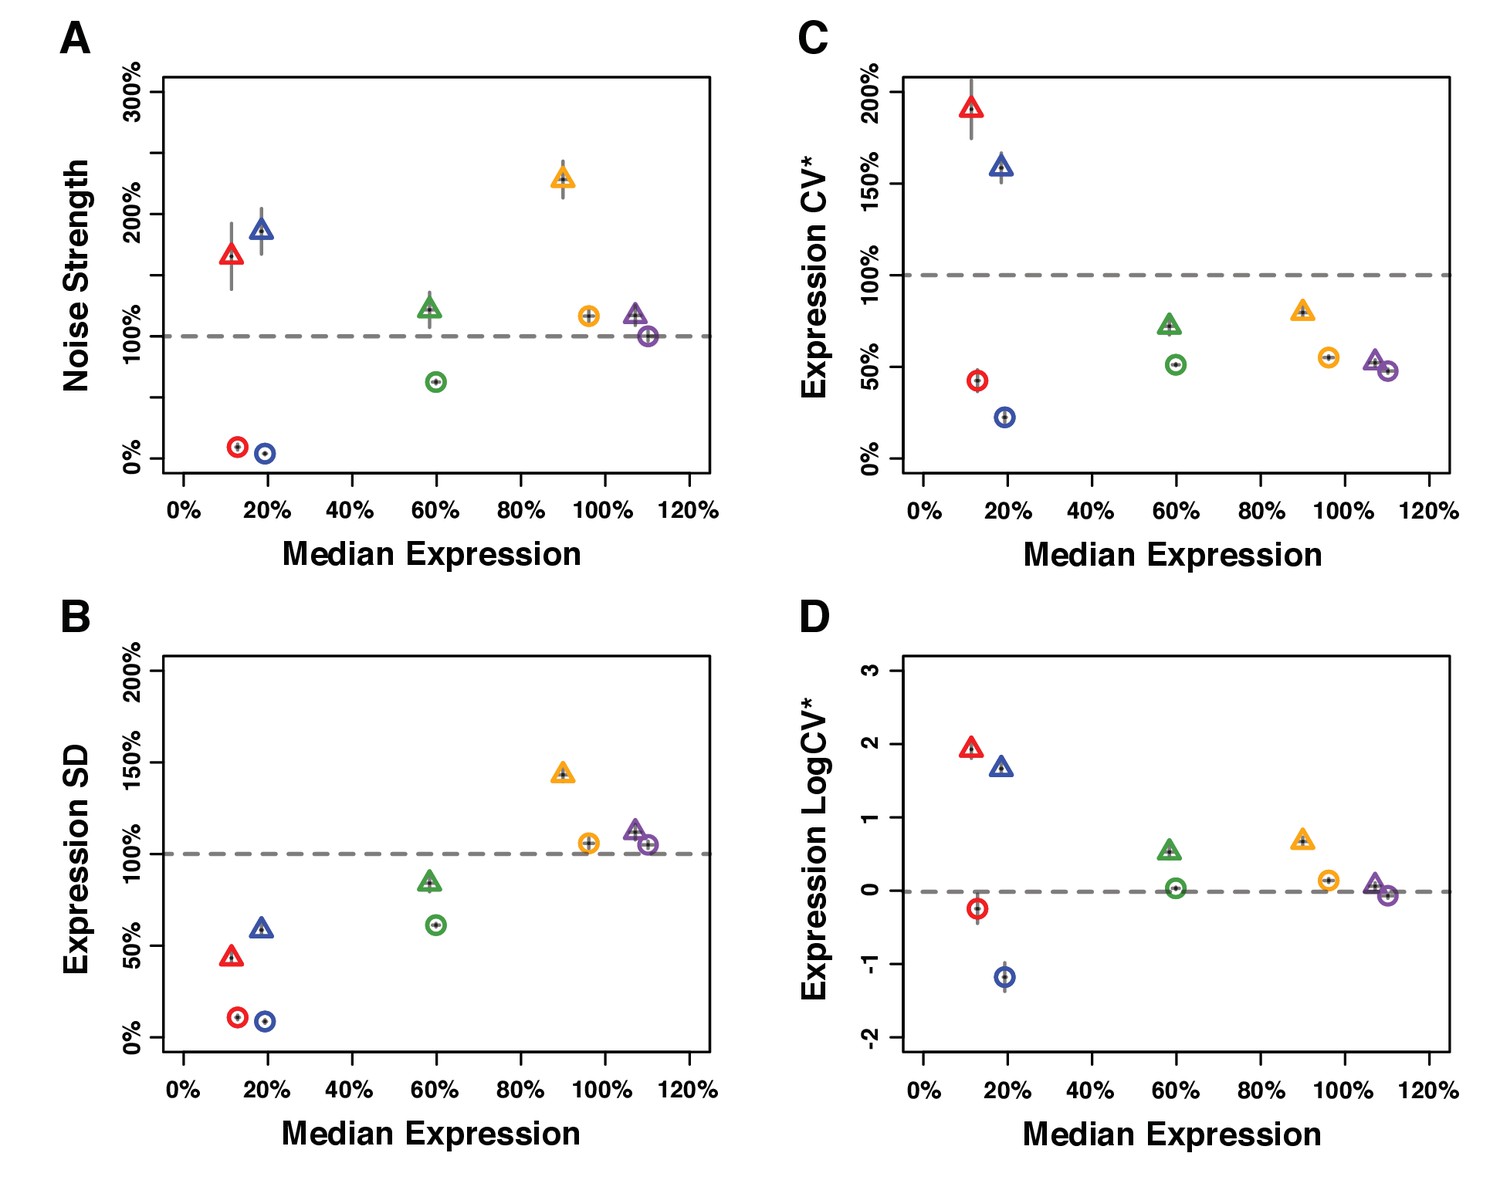
Four metrics of noise were used: (A) the variance of expression divided by the median expression (noise strength), (B) the standard deviation of expression among genetically identical cells (SD), (B) the standard deviation divided by the median expression (CV*) and (D) the binary logarithm of the standard deviation divided by the median expression (LogCV*). (A–D) Different colors are used to distinguish pairs of genotypes (PTDH3 alleles) with similar median expression levels. Each pair comprises one genotype with low expression noise (circle) and one genotype with high expression noise (triangle). Error bars show 95% confidence interval obtained from at least three replicates.
Figure 5 with 1 supplement
A simple model linking single cell expression levels to population fitness.
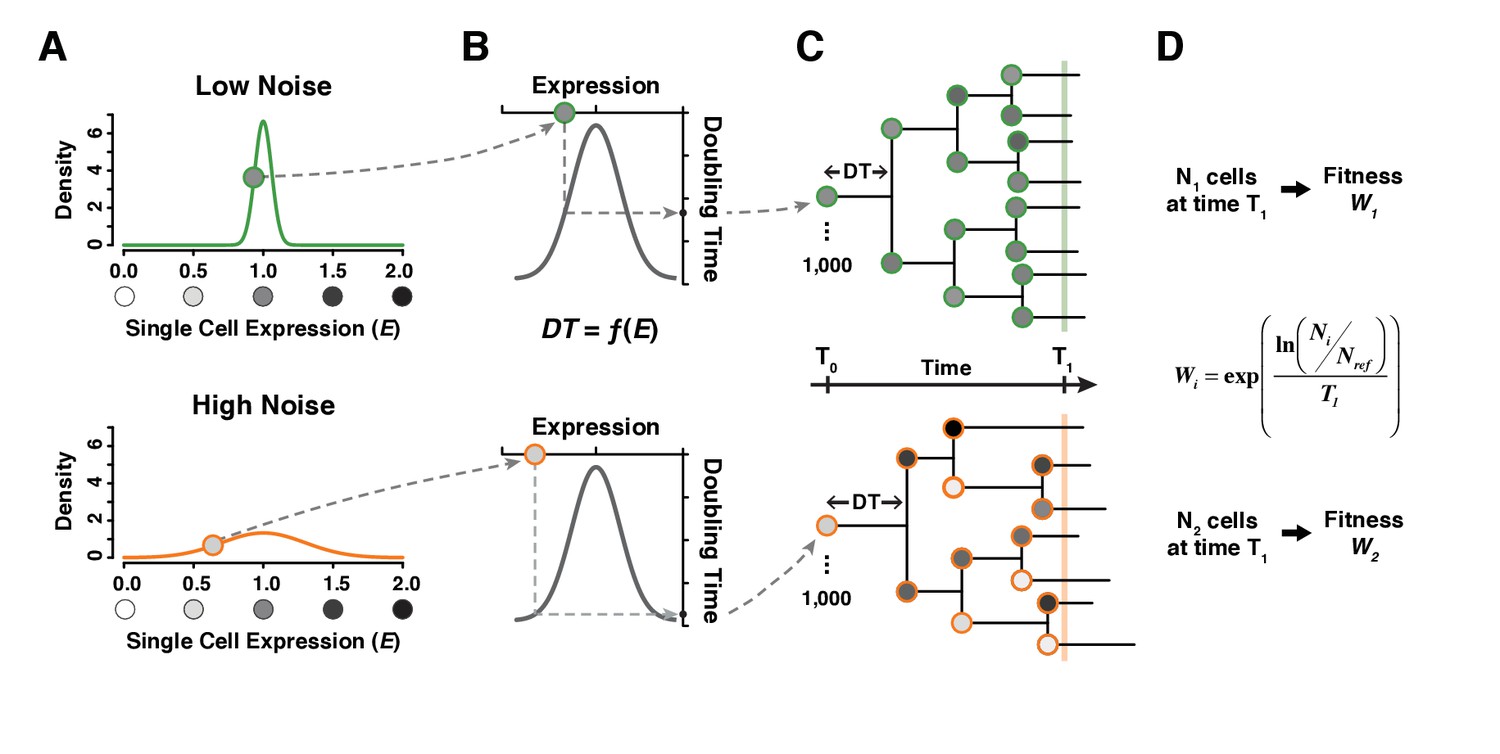
(A) In our model, the expression level of individual cells is randomly drawn from a normal distribution . is lower for a genotype with low expression noise (top, green line) and higher for a genotype with high expression noise (bottom, orange line). (B) The doubling time of individual cells is directly determined from their expression level using a function . (C) The growth of a cell population is simulated by drawing new values of expression converted into doubling time after each cell division. In this example, doubling time is more variable among cells for the population showing the highest level of expression noise. (D) Population growth is stopped after a certain amount of time (1000 minutes in our simulations) and competitive fitness is calculated from the total number of cells produced by the tested genotype relative to the number of cells in a reference genotype with and . In this example, fitness is lower for the genotype with higher expression noise (bottom) because it produced less cells than the genotype with lower expression noise (top).
Figure 5—figure supplement 1
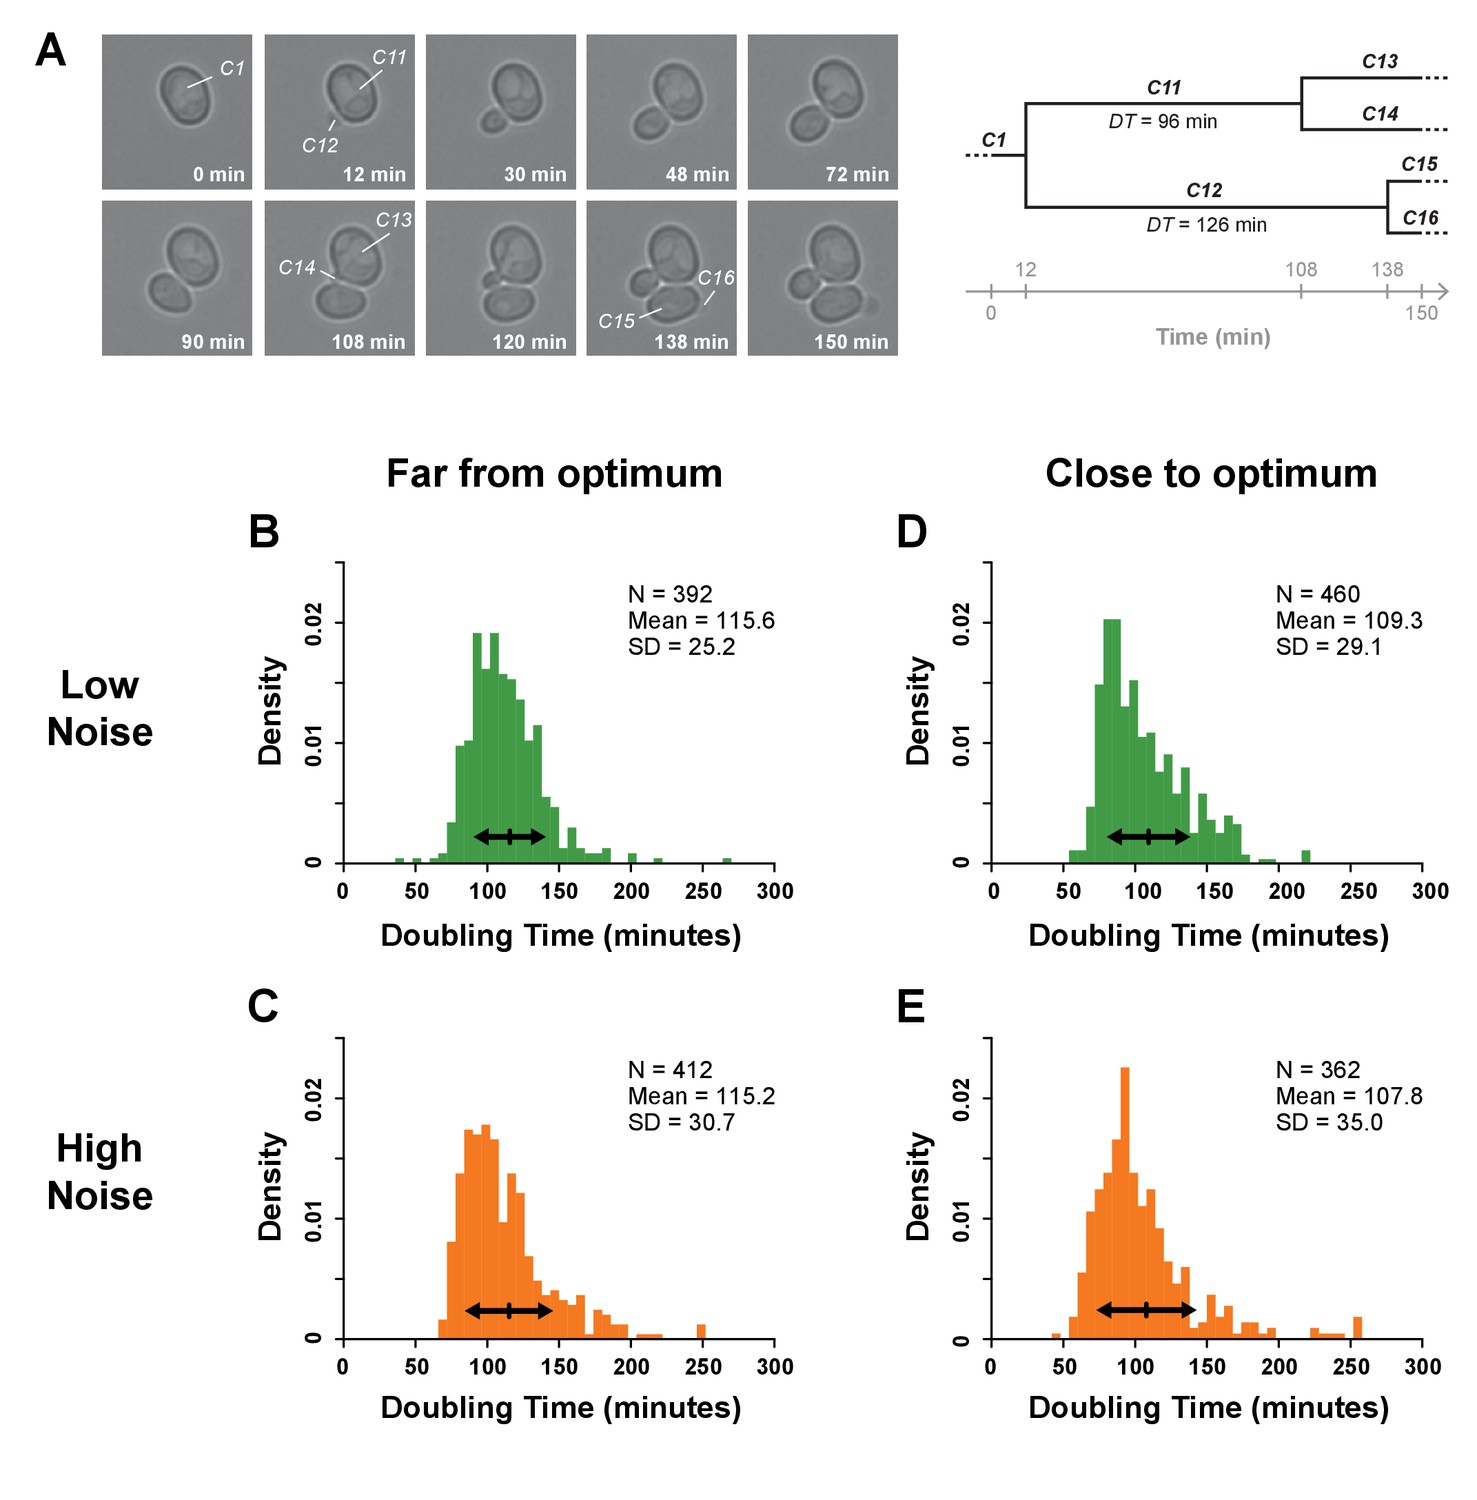
Single-cell division rates estimated using time-lapse microscopy.
(A) The image series shows selected frames from a time-lapse movie that captured a picture of cells every six minutes in which we have zoomed on one initial cell to illustrate how doubling times (DTs) were determined within a cell lineage. DT was calculated as the time separating the appearance of two consecutive buds. In this example, the DT of mother cell 101 was measured as 96 min because this cell was first seen budding at 12 min and then seen budding again at 108 min. The doubling time of daughter cell 102 was measured as 126 min because it first appeared at 12 min and was observed starting to bud at 138 min. By repeating this cell tracking procedure for eight initial cells in four movies recording 480 min of growth each from four replicate samples from each genotype, the doubling times of at least 362 cells were scored for each strain assayed. (B–E) Histograms showing the distributions of single-cell DTs for one pair of genotypes with median TDH3 expression level far from optimum (B: strain YPW2879, C: strain YPW2868) and for one pair with expression close to optimum (D: strain YPW3064, E: strain YPW3047). In each pair, one genotype had a low level of TDH3 expression noise (green) (B,D) and one genotype had a high level of TDH3 expression noise (orange) (C,E). In panels B-E, arrows represent one standard deviation around the mean DT for each genotype. Permutation tests showed significant differences in standard deviation of doubling times between (B) and (C) (p=0.017) and between (D) and (E) (p=0.020), indicating that genotypes with lower expression noise displayed lower variability of single-cell doubling times. In addition, mean DT was significantly higher in genotypes with expression far from optimum (B,C) than in genotypes close to optimum (D,E) (permutation test, p=10−5), consistent with lower TDH3 expression levels decreasing fitness. Data and statistics are available in Figure 5—figure supplements 1—source data 1.
-
Figure 5—figure supplement 1—source data 1
Single-cell measures of doubling time in four strains with different median levels and noise of TDH3 expression.
Doubling time was determined from time-lapse microscopy data. These data were used to make Figure 5—figure supplement 1.
- https://doi.org/10.7554/eLife.37272.025
-
Figure 5—figure supplement 1—source data 2
Summary statistics for comparing the distributions of single-cell doubling time between genotypes with different expression noise levels.
These data were used to make Figure 5—figure supplement 1.
- https://doi.org/10.7554/eLife.37272.026
Figure 6 with 2 supplements
Simulating the effect of expression noise on fitness at different median expression levels.
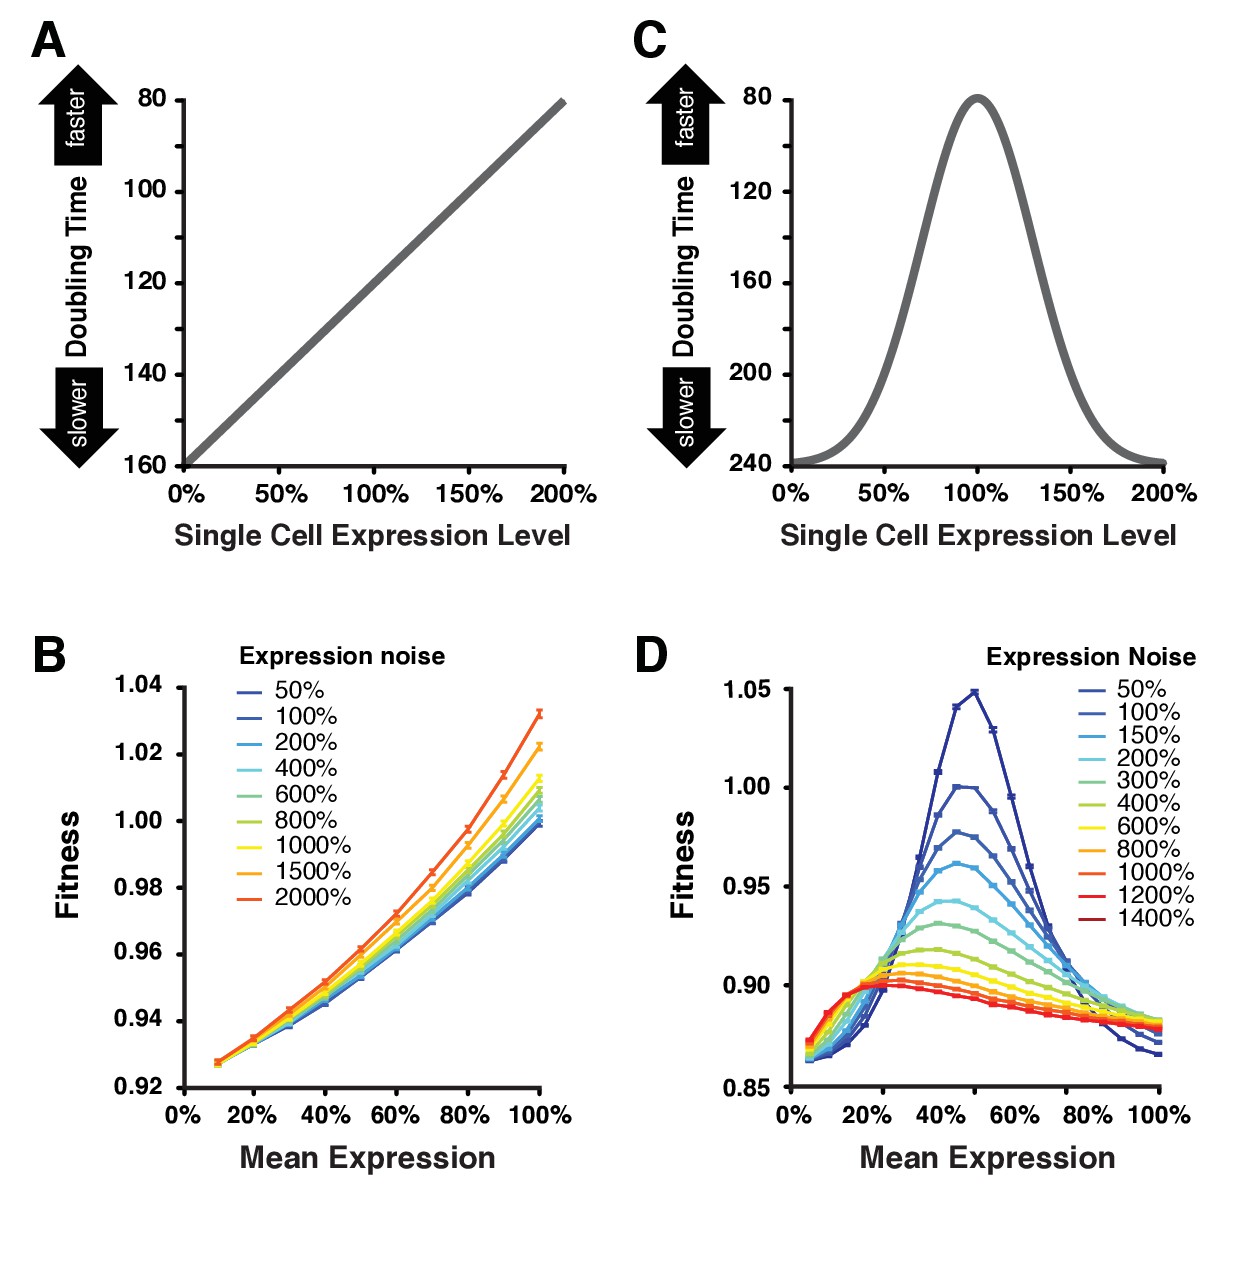
(A) The linear function relating the expression level of single cells to their doubling time used for the first set of simulations. (B) Relationship between mean expression () and fitness at nine values of expression noise (noise strength: ) ranging from 50% to 2000% using the linear function shown in (A). (C) Gaussian function relating the expression level of single cells to their doubling time used in the second set of simulations. This function shows an optimal expression level at , where doubling time is minimal (i.e., fastest growth rate). (D) Relationship between mean expression () and fitness at 11 values of expression noise (noise strength: ) ranging from 50% to 1400% using the Gaussian function shown in (C). (B,D) Error bars show 95% confidence intervals of mean fitness calculated from 100 replicate simulations for each combination of mean expression and expression noise values. Data are available in Figure 6—source data 1.
-
Figure 6—source data 1
Fitness data obtained by modeling the growth of cell populations with different levels of mean expression and expression noise.
Data used to make Figure 6B and D and generated with the Matlab code provided in Supplementary file 5.
- https://doi.org/10.7554/eLife.37272.030
Figure 6—figure supplement 1
Simulating the effect of two different metrics of expression noise on fitness at different median expression levels.
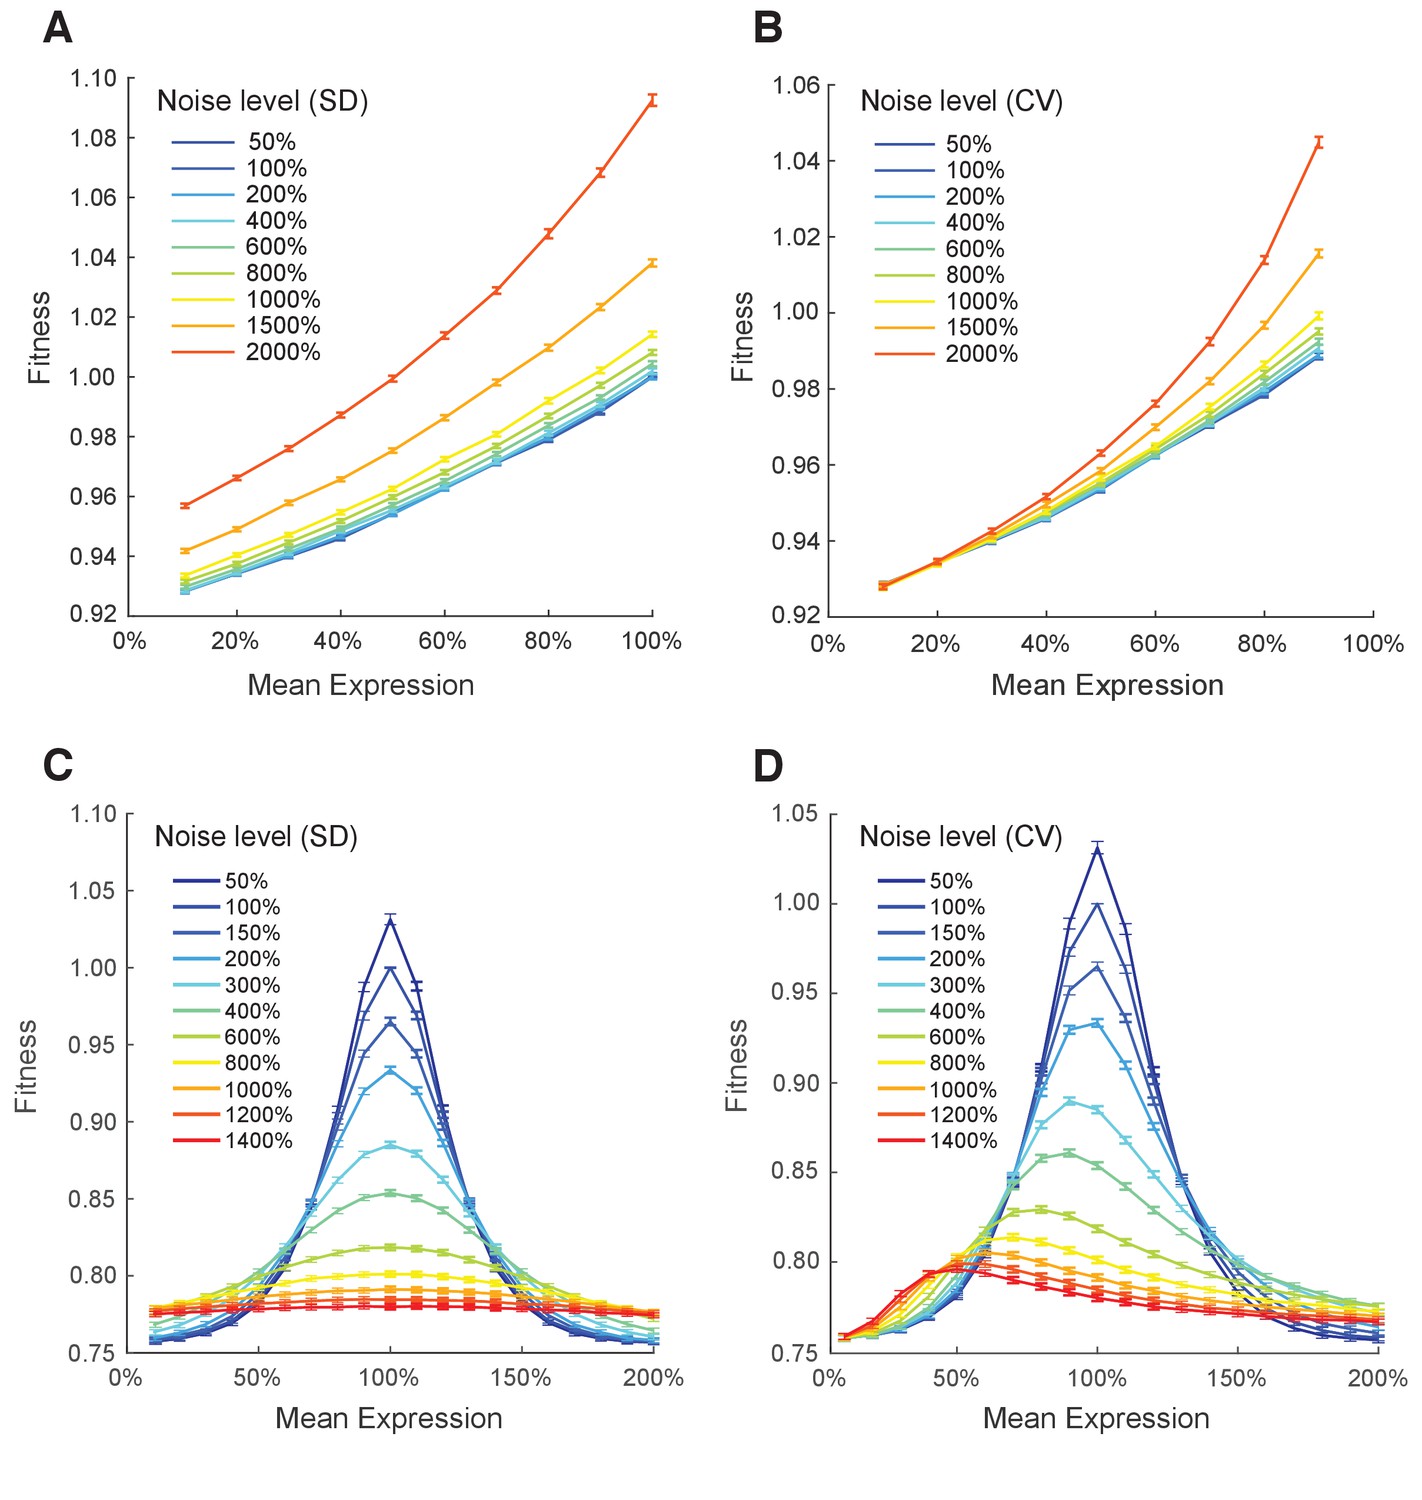
Population fitness was simulated for median expression levels ranging from 10% to 100% and for: (A) the standard deviation of expression ranging from 0.05 to 2 and the linear function relating single cell expression to doubling time, (B) the coefficient of variation of expression ranging from 0.05 to 2 and the linear function relating single cell expression to doubling time, (C) the standard deviation of expression ranging from 0.05 to 0.8 and the Gaussian function relating single cell expression to doubling time, and (D) the coefficient of variation of expression ranging from 0.05 to 1.4 and the Gaussian function relating single cell expression to doubling time. (A–D) Error bars show 95% confidence intervals of mean fitness calculated from 100 replicate simulations for each combination of mean expression and expression noise.
Figure 6—figure supplement 2
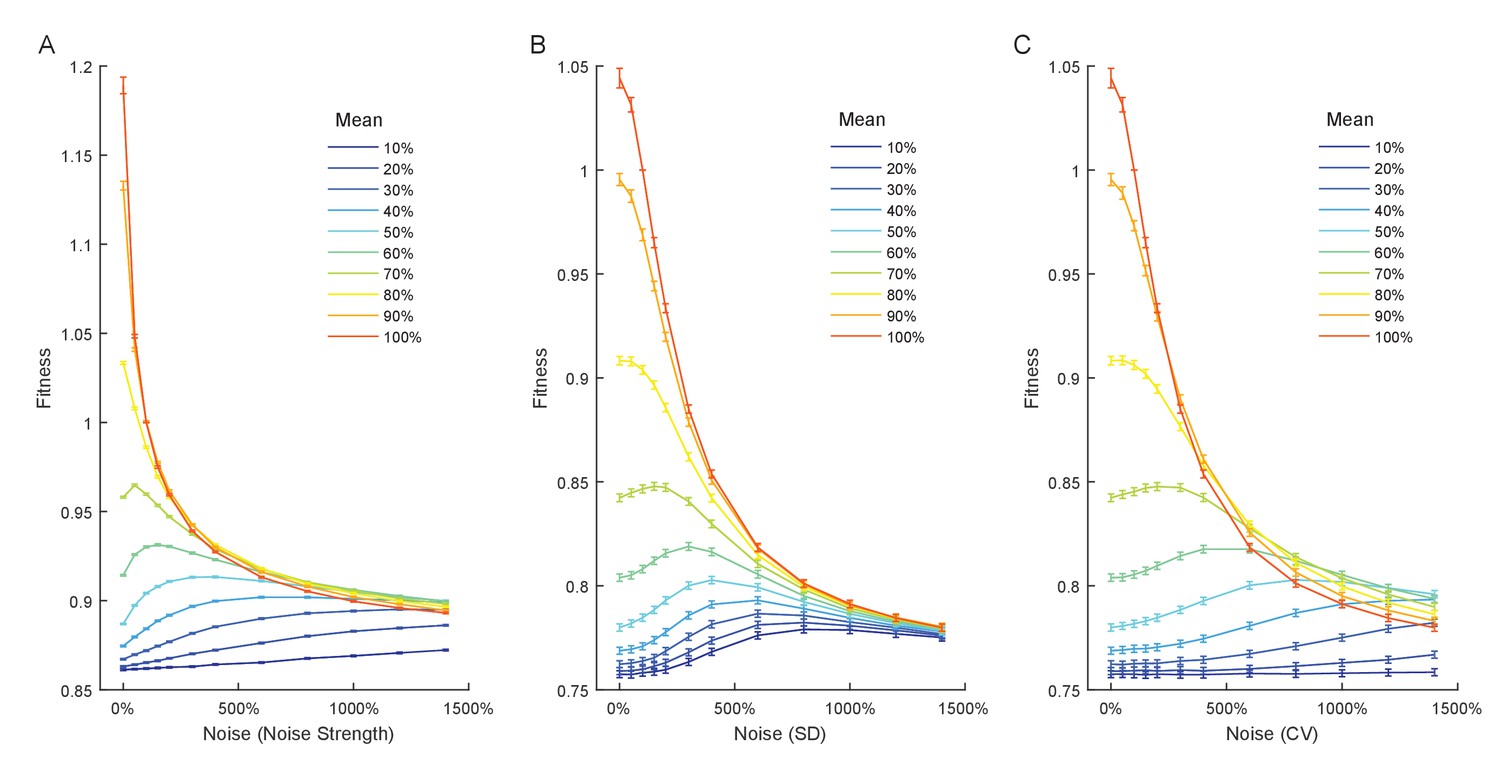
Relationship between expression noise and fitness at different values of mean expression in simulations using a Gaussian function relating single cell expression to doubling time.
Three different noise metrics were used: (A) the noise strength , (B) the standard deviation , (C) the coefficient of variation . (A–C) Error bars show 95% confidence intervals of mean fitness calculated from 100 replicate simulations for each combination of mean expression and expression noise.
Additional files
-
Supplementary file 1
Datasets generated using R scripts available in Supplementary file 3 and used to make Source Data files for figures.
- https://doi.org/10.7554/eLife.37272.031
-
Supplementary file 2
List of oligonucleotides used in this study.
- https://doi.org/10.7554/eLife.37272.032
-
Supplementary file 3
R scripts for the analysis of pyrosequencing and flow cytometry data used to determine the median expression, expression noise and fitness associated with different PTDH3 alleles.
- https://doi.org/10.7554/eLife.37272.033
-
Supplementary file 4
Zip folder containing all input files necessary to run the R scripts available in Supplementary file 3.
- https://doi.org/10.7554/eLife.37272.034
-
Supplementary file 5
Matlab code used to model the growth of cell populations with different levels of mean expression and expression noise.
- https://doi.org/10.7554/eLife.37272.035
-
Source data 1
Expression and fitness data for the final set of 43 TDH3 promoter alleles.
Fluorescence levels and competitive fitness were measured by flow cytometry and analyzed using the R script provided in Supplementary file 3. Data used to make Figure 1D, Figure 2C and Figure 3.
- https://doi.org/10.7554/eLife.37272.036
-
Transparent reporting form
- https://doi.org/10.7554/eLife.37272.037
Download links
A two-part list of links to download the article, or parts of the article, in various formats.
Downloads (link to download the article as PDF)
Open citations (links to open the citations from this article in various online reference manager services)
Cite this article (links to download the citations from this article in formats compatible with various reference manager tools)
Fitness effects of altering gene expression noise in Saccharomyces cerevisiae
eLife 7:e37272.
https://doi.org/10.7554/eLife.37272


