Kinetic mechanism of coupled binding in sodium-aspartate symporter GltPh
- Cornell University, United States
- Howard Hughes Medical Institute, United States
Figures
Figure 1 with 3 supplements
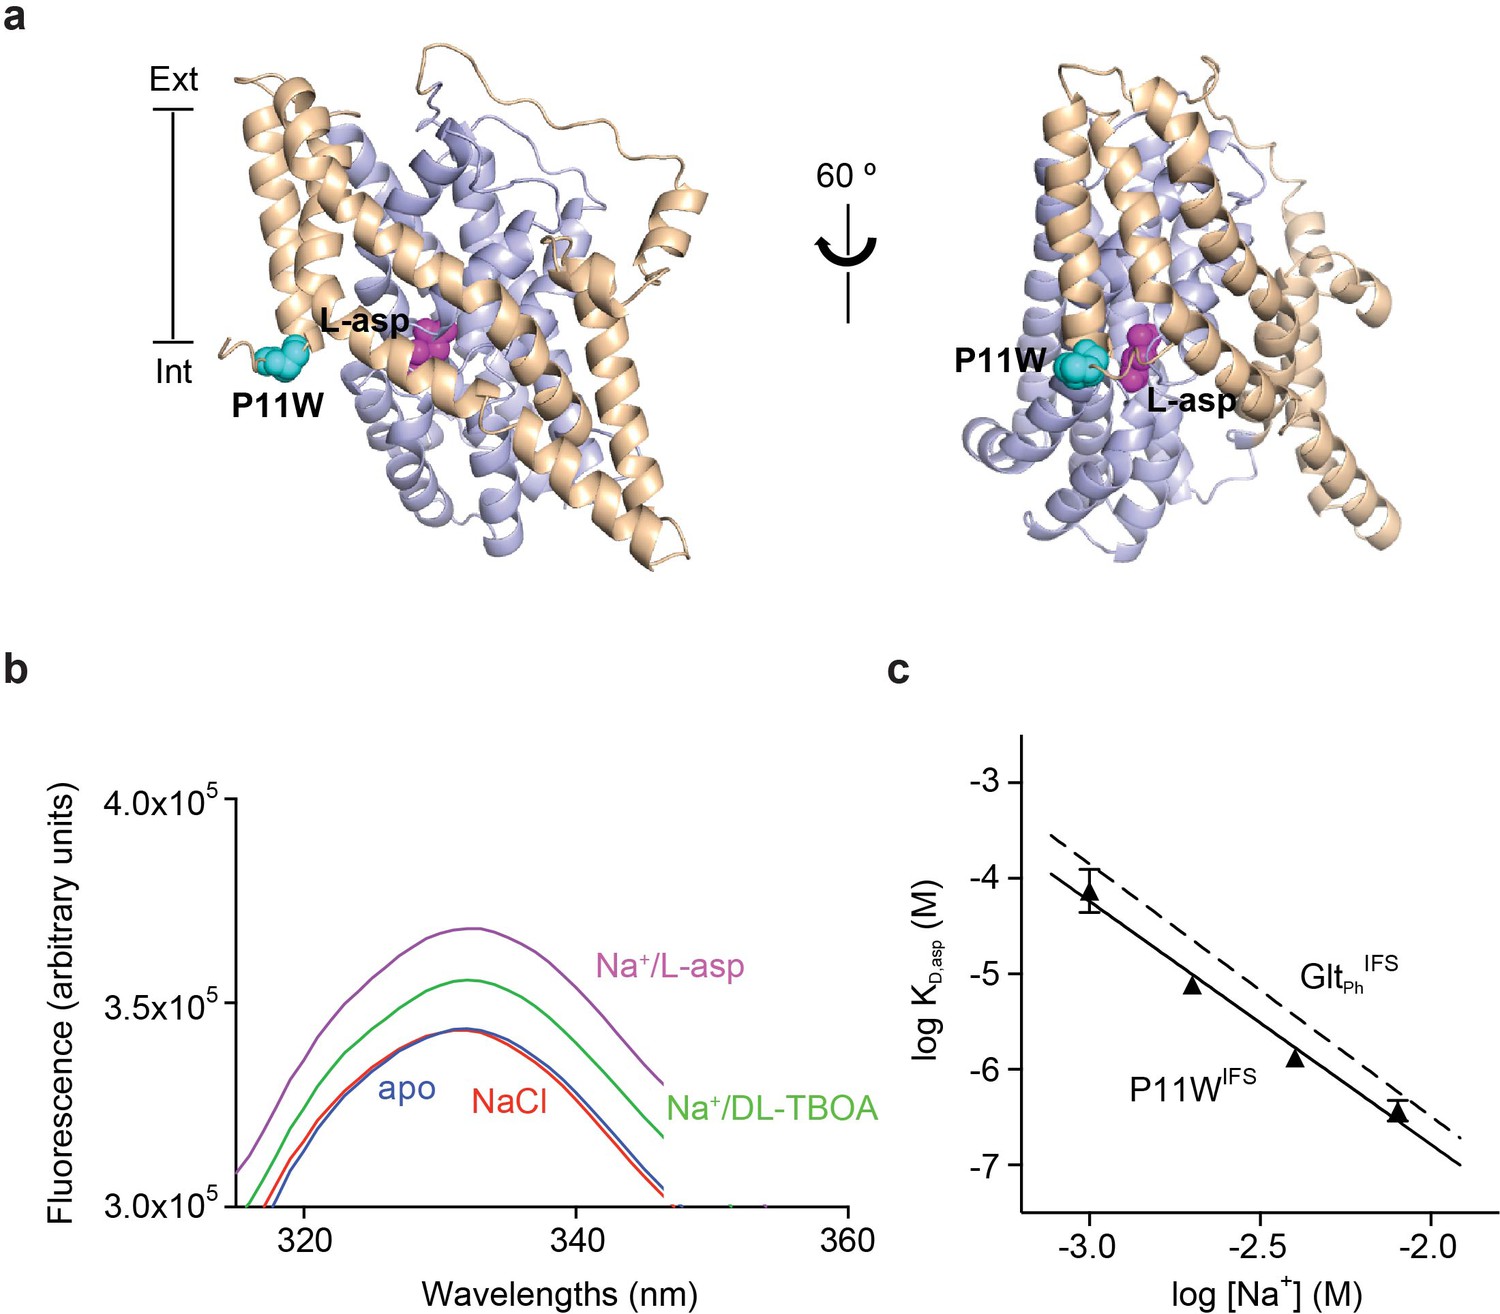
Design and characterization of P11WIFS.
(a) Pro11 (cyan) in the trimerization domain (wheat) of GltPhIFS (PDB ID: 3KBC) is close to substrate binding site (magenta) in the transport domain (blue). (b) Intrinsic fluorescence emission spectrum of apo P11WIFS (blue) and P11WIFS in the presence of 10 mM NaCl (red) and DL-TBOA (green) or L-asp (magenta). (c) Dependence of L-asp dissociation constant, KD of P11WIFS on Na+ ion concentration. The data (solid triangles) were fitted to a straight line with slope of 2.5. Binding assay based on RH421 fluorescence was used to follow L-asp binding to P11WIFS. The dashed line represents Na+ dependence of L-asp KD of GltPhIFS with slope of 2.6 (Reyes et al., 2013).
Figure 1—figure supplement 1
Na+-coupled L-asp transport by GltPh.
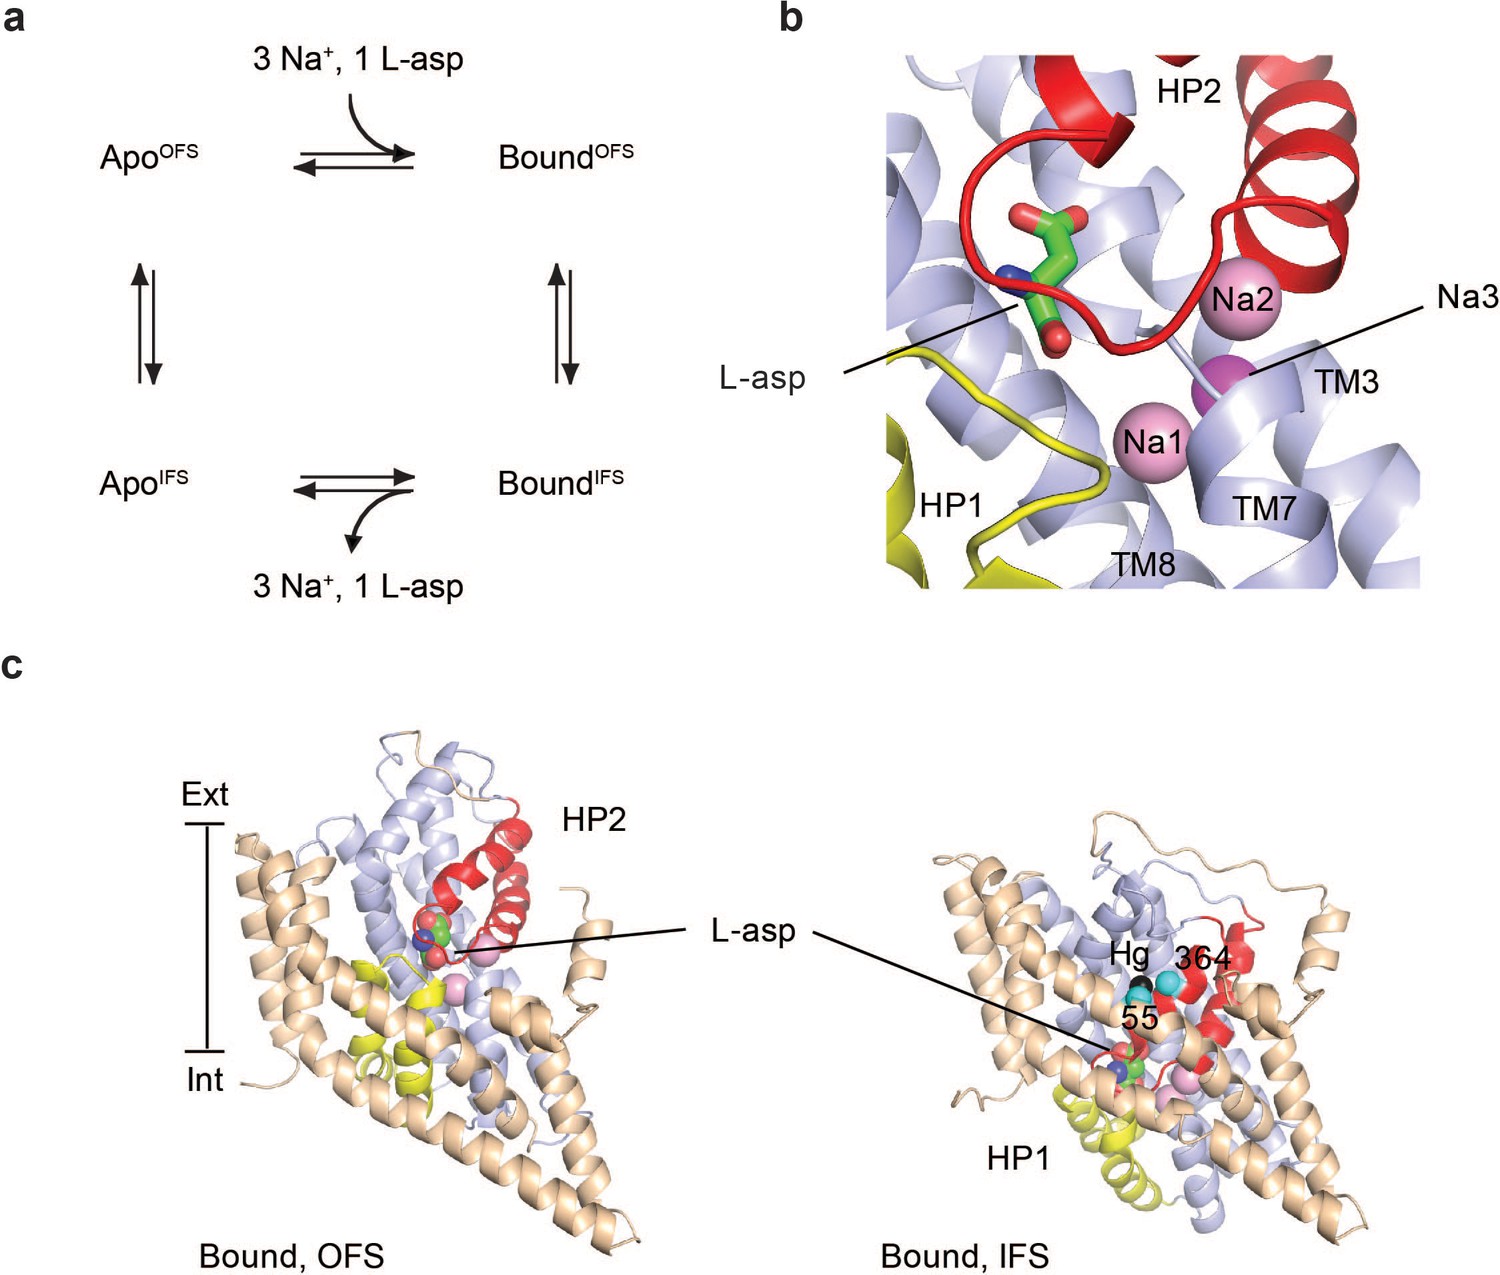
(a) Transport cycle of GltPh consists of four steps. First, three Na+ ions and L-asp bind to the transporter in an outward-facing state (accessible from the extracellular side). Second, the transporter undergoes a conformational change from the outward- to an inward-facing state (accessible from the cytoplasm). Through this conformational change, Na+ ions and L-asp are translocated across the membrane. Third, the substrate and ions are released into the cytoplasm. Lastly, apo transporter undergoes a reverse conformational change back to the outward-facing state. (b) Residues from HP2 (red), HP1 (yellow), TM3, TM7, and TM8 (light blue) form the three Na+ binding sites (shown as pink spheres; based on PDB codes 2NWX and 5E9S) (Boudker et al., 2007; Guskov et al., 2016). The ions bind proximally to the substrate L-asp (shown in stick representation) but are not directly coordinated by it. (c) Structures of single GltPh protomers bound to L-asp in the outward- (left, PDB code 2NWX) and inward-facing states (right, PDB code 3KBC). Cα atoms of the cross-linked cysteine residues Cys55 and Cys364 and Hg2+ ion are shown as cyan and black spheres, respectively.
Figure 1—figure supplement 2

HP2 acts as a gate for substrate binding.
Shown are structures of the outward-facing GltPh free of ligands (Apo), R397A mutant crystallized in high Na+ concentration and no substrate (Na+ only), GltPh bound to Na+ ions and L-TBOA (Na+/TBOA) or L-asp (Na+/Asp). The color scheme is as in Figure 1—figure supplement 1. PDB codes are 4OYE, 4OYF, 2NWW and 2NWX, respectively.
Figure 1—figure supplement 3
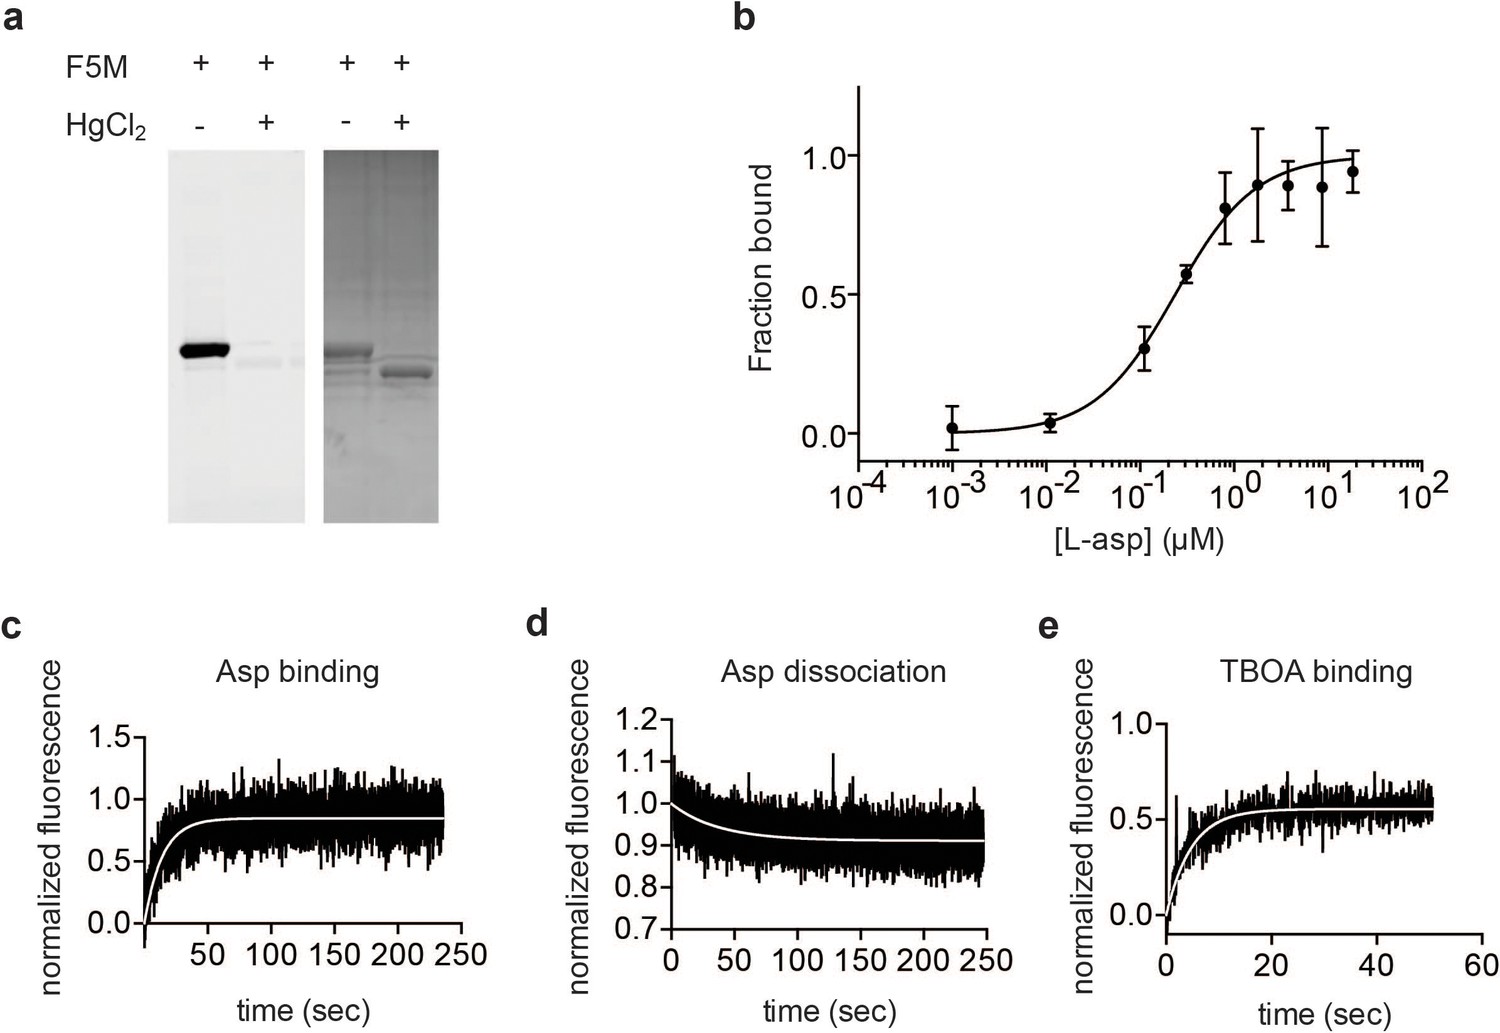
Characterization of P11WIFS GltPh.
(a) SDS PAGE analysis of fluorescein-5-maleimide (F5M) labeled uncrosslinked and Hg2+-crosslinked P11W/K55C/A364C GltPh (P11WIFS), imaged under blue illumination (left) and stained with Coomassie Blue (right). (b) Titration of P11WIFS GltPh with L-asp followed by tryptophan fluorescence in the presence of 10 mM Na+. Data were normalized and fitted to a single binding site quadratic equation yielding KD of 228 ± 85 nM. Representative kinetic experiments of 0.5 mM L-asp binding to P11WIFS in the presence of 4 mM Na+ (c), L-asp dissociation from P11WIFS in the presence of 0.2 mM Na+ (d), and 8 mM DL-TBOA binding to P11WIFS in the presence of 4 mM Na+ (e). Data were normalized as described in Materials and methods. The white lines are fits to single exponential functions yielding kobs values of 0.0712 s−1, 0.027 s−1, and 0.2106 s−1, respectively.
Figure 2 with 1 supplement
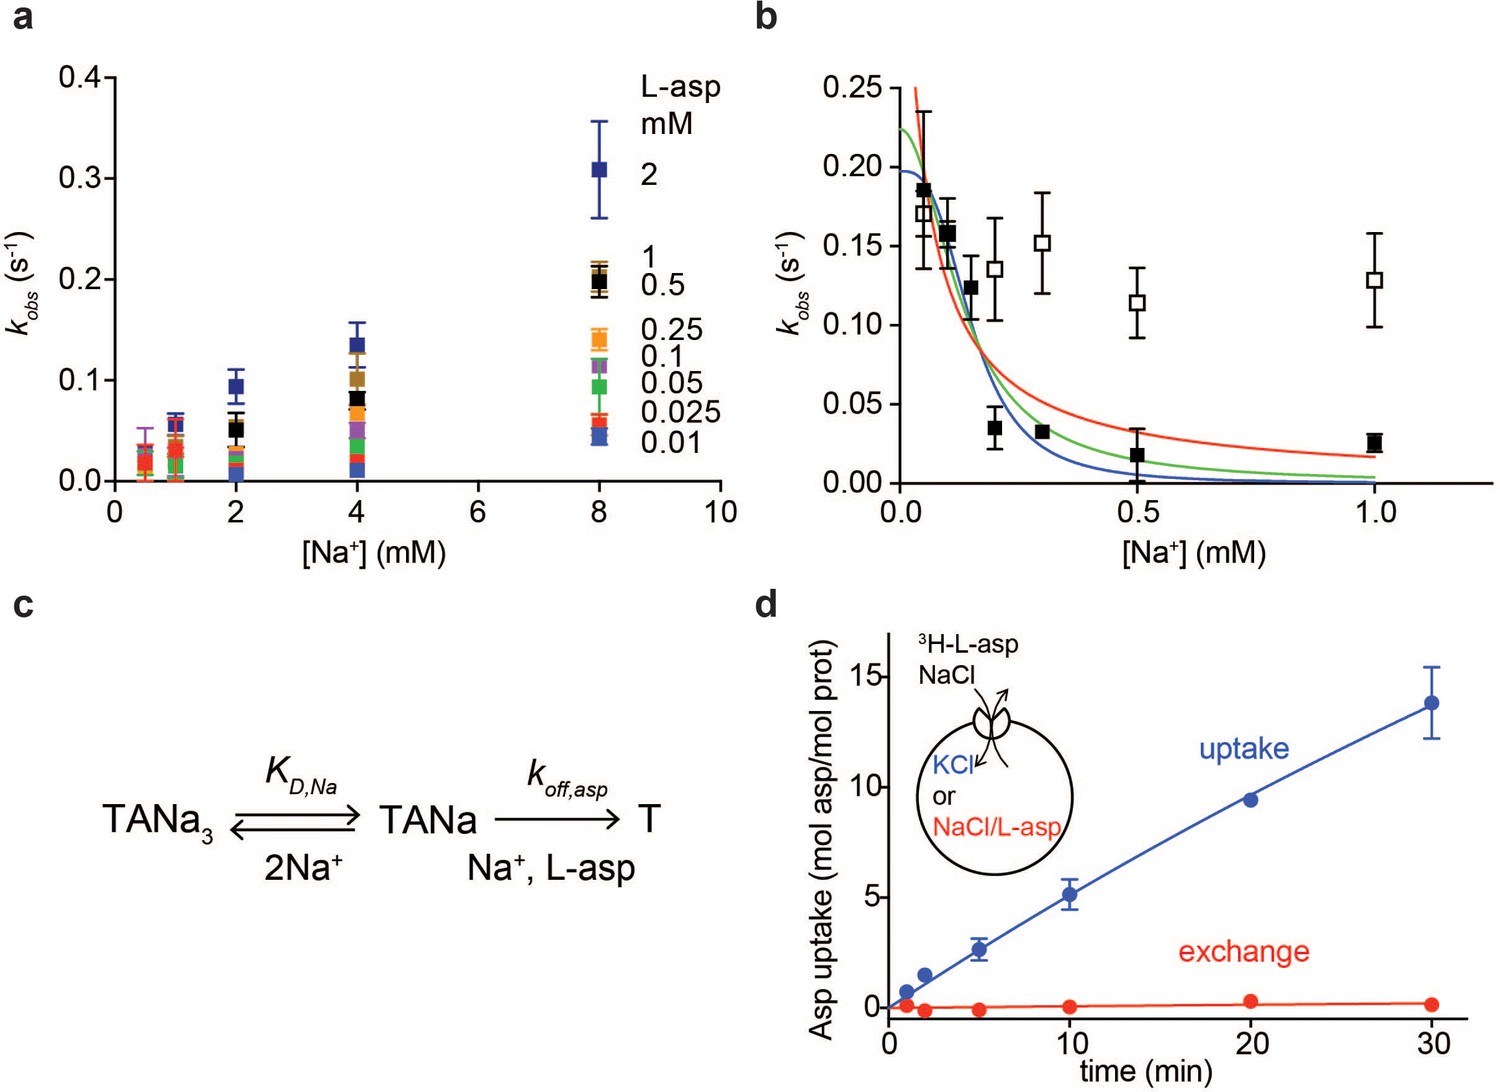
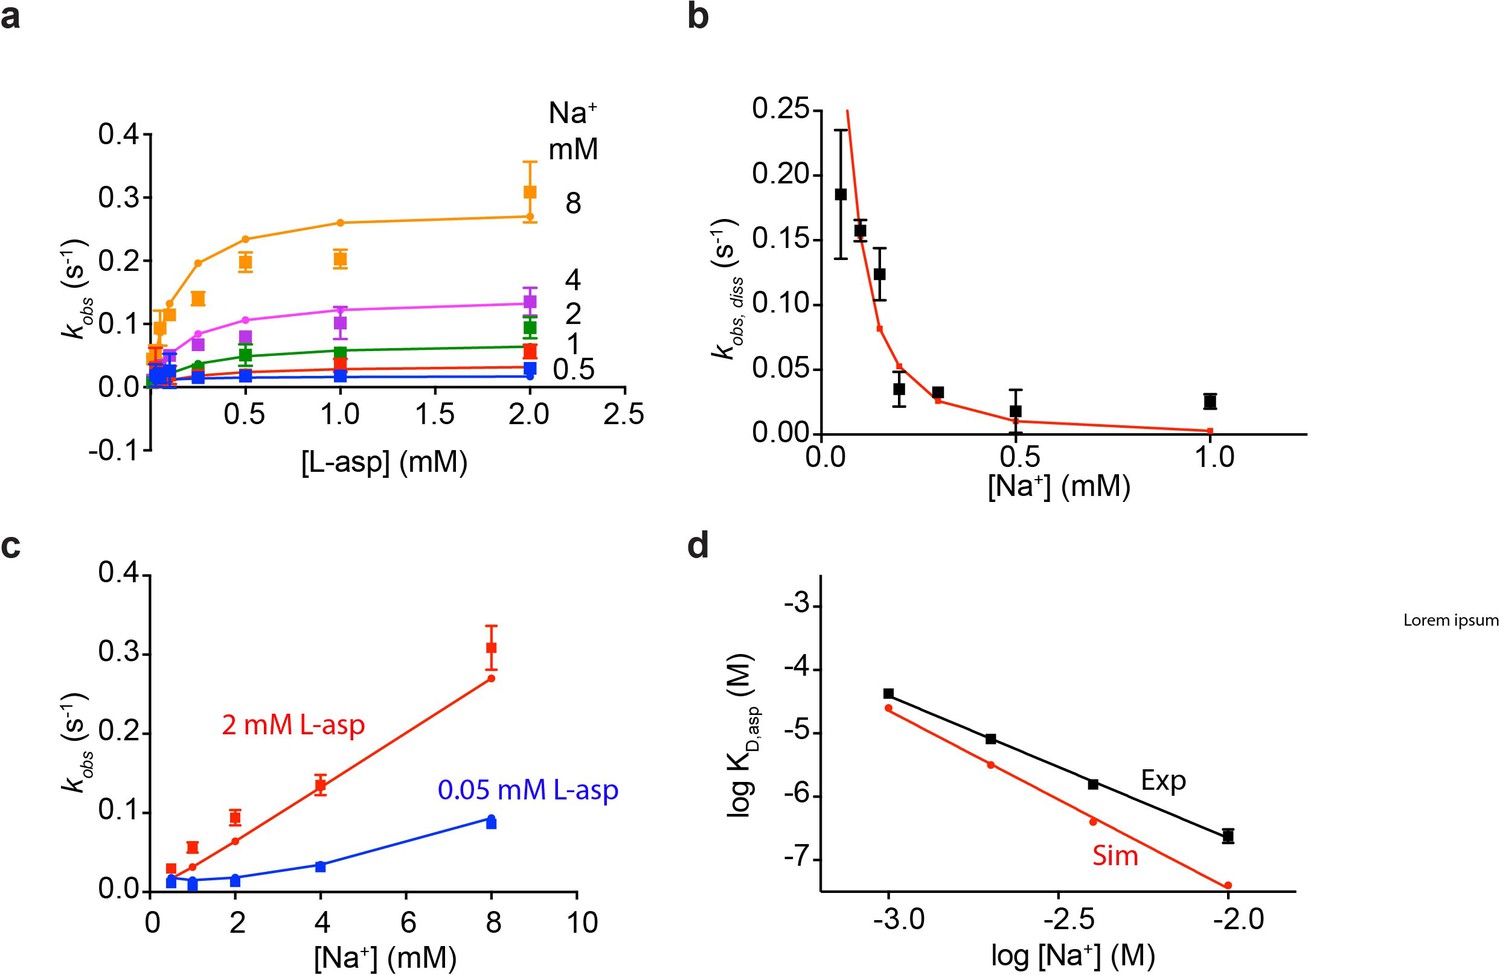
Na+ ions control on- and off-rates of L-asp binding.
(a) The values of kobs for L-asp binding as a function of Na+ concentration. The binding rates were measured as a function of Na+ concentrations upon additions of L-asp to P11WIFS to the following final concentrations in mM: 0.01 (blue), 0.025 (red), 0.05 (green), 0.1 (purple), 0.25 (orange), 0.5 (black), 1 (brown) and 2 (dark blue). (b) The dissociation rates of L-asp as a function of Na+ concentration in the media measured for P11WIFS (solid squares) and P11WIFS-M311A (open squares). The lines through data for P11WIFS are the fits to Equation 2 with Hill coefficients n fixed to 1 (red), 2 (green) and 3 (blue). The fitted values of koff,asp and KD,Na were, respectively: 0.5 ± 0.2 s−1, 40 ± 20 µM; 0.2 ± 0.02 s−1, 130 ± 20 µM; 0.2 ± 0.01 s−1, 150 ± 13 µM. (c) Schematic representation of the mechanism in Equation 2 exemplified for two rapidly equilibrating cooperatively binding Na+ ions. (d) Comparison of the rate of L-asp uptake (open circles) and exchange (solid circles) in proteoliposomes containing wild type GltPh. Background uptake was measured in the absence of the external NaCl and subtracted from the data. All experiments were performed in triplicate and means and standard errors are shown.
Figure 2—figure supplement 1
Na+ dependence of L-asp binding kinetics in low (a) and high (b) L-asp.
In the presence of high concentrations of L-asp the dependence of kobs on Na+ concentration is linear. However, at low L-asp concentrations, the dependence is non-linear, and can be approximated by a quadratic function.
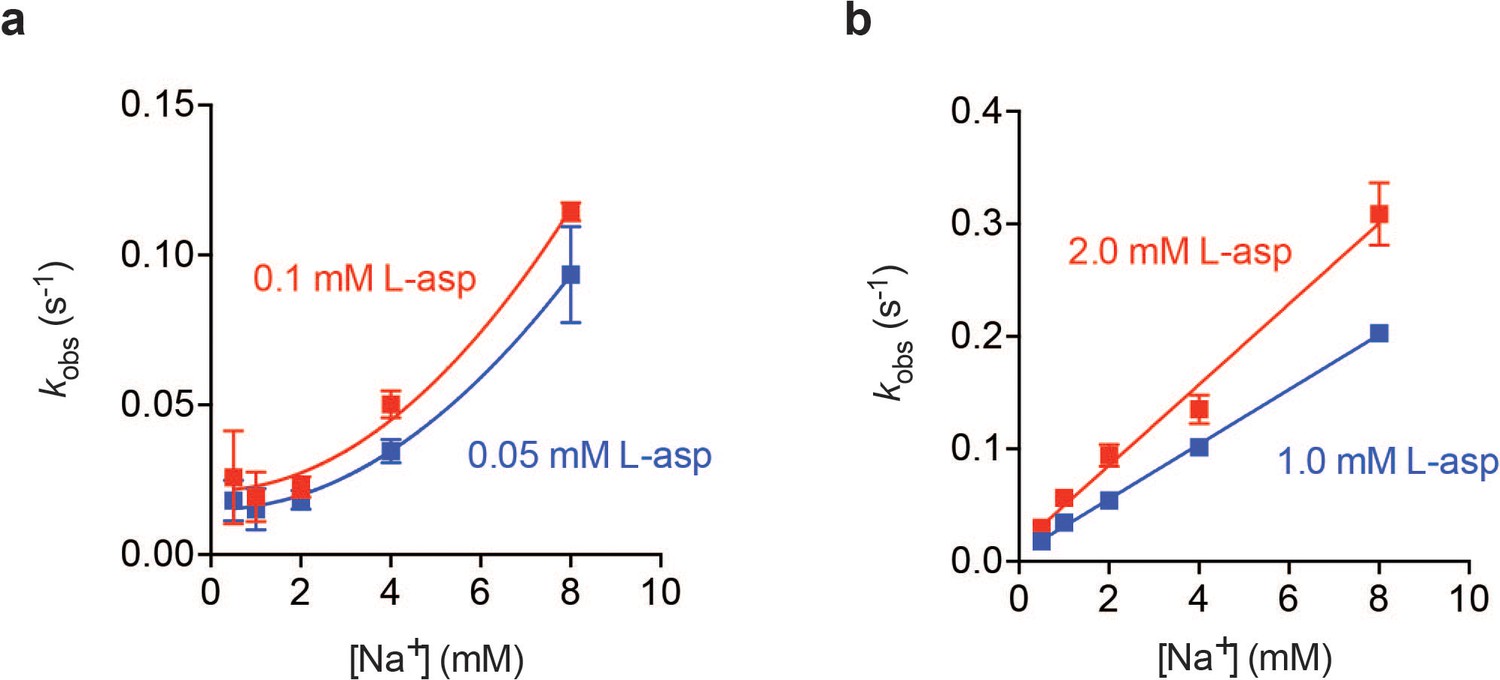
Figure 3
Na+ ions drive conformational selection.
The rates of L-asp (a) and DL-TBOA (b) binding to P11WIFS as functions of ligand concentration. The rates of L-asp binding were measured in the presence of 0.5 (blue), 1 (red), 2 (green), 4 (purple) or 8 (orange) mM Na+ ions. Data were fitted to Equation 4 to determine plateau kr values (Materials and methods). DL-TBOA binding experiments were conducted in 4 (blue), 8 (red), 12 (green) or 16 (purple) mM Na+ ions and fitted to Equation 3 to obtain plateau kr values. All experiments were performed in triplicate and means and standard error bars are shown. (c) Schematic representation of Na+-driven conformational selection mechanism. In this model, T* is a conformation of the transporter that is unable to bind substrate with appreciable affinity. Na+ binding is coupled to a transition to a conformation that binds L-asp and the remaining two Na+ ions rapidly. (d) Na+ dependence of kr values for L-asp (open squares) and DL-TBOA (solid squares) binding. Error bars are standard errors from fits in panels a) and b). The kr values for DL-TBOA at 20 and 24 mM were approximated by measuring kobs of 8 mM DL-TBOA binding (expected to be well at the plateau). Linear fits of L-asp (red) and DL-TBOA (blue) kr-s were constrained to go through the origin, yielding slopes of 36 ± 0.9 M- 1 s−1 and 26 ± 1.7 M−1 s−1.
Figure 4 with 5 supplements

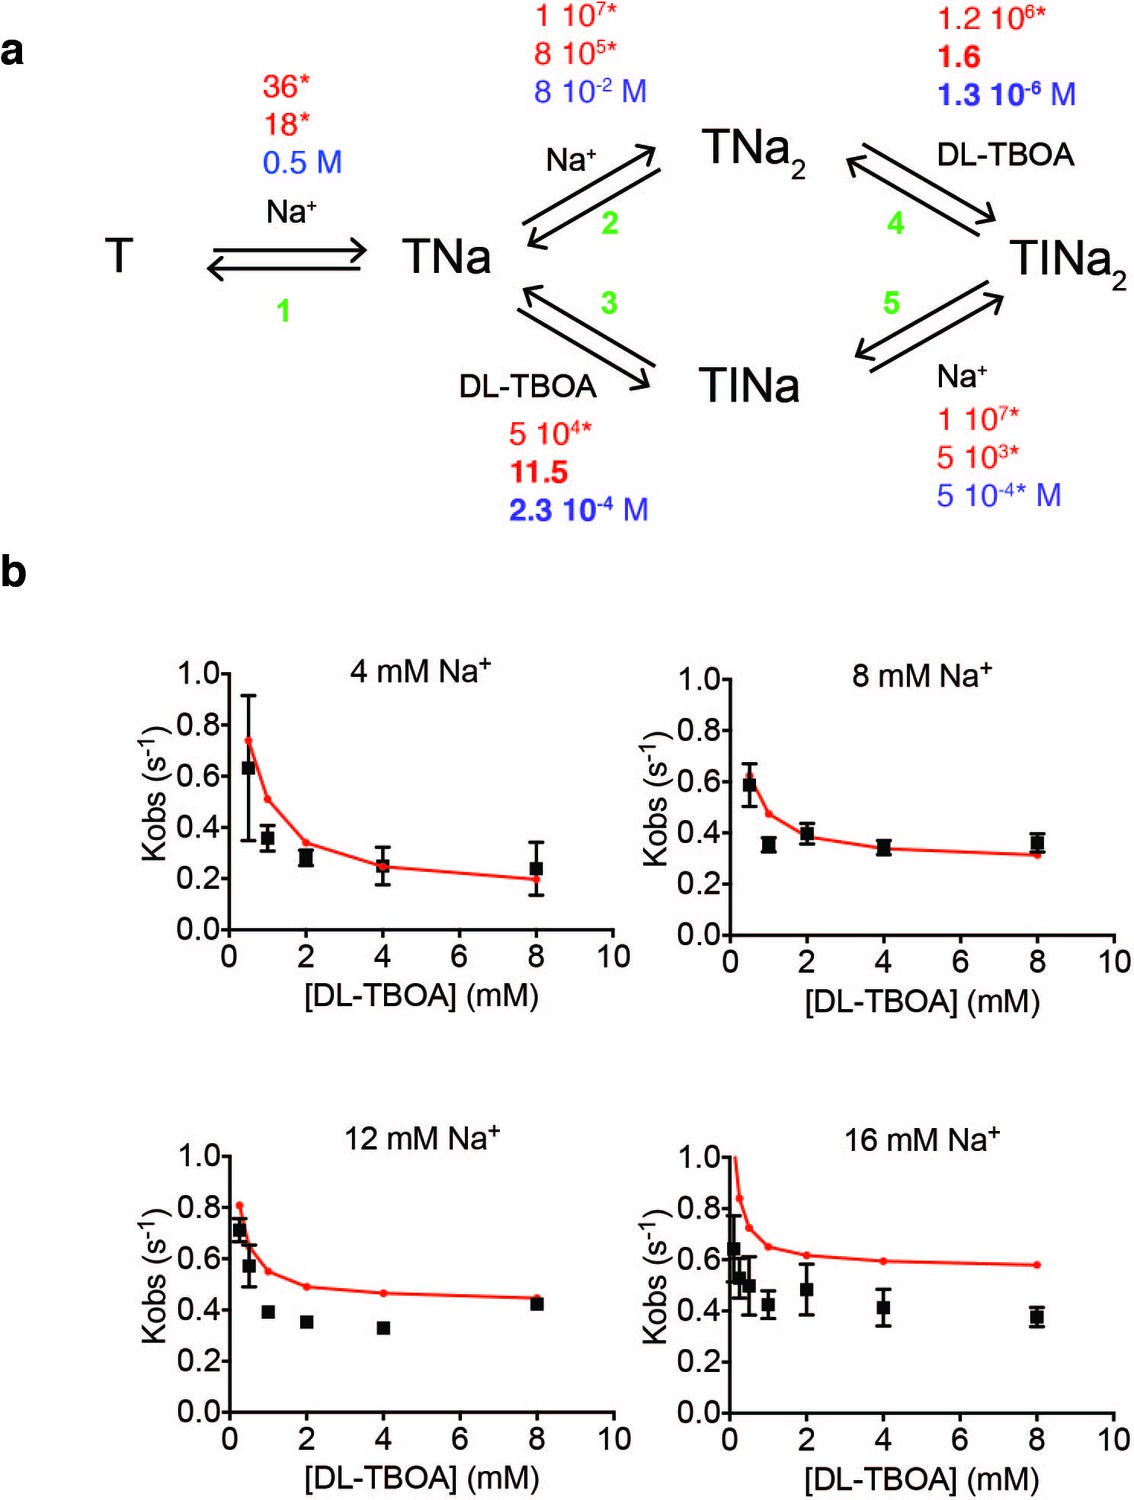
A kinetic model of Na+ and L-asp binding to P11WIFS.
(a) The proposed reaction mechanism. The kinetic and equilibrium constants are shown next to the individual reactions (numbered in green). The on- (red) and off-rate constants (blue) are in M−1 s−1 and s−1, respectively. The equilibrium dissociation constants (black) are in M. Constants that were fixed during data fitting are marked by starts. (b) Simulated binding reaction, in which 1 µM apo transporter is mixed with Na+ ions and L-asp. The amounts of ligands are indicated above the graphs that show reaction fluxes through ‘second Na+ ion binds first’ (TNa2, orange) and ‘L-asp binds first’ (TANa, green) reaction pathways. (c) Simulated binding and dissociation reactions showing that only apo transporter (T, red) and fully bound transporter (TANa3, blue) become populated, while all potential reaction intermediates (magenta) are present only in miniscule amounts.
-
Figure 4—source data 1
Kinetic rate constants summary.
* marks the rate constants that were fixed during KinTek analysis. # marks the rate constants that were optimized in KinTek during global data fitting are in bold. $ A stands for the binding ligand, L-Asp or DL-TBOA. Errors are standard errors of the fit.
- https://doi.org/10.7554/eLife.37291.015
Figure 4—figure supplement 1
Fitted rate constants describe experimental data well.
Shown are simulated and experimental data for L-asp binding kinetics at variable Na+ concentrations (a); L-asp dissociation as a function of Na+ concentration (b); dependence of L-asp binding rates on Na+ ions at high and low L-asp concentrations (c); and equilibrium dissociation constants of L-asp binding as a function of Na+ concentration (d).
Figure 4—figure supplement 2
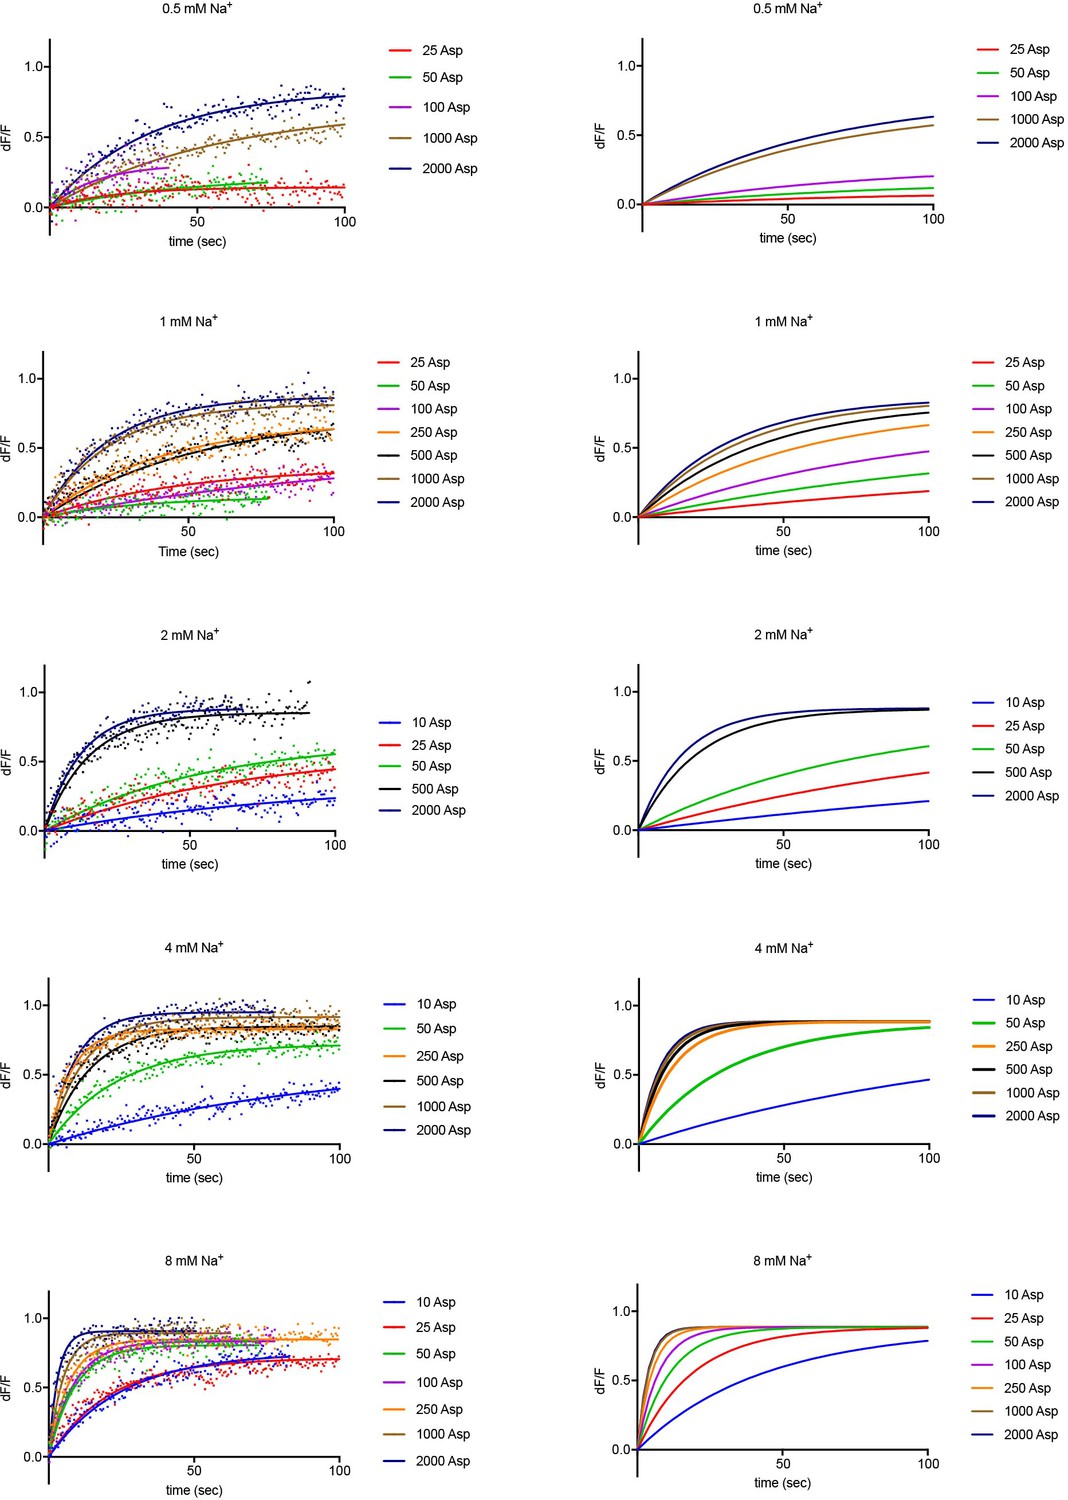
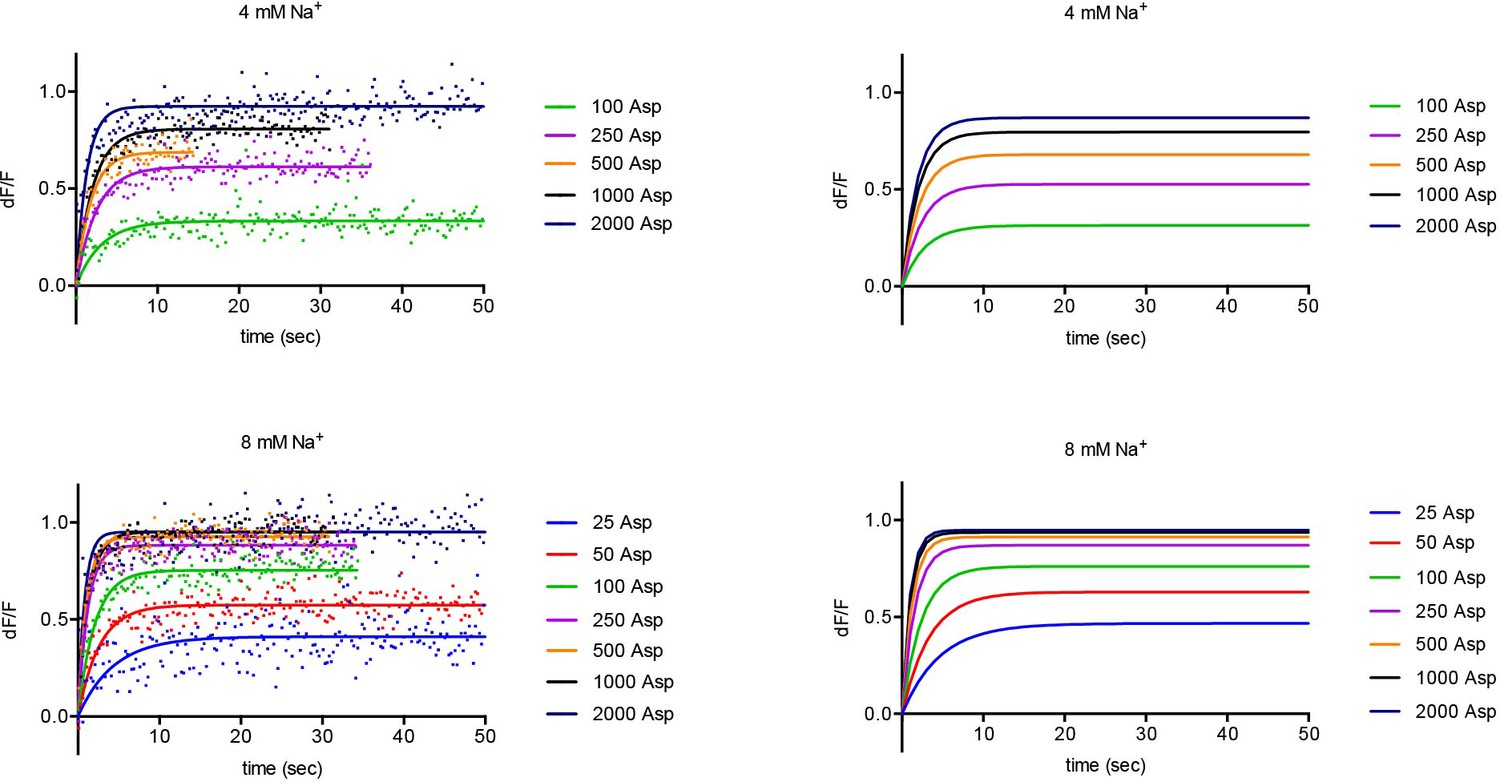
Experimental and simulated kinetics of L-asp binding to P11WIFS.
Left panels: Kinetics of L-asp binding measured upon addition of the indicated Na+ (mM) and L-asp (μM) amounts. Data are fitted to single exponential functions. For brevity, single representative experiments are shown from sets of triplicates under each experimental condition. Color scheme is as follows: blue, 10 µM red, 25 μM; green, 50 μM; purple, 100 μM; orange, 250 μM; black, 500 μM; ocher, 1000 μM; navy blue, 2000 μM L-asp. The simulations using values obtained in global fitting of the data are shown on the right panels.
Figure 4—figure supplement 3
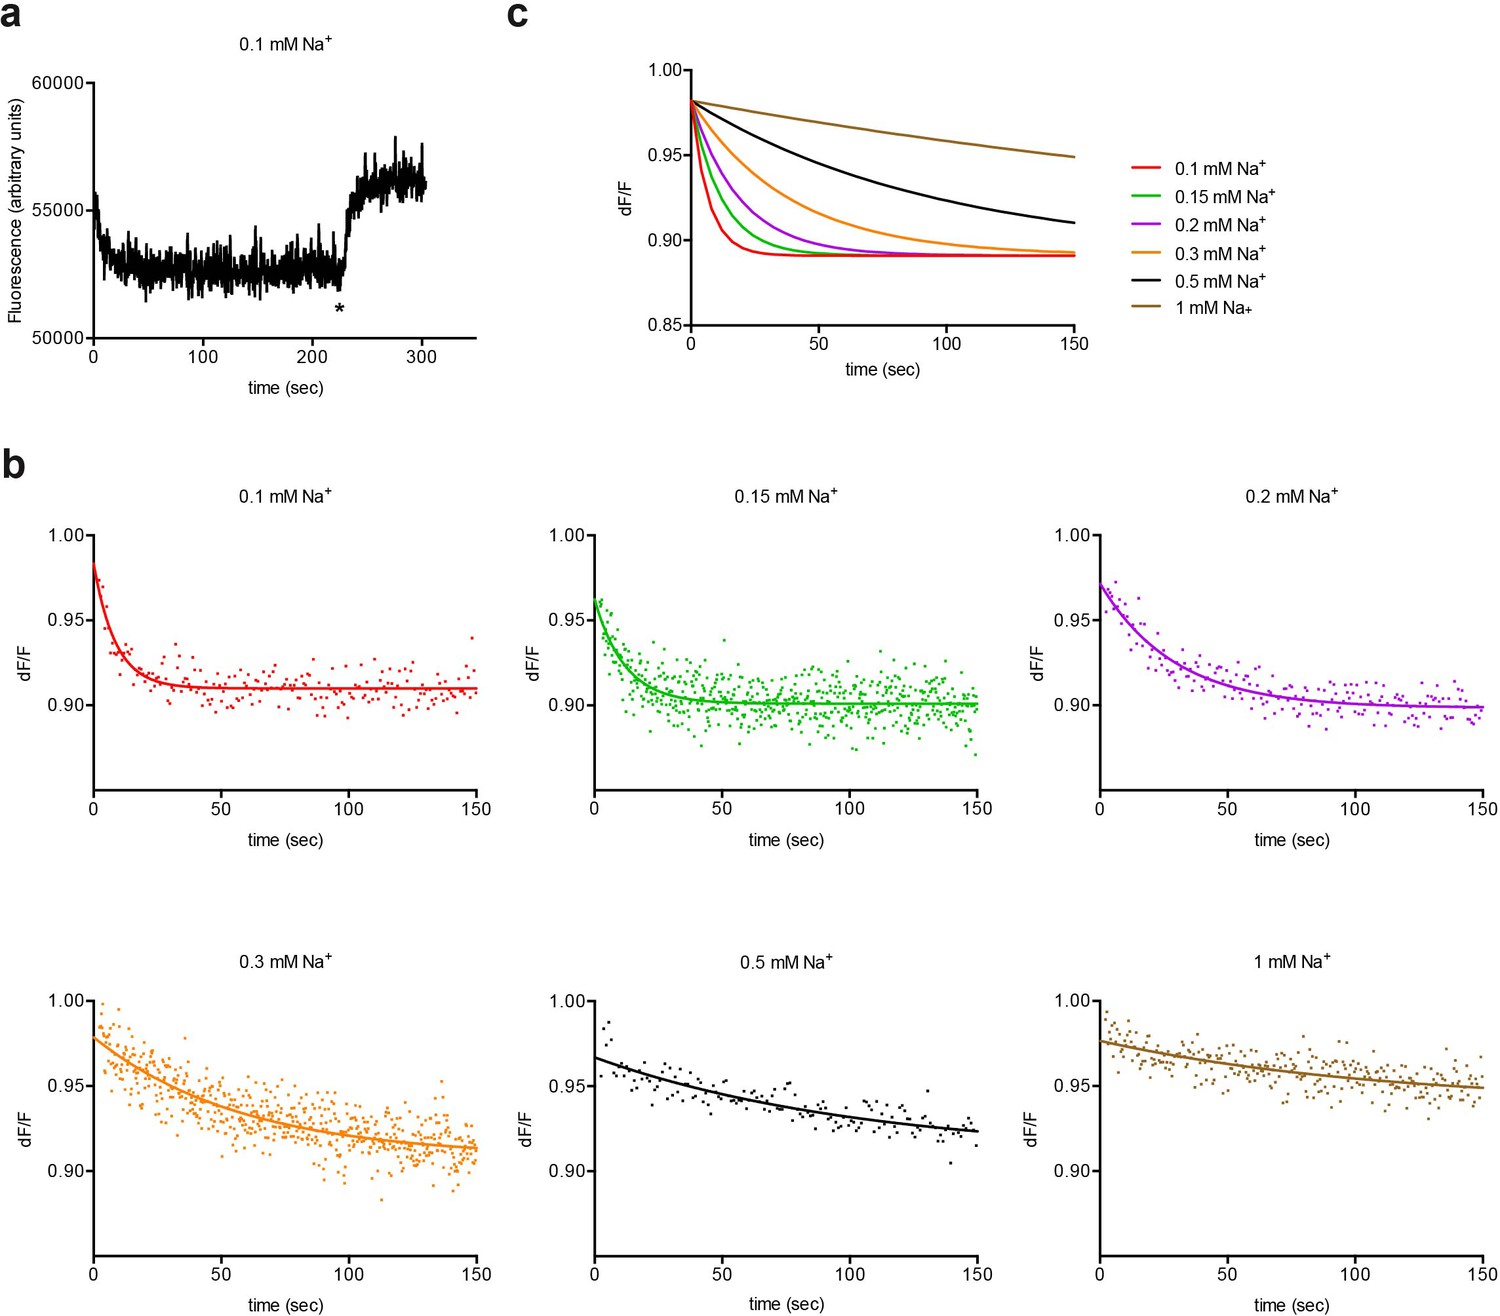
Experimental and simulated kinetics of L-asp dissociation from P11WIFS.
(a) Example of an experiment to determine the kinetics of L-asp dissociation from P11WIFS. Protein bound to Na+ and L-asp was diluted into buffer to the final concentration of 0.1 mM Na+ and 0.25 µM L-asp. Excess Na+/L-asp was added at the end of the experiment (marked by asterisk) to saturate P11WIFS and estimate the pre-dilution baseline. (b) Kinetics of L-asp dissociation observed at the indicated final Na+ (mM) concentrations. Data were fitted to single exponential functions. Representative experiments are shown. Color scheme is as follows: red, 0.1 mM; green, 0.15 mM; purple, 0.2 mM; orange, 0.3 mM; black, 0.5 mM; ocher, 1 mM Na+. (c) The simulations obtained using values from the global fitting of the data.
Figure 4—figure supplement 4
Kinetic modeling of DL-TBOA binding to P11WIFS.
(a) The shown kinetic model was implemented in KinTek. Binding (red), unbinding (blue) kinetic constants and equilibrium dissociation constants (black) are in s−1 M−1, s−1 and M, respectively. All kinetic constants marked by stars were fixed to values used to fit L-asp binding data. Only the rates of DL-TBOA dissociation in reactions 3 and 4 (shown in bold) were fitted. (b) The model (red) recapitulates the experimental data (black) for DL-TBOA binding reasonably well.
Figure 4—figure supplement 5
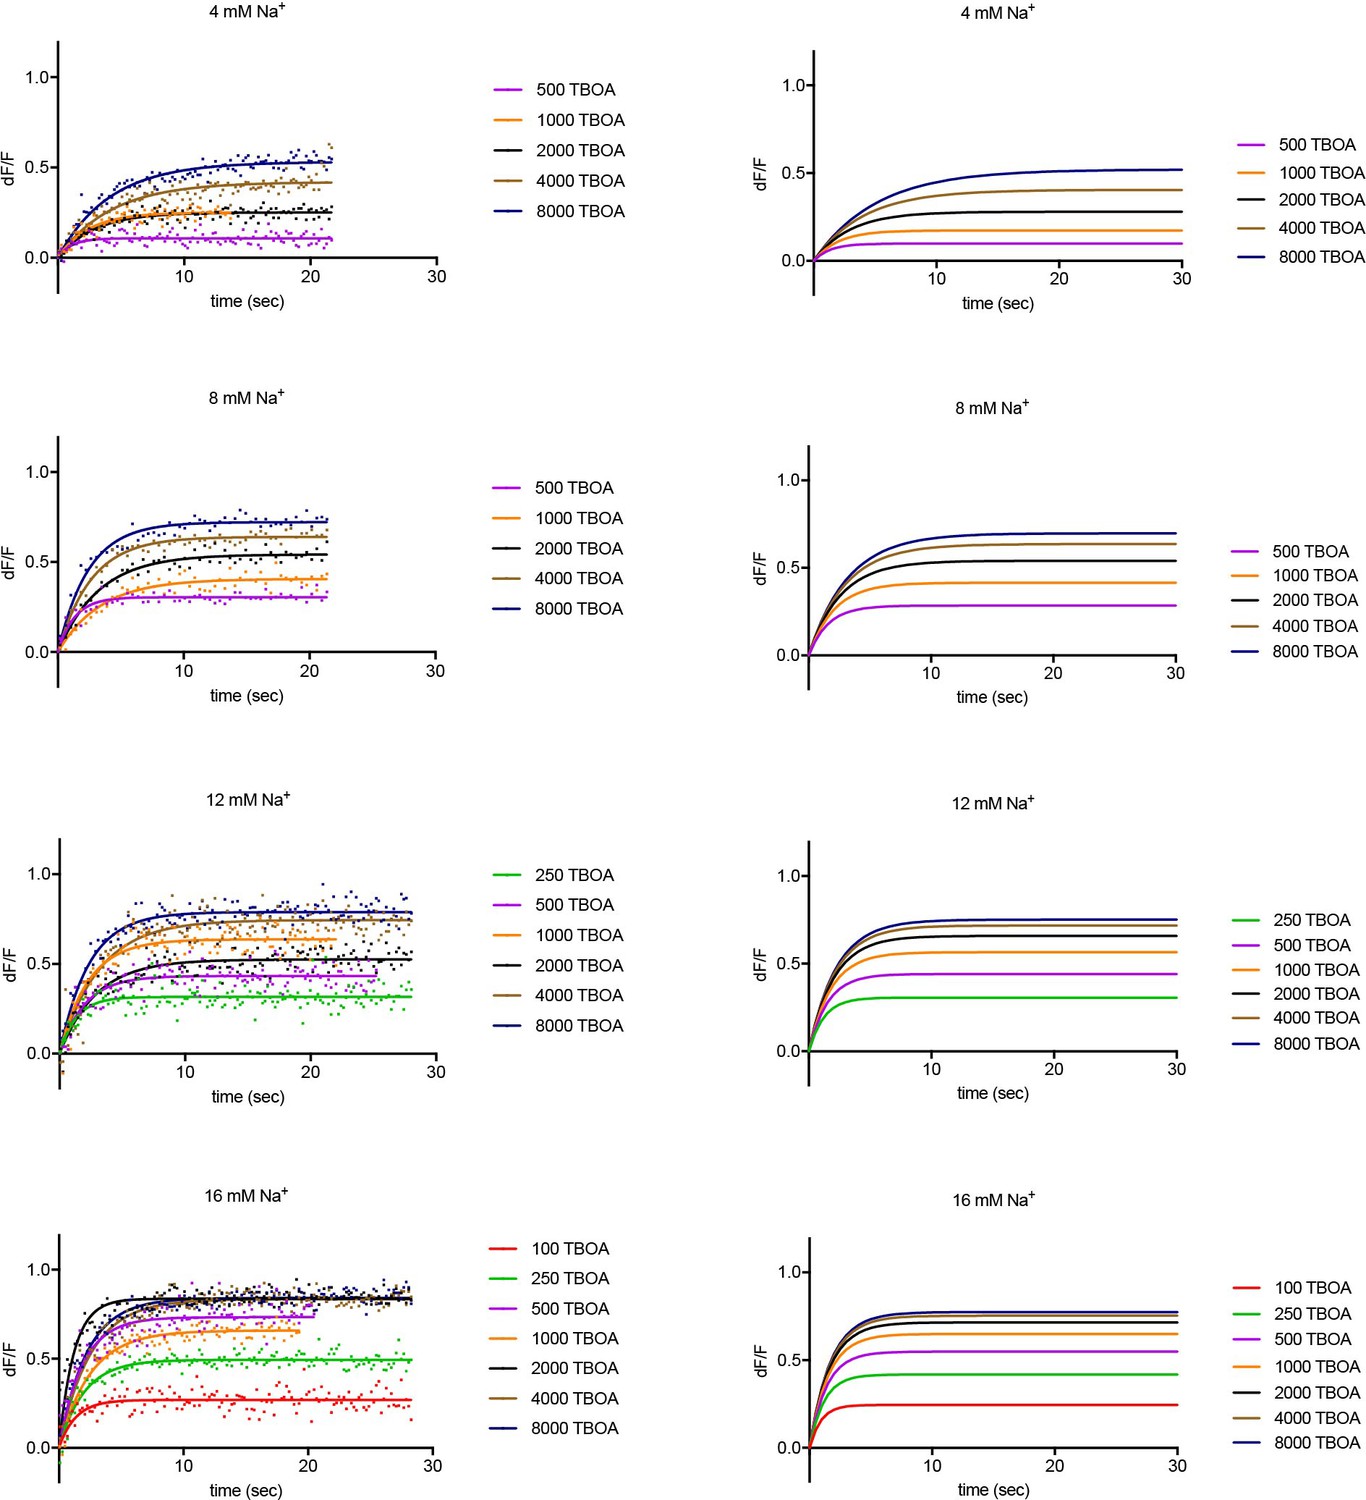
Experimental and simulated kinetics of DL-TBOA binding to P11WIFS.
Left panels: Representative experimental data showing kinetics of DL-TBOA binding in the presence of indicated Na+ (mM) and L-asp (μM) concentrations. Data were fitted to single exponential function. Single representative experiments are shown. Color scheme is as follows: red, 100 μM; green, 250 μM; purple, 500 μM; orange, 1000 μM; black, 2000 μM; ocher, 4000 μM; navy blue, 8000 μM DL-TBOA. Simulation using parameters from the global fitting of the data are shown on the right panels.
Figure 5 with 2 supplements
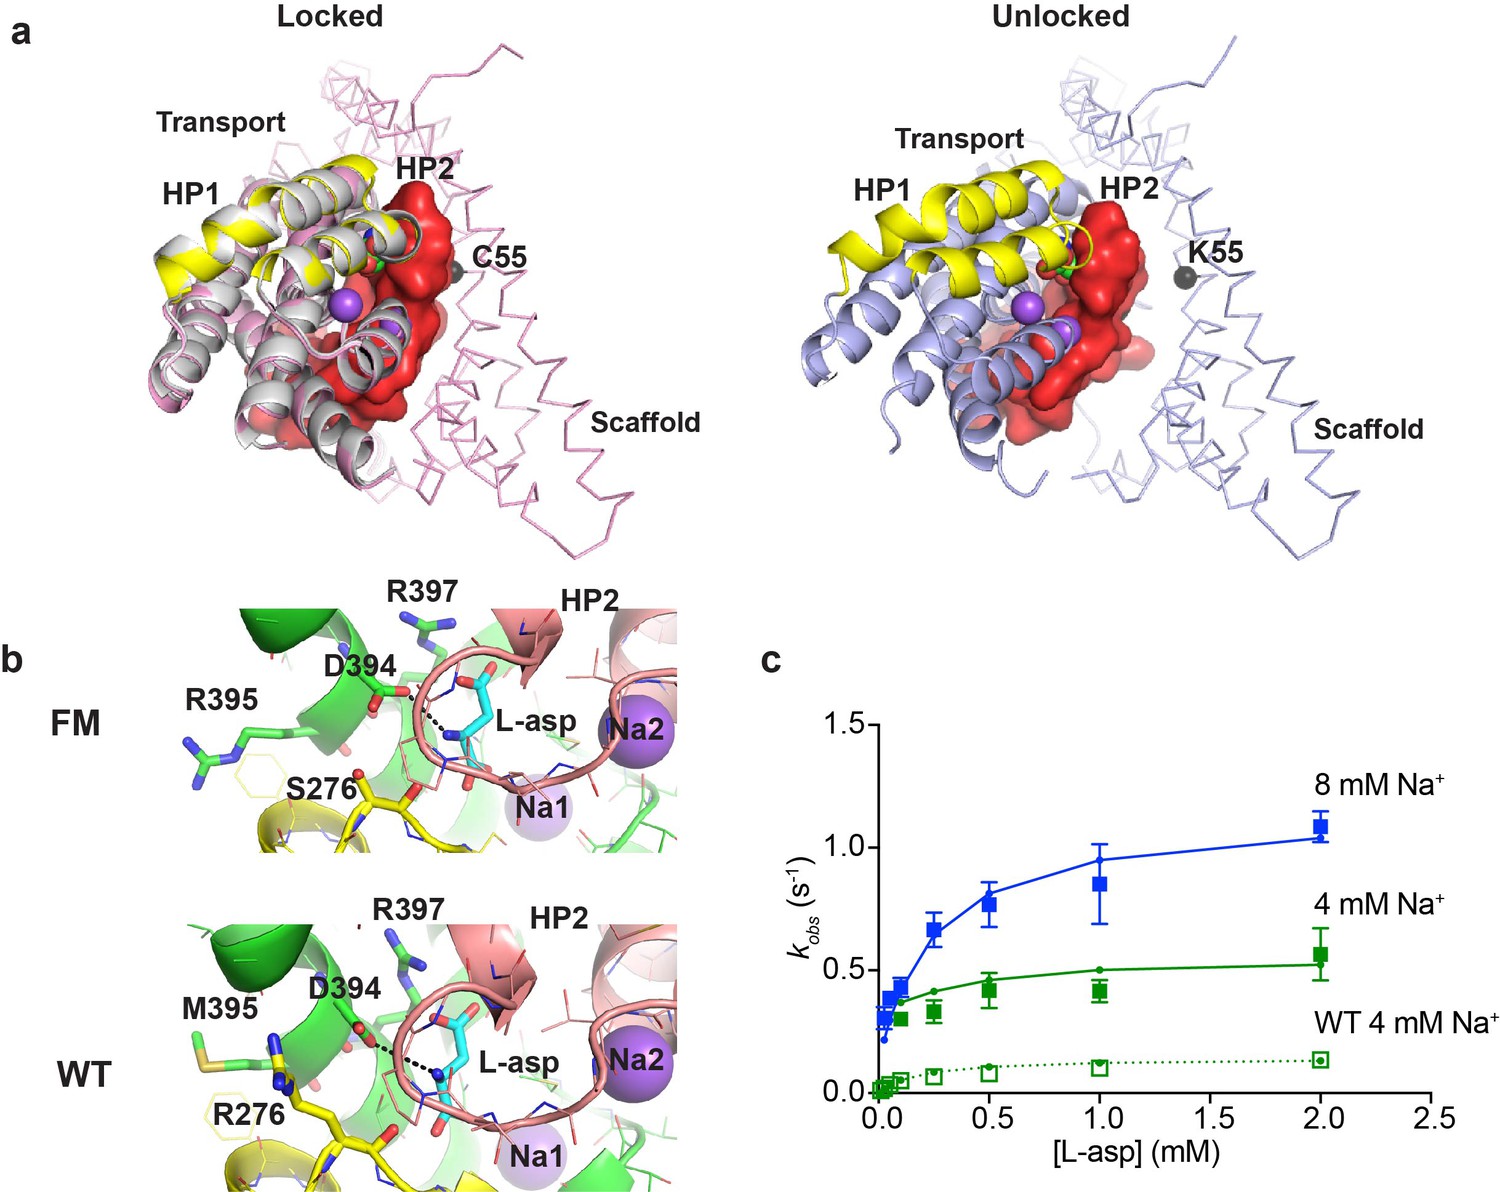
Crystal structure and L-asp binding kinetics of FM-GltPhIFS.
(a) The superimposition of ‘locked’ conformations of FM-GltPhIFS and GltPhIFS (PDB code: 3KBC, left) and ‘unlocked’ conformation of FM-GltPh (PDB code: 4X2S, right). Single protomers are viewed from the cytoplasmic side of the membrane, rotated approximately 90°C compared to the representations in Figure 1a that are shown in membrane plane. FM-GltPhIFS, GltPhIFS and FM-GltPh are colored pink, gray and blue, respectively. HP1 and HP2 of the FM variants are highlighted as yellow and red, respectively, and HP2 is shown in surface representation. A cleft is visible in uncross-linked FM-GltPh, which may allow HP2 opening. Cα R.M.S.D. between FM-GltPhIFS and GltPhIFS structures is 0.4 Å. The Cα atom of residue 55, which is mutated to Cys and cross-linked to 364C in the transport domain of FM-GltPhIFS is emphasized as a black sphere. (b) Close-up of the substrate-binding site in FM-GltPhIFS (top) and GltPhIFS (bottom). The key substrate-coordinating residues are highlighted as sticks, and the bond between the carboxyl group of D394 and amino group of the substrate is shown as a black dotted line. (c) Rate constants of L-asp binding to FM-P11WIFS in the presence of 4 (green) and 8 (blue) mM Na+ ions. Solid lines through the data have been generated using the rate constant and kinetic model shown in Figure 5—figure supplement 1. Open green squares and dotted line show the rate constant of L-asp binding to P11WIFS in the presence of 4 mM Na+ for comparison.
Figure 5—figure supplement 1
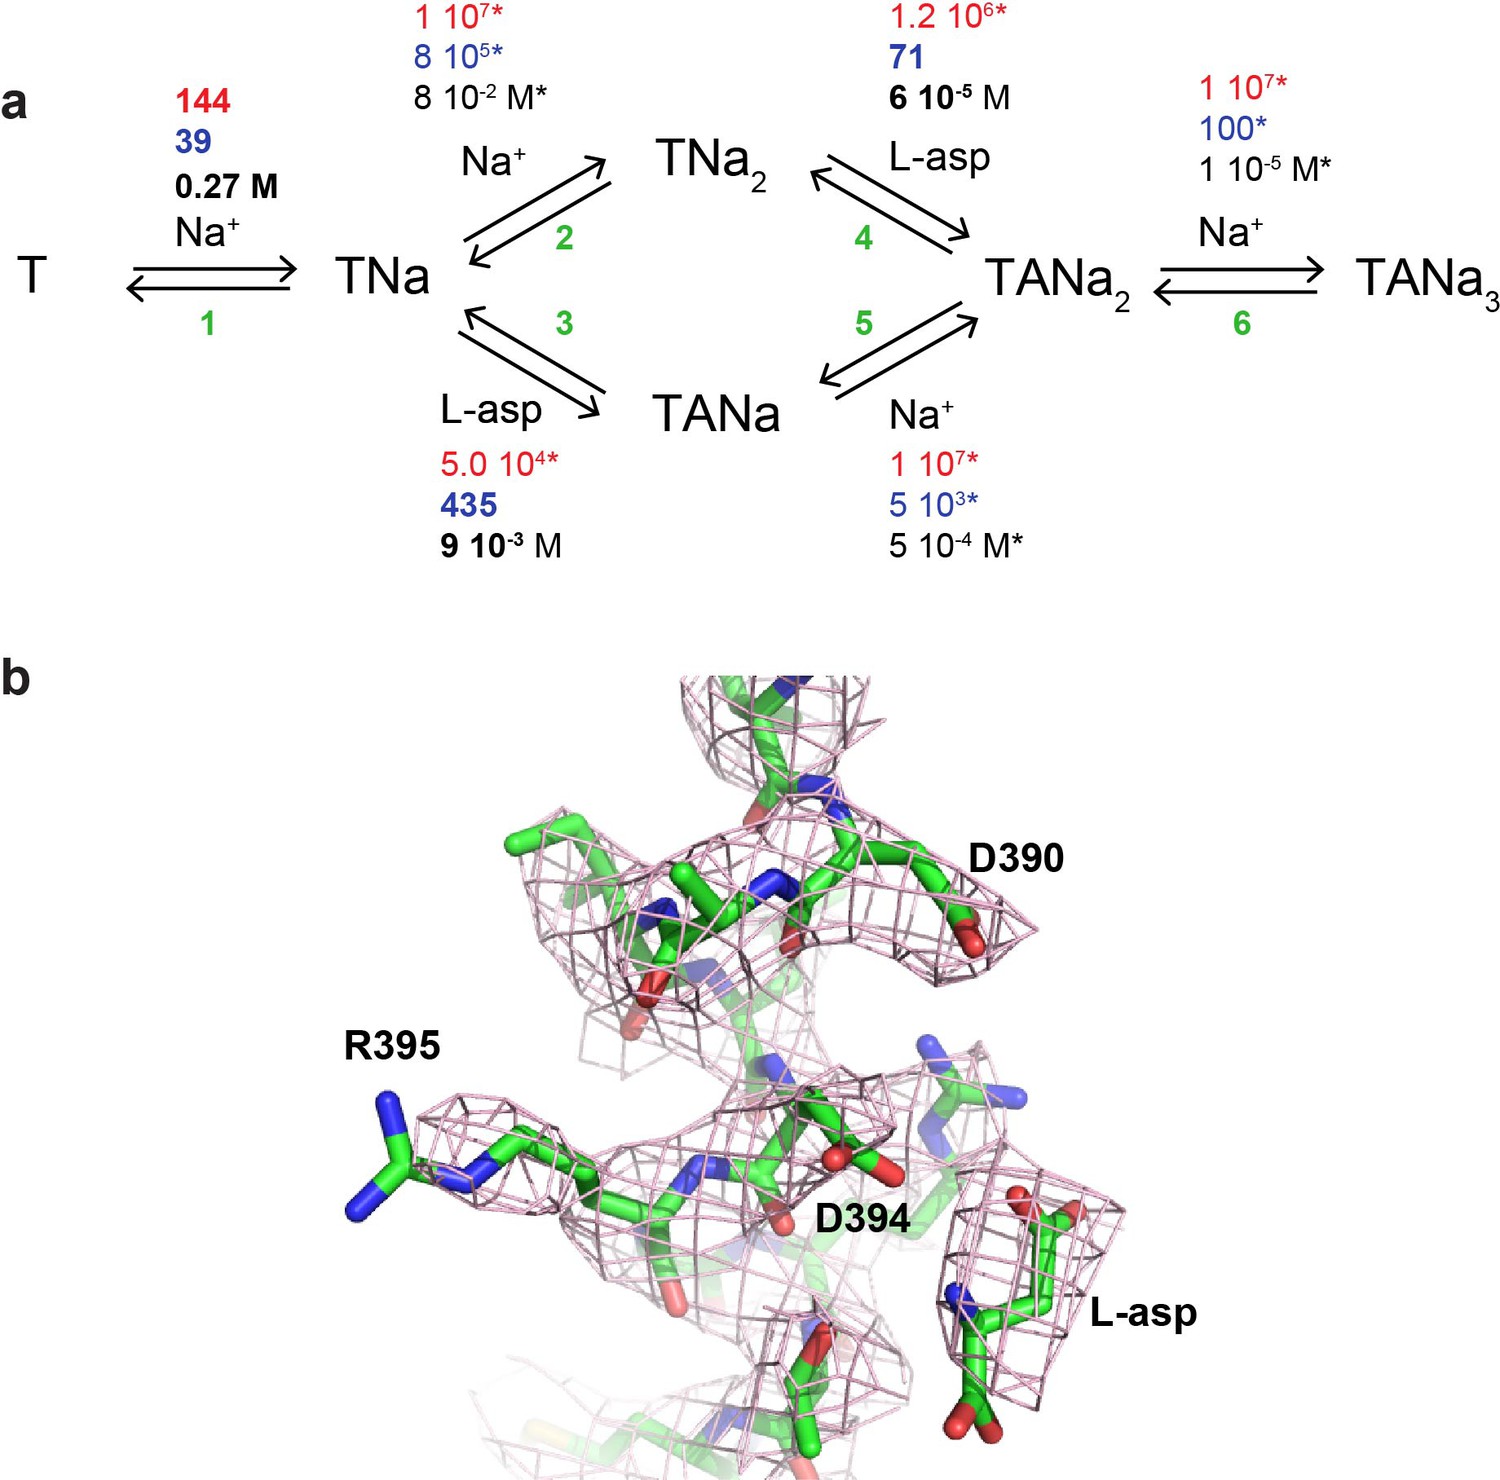
(a) The kinetic model describing L-asp binding to FM-P11WIFS.
The binding (red) and unbinding (blue) rate constants and the equilibrium constants (black) are in M−1 s−1, s−1 and M. All kinetic constants marked by stars were fixed to values used to fit L-asp binding data and the fitted constants are highlighted in bold. (b) Shown is a fragment of TM8 of FM-GtPhIFS including residue R395 and bound L-asp. The mesh object is the three-fold averaged sharpened 2Fo-Fc electron density contoured at 1.2 σ.
Figure 5—figure supplement 2
Experimental and simulated kinetics of L-asp binding to FM-P11WIFS.
Left panels: representative data showing kinetics of L-asp binding in the presence of the indicated Na+ (mM) and L-asp (μM) concentrations. Data were fitted to single exponential functions. Color scheme is as follows: blue, 25 μM; red, 50 μM; green, 100 μM; purple, 250 uM; orange, 500 μM; black, 1000 μM; navy blue, 2000 μM L-asp. The simulations obtained using parameters from the global fitting of the data are shown on the right panels.
Tables
Table 1
Crystallographic data and structure refinement
https://doi.org/10.7554/eLife.37291.019| FM-GltPhIFS | |
|---|---|
| Data collection | |
| Space group | C2221 |
| Cell dimensions | |
| a, b, c (Å) | 116.48, 196.42, 194.33 |
| a, b, g (°) | 90.00, 90.00, 90.00 |
| Resolution (Å) | 50.0–4.05 (4.19–4.05)* |
| Rsym or Rmerge | 0.142 (0.982) |
| I / σI | 17.8 (2.2) |
| Completeness (%) | 99.7 (99.7) |
| Redundancy | 12.2 (11.7) |
| Refinement | |
| Resolution (Å) | 19.9–4.05 |
| No. reflections | 18216 |
| Rwork/Rfree | 0.2217/0.2660 |
| No. atoms | |
| Protein | 9138 |
| Ligand/ion | 27/6 |
| Water | 0 |
| B-factors | |
| Protein | 185.57 |
| Ligand/ion | 184.71/180.44 |
| R.m.s. deviations | |
| Bond lengths (Å) | 0.005 |
| Bond angles (°) | 0.989 |
-
*Values in the brackets correspond to the highest resolution shell.
Additional files
-
Transparent reporting form
- https://doi.org/10.7554/eLife.37291.020
Download links
A two-part list of links to download the article, or parts of the article, in various formats.
Downloads (link to download the article as PDF)
Open citations (links to open the citations from this article in various online reference manager services)
Cite this article (links to download the citations from this article in formats compatible with various reference manager tools)
Kinetic mechanism of coupled binding in sodium-aspartate symporter GltPh
eLife 7:e37291.
https://doi.org/10.7554/eLife.37291


