Biophysical properties of single rotavirus particles account for the functions of protein shells in a multilayered virus
- Universidad Autónoma de Madrid, Spain
- Centro Nacional de Microbiología/ISCIII, Spain
- Centro Nacional de Biotecnología/CSIC, Spain
- Universitat de Barcelona, Spain
Figures
Figure 1 with 1 supplement
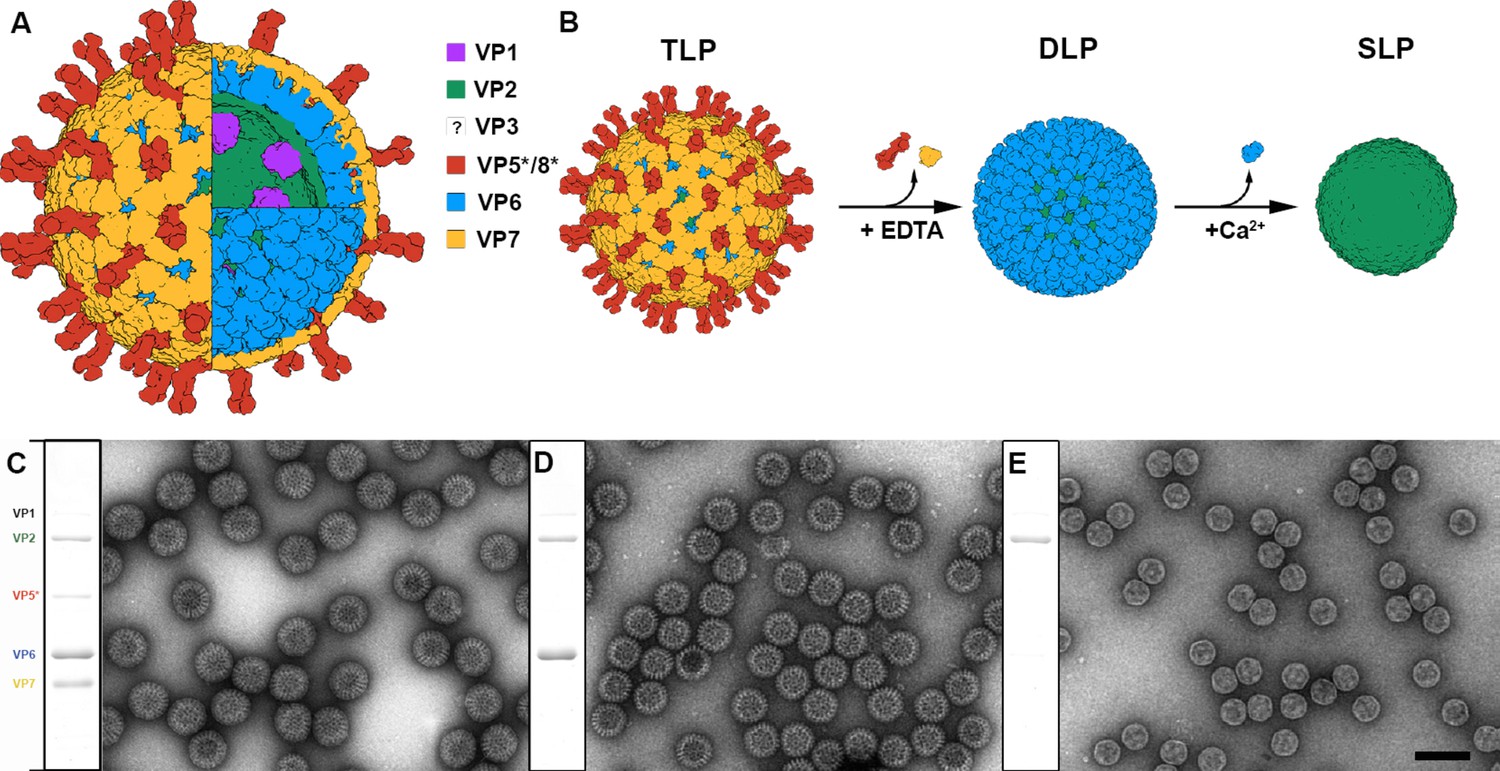
Production and purification of TLP and subviral particles.
(A) Schematic representation of the mature RV TLP. Color code is detailed. (B) DLP and SLP generation from TLP. VP7 and VP5*/VP8* are disassembled from TLP in the presence of EDTA. High concentration of Ca2+ ions takes apart VP6 trimers to liberate SLP. (C–E) Coomassie blue-stained SDS-PAGE gels and negative staining electron microscopy of TLP (C), DLP (D) and SLP (E). Positions of rotavirus structural proteins (VP) are indicated. The question mark indicates the unknown position and structure of VP3. The bar represents 100 nm.
Figure 1—figure supplement 1
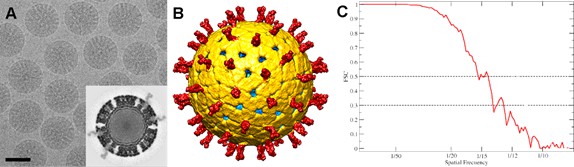
Cryo-EM analysis of TLP.
(A) Cryo-electron micrograph of TLP. The bar represents 50 nm. The inset corresponds to a transverse section of the map. (B) Surface-shaded representation of the outer surface of TLP viewed along an icosahedral 2-fold axis. The surface is radially color-coded to represent VP8*/VP5* spikes in red, VP7 in yellow, VP6 in green and VP2 in green. The density is contoured at 1 σ above the mean. (C) Assessment of the resolution by FSC curve. For 0.5 and 0.3 FSC threshold the resolution is 14.2 and 12.6, respectively.
Figure 2 with 2 supplements
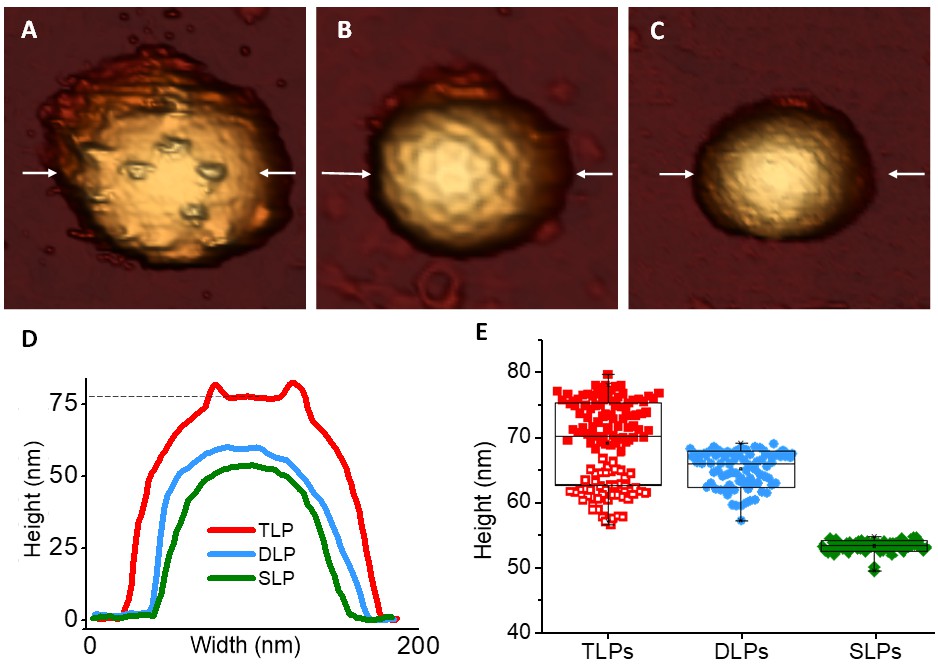
AFM topographies of TLP and subviral particles.
(A–C) AFM images of TLP (A), DLP (B) and SLP (C). (D) Height profile of the TLP, DLP and SLP taken along the central part (indicated with arrows) of the particles shown in panels A-C. Dashed line indicates the height of the particle obtained at the VP7 layer. (E) Box plot of heights measured from single TLP [69.7 ± 6.1 nm (red, N = 129)], DLP [65.7 ± 2.8 nm (blue, N = 82)] and SLP [53.8 ± 0.9 nm (green, N = 71)]. The two different populations of TLP are indicated with filled and empty red squares (see main text). Height data are available from Figure 2—source data 1 and 2.
-
Figure 2—source data 1
Topo profiles of Figure 2D.
- https://doi.org/10.7554/eLife.37295.008
-
Figure 2—source data 2
Height data points statistics of Figure 2E.
- https://doi.org/10.7554/eLife.37295.009
Figure 2—figure supplement 1
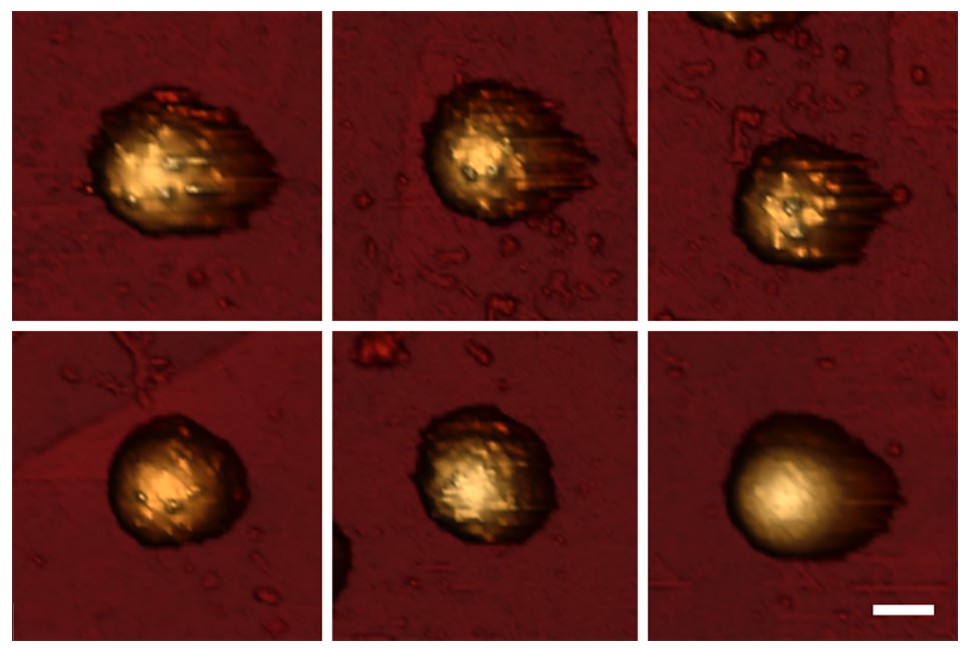
AFM topography of TLP.
Gallery of AFM images of TLP presenting different spike occupancy from high (top left) to low (bottom right). The scale bar represents 40 nm.
Figure 2—figure supplement 2
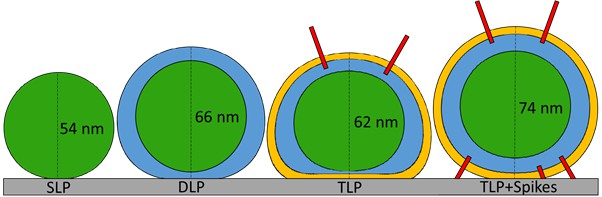
Deformation of RV subviral particles after adsorption on HOPG.
VP2, VP6 and VP7 are depicted in green, blue and yellow colors, respectively. Regarding the nominal height of each particle (55 nm for SLP, 70 nm for DLP and 76 nm for TLP), the SLP suffers the lowest percentage of deformation (2%) after substrate adsorption. The substrate deforms the DLP by 6%. The TLP without spikes at the interface between the particle and the substrate (62 nm) undergoes the highest percentage of deformation (18%), suggesting a strong interaction of the VP7 layer and the HOPG. This high deformation is hugely reduced to 3% in the TLP with spikes present at the particle-substrate interface (74 nm).
Figure 3
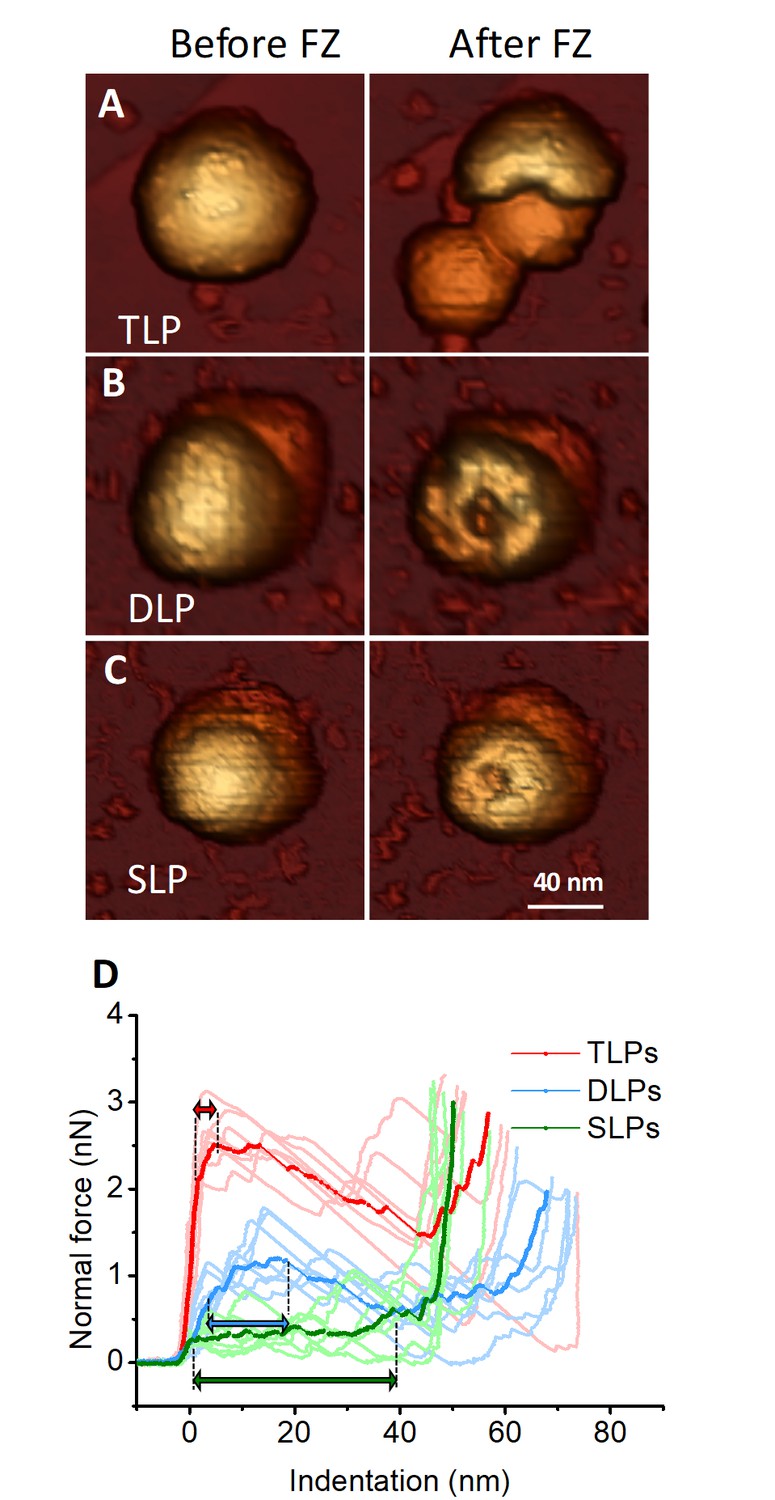
Single-indentation assay of TLP and subviral particles.
(A–C) AFM topographies of an individual TLP (A), DLP (B) and SLP (C) before (left) and after (right) nanoindentation. (D) Force Indentation Curves (FICs) measured for each individual TLP (N = 7 from 45), DLP (N = 7 from 11) and SLP (N = 7 from 16), as indicated. The average curve is highlighted for each specimen. Double headed arrows indicate plastic deformation, as explained in text. FIC data are available from Figure 3—source data 1.
-
Figure 3—source data 1
Indentation curves.
- https://doi.org/10.7554/eLife.37295.012
Figure 4 with 2 supplements

Mechanical properties.
Box plots of (A) elastic constant, and (B) breaking force calculated from the FIC (Figure 3) for TLP (red, N = 45), DLP (blue, N = 11) and SLP (green, N = 16), as explained in text. Data are Figure 4—source data 1 and 2. The yield strain (ε) which is a combination of elasticity and breaking force, can be found in Figure 4—figure supplement 2. (C) Stress distribution at 4 nm of indentation in the models used in the FE simulations of SLP (left), DLP (middle) and TLP (right). Inset color scale represents the value of the von Mises stress in Pa. See Materials and methods and Figure 4—figure supplement 1 for more information.
-
Figure 4—source data 1
Spring constants of Figure 4A.
- https://doi.org/10.7554/eLife.37295.017
-
Figure 4—source data 2
Breaking forces of Figure 4B.
- https://doi.org/10.7554/eLife.37295.018
Figure 4—figure supplement 1
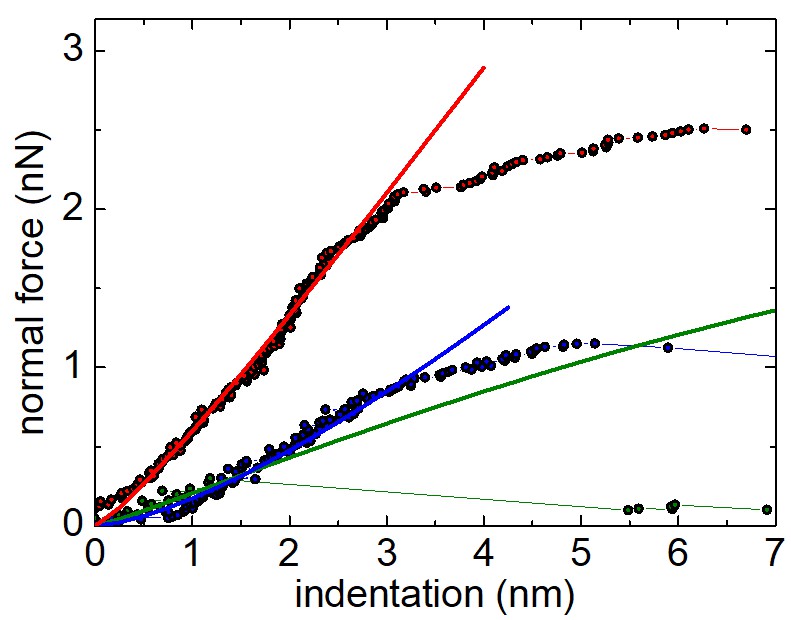
Finite element model of the RV particle.
Force-indentation curves obtained from finite element simulations of the AFM nanoindentation experiments. The green line represents the values obtained for the SLP; the blue line corresponds to the DLP, and the red line to the TLP. In all cases, the Young’s moduli of the different layers were selected to achieve the experimentally observed spring constant (Figure 3 and Materials and methods). Dotted lines represent experimental indentation curves.
Figure 4—figure supplement 2
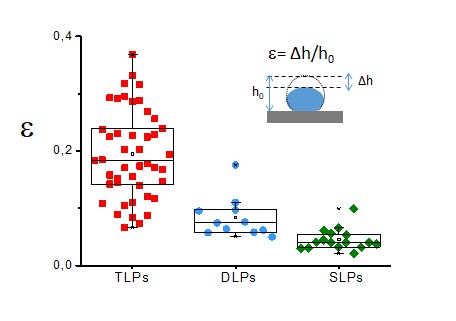
Yield strain.
This figure presents box plots of the yield strain for TLP (red, N = 45), DLP (blue, N = 11) and SLP (green, N = 16). The yield strain is defined by the coefficient between the indentation at the elastic limit and the original height of the particle, as indicated by the inset. Data are available from Figure 4—figure supplement 2—source data 1.
-
Figure 4—figure supplement 2—source data 1
Critical strain of Figure 4—figure supplement 2.
- https://doi.org/10.7554/eLife.37295.016
Figure 5 with 1 supplement
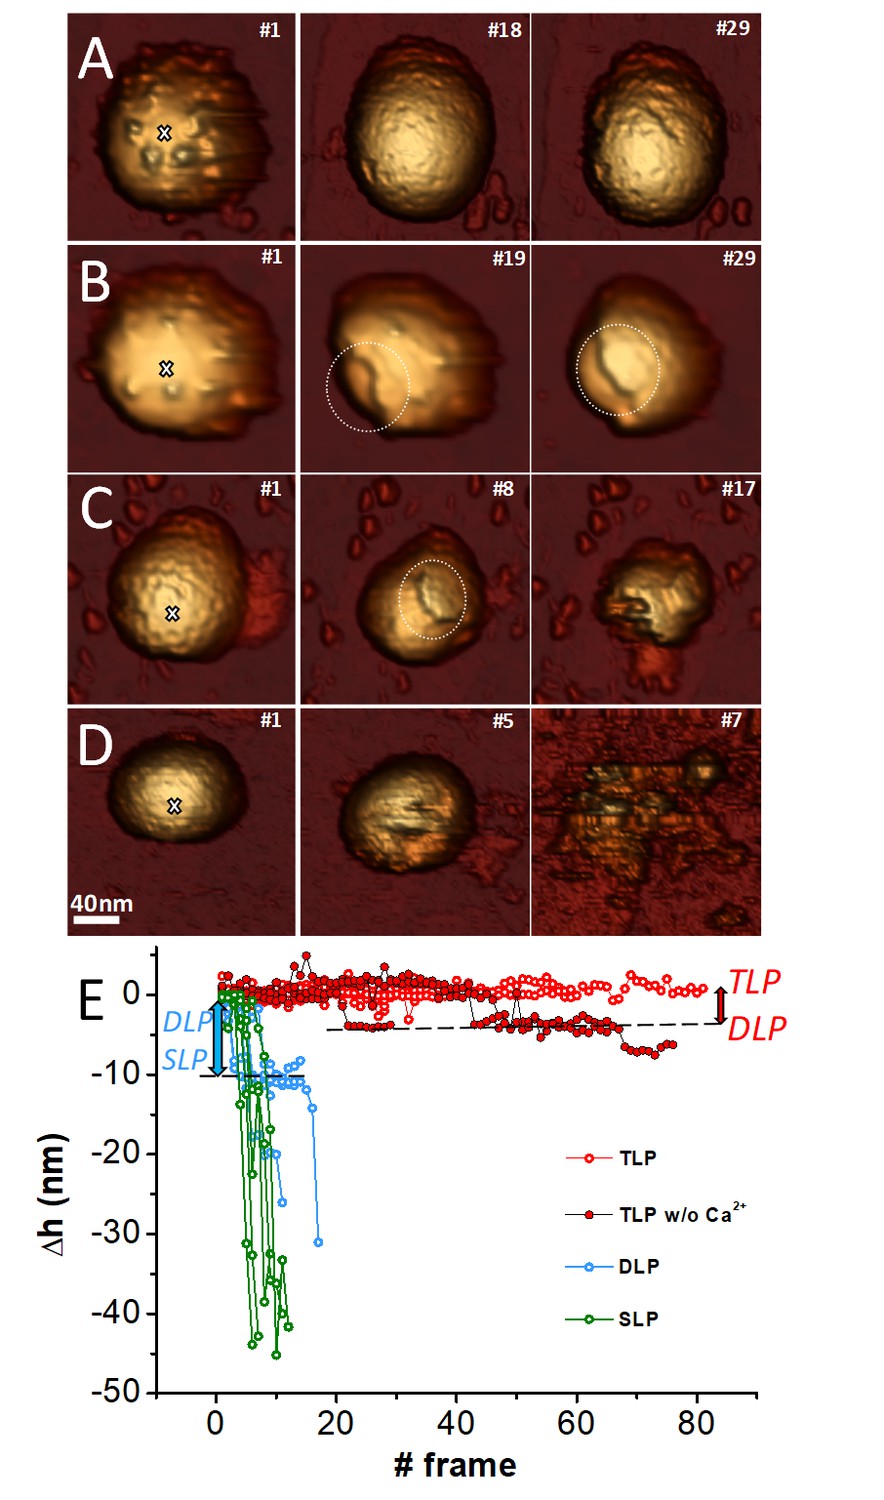
Fatigue of TLP and subviral particles.
Topographic evolution of TLP (A), TLP + EDTA (B), DLP (C) and SLP (D) during continuous imaging at low force (~60–120 pN) indicating the corresponding displayed frames. (E) Topographic evolutions obtained at the position indicated with a white cross (A–D) in TLP (red), DLP (blue) and SLP (green) particles. Dark red color indicates fatigue of TLP + EDTA. Red and blue arrows indicate the loss of height from TLP to DLP and for DLP to SLP, respectively. Data are available from Figure 5—source data 1. Videos 1–4 present the temporal evolution of these particles.
-
Figure 5—source data 1
Data height evolution with mechanical fatigue.
- https://doi.org/10.7554/eLife.37295.022
Figure 5—figure supplement 1
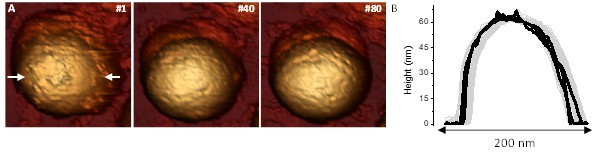
Fatigue of TLP.
(A) Topographical evolution of a TLP subjected to fatigue during 80 frames at 60–100 pN. White arrows indicate the line where the height profiles are taken. (B) Profile evolution with the black lines corresponding to the profiles of the frames shown in (A), and the gray lines corresponding to the rest of the profiles. Video 5 shows all the process. Data is available from Figure 5—figure supplement 1—source data 1.
-
Figure 5—figure supplement 1—source data 1
Profiles of the Figure 5—figure supplement 1B
- https://doi.org/10.7554/eLife.37295.021
Figure 6
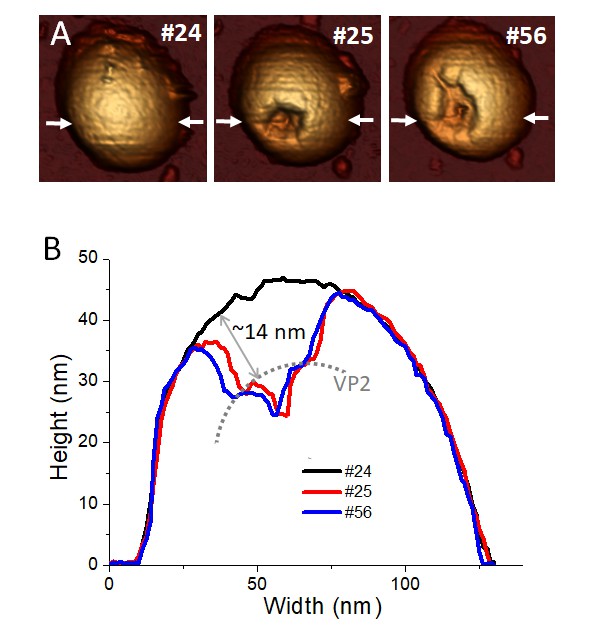
Combination of single indentation and fatigue assays.
(A) Topographical evolution of a TLP subjected to fatigue until image #24, where a controlled FIC locally perforated the three layers. Frame #25 shows the particle right after the FIC. Topography #56 is the same particle 31 frames after the FIC. Imaging force of ~100 pN. (B) Height profile evolution obtained at the white arrows depicted in the topographies. Dotted grey line indicates the position of VP2 layer. Data are available from Figure 6—source data 1. Video 6 presents the temporal evolution of this particle.
-
Figure 6—source data 1
Profiles of Figure 6B.
- https://doi.org/10.7554/eLife.37295.032
Figure 7 with 2 supplements
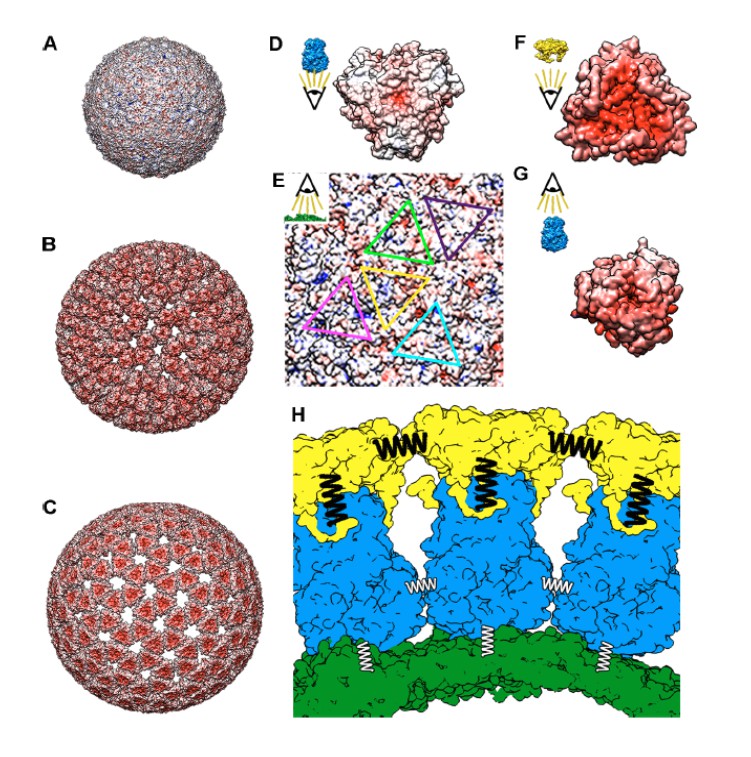
Molecular interactions of TLP and subviral particles.
Electrostatic potential of the outer surface of SLP (A), DLP (B) and TLP (C). Positive charge distribution is represented in blue, negative in red and hydrophobic in white. (D) Electrostatic potential of the inner surface of a VP6 trimer. (E) Electrostatic potential of the outer face of the VP2 shell. The positions for the interaction of the five quasi-equivalent trimers on the VP2 surface are marked with triangles of different colors. (F) Electrostatic potential of the inner surface of a VP7 trimer. (G) Electrostatic potential of the outer surface of a VP6 trimer. (H) Schematic representation of the VP2 (green), VP6 (blue) and VP7 (yellow) layers interaction. Thick black springs indicate a relatively high VP7-VP7 and VP6-VP7 interactions. The thin white springs point to weak VP6-VP6 and VP6-VP2 interactions. In panels D-G the insets indicate the point-of-view.
Figure 7—figure supplement 1
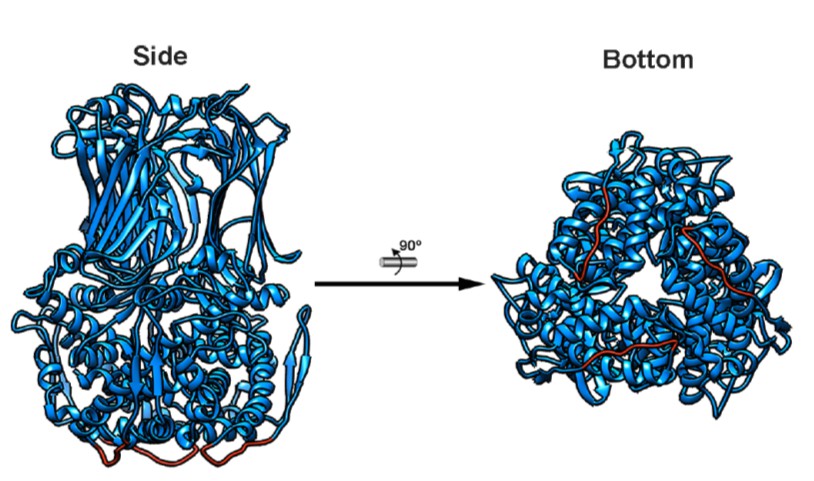
VP6 trimer atomic structure.
Ribbon representation of the side (left) and top (right) views of the atomic structure of the VP6 trimer (PDB 3KZ4) localized at the three-fold axis of the RV particle intermedium shell (Mathieu et al., 2001). The 65–72 loop, that interacts with the hydrophobic outer surface of the VP2 viral core.
Figure 7—figure supplement 2
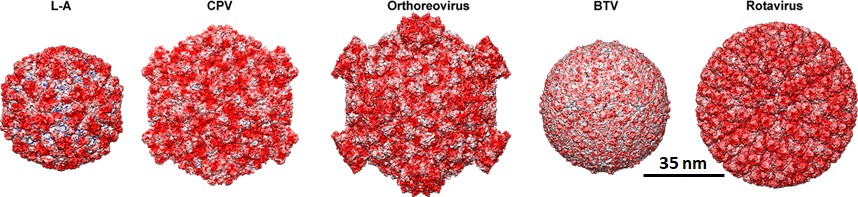
Outer surface of dsRNA virus transcription machineries with electrostatic potential.
Outer surface of: T = 1 capsids of L-A virus (L–A); Turreted T1 capsids of cytoplasmic polyhedrosis virus (CPV), and orthoreovirus; T1 core of Blue Tongue Virus (BTV); and DLP of RV viewed along a two-fold axis of icosahedral symmetry. The surface charge representations show the distribution of negative (red) and positive (blue) charges.
Videos
Video 1
Mechanical fatigue over TLP in TNC buffer during 32 frames (~82 min) at 100–200 pN per pixel (1 pixel = 1.4–2.3 nm).
This video corresponds to the particle of Figure 5A. White arrows indicate the line where the profiles have been obtained.
Video 2
Mechanical fatigue over TLP in TNC buffer being gradually replaced by TNE buffer (pumping TNE buffer and withdrawing liquid from the sample at 1 µl/min), during 31 frames (~80 min) at 50–60 pN per pixel (1 pixel = 3.1 nm).
This video corresponds to the particle of Figure 5B. White arrows indicate the line where the profiles have been obtained.
Video 3
Mechanical fatigue over DLP in TNC buffer during 17 frames (~45 min) at 60–70 pN per pixel (1 pixel = 2.0 nm).
This video corresponds to the particle of Figure 5C. White arrows indicate the line where the profiles have been obtained.
Video 4
Mechanical fatigue over SLP in TNC buffer during seven frames (~18 min) at 60–70 pN per pixel (1 pixel = 2.3 nm).
This video corresponds to the particle of Figure 5D. White arrows indicate the line where the profiles have been obtained.
Video 5
Mechanical fatigue over TLP in TNC buffer during 81 frames (~180 min) at 60–100 pN per pixel (1 pixel = 2.7 nm).
This video corresponds to the particle of Figure 5—figure supplement 1.
Video 6
Mechanical fatigue over TLP in TNC buffer during 72 frames (~155 min) at 100–120 pN per pixel (1 pixel = 1.3 nm).
Two moderate nanoindentations of ~ 40 nm were performed at frames 24 and 66, respectively. This video corresponds to the particle of Figure 6.
Tables
Key resources table
| Reagent type (species)or resource | Designation | Source or reference | Identifiers | Additional information |
|---|---|---|---|---|
| Cell line (Chlorocebus aethiops) | MA104 | ECACC Cat# 85102918 | RRID:CVCL_3845 | |
| Biological sample (Rotavirus A) | SA11-C4111 | PMID: 11913378 | GenBank:KJ450831; KJ450832;KJ450833; KJ450834;KJ450835; KJ450836;KJ450837; KJ450838;KJ450839; KJ450840;KJ450841 | |
| Software, algorithm | Xmipp | PMID: 15477099 | http://xmipp.cnb.csic.es/twiki/bin/view/Xmipp/WebHome | |
| Software, algorithm | RELION | PMID: 23000701 | RRID:SCR_016274 | https://www2.mrc-lmb.cam.ac.uk/relion/index.php?title=Main_Page |
| Software, algorithm | COMSOL Multiphysics 4.3 | Comsol, Stockholm, Sweden | RRID:SCR_014767 | |
| Software, algorithm | CTFFIND3 | PMID: 12781660 | http://grigoriefflab.janelia.org/ctf | |
| Software, algorithm | Delphi | PMID: 11913378 | http://honig.c2b2.columbia.edu/delphi/ | |
| Software, algorithm | UCSF Chimera | PMID: 24873828 | RRID:SCR_004097 | https://www.cgl.ucsf.edu/chimera/ |
Additional files
-
Transparent reporting form
- https://doi.org/10.7554/eLife.37295.033
Download links
A two-part list of links to download the article, or parts of the article, in various formats.
Downloads (link to download the article as PDF)
Open citations (links to open the citations from this article in various online reference manager services)
Cite this article (links to download the citations from this article in formats compatible with various reference manager tools)
Biophysical properties of single rotavirus particles account for the functions of protein shells in a multilayered virus
eLife 7:e37295.
https://doi.org/10.7554/eLife.37295


