Gating mechanisms during actin filament elongation by formins
- The University of Chicago, United States
- University of Minnesota, United States
- Yale University, United States
Figures
Figure 1
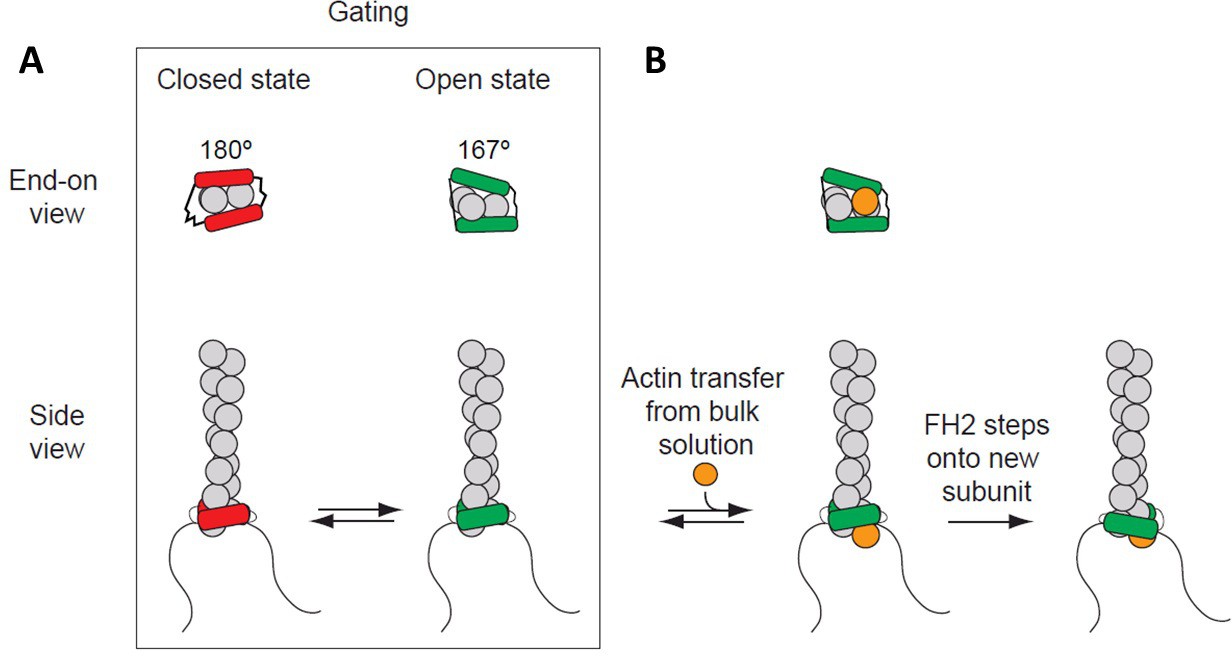
Processive association of formin with the barbed end of a growing filament.
(A) End-on and side views of formin FH1FH2 domains interacting with the barbed end of an actin filament (gray) in closed (FH2 domain in red color) and open (FH2 domain in green color) states. The black curved lines represent FH1 domains. (B) The addition of an actin subunit (orange) from the bulk solution to the filament end, and stepping of an FH2 domain (green) onto the newly added actin subunit.
Figure 2
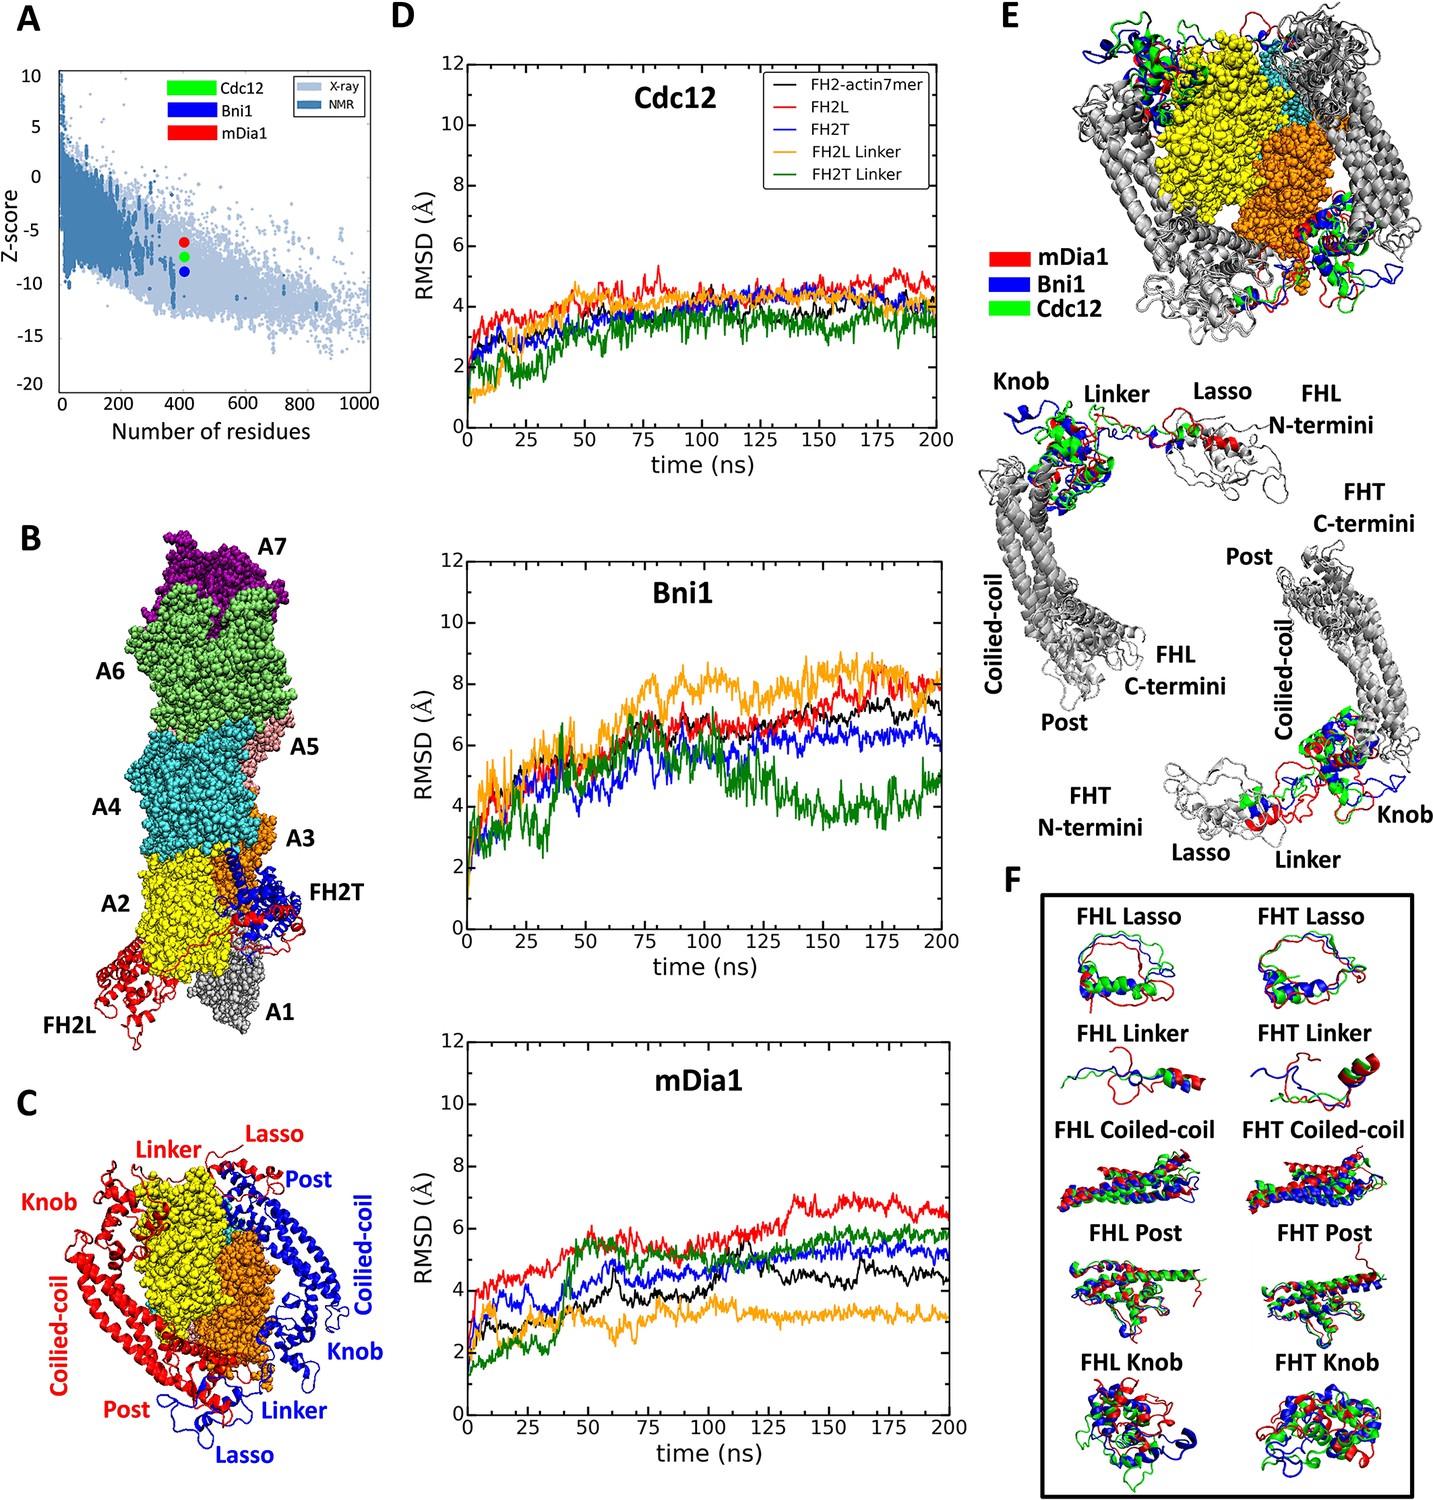
Homology models of FH2 domains on the barbed end of actin filaments.
(A) Overall quality of the homology models of Cdc12, Bni1 and mDia1 FH2 domains after 200 ns of MD simulations. The graph compares the z-scores of the three homology models with the z-scores of all experimentally determined native proteins from Protein Data Bank. (B, C) Ribbon diagrams of a dimer of Cdc12 FH2 domains interacting with the barbed end of a space-filling model of an actin filament seven-mer in the state before the formin steps onto the newly added actin subunit A1 on the barbed end. The actin subunits are numbered from A1 to A7, starting from the barbed end. (B) Side view. (C) View from the barbed end without subunit A1 and with labels on the regions of FH2 domains. (D) The root mean square deviations (RMSD) of C-alpha atoms over time during the all-atom MD simulations of dimers of FH2 domains of Cdc12, Bni1 and mDia1 on an actin seven-mer. The first 160 ns of the trajectory for Bni1 is from Baker et al. (2015). The trajectories of the whole complex, FH2 domains and linkers are displayed in different colors. (E, F) Structural alignment of ribbon diagrams taken at the end of 200 ns all-atom simulations of the FH2 domains of Bni1, Cdc12 and mDia1 associated with the actin filament seven-mer. Structural features are labeled. (E) Views from the barbed end with actin subunits A2 and A3 in the upper panel. The FHL and FHT domains are shown separately by aligning the coiled-coil regions in the lower panel. Superimposed features are shown in gray and features that differ between the three formins are color-coded. The actin filaments are not aligned and only shown to guide the location of formins. (F) The superimposed ribbon diagrams of the separate parts of the FH2 domains of the three formins.
-
Figure 2—source data 1
Cdc12 FH2 interacting with a seven-mer filament.
PDB file of the structure of Cdc12 FH2 domain interacting with an actin filament composed of seven actin subunits, obtained at 500 ns of the all-atom MD simulation.
- https://doi.org/10.7554/eLife.37342.004
-
Figure 2—source data 2
Bni1 FH2 interacting with a seven-mer filament.
PDB file of the structure of Bni1 FH2 domain interacting with an actin filament composed of seven actin subunits, obtained at 500 ns of the all-atom MD simulation.
- https://doi.org/10.7554/eLife.37342.005
-
Figure 2—source data 3
mDia1 FH2 interacting with a seven-mer filament.
PDB file of the structure of mDia1 FH2 domain interacting with an actin filament composed of seven actin subunits, obtained at 500 ns of the all-atom MD simulation.
- https://doi.org/10.7554/eLife.37342.006
-
Figure 2—source data 4
Cdc12 FH2 interacting with a five-mer filament.
PDB file of the structure of Cdc12 FH2 domain interacting with an actin filament composed of five actin subunits, obtained at 350 ns of the all-atom MD simulation.
- https://doi.org/10.7554/eLife.37342.007
-
Figure 2—source data 5
Bni1 FH2 interacting with a five-mer filament.
PDB file of the structure of Bni1 FH2 domain interacting with an actin filament composed of five actin subunits, obtained at 350 ns of the all-atom MD simulation.
- https://doi.org/10.7554/eLife.37342.008
-
Figure 2—source data 6
mDia1 FH2 interacting with a five-mer filament.
PDB file of the structure of mDia1 FH2 domain interacting with an actin filament composed of five actin subunits, obtained at 350 ns of the all-atom MD simulation.
- https://doi.org/10.7554/eLife.37342.009
Figure 3

Steric clashes of FH2 dimers with incoming actin subunits during all-atom simulations of seven-mer and five-mer filaments.
(A–C) FH2 dimers on seven-mer filaments including actin A1. (A) Time course of volume fractions of actin subunit (+A1) occupied by FHL during 500 ns simulations. Measurements start at 0 ns for Cdc12 and mDia1, and at 160 ns for Bni1. (B, C) Ribbon diagrams of Cdc12, Bni1 and mDia1 FH2 domains interacting with the barbed end of a space-filling model of an actin filament at the beginning (left) and at the 200 ns (middle) MD simulations. In the models on the right, red actin subunit +A1 was added at the end of the simulations. (B) Side views. (C) Views from the barbed end. (D, E) FH2 dimers on five-mer filaments without actin subunits A1 and A7. Time courses of volume fractions of incoming actin subunit (A1) occupied by FHT during (D) 350 ns simulations for the first replicas and (E) 200 ns simulations for the second replicas. The initial structures were generated by removing subunits A1 and A7 at the end of 200 ns all-atom simulations of seven-mer filaments from (A–C). FH2 dimers on a five-mer filament without actins A1 and A7 is shown in the inset.
Figure 4 with 1 supplement

Effect of FH2 domains on the barbed end configurations of actin seven-mer filaments.
The panels show helical twist angles between subunits at the barbed ends of actin filaments associated with three different formin FH2 dimers during all-atom MD simulations. (A–C) The angles between the actin subunits (A1–A2 and A2–A3) as a function of time. The measurements start after initial equilibrations (Figure 2) at 100 ns for Cdc12 and mDia1 or at 160 ns for Bni1. (D–G) Comparison of the distributions of angles between actin subunits A1-A2 and A2-A3 during two different time intervals. (D, F) t = 100–150 ns for Cdc12 and mDia1, and t = 160–210 ns for Bni1. (E, G) t = 450–500 ns for all systems.
-
Figure 4—source data 1
Twist angles between actin subunits as a function of time.
Helical twist angles between subunits of seven-mer filaments (A1–A2, A2–A3, A3–A4, A4–A5 and A5–A6) associated with three different formin FH2 dimers during all-atom MD simulations. The angles are outputted at every 40 ps during the time intervals given in Figure 4.
- https://doi.org/10.7554/eLife.37342.013
Figure 4—figure supplement 1
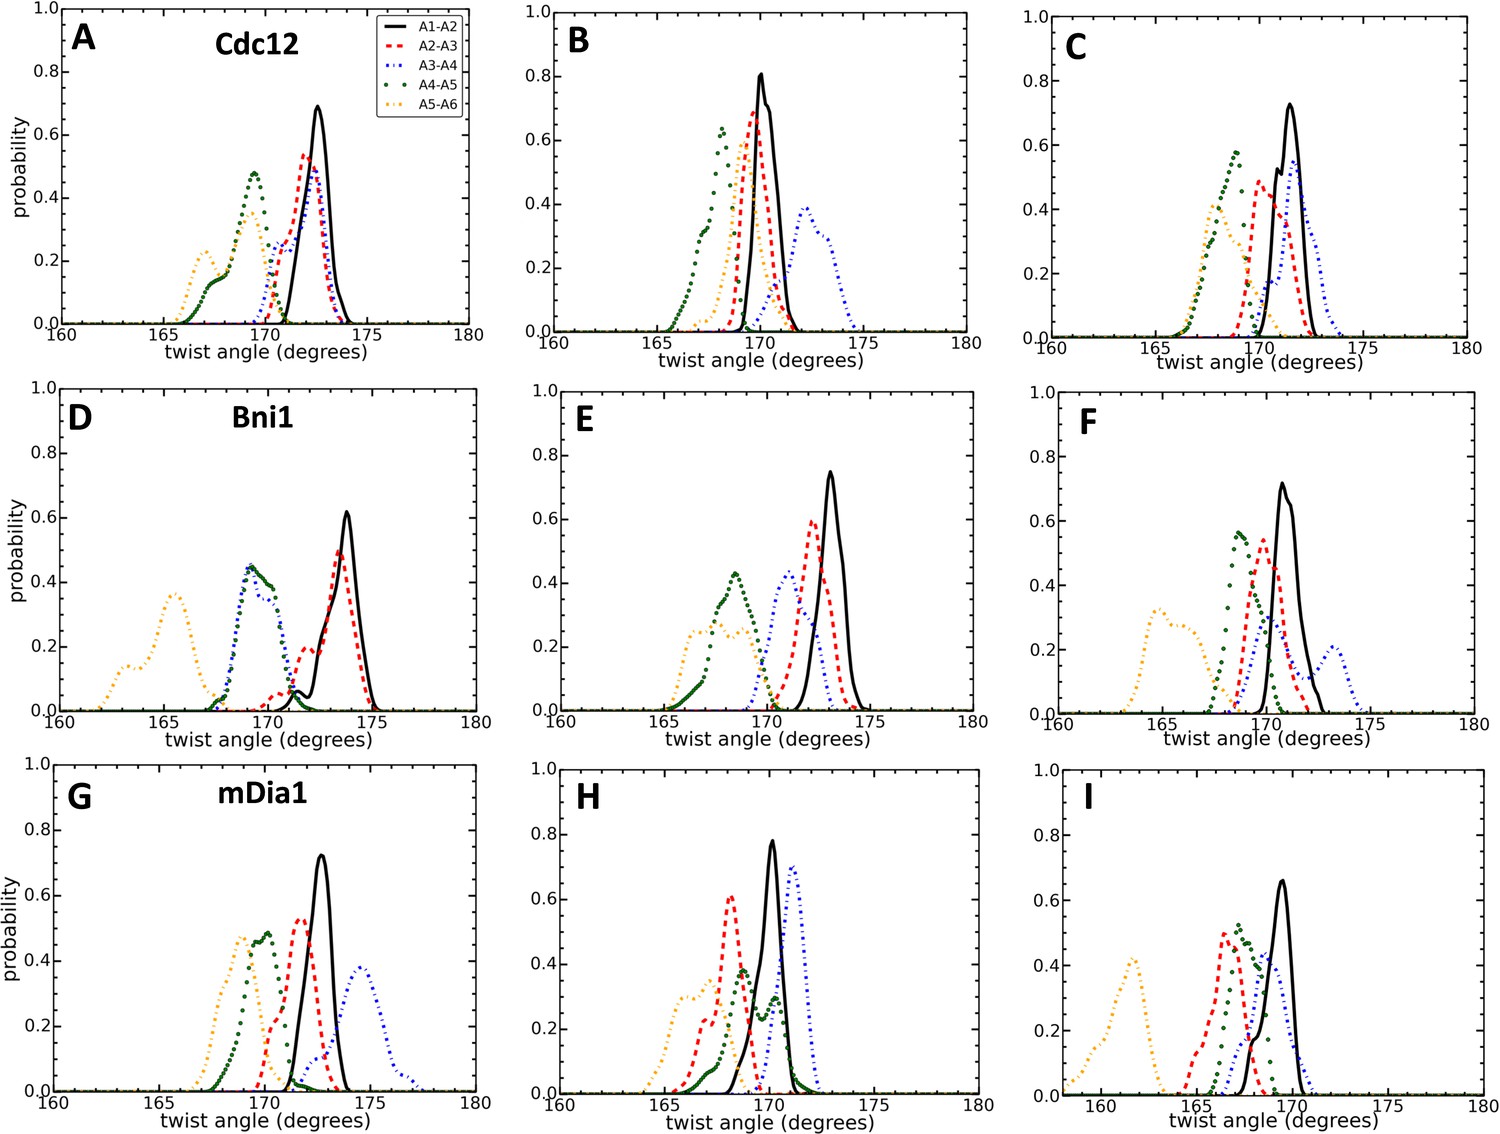
Effect of FH2 domains on the configurations of actin seven-mer filaments.
Comparison of the distributions of angles between the actin pair of subunits during three different time intervals. (A,D,G) t = 100–120 ns for Cdc12 and mDia1, and t = 160–180 ns for Bni1. (B,E,H) t = 280–300 ns for all systems. (C,F,I) t = 480–500 ns for all systems.
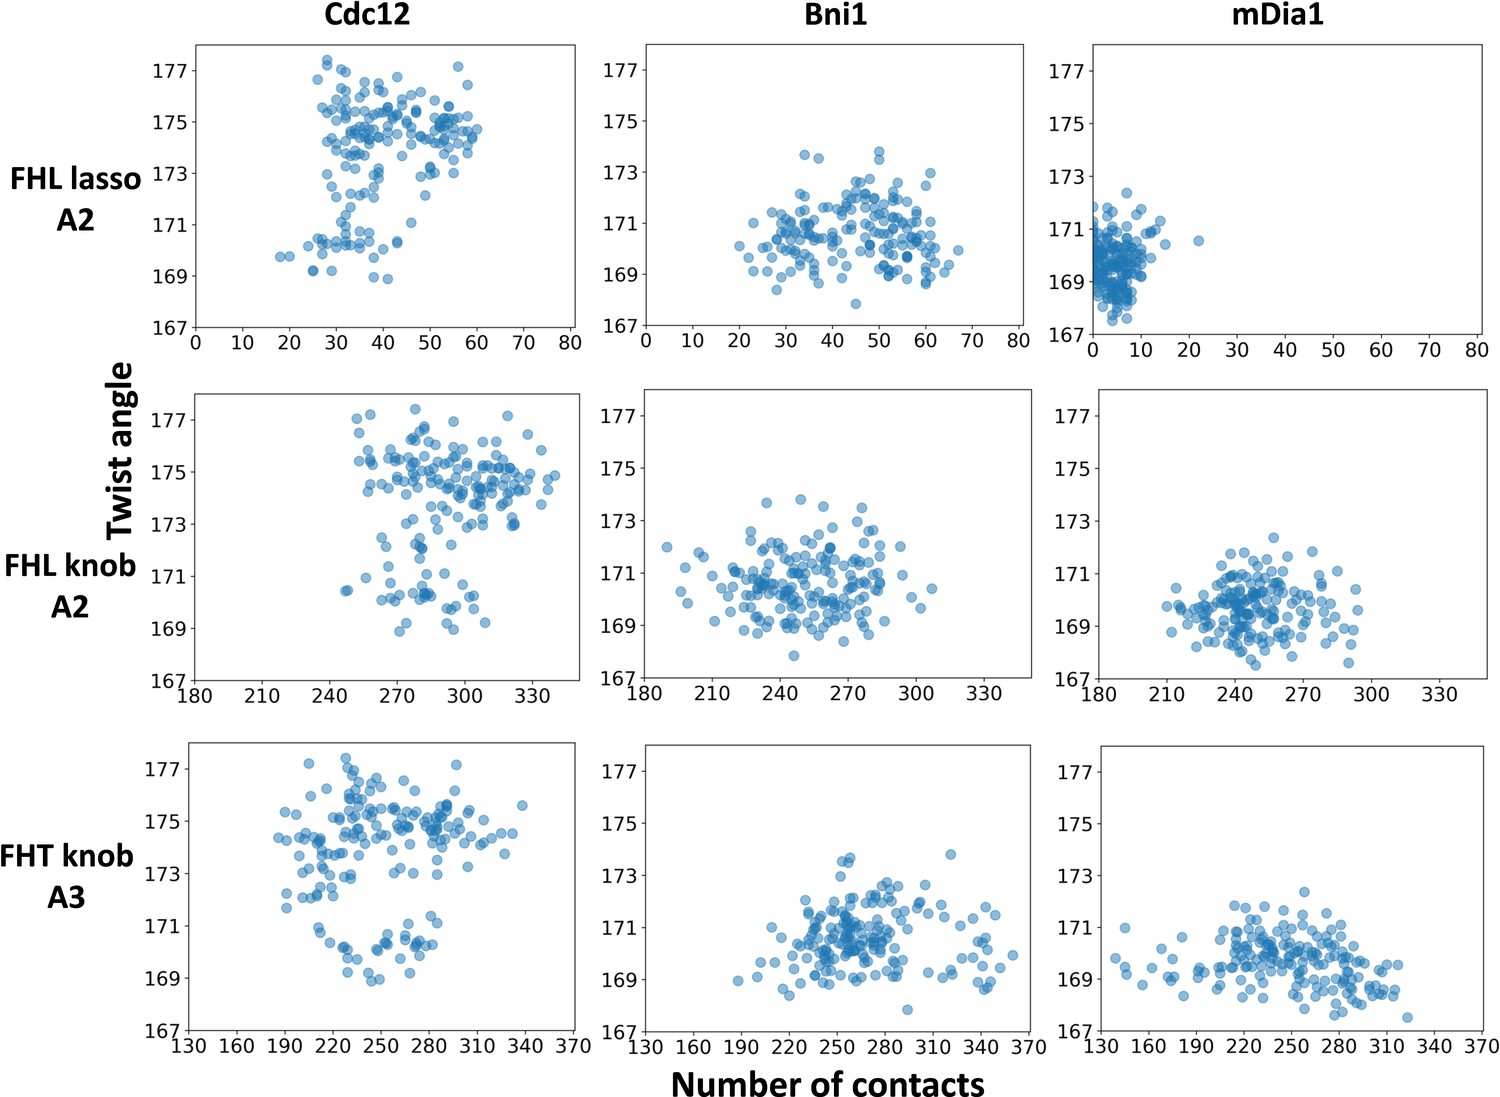
Figure 5 with 2 supplements
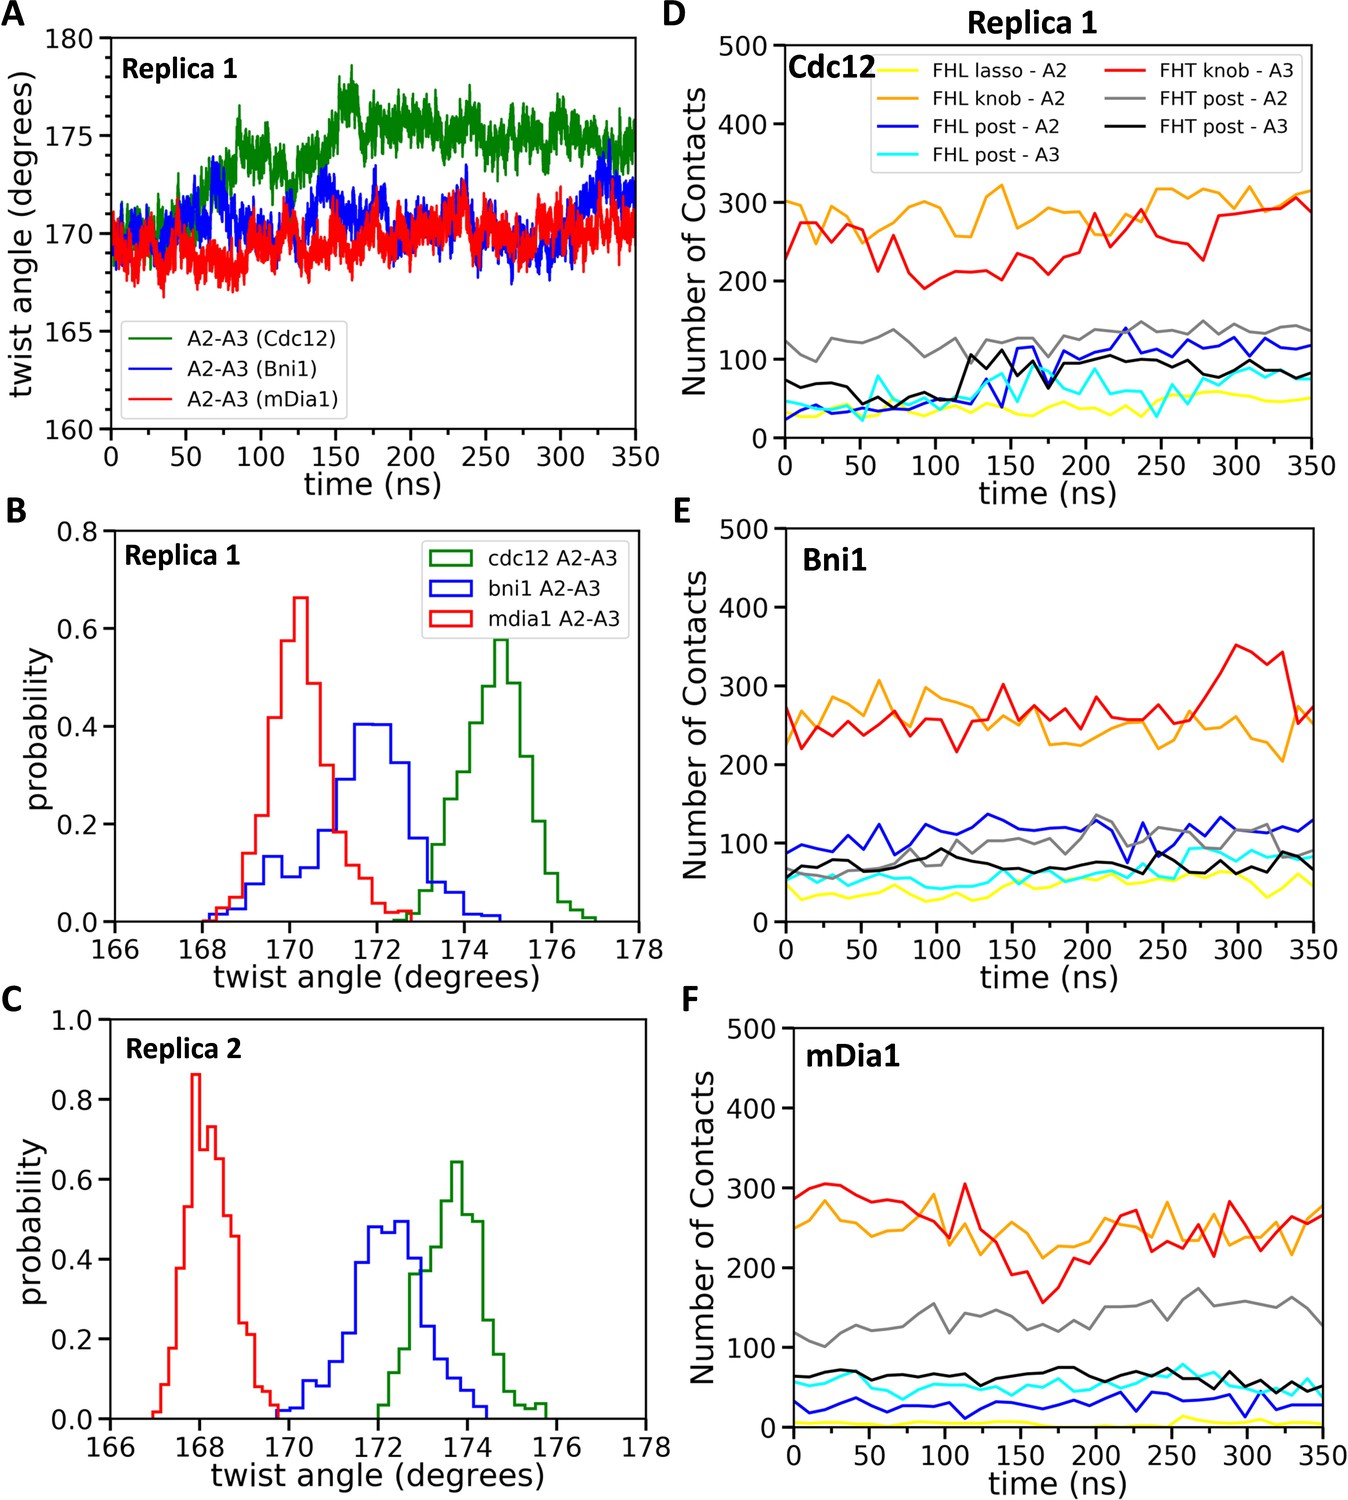
Effect of FH2 domains on the barbed end configurations of actin five-mer filaments before the addition of actin subunit A1.
(A) The helical twist angles between actin subunits A2 and A3 as a function of time during 350 ns of all-atom MD simulations (replica 1) of the FH2 domains of Bni1, Cdc12 and mDia1 associated with the actin filament five-mer consisting of subunits A2, A3, A4, A5 and A6. The initial structures in these simulations were generated by removing subunits A1 and A7 at the end of 200 ns all-atom simulations of the FH2 domains of Bni1, Cdc12 and mDia1 associated with the actin filament seven-mer. (B, C) Comparison of the distributions of angles between actin subunits A2 and A3 during the last time intervals of two independent simulations (replica 1 and replica 2). (B) The last 50 ns of the 350 ns simulations. (C) The last 20 ns of the 200 ns simulations. (D–F) The number of contacts between the lasso, knob and post regions of the FH2 domains and actin subunits A2 and A3 as a function of time during 350 ns of the all-atom MD simulations (replica 1).
-
Figure 5—source data 1
Twist angles between actin subunits as a function of time.
Helical twist angles between subunits of five-mer filaments (A2–A3, A3–A4 and A4–A5) associated with three different formin FH2 dimers during all-atom MD of two independent simulations (replica 1 and replica 2). The angles are outputted at every 20 ps during the time intervals given in Figure 5.
- https://doi.org/10.7554/eLife.37342.017
Figure 5—figure supplement 1

The interactions of FH2 domains (post regions) with an actin filament and the barbed end configuration.
The correlations for the number of contacts between the post regions of the FH2 domains and actin subunits (A2 and A3) and the distributions of twist angles of A2-A3 during 350 ns all-atom MD simulations of five-mer filaments.
Figure 5—figure supplement 2
The interactions of FH2 domains (lasso and knob regions) with an actin filament and the barbed end configuration.
The correlations for the number of contacts between the lasso and knob regions of the FH2 domains and actin subunits (A2 and A3) and the distributions of twist angles of A2-A3 during 350 ns all-atom MD simulations of five-mer filaments.
Figure 6
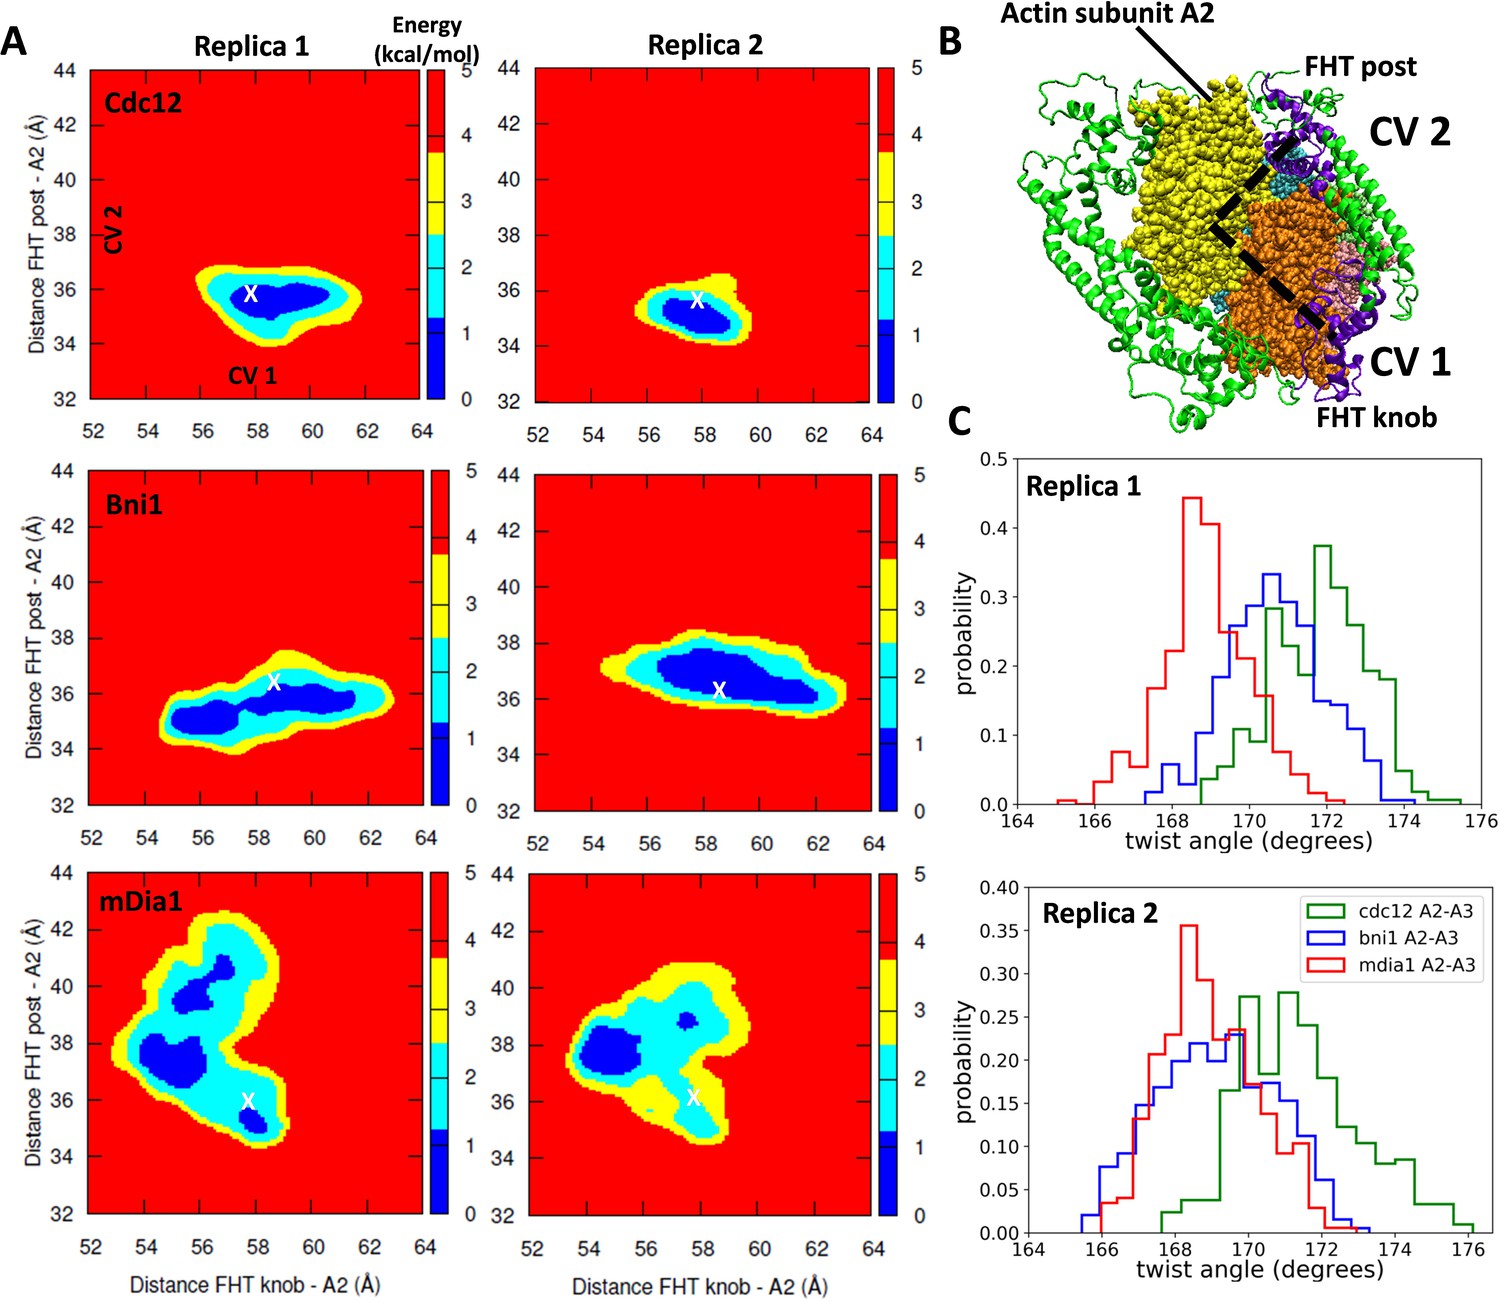
Free-energy sampling of the conformational mobility of FHT domains interacting with five-mer filaments.
(A) Two independent metabasin metadynamics (MBMetaD) simulations for each formin were carried out (run for 80 ns) to understand the conformational mobility of the FHT domain. The collective variables (CVs) defined in (B) were selected to describe the mobility of the FHT domain in the region of the incoming actin subunit A1 (shown by dashed black lines). The first CV (CV1) is the distance between the center of mass (COM) of FHT knob and the COM of actin subunit A2. CV2 is the distance between the COM of the FHT post and the COM of actin subunit A2. Initial distances from the knob and post to the COM of A2 are marked with ‘X’. If a larger area was favored to be explored, that would mean that the incoming actin monomer could be more easily accommodated into the barbed end as the rearrangement of the FHT domain requires a lower energy barrier. (B) Space-filling models of the barbed end of the filament (subunit A2 is yellow and subunit A3 is brown) and ribbon diagrams of the FH2 domains of Cdc12 (green with the knob and post of FHT in purple). (C) The distributions of angles between actin subunits A2 and A3 during two independent MBMetaD simulations.
Figure 7 with 1 supplement
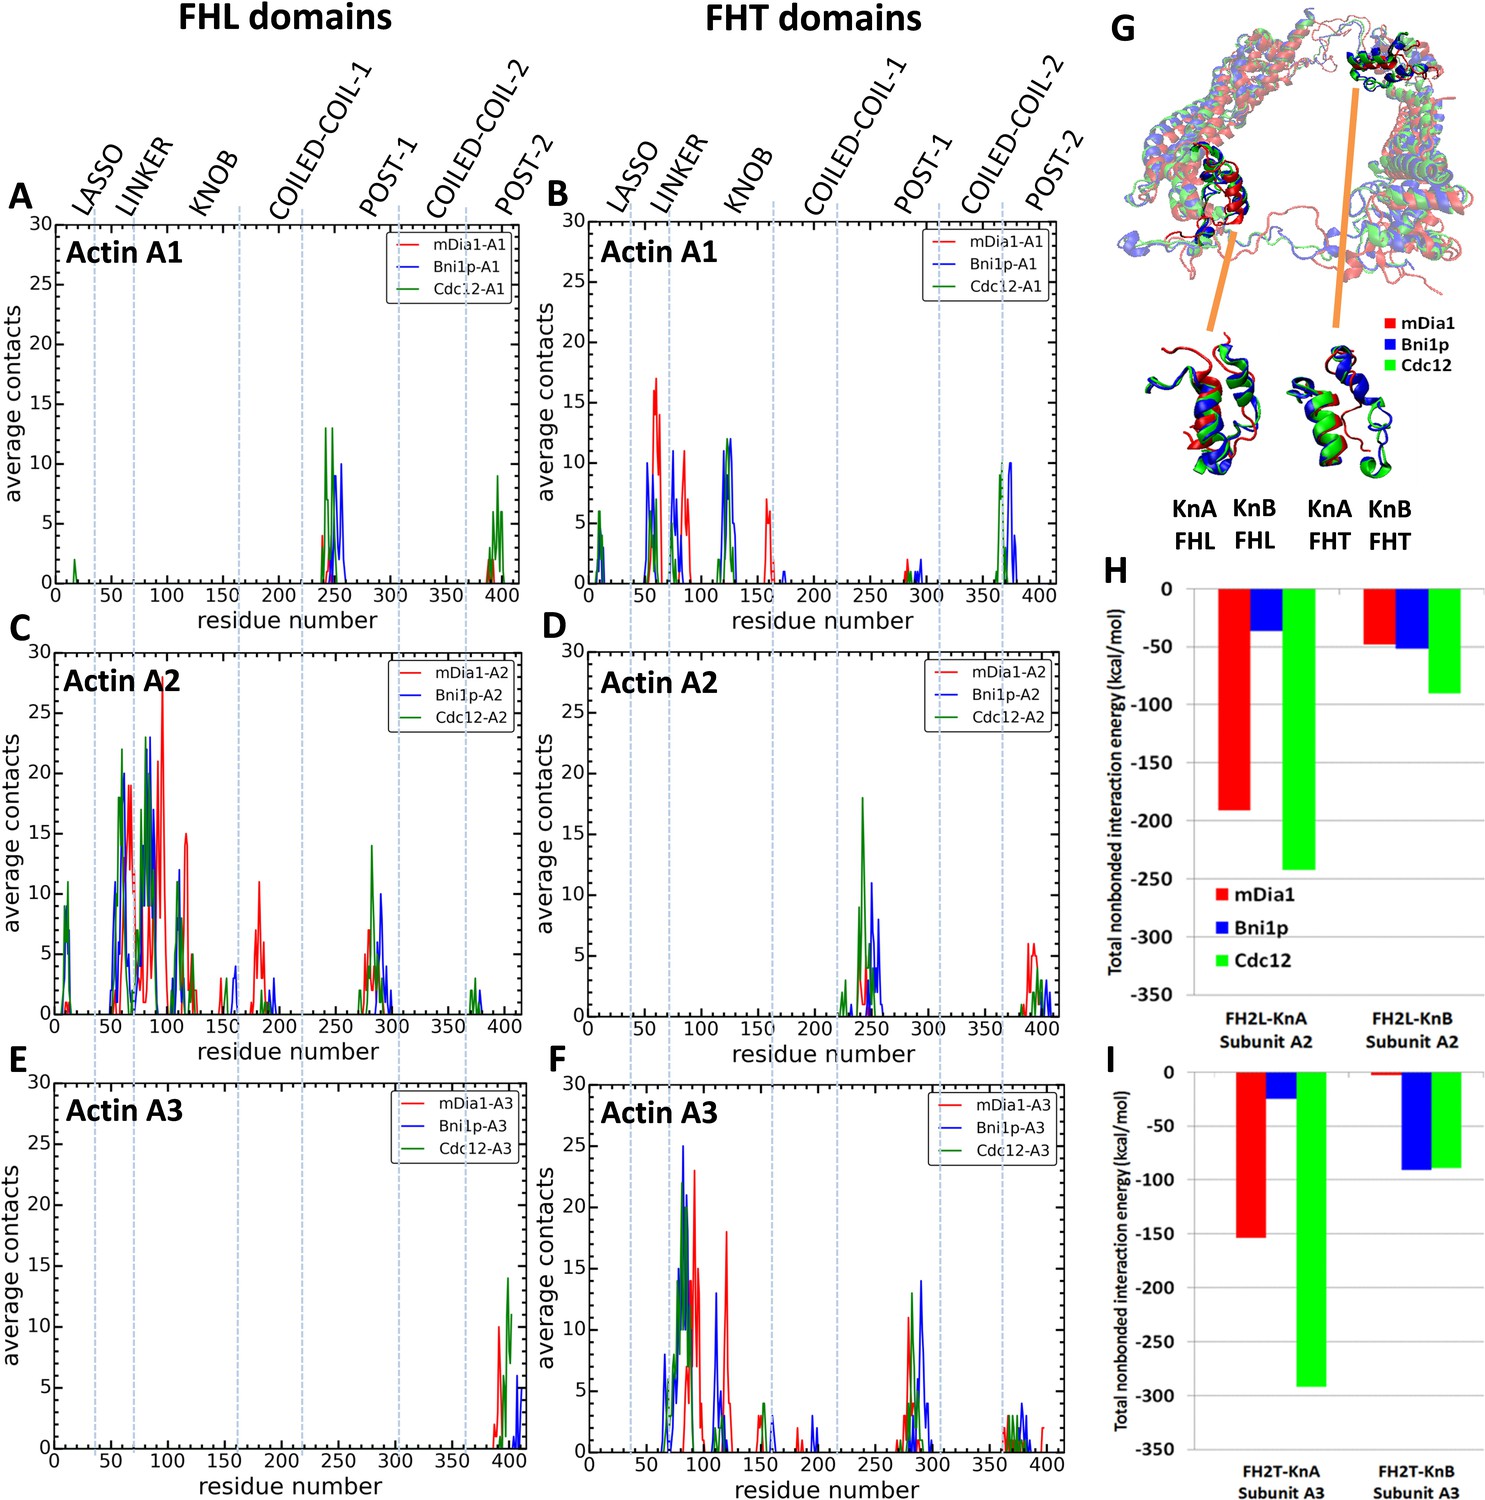
Interactions of FH2 domains with actin filament seven-mers.
The time-averaged number of contacts over the last 20 ns of the 200 ns simulations between the three actin subunits at the barbed ends of the filaments and the FH2 domains of mDia1 (red), Bni1 (blue) and Cdc12 (green). The actin subunits are numbered from 1 to 3, starting with the newly added A1 subunit. (A, B) A1 actin subunits; (C, D) A2 actin subunits; and (E, F) A3 actin subunits. (A, C, E) show the contacts of the FHL domains and (B, D, F) show the contacts of the FHT domains. A pair of residues was considered to be in contact if the distance between their C-alpha atoms was ≤12 Å. (G) View from the pointed end of the structural alignment of FH2 domains taken from the end of 200 ns all-atom simulations of Bni1, Cdc12 and mDia1 FH2 domains interacting with an actin filament seven-mer. The orange lines point to the knA and knB helices of mDia1, Cdc12 and Bni1 FH2 domains. (H, I) Total nonbonded interaction energy (sum of van der Waals and electrostatic interactions) between (H) FHL (leading) and (I) FHT (trailing) knob helices of mDia1, Bni1, Cdc12 formins and the barbed end of actin subunits A2 and A3.
Figure 7—figure supplement 1

Interactions of each region in FH2 domains with an actin filament. The number of contacts between the lasso, linker, knob and post regions of the FH2 domains and actin subunits (A1, A2 and A3) as a function of time during last 50 ns of 500 ns all-atom MD simulations.
https://doi.org/10.7554/eLife.37342.020
Figure 8
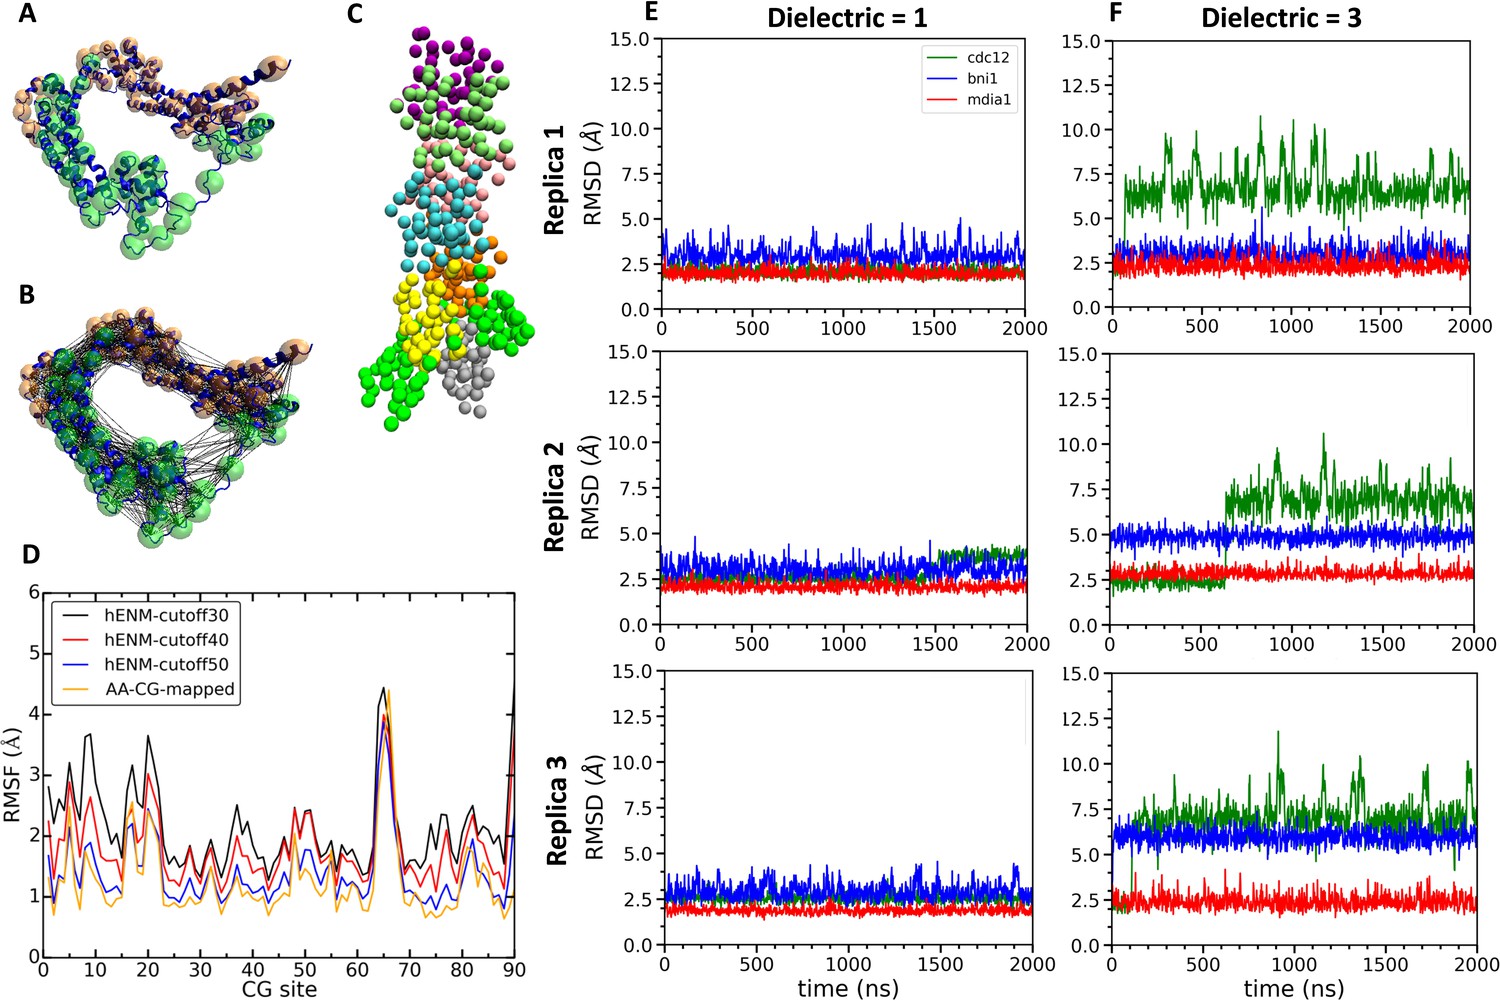
Construction and simulations of coarse-grained (CG) models of FH2 domains.
(A) Assignment of coarse-grained (CG) sites of the Cdc12 FH2 domain dimer by the EDCG method (FHL is green and FHT is orange). (B) Connection of CG sites by harmonic bonds defined by heteroENM and matched to the fluctuations observed in all-atom simulations. (C) CG model of the Cdc12 FH2 domains on a seven-mer actin filament. FH2 domains are shown in green, actin monomers are colored as follow: A1 (gray), A2 (yellow), A3 (orange), A4 (cyan), A5 (pink), A6 (lime) and A7 (purple). (D) Plot comparing root mean square fluctuations (RMSFs) of the CG sites of the Cdc12 FH2 dimer obtained from AA simulations (AA-CG mapped) with RMSFs of these sites in CG simulations using a range of cutoff distances for the harmonic springs that connect every CG site. The cutoff distance of 50 Å (blue) gives the best match with the RMSFs of AA simulations (yellow). (E, F) Time courses of the root mean squared displacements of the FH2 dimers from three independent CG simulations spanning two microseconds at low and high dielectric constant. (E) Dielectric constant is 1. (F) Dielectric constant is 3.
Figure 9
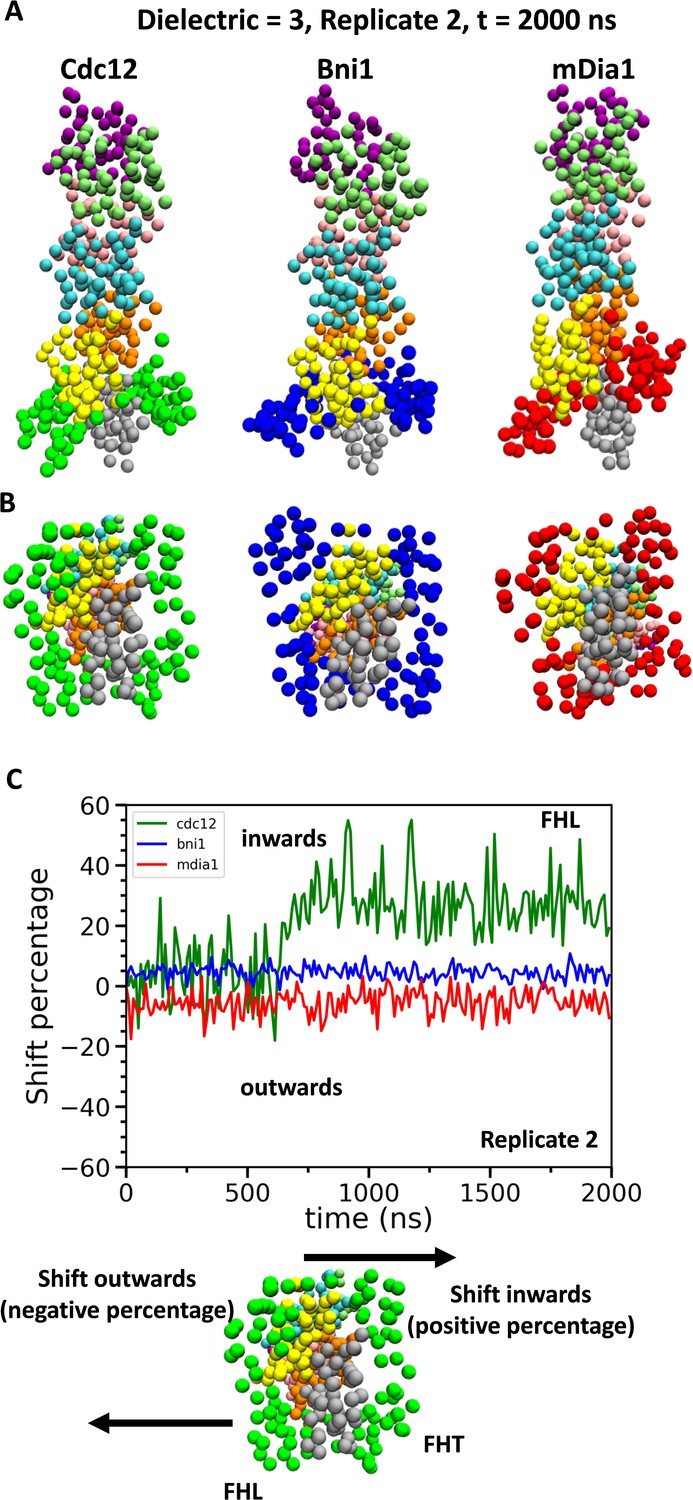
Conformational changes of FH2 domains on the barbed ends of actin filament seven-mers during coarse-grained (CG) simulations.
(A) Side and (B) bottom views of structures of Cdc12, Bni1, and mDia1 FH2 domains interacting with the barbed ends of actin filaments at the end (t = 2000 ns) of the CG simulations (dielectric constant of 3, replicate 2). (C) Time courses of the center-of-mass displacements of FHL domains from their initial positions (shown as percentage change) in the direction perpendicular to the long axis of the actin filaments. A positive percentage indicates a shift towards the actin filament (favors the ‘closed’ state), whereas a negative percentage indicates a shift away from the actin filament (favors the ‘open’ state). The shifting of a representative FHL domain in two different directions is schematically shown at the bottom.
Tables
Table 1
Stability of salt bridges between formin FH2 domains and actin subunits.
Stability was measured as the percent of the time that a salt bridge formed between knob helices of the three FH2 domains and actin barbed end grooves of actin subunits A2 or A3 during (A) the last 20 ns of AA simulations spanning 200 ns of seven-mer filaments, (B) the last 50 ns of the simulations spanning 500 ns of seven-mer filaments and (C) the last 50 ns of the simulations spanning 350 ns of five-mer filaments.
| Cdc12 knob helices/Actin barbed end groove | ||||||
|---|---|---|---|---|---|---|
| FH2 residue | FH2 domain | Actin residue | Actin subunit | (A) Percent formed | (B) Percent formed | (C) Percent formed |
| K1068 | FHL | D25 | A2 | 78.2 | 76.9 | 86.5 |
| E1090 | FHL | R147 | A2 | - | 63.1 | 13.1 |
| E1093 | FHL | R147 | A2 | 99.4 | - | - |
| K1099 | FHL | E167 | A2 | - | - | 41.2 |
| K1105 | FHL | E167 | A2 | - | 52.6 | 77.1 |
| K1107 | FHL | E167 | A2 | 41.5 | - | - |
| K1068 | FHT | D25 | A3 | 95.2 | 70.7 | 82.4 |
| K1072 | FHT | D25 | A3 | 64.3 | 71.4 | 85.3 |
| K1072 | FHT | D24 | A3 | - | 15.6 | 12.8 |
| E1093 | FHT | R147 | A3 | 94.8 | 97.3 | 99.8 |
| K1099 | FHT | E167 | A3 | - | 47.2 | 18.1 |
| Bni1 knob helices/Actin barbed end groove | ||||||
| E1463 | FHL | R147 | A2 | 83.6 | 89.5 | 88.6 |
| R1423 | FHL | E167 | A2 | 0.401 | 0.541 | - |
| E1463 | FHT | R147 | A3 | 90.0 | 88.5 | 93.8 |
| K1467 | FHT | E167 | A3 | 97.4 | 95.7 | - |
| mDia1 knob helices/Actin barbed end groove | ||||||
| R851 | FHL | D25 | A2 | 97.8 | 93.5 | - |
| E871 | FHL | R147 | A2 | 8.42 | 18.8 | - |
| K879 | FHL | E167 | A2 | 25.3 | 3.69 | - |
| K838 | FHT | E167 | A3 | 98.6 | 98.6 | 25.7 |
Table 2
Salt bridges between formin FH2 domains and actin subunits.
Percentage of the time that salt bridges formed between the lasso and linker regions of Cdc12, Bni1 and mDia1 FH2 domains and actin subunits during the last 20 ns of AA simulations spanning 200 ns of seven-mer filaments.
| FH2 residue | FH2 domain | Actin residue | Actin subunit | % Formed |
|---|---|---|---|---|
| Cdc12/actin | ||||
| R990 | FHL-lasso | D363 | A2 | 100. |
| K992 | FHT-lasso | E125 | A1 | 99.6 |
| K1038 | FHL-linker | E99 | A2 | 71.5 |
| K1041 | FHL-linker | E100 | A2 | 52.5 |
| K1045 | FHL-linker | E2 | A2 | 72.3 |
| K1045 | FHL-linker | D3 | A2 | 93.2 |
| K1046 | FHL-linker | E4 | A2 | 50.3 |
| K1038 | FHT-linker | D363 | A1 | 20.6 |
| Bni1/actin | ||||
| K1357 | FHL-lasso | D363 | A2 | 85.2 |
| K1357 | FHT-lasso | D363 | A1 | 23.0 |
| K1359 | FHT-lasso | E125 | A1 | 99.2 |
| R1402 | FHL-linker | E99 | A2 | 99.4 |
| E1403 | FHL-linker | K359 | A2 | 95.0 |
| K1410 | FHL-linker | E4 | A2 | 24.0 |
| K1410 | FHL-linker | E100 | A2 | 81.8 |
| K1412 | FHL-linker | D3 | A2 | 57.5 |
| R1402 | FHT-linker | D363 | A1 | 98.4 |
| mDia1/actin | ||||
| R764 | FHL-lasso | D363 | A2 | 23.4 |
| K807 | FHL-linker | E125 | A2 | 49.9 |
| K813 | FHL-linker | E4 | A2 | 37.9 |
| K813 | FHL-linker | E99 | A2 | 20.4 |
| K826 | FHL-linker | D3 | A2 | 70.9 |
| K826 | FHL-linker | E2 | A2 | 43.3 |
| K827 | FHL-linker | E2 | A2 | 13.2 |
| K828 | FHL-linker | E2 | A2 | 11.4 |
| K807 | FHT-linker | E125 | A1 | 23.0 |
| K810 | FHT-linker | E83 | A1 | 43.7 |
| K810 | FHT-linker | E125 | A1 | 46.7 |
| K813 | FHT-linker | D51 | A1 | 99.0 |
| E816 | FHT-linker | R37 | A1 | 96.8 |
| K828 | FHT-linker | E2 | A3 | 25.1 |
Additional files
-
Supplementary file 1
Definitions of features of Cdc12, Bni1 and mDia1 FH2 domains.
The columns show feature name and residues comprising corresponding feature.
- https://doi.org/10.7554/eLife.37342.025
-
Supplementary file 2
Template modeling scores (TM-scores) of the FH2 domain homology models based on different templates.
TM-score is used to determine the similarity of protein structures. Based on statistics, TM-score between 0.0 and 0.17 indicates random structural similarity and TM-score between 0.5 and 1.00 indicates having about the same fold [43]. TM-scores were obtained through this website: https://zhanglab.ccmb.med.umich.edu/TM-align/
- https://doi.org/10.7554/eLife.37342.026
-
Supplementary file 3
Correlations between interactions of FH2 domain with an actin filament and the barbed end configuration.
Pearson correlation coefficients for the number of contacts between the lasso, knob and post regions of the FH2 domains and actin subunits (A2 and A3) and the distributions of twist angles of A2-A3 (given in Figure 5—figure supplement 2 and Figure 5—figure supplement 1) during 350 ns all-atom MD simulations of five-mer filaments.
- https://doi.org/10.7554/eLife.37342.027
-
Supplementary file 4
Average interactions of different FH2 regions with an actin filament.
The average number of contacts (with standard deviations and t-statistics) between the lasso, knob and post regions of the FH2 domains and actin subunits (A2 and A3) from 350 ns of the all-atom MD simulations of five-mer filaments.
- https://doi.org/10.7554/eLife.37342.028
-
Transparent reporting form
- https://doi.org/10.7554/eLife.37342.029
Download links
A two-part list of links to download the article, or parts of the article, in various formats.
Downloads (link to download the article as PDF)
Open citations (links to open the citations from this article in various online reference manager services)
Cite this article (links to download the citations from this article in formats compatible with various reference manager tools)
Gating mechanisms during actin filament elongation by formins
eLife 7:e37342.
https://doi.org/10.7554/eLife.37342


