Manipulating midbrain dopamine neurons and reward-related behaviors with light-controllable nicotinic acetylcholine receptors
- Sorbonne Université, INSERM, CNRS, France
- Institut Pasteur, France
- New York University, United States
- University of California Berkeley, United States
Figures
Figure 1
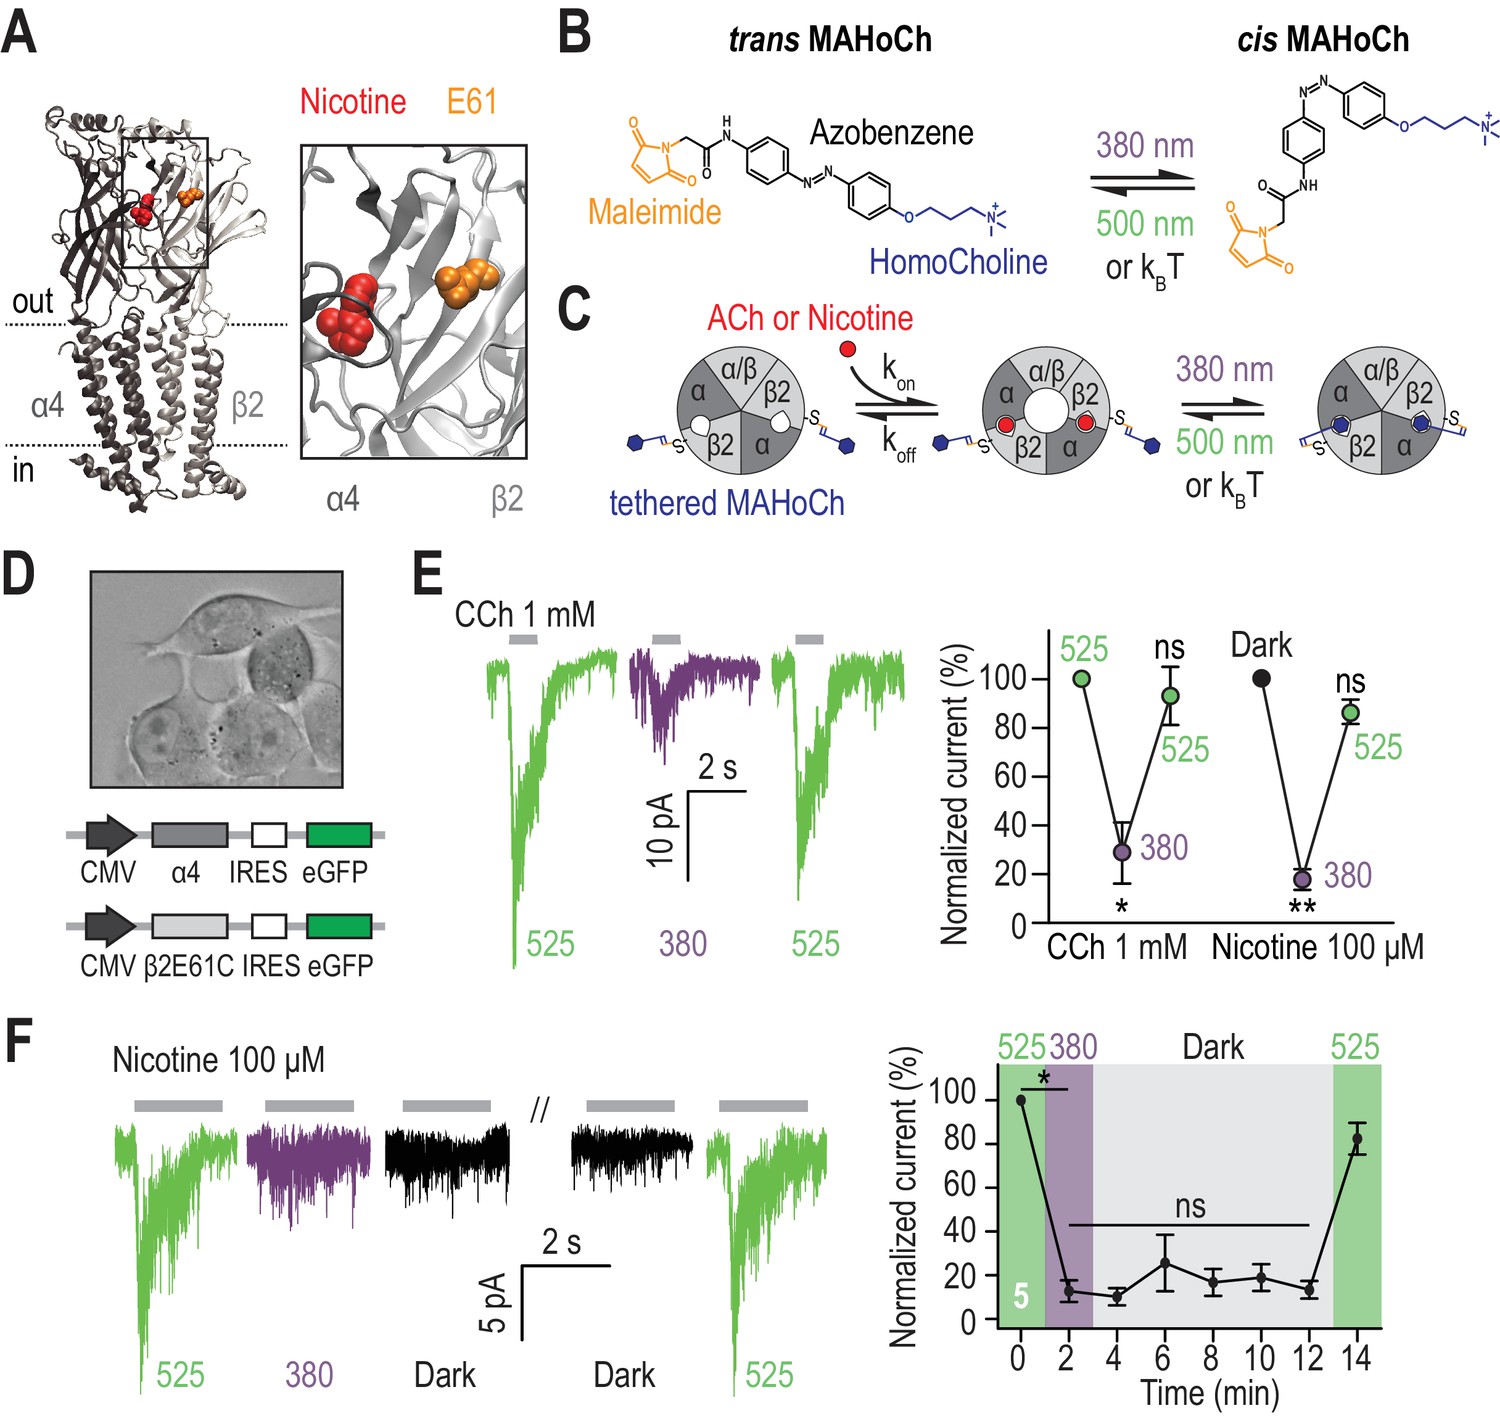
Design and characterization of β2LinAChR.
(A) Crystal structure of the α4β2 nAChR (PDB ID 5KXI) (Morales-Perez et al., 2016) viewed parallel from the plasma membrane. The α4 subunit is in dark grey and the β2 subunit in light grey. The agonist binding sites are located in the extracellular binding domain, at the interface between the α and β subunits. Nicotine (red) and the amino acid E61 (orange) which has been mutated to cysteine in the β2LinAChR are represented as spheres. For clarity, only one αβ dimer is shown, and an extended view is shown on the right. (B) Chemical structure of trans and cis MAHoCh. The thiol-reactive group maleimide is shown in orange, the azobenzene photo-sensitive moiety in black, and the competitive antagonist homocholine in blue. In darkness, the azobenzene group adopts the thermally stable, extended trans configuration. Illumination with near-UV (380 nm) light photo-isomerizes the azobenzene core to the twisted, cis configuration. The cis isomer reverses to trans either slowly in dark conditions (kBT) or rapidly under green light (500 nm). Cis-trans photo-isomerization hence results in drastic changes in the geometry and end-to-end distance of MAHoCh. (C) Cartoon representation of β2LinAChR. MAHoCh is tethered to β2E61C, and the receptor still functions in the dark. Isomerizing the photoswitch back and forth between its cis and trans forms with two different wavelengths of light enables reversible photocontrol of the receptor: activatable under green light and antagonized under purple light. (D) Heterologous co-expression of α4 and β2E61C nAChR subunits in Neuro-2a cells. (E) Reversible photocontrol of α4β2LinAChR in Neuro-2a cells. Currents were recorded in whole-cell voltage-clamp mode at a potential of −60 mV and elicited by an application of CCh (1 mM, 1 s, n = 4) or nicotine (100 μM, 2 s, n = 5). Currents were strongly inhibited under 380 nm light (71.3 ± 12.5%, p=0.038 for CCh and 82.1 ± 4.2%, p=0.0082 for nicotine) and fully restored under 525 nm light (p=0.285 for CCh and 0.125 for nicotine). (F) Thermal stability of LinAChR photo-inhibition. After inhibition with 380 nm light, the amplitude of the current remained constant for at least 10 min in darkness (p=1 at t = 12 min), and was restored upon illumination with 525 nm light. All values represent mean ± SEM.
-
Figure 1—source data 1
Source data for Figure 1E,F.
- https://doi.org/10.7554/eLife.37487.004
Figure 2 with 2 supplements
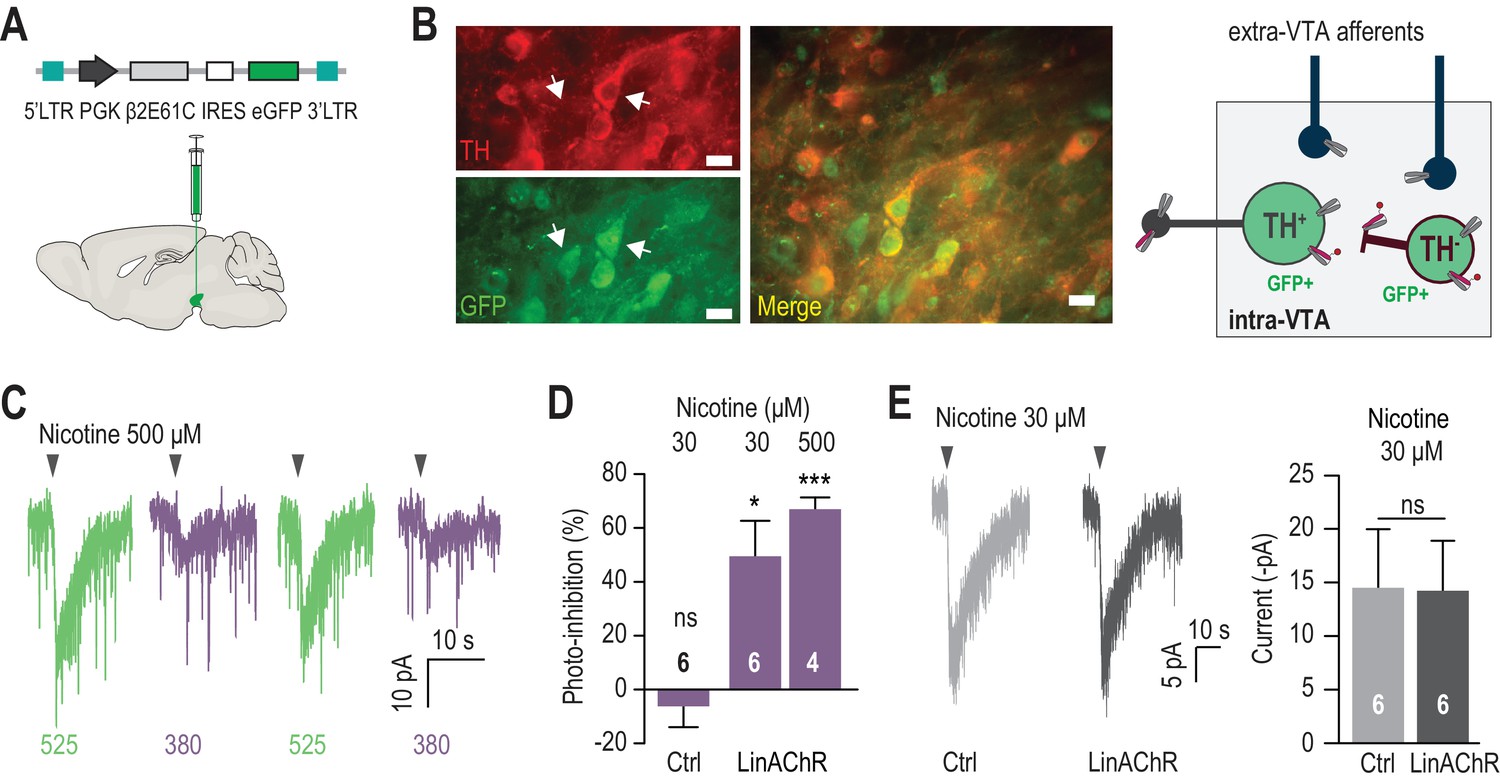
Reversible photo-inhibition of nAChR currents.
(A) Viral transduction of the VTA using a lentivirus encoding pGK-β2E61C-IRES-eGFP. (B) Left, immunocytochemical identification of virally-transduced neurons (GFP-positive) 4 weeks after viral injection. DA neurons are labelled using anti-tyrosine hydroxylase (TH) antibodies. Note that the virus non-selectively transduces TH+ and TH- neurons (arrows). Scale bar 10 μm. Right, scheme illustrating LinAChR expression profile. The β2E61C subunit (red) is incorporated into nAChRs on the soma, dendrites and axon terminals of TH+ and TH- VTA neurons, but excluded from extra-VTA afferents. Local infusion of MAHoCh (red arm) into the VTA labels and photosensitizes solely intra-VTA receptors, and not receptors on DA terminals. (C) Representative photo-inhibition of nicotine-induced currents (500 μM, local puff 500 ms) recorded at −60 mV from a GFP-positive DA neuron labeled with MAHoCh (70 μM, 20 min) in an acute brain slice. (D) Average percent photo-inhibition of nicotinic currents (1-(I380/I525)) evoked using a local puff (500 ms) of 30 μM (49.5 ± 13.2%, p=0.013, one sample t-test) or 500 μM nicotine (67.0 ± 4.3%, p=0.0006), recorded as in (C) from MAHoCh-treated GFP-positive DA neurons (n = 6 and 4 for nicotine 30 and 500 μM, respectively). Control neurons (MAHoCh alone, 30 μM nicotine, Ctrl) show no photo-inhibition (−6.3 ± 7.7%, p=0.453, n = 6). (E) Left: Representative currents induced by nicotine (30 μM) in a control neuron (Ctrl, grey) and a β2E61C-transduced neuron (LinAChR, black). Right: Control (n = 6) and transduced (n = 6) neurons display nicotine-induced currents of same amplitude (−14.5 ± 5.5 and −14.2 ± 4.7 pA, respectively, p=0.97). All values represent mean ± SEM.
-
Figure 2—source data 1
Source data for Figure 2D,E.
- https://doi.org/10.7554/eLife.37487.008
Figure 2—figure supplement 1
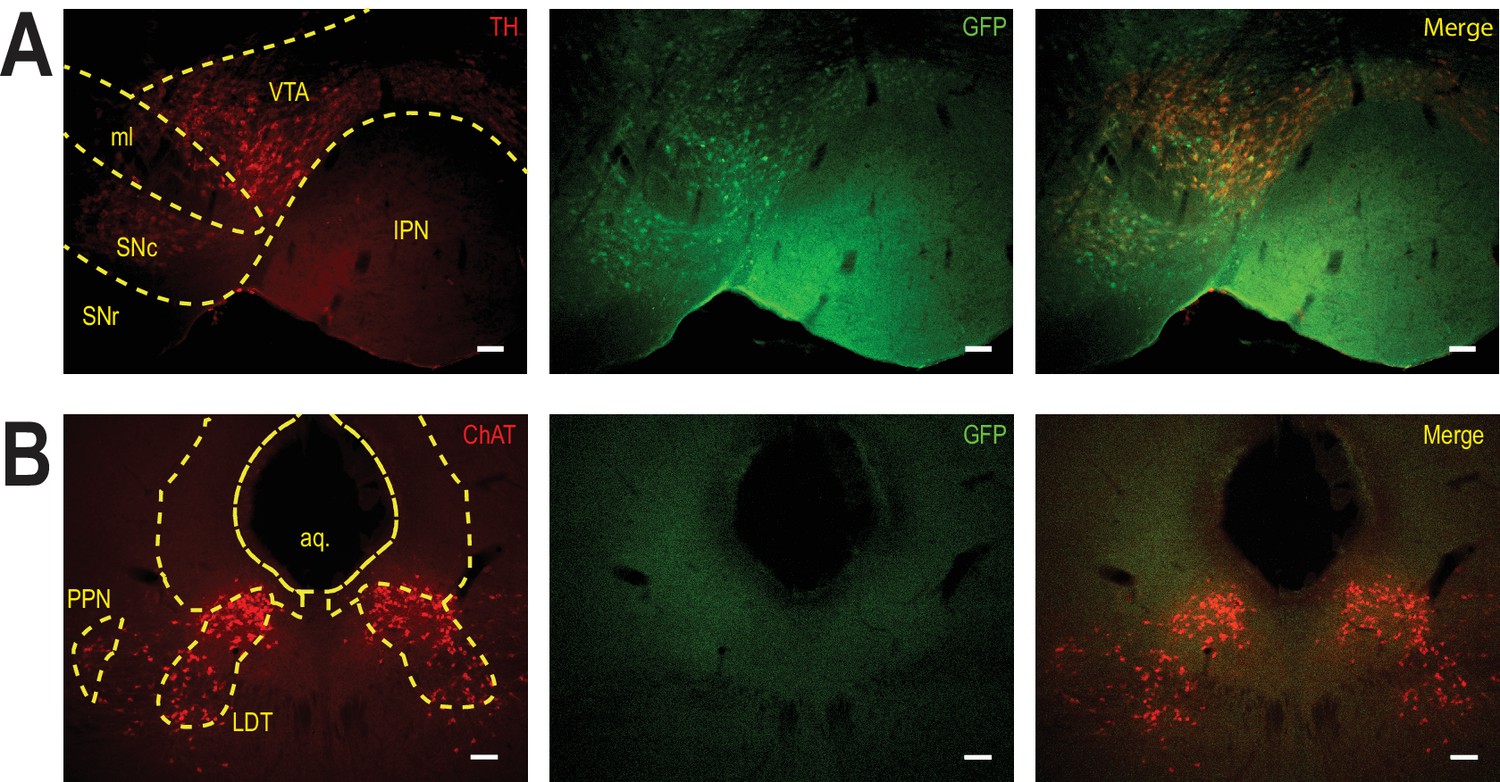
Selective transduction of β2E61C in the VTA of WT mice.
(A) Viral transduction of the VTA using a lentivirus encoding pGK-β2E61C-IRES-eGFP. Immunocytochemical identification of virally-transduced neurons (GFP-positive, green). DA neurons are labelled using anti-tyrosine hydroxylase (TH) antibodies (red). Scale bar: 50 μm. IPN: interpeduncular nucleus, ml: medial lemniscus, SNc: substantia nigra pars compacta, SNR: substantia nigra pars reticulata, VTA: ventral tegmental area. (B) Immunocytochemical identification of pontine (i.e. PPN and LDT) cholinergic neurons with anti-ChAT antibodies (red). Note the absence of GFP signal is these afferents to the VTA. Scale bar: 100 μm. PPN: pedunculopontine nucleus; LDT: laterodorsal tegmental nucleus; aq.: aqueduct.
Figure 2—figure supplement 2
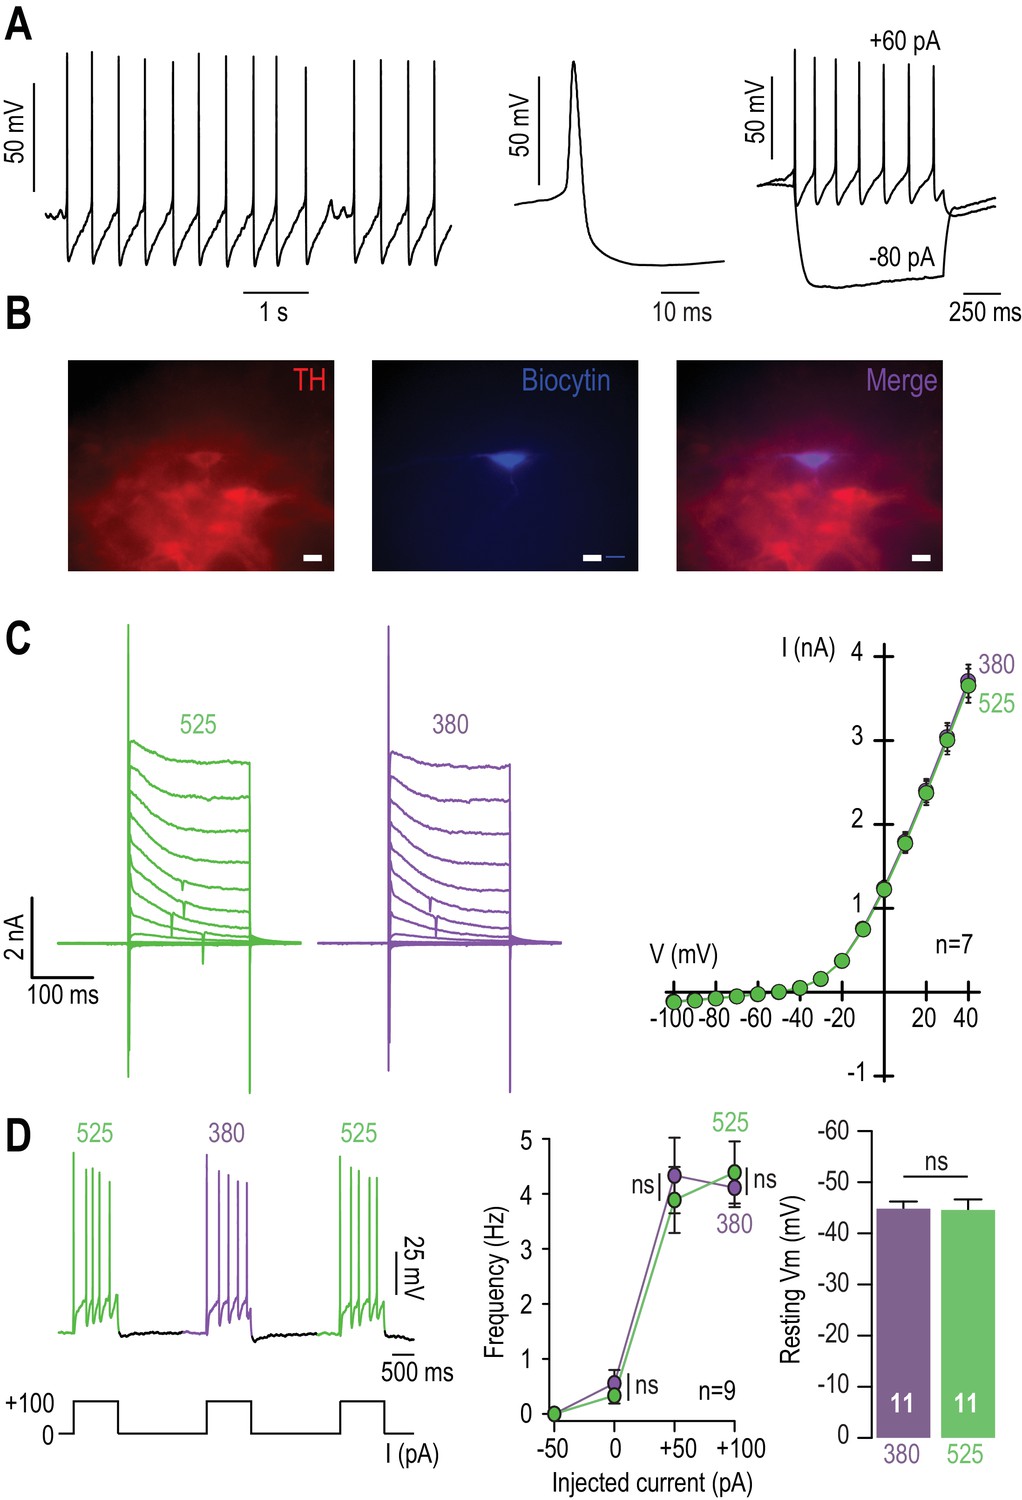
No adverse effect of MAHoCh on the basic electrophysiological properties of WT VTA DA neurons.
(A) VTA DA neurons are characterized in patch-clamp configuration by their pacemaker activity and their pronounced after-hyperpolarization (left), and by their typical action potential waveform (middle). Right, they respond to depolarizing currents (+60 pA) by an increase in firing rate, and occasionally showed a sag component upon injection of hyperpolarizing current (−80 pA), in agreement with what has been described in (Lammel et al., 2008). (B) Immunocytochemical identification of VTA DA neurons using TH (red) and biocytin (blue) labeling. 19 VTA neurons were patched, of which 17 were considered DAergic based on their electrophysiological signatures (as in A). Out of these 17 putative DA neurons, 16 were found to be TH+ (i.e. >94%). (C) Left, representative voltage-gated potassium currents recorded from a MAHoCH-treated WT VTA DA neuron in voltage-clamp mode, using 200 ms depolarization steps from −100 to +40 mV (holding potential −60 mV), under 380 (purple) and 525 nm light (green). Right, current versus voltage (I/V) curves for n = 7 MAHoCh-treated WT VTA DA neurons. The amplitudes of voltage-gated potassium currents are similar under both conditions. (D) Left, representative electrophysiological recording of a MAHoCh-treated, WT VTA DA neuron recorded in current clamp mode, upon injection of current (100 pA), and while alternating between 380 (purple) and 525 nm light (green). Middle, frequency versus current (F/I) curves for n = 9 MAHoCh-treated WT VTA DA neurons. The number of evoked spikes are similar under both conditions (p=0.75 for 100 pA step of current). Right, mean value of the resting membrane potential (Vm) of MAHoCh-treated VTA DA neurons (n = 11) is similar under both wavelengths of light (p=0.92). All values represent mean ± SEM.
Figure 3 with 1 supplement
In vivo photo-control of endogenous cholinergic signaling.
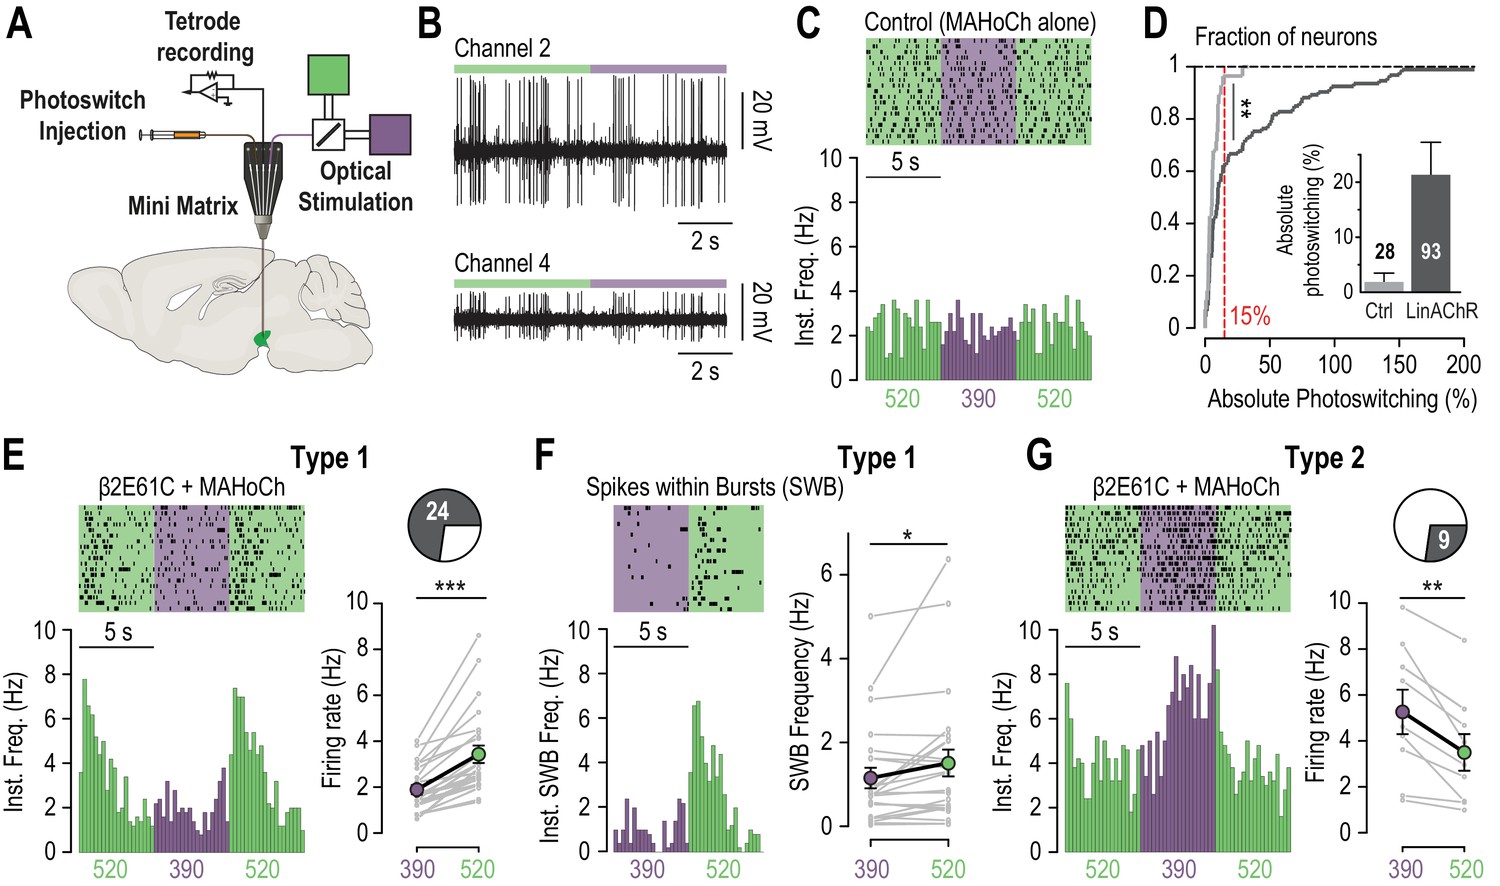
(A) Design of the experimental setup for concurrent recording and photocontrol of midbrain DA neurons in vivo. A micro-drive system (Mini Matrix) is mounted with a stereotaxic frame on the head of an anesthetized mouse, and enables to position in the VTA one cannula for photoswitch injection, up to three tetrodes for electrophysiological recordings, and one optic fiber connected to a beam combiner for optical stimulation. The photoswitch is injected at least an hour prior to the recordings. (B) Representative multi-unit recordings of transduced neurons on two channels of a tetrode while alternating illumination between 390 and 520 nm light. (C) Representative electrophysiological response of a MAHoCh-treated control neuron, while alternating illumination conditions between 390 (purple) and 520 nm light (green) every 5 s. Top, raster plot (n = 19 transitions) centered on the 390 nm light stimuli, and showing both the 390 to 520 and the 520 to 390 nm light transitions. Bottom, peri-stimulus time histogram (PSTH) of firing frequency using a 250 ms bin. (D) Change in firing frequency (expressed in absolute photoswitching) between 390 and 520 nm light for MAHoCh-treated control (Ctrl, light grey, n = 28) and β2E61C-transduced neurons (LinAChR, dark grey, n = 93). Photoswitching is calculated as ((Freq520 – Freq390)/Freq390) and represented in percent. Cumulative distribution indicates that virally transduced neurons significantly photoswitch compared to controls (p=0.0055, Kolmogorov-Smirnov test). Inset, absolute photoswitching for control neurons (1.87 ± 1.60%) is lower than that for transduced neurons (21.35 ± 5.90%). The threshold set at 15% absolute photoswitching (red) was used to determine the fraction of responding neurons in transduced animals (33/93, 35.5%). (E) Left, representative electrophysiological response of a virally transduced, MAHoCh-treated type 1 pDA neuron, represented as in (C). Right: Average firing rate of all type 1 pDA neurons (n = 24), under 520 (green) and 390 nm (purple) light. Firing frequency is significantly lower in 390 nm (1.85 Hz) compared to 520 nm light (3.41 Hz, p=1.19e−07). (F) Top left, raster plot (n = 20 transitions) for the spikes contained within bursts (SWB) under 390 nm and 520 nm light, for the same neuron as in (E). Bottom left, PSTH of instantaneous SWB frequency using a 250 ms bin. Right, average SWB frequency of all type 1 pDA neurons (n = 24), under both wavelengths of light. SWB frequency is significantly lower in 390 compared to 520 nm light (p=0.043). (G) Left, representative electrophysiological response of a virally transduced, MAHoCh-treated type 2 pDA neuron, represented as in (C). Right: Average firing rate of all type 2 pDA neurons (n = 9), under 520 (green) and 390 nm (purple) light. Firing frequency is significantly higher in 390 nm (5.25 Hz) compared to 520 nm light (3.48 Hz, p=0.0039). All values represent mean ± SEM.
-
Figure 3—source data 1
Source data for Figure 3C,G.
- https://doi.org/10.7554/eLife.37487.011
Figure 3—figure supplement 1
Photocontrolling VTA β2LinAChRs in vivo.
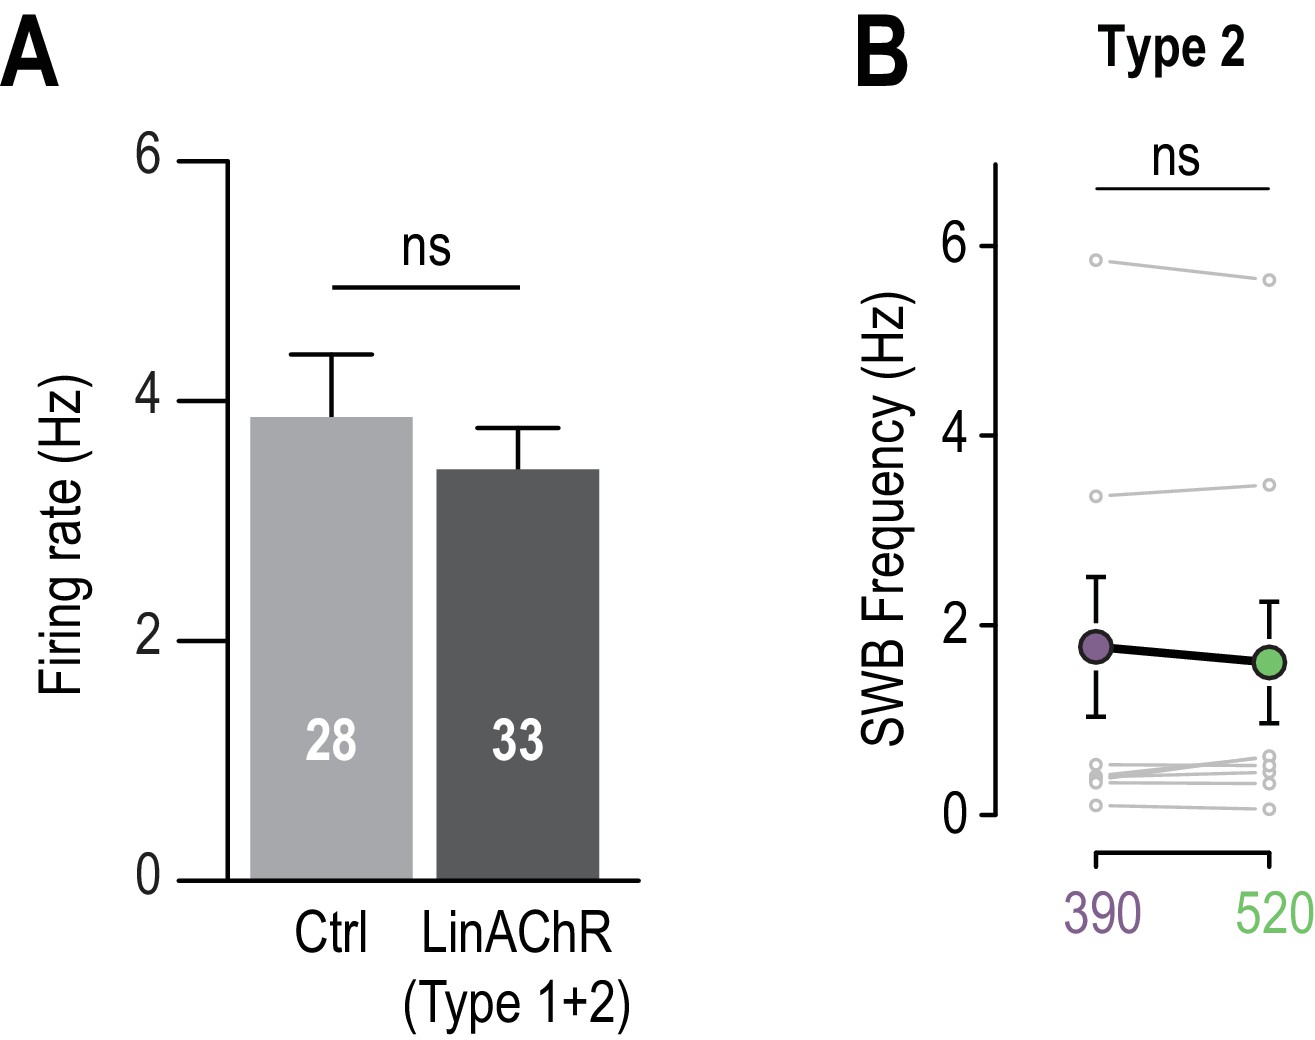
(A) Mean firing rate of control neurons (MAHoCh alone n = 28) is not significantly different from mean firing rate of transduced neurons (Type 1 and 2 are pooled, n = 33, p=0.96). (B) Average SWB frequency of all type 2 pDA neurons (n = 9) is similar in 390 and 520 nm light. All values represent mean ± SEM.
Figure 4 with 1 supplement
Blocking the effects of nicotine selectively in the VTA.
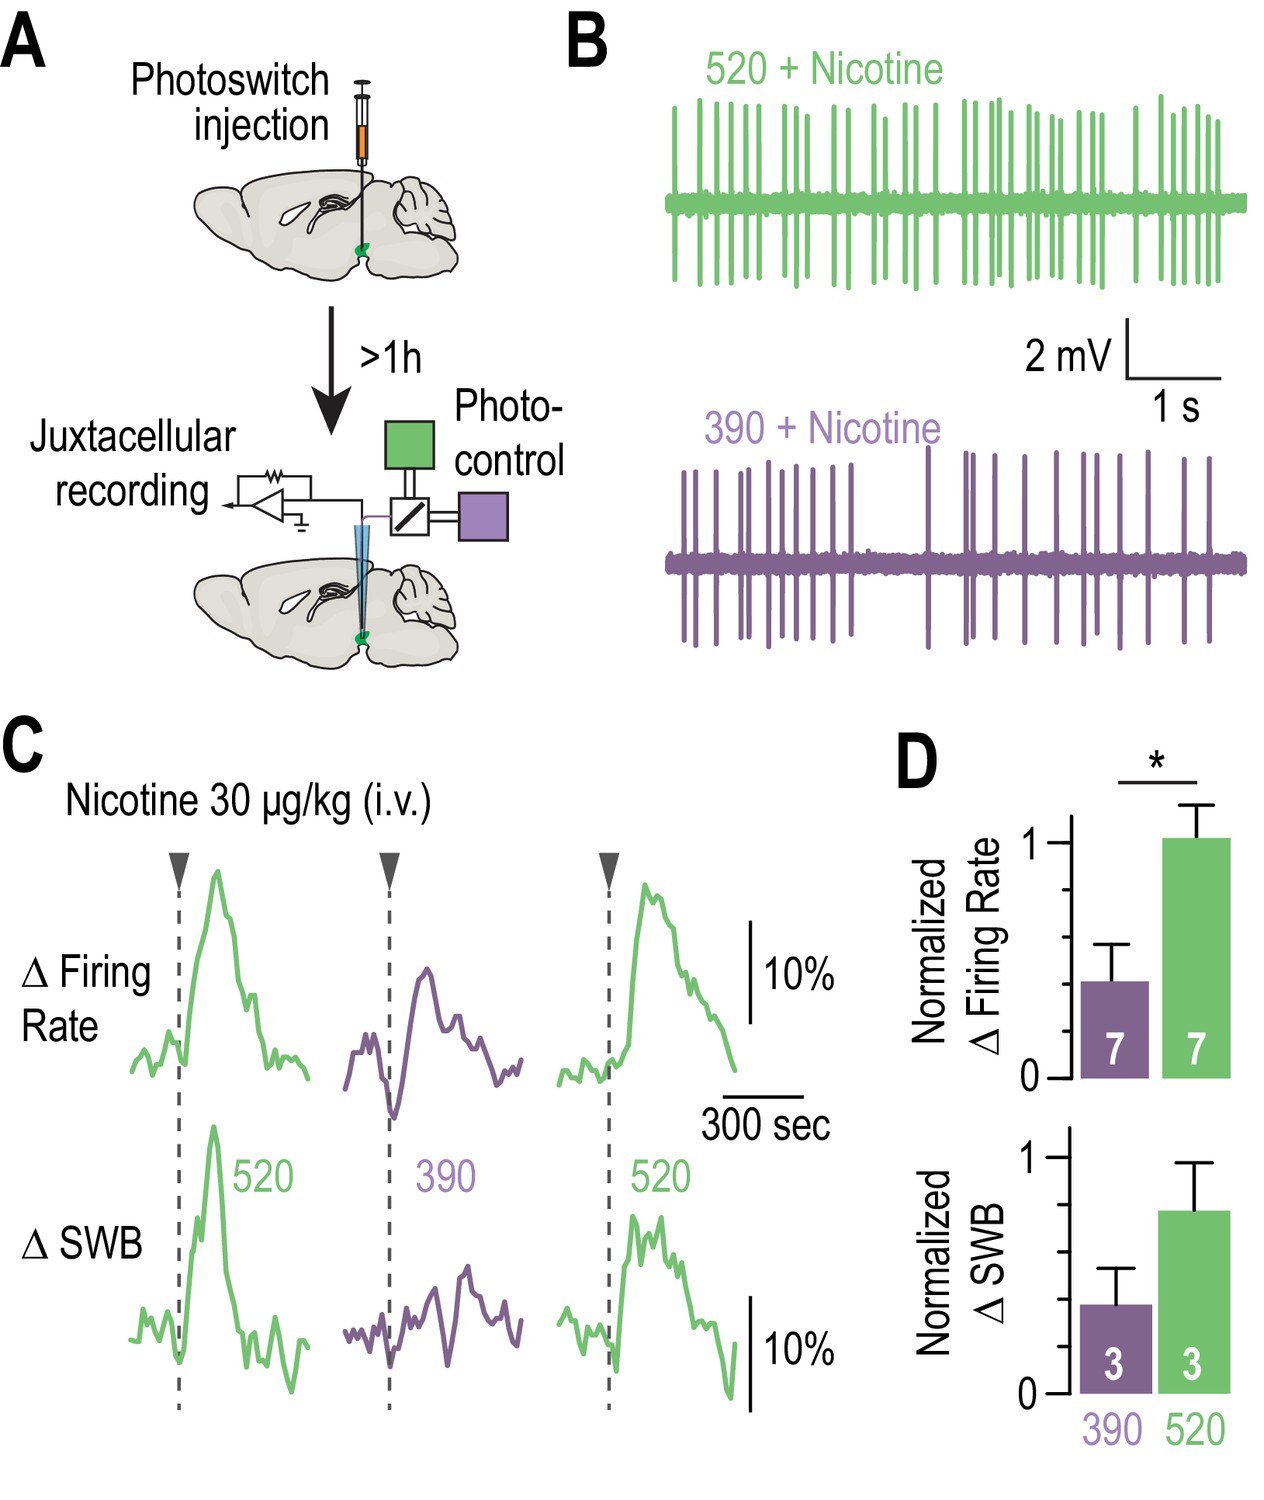
(A) Experimental design for photoswitch injection and subsequent juxtacellular recording coupled to photocontrol. (B) Representative electrophysiological recording of one VTA DA neuron, during an i.v. injection of nicotine (30 μg/kg), under 520 (top, green) and 390 nm light (bottom, purple), showing greater electrical activity in green light. (C) Representative change in firing frequency (top) and in bursting activity (bottom) of a VTA DA neuron, elicited by an i.v. injection of nicotine (30 μg/kg), under 390 and 520 nm light, showing reversible photo-inhibition. (D) Top, average change in firing rate for VTA DA neurons (n = 7) upon nicotine injection under 390 (41.0 ± 15.7 %, purple) and 520 nm light (102.0 ± 14.0 %, green), normalized to the initial response in darkness. Change in firing frequency in 520 nm light is significantly different for 390 nm (p=0.015, Wilcoxon-Mann-Whitney test with Holm-Bonferroni correction) but not from darkness (p=0.81). Bottom, average change in SWB for bursting VTA DA neurons (n = 3) upon nicotine injection under 390 (37.7 ± 15.3 %, purple) and 520 nm light (77.5 ± 20.3 %, green), normalized to the initial response in darkness. All values represent mean ± SEM.
-
Figure 4—source data 1
Source data for Figure 4D.
- https://doi.org/10.7554/eLife.37487.014
Figure 4—figure supplement 1
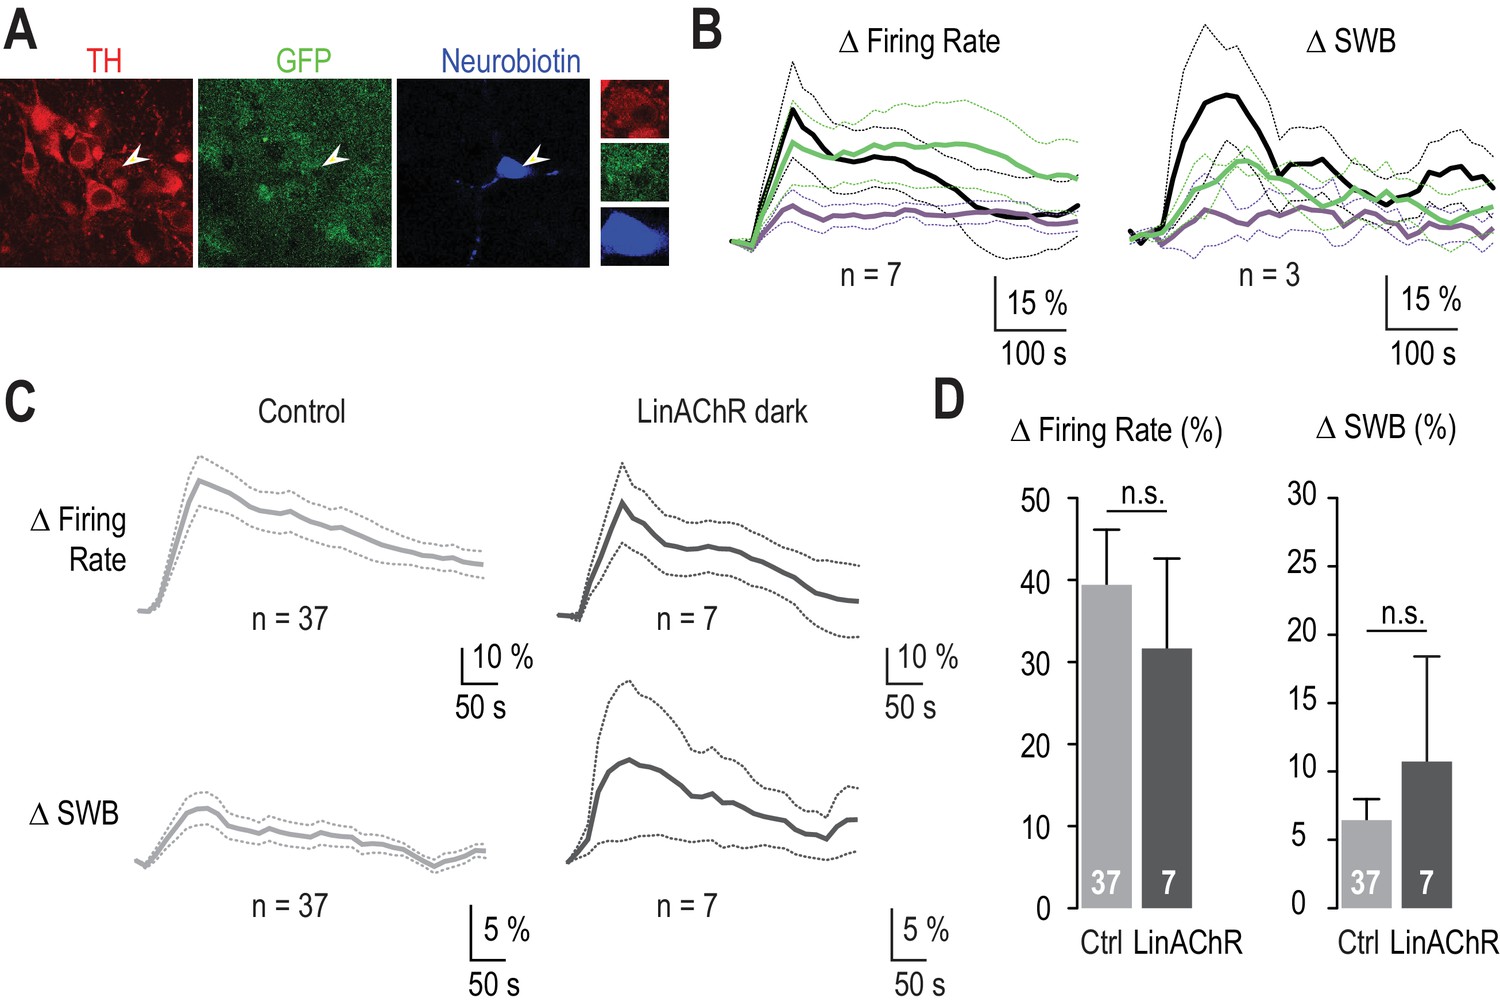
The response of VTA DA neurons to nicotine is similar in WT and in β2E61C-transduced animals.
(A) Example of a recorded transduced DA neuron labeled with neurobiotin (blue) and identified with TH (red) and GFP (green) labeling. 3 out of 7 recorded neurons have been filled with neurobiotin, of which all were confirmed as DAergic by TH labeling. (B) Left, average change in firing rate for VTA DA neurons (n = 7) upon nicotine injection in darkness, and under 390 (purple) and 520 nm light (green). Right, average change in burst firing frequency upon nicotine injection in darkness, and under 390 (purple) and 520 nm light (green); only the busting VTA DA neurons were considered here (n = 3). (C) Average changes in firing rate (top) and in the percent of spikes within bursts (SWB, bottom) for VTA DA neurons from control (left, light grey, n = 37) and β2E61C-transduced animals (right, dark grey, n = 7), upon nicotine i.v. injection (30 μg/kg) in darkness. (D) Changes in firing frequency are not different between control (Δfiring rate = 39.4 %, n = 37) and β2E61C-transduced animals (Δfiring rate = 31.7 %, n = 7, p=0.53). Similarly, changes in the percent of SWB are not different between control and β2E61C-transduced animals (Δ%SWB = 6.44 % and 10.72%, respectively, p=0.68). All values represent mean ± SEM.
Figure 5 with 1 supplement
Reversibly disrupting nicotine preference.
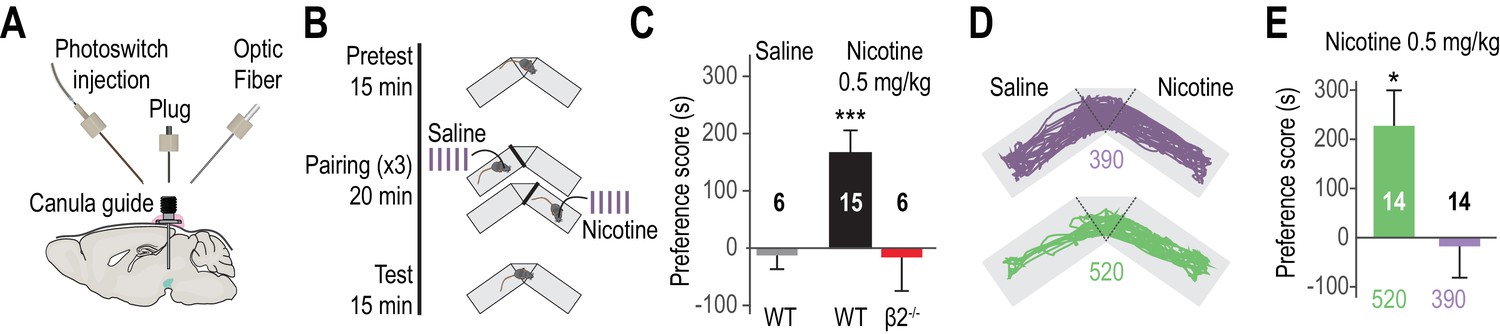
(A) Experimental design of the opto-fluidic device for opto-pharmacology experiments in freely-moving mice. The cannula guide is chronically implanted above the VTA and is used for both photoswitch and light delivery. (B) Nicotine-place preference protocol. Drug-free pretest (15 min) was followed by 3 consecutive days of pairing, which consisted in morning and evening saline and nicotine (0.5 mg/kg) conditioning sessions (20 min). For experiments using LinAChRs, mice were injected with the photoswitch in the morning and received light (390 or 520 nm, 2 s flashes at 0.1 Hz) in both pairing chambers. On day 5, mice were placed in the central chamber (no drug, no light) and were allowed to freely explore the environment. (C) Mean preference score (ps) for WT mice conditioned with saline (grey, n = 6, ps = −12.8 ± 24.0 s, p=0.69) and with nicotine (black, n = 15, ps = 165.9 ± 39.6 s, p=6.1e−04), and for β2-/- mice conditioned with nicotine (red, n = 6, ps = −16.2 ± 58.7 s, p=0.44). (D) Representative trajectories of β2E61C-transduced and MAHoCh-treated mice conditioned with nicotine, under 390 (purple) and 520 nm light (green). (E) Mean preference for nicotine is abolished under 390 nm (purple, ps = −17.6 ± 63.8 s, p=0.80) and restored under 520 nm light (green, ps = 227.3 ± 72.1 s, p=0.015). Two groups of 7 mice were pooled. All values represent mean ± SEM.
-
Figure 5—source data 1
Source data for Figure 5C,E.
- https://doi.org/10.7554/eLife.37487.017
Figure 5—figure supplement 1
Nicotine-induced CPP.
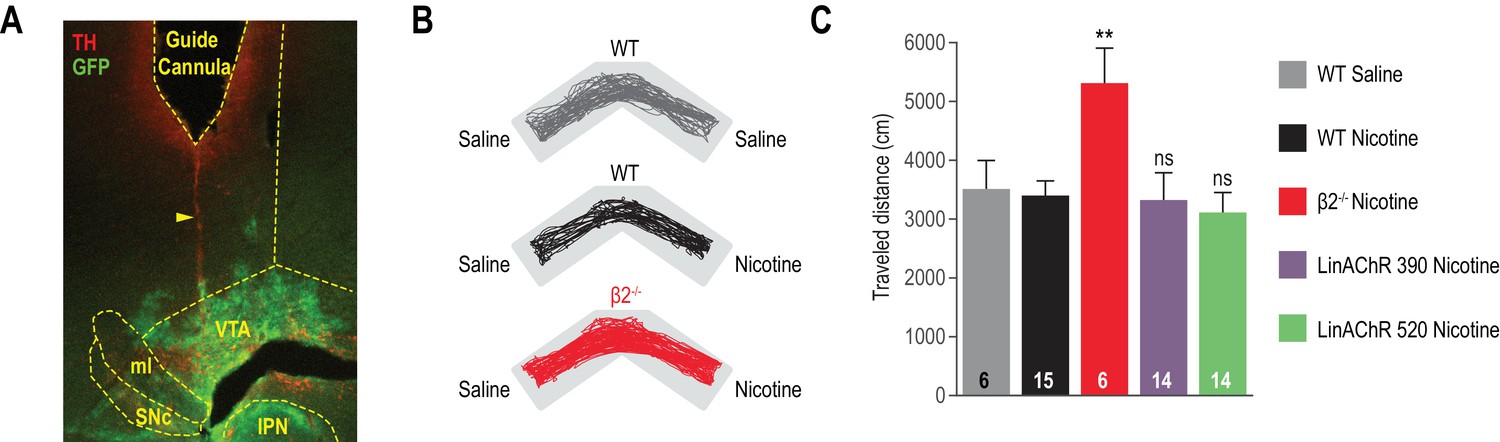
(A) Epi-fluorescence images of 60 μm coronal midbrain slices with immunostaining for dopamine neurons (tyrosine hydroxylase (TH), red) and transfected area (Green Fluorescent Protein (GFP), green) showing the track of an implanted guide cannula (yellow dashed outline). The yellow arrow-head points to the protruding optical fiber/cannula track. IPN: interpeduncular nucleus, ml: medial lemniscus, SNc: substantia nigra pars compacta, VTA: ventral tegmental area. (B) Representative trajectories for WT mice conditioned with saline (grey) or nicotine (black), and for β2-/- mice conditioned with nicotine (red). (C) Traveled distance in the CPP chamber on the test day, for WT mice conditioned with saline (grey) or nicotine (black), for β2-/- mice conditioned with nicotine (red), and for β2E61C-transduced mice conditioned with nicotine under 390 (purple) or 520 nm light (green). Locomotion for β2E61C-transduced mice is not different from WT animals (p=0.68 and p=0.45, respectively). In contrast, β2-/- mice showed greater travelled distance than WT animals (p=0.0062), as already reported (Avale et al., 2008). All values represent mean ± SEM.
Tables
Key resources table
| Reagent type (species) or resource | Designation | Source or reference | Identifiers | Additional information |
|---|---|---|---|---|
| Antibody | Anti-tyrosine Hydroxylase produced in mouse | Sigma-Aldrich | T1299, RRID:AB_477560 | |
| Antibody | Anti-Choline-Acetyltransferase produced in goat | Merck-Millipore | AB144, RRID:AB_90650 | |
| Antibody | Anti-GFP produced in rabbit | |||
| Antibody | Anti-GFP produced in chicken | Aves Lab | GFP-1020, RRID:AB_10000240 | |
| Antibody | Anti-rabbit Cy2-conjugated produced in donkey | Jackson Immuno Research | 711-225-152, RRID:AB_2340612 | |
| Antibody | Anti-mouse Cy3-conjugated produced in donkey | Jackson Immuno Research | 715-165-150, RRID:AB_2340813 | |
| Antibody | Anti-chicken Alexa488-conjugated | Jackson Immuno Research | 703-545-155, RRID:AB_2340375 | |
| Antibody | anti-goat Alexa 555-conjugated produced in donkey | Life Technologies | A21432, RRID:AB_141788 | |
| Antibody | AMCA-Streptavidin | Jackson ImmunoResearch | 016-150-084, RRID:AB_2337243 | |
| Strain, strain background (mus musculus, males) | C57Bl/6JRj | Janvier Laboratories, France | SC-C57J-M, RRID:MGI:5752053 | |
| Strain, strain background (mus musculus, males) | ACNB2 | https://doi.org/ 10.1038/374065a0 | maintained on a C57BL6/J background | |
| Strain, strain background (lentivirus) | Lenti-pGK-B2E61C- IRES-GFP | This paper | ||
| Cell line (mus musculus) | Neuro 2a | Sigma-Aldrich | 89121404-1VL, RRID:CVCL_0470 | |
| Transfected construct (mus musculus) | pIRES-a4-IRES- GFP | https://doi.org/10.1038/ nature03694 | ||
| Transfected construct (mus musculus) | pIRES-b2E61C-I RES-eGFP | this paper | ||
| Chemical compound, drug | MAHoCh | https://doi.org/10.1038/ nchem.1234 | ||
| Chemical compound, drug | NaCl | Sigma-Aldrich | S7653 | |
| Chemical compound, drug | KCl | Sigma-Aldrich | P9333 | |
| Chemical compound, drug | NaH2PO4 | Sigma-Aldrich | S8282 | |
| Chemical compound, drug | MgCl2 | Sigma-Aldrich | M2670 | |
| Chemical compound, drug | CaCl2 | Sigma-Aldrich | 233506 | |
| Chemical compound, drug | NaHCO3 | Sigma-Aldrich | S6297 | |
| Chemical compound, drug | Sucrose | Sigma-Aldrich | S0389 | |
| Chemical compound, drug | Glucose | Sigma-Aldrich | 49159 | |
| Chemical compound, drug | Kynurenic Acid | Sigma-Aldrich | K3375 | |
| Chemical compound, drug | Albumin, from bovine serum | Sigma-Aldrich | A4503 | |
| Chemical compound, drug | KGlu | Sigma-Aldrich | P1847 | |
| Chemical compound, drug | HEPES | Sigma-Aldrich | H3375 | |
| Chemical compound, drug | EGTA | Sigma-Aldrich | E3889 | |
| Chemical compound, drug | ATP | Sigma-Aldrich | A9187 | |
| Chemical compound, drug | GTP | Sigma-Aldrich | G8877 | |
| Chemical compound, drug | Biocytin | Sigma-Aldrich | B4261 | |
| Chemical compound, drug | Nicotine tartrate | Sigma-Aldrich | N5260 | |
| Chemical compound, drug | Glucose | Sigma-Aldrich | G8270 | |
| Chemical compound, drug | DMEM + Glutamax | Life Technologies | 31966–021 | |
| Chemical compound, drug | FBS | Life Technologies | 10500–064 | |
| Chemical compound, drug | Non-essential amino acids | Life Technologies | 11140–035 | |
| Chemical compound, drug | Pennicilin/ Streptomycin | Life Technologies | 15140–122 | |
| Chemical compound, drug | Trypsin | Life Technologies | 15090–046 | |
| Chemical compound, drug | Polylysine | Sigma-Aldrich | P6282 | |
| Chemical compound, drug | DMSO | Sigma-Aldrich | D2650 | |
| Chemical compound, drug | Carbamylcholine Chloride | Sigma-Aldrich | C4382 | |
| Chemical compound, drug | DPBS 10x | Life Technologies | 14200–067 | |
| Chemical compound, drug | Neurobiotin Tracer | Vector laboratories | SP-1120 | |
| Chemical compound, drug | Prolong Gold Antifade Reagent | Invitrogen | P36930 | |
| Software, algorithm | MATLAB | MathWorks | RRID:SCR_001622 | |
| Software, algorithm | R Project for Statistical Computing | http://www.r-project.org/ | RRID:SCR_001905 | |
| Software, algorithm | Fiji | http://fiji.sc | RRID:SCR_002285 | |
| Software, algorithm | Adobe Illustrator CS6 | Adobe | RRID:SCR_010279 | |
| Software, algorithm | Clampfit (pClamp suite) | Molecular Devices | RRID:SCR_011323 |
Additional files
-
Transparent reporting form
- https://doi.org/10.7554/eLife.37487.018
Download links
A two-part list of links to download the article, or parts of the article, in various formats.
Downloads (link to download the article as PDF)
Open citations (links to open the citations from this article in various online reference manager services)
Cite this article (links to download the citations from this article in formats compatible with various reference manager tools)
Manipulating midbrain dopamine neurons and reward-related behaviors with light-controllable nicotinic acetylcholine receptors
eLife 7:e37487.
https://doi.org/10.7554/eLife.37487


