Timing of the reticular lamina and basilar membrane vibration in living gerbil cochleae
- Oregon Health & Science University, United States
- University College London, United Kingdom
Figures
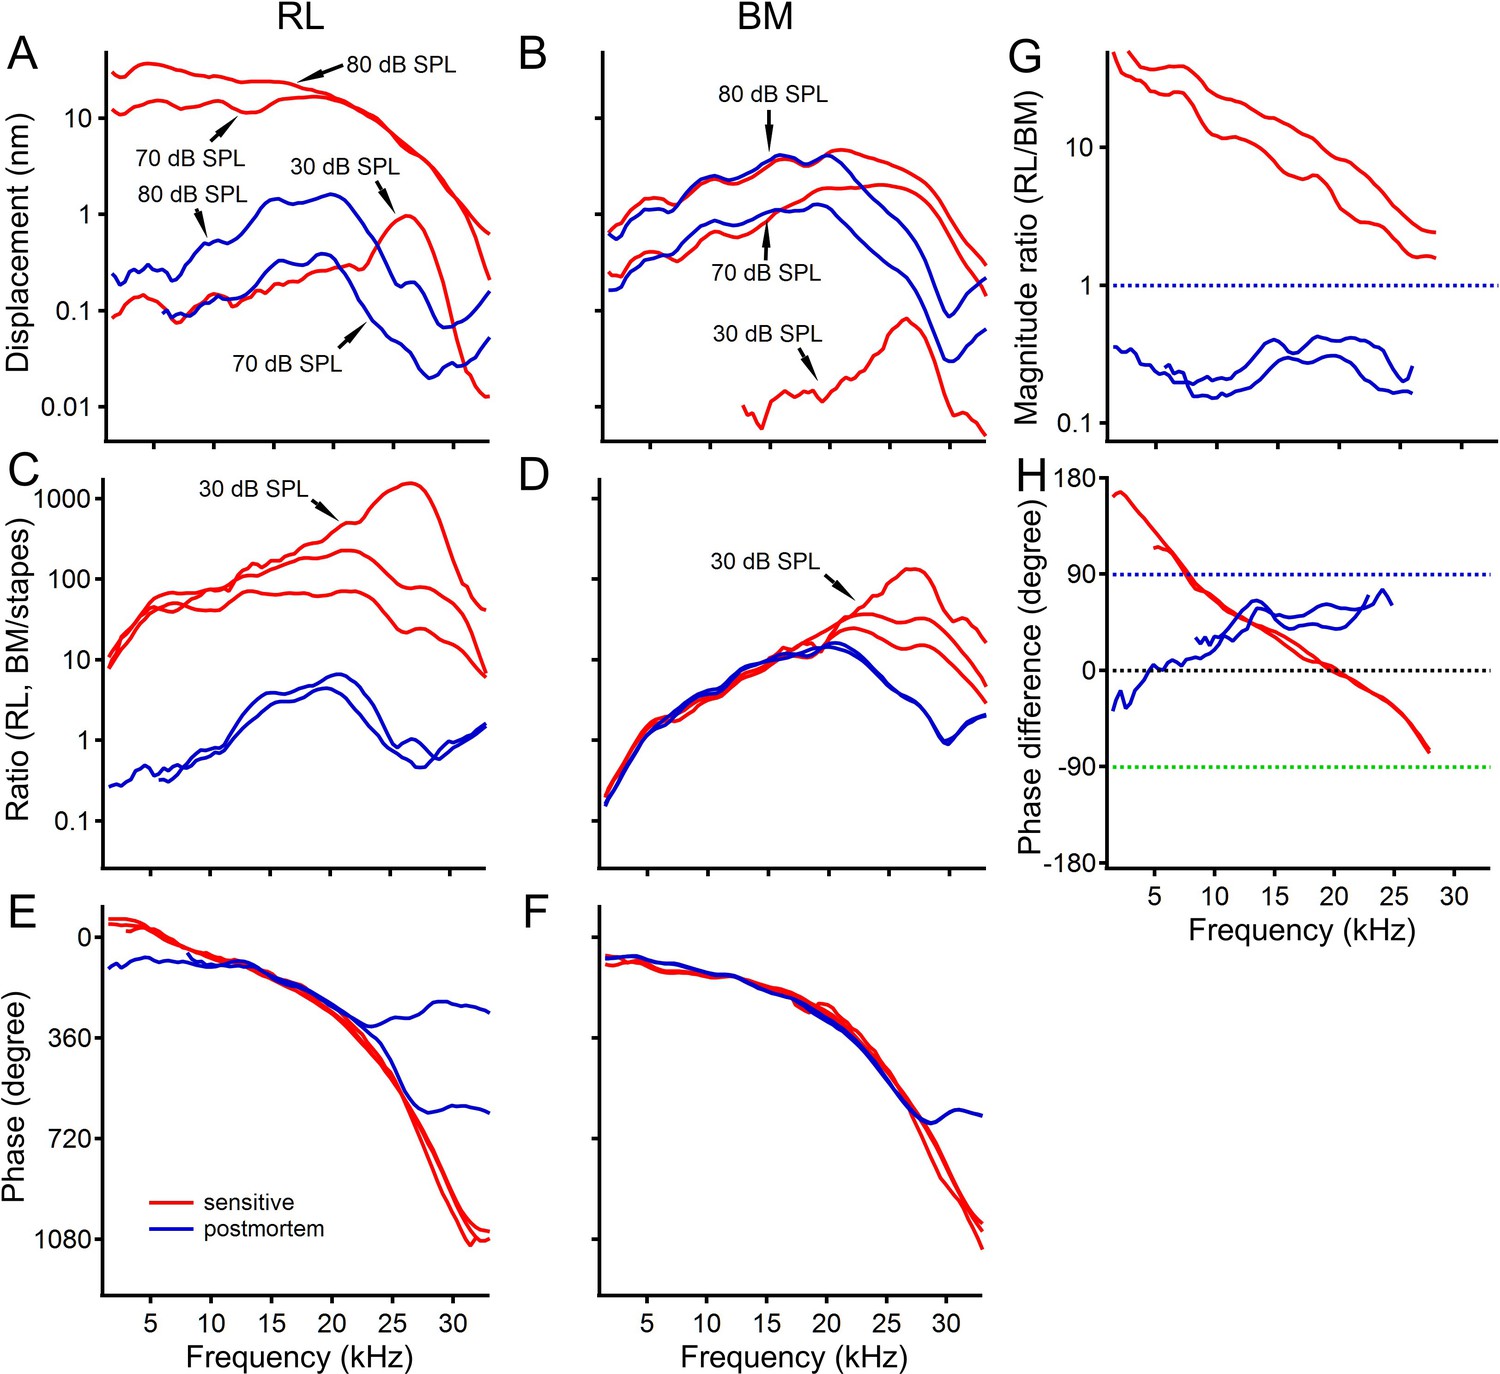
Figure 1

The reticular lamina and basilar membrane vibration in a sensitive gerbil cochlea.
(A, B) Displacements of the reticular lamina (RL) and basilar membrane (BM) as a function of frequency at different sound levels. The noise floor is indicated by the black dotted line in panel A. (C, D) Ratios of RL and BM displacements to stapes displacements at different sound levels. (E, F) RL and BM phase as a function of frequency. (G) The ratios of the RL displacement to the BM displacement as a function of frequency at different sound levels. (H) Phase difference between the RL and BM vibration. Line types and colors in this panel are the same as those in plot (G). The slope of the linear regression line (thick black dotted) indicates that the latency of the RL vibration is ~20 µs greater than that of the BM vibration at 70 dB SPL.
Figure 2
Postmortem changes in reticular lamina and basilar membrane vibrations.
(A) Postmortem reticular lamina (RL) displacements (blue lines) are significantly smaller than those under sensitive conditions (red lines) at all frequencies. (B) Basilar membrane (BM) displacements deceased only near the best frequency (~26 kHz) under postmortem conditions (blue lines). (C, D) Sensitive (red lines) and insensitive (blue lines) RL and BM magnitude transfer functions. (E) RL phase decreased by up to 180 degrees at low frequencies under postmortem conditions. (F) No significant difference between sensitive and insensitive BM phase curves. (G) The ratio of RL displacement to BM displacement decreased dramatically at all frequencies under postmortem conditions (blue lines). (H) The phase difference (~180 degrees) at low frequencies (red lines) is absent in the postmortem cochlea (blue curves).
Figure 3
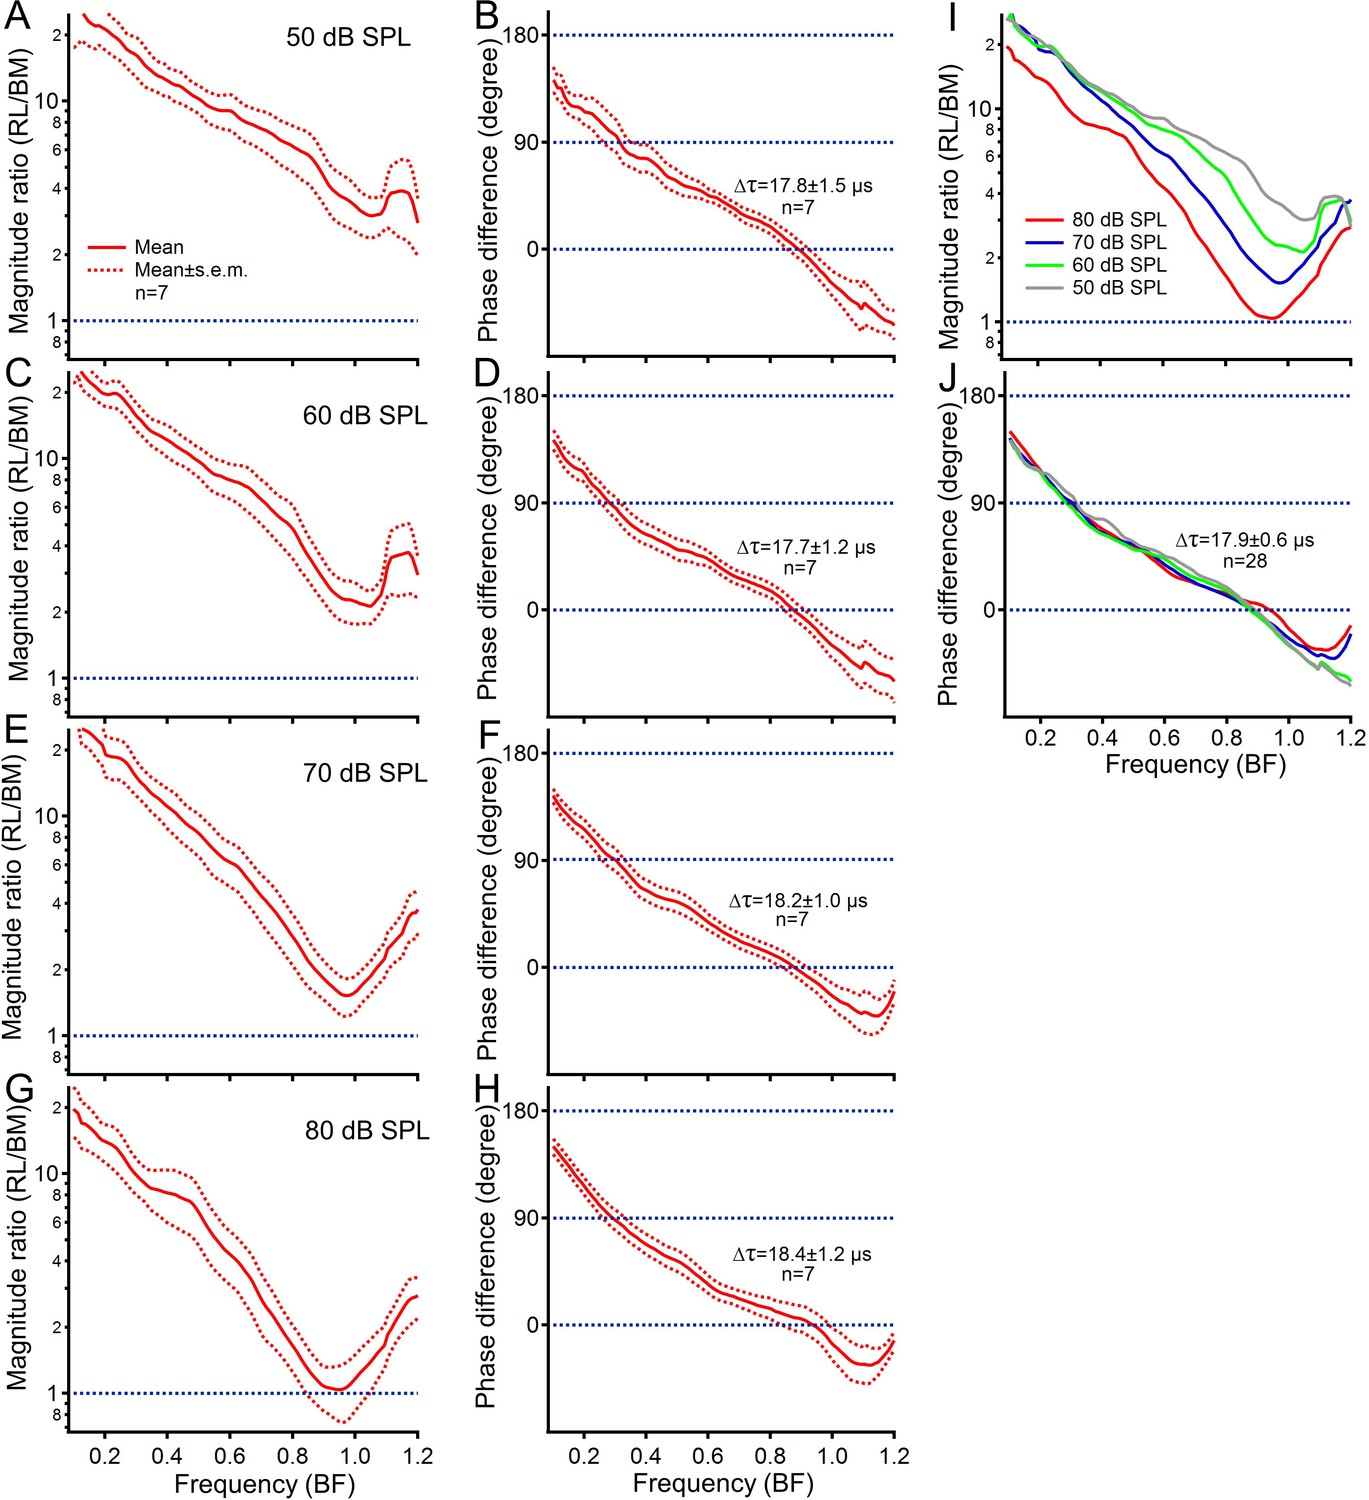
Phase and latency differences between the reticular lamina and basilar membrane vibration across animals.
(A, C, E, G) Means and standard errors of the displacement ratio of the reticular lamina (RL) to basilar membrane (BM) at 50, 60, 70, and 80 dB SPL. (B, D, F, H) Phase differences between the RL and BM vibration. Latency (Δτ) was calculated from the phase slope and presented next to phase difference curves. (I) The magnitude ratio decreases with sound level near the best frequency. (J) Phase difference as a function of frequency shows no significant change with sound level. Data in panels (A–H) are presented as mean ± SEM.
Figure 4
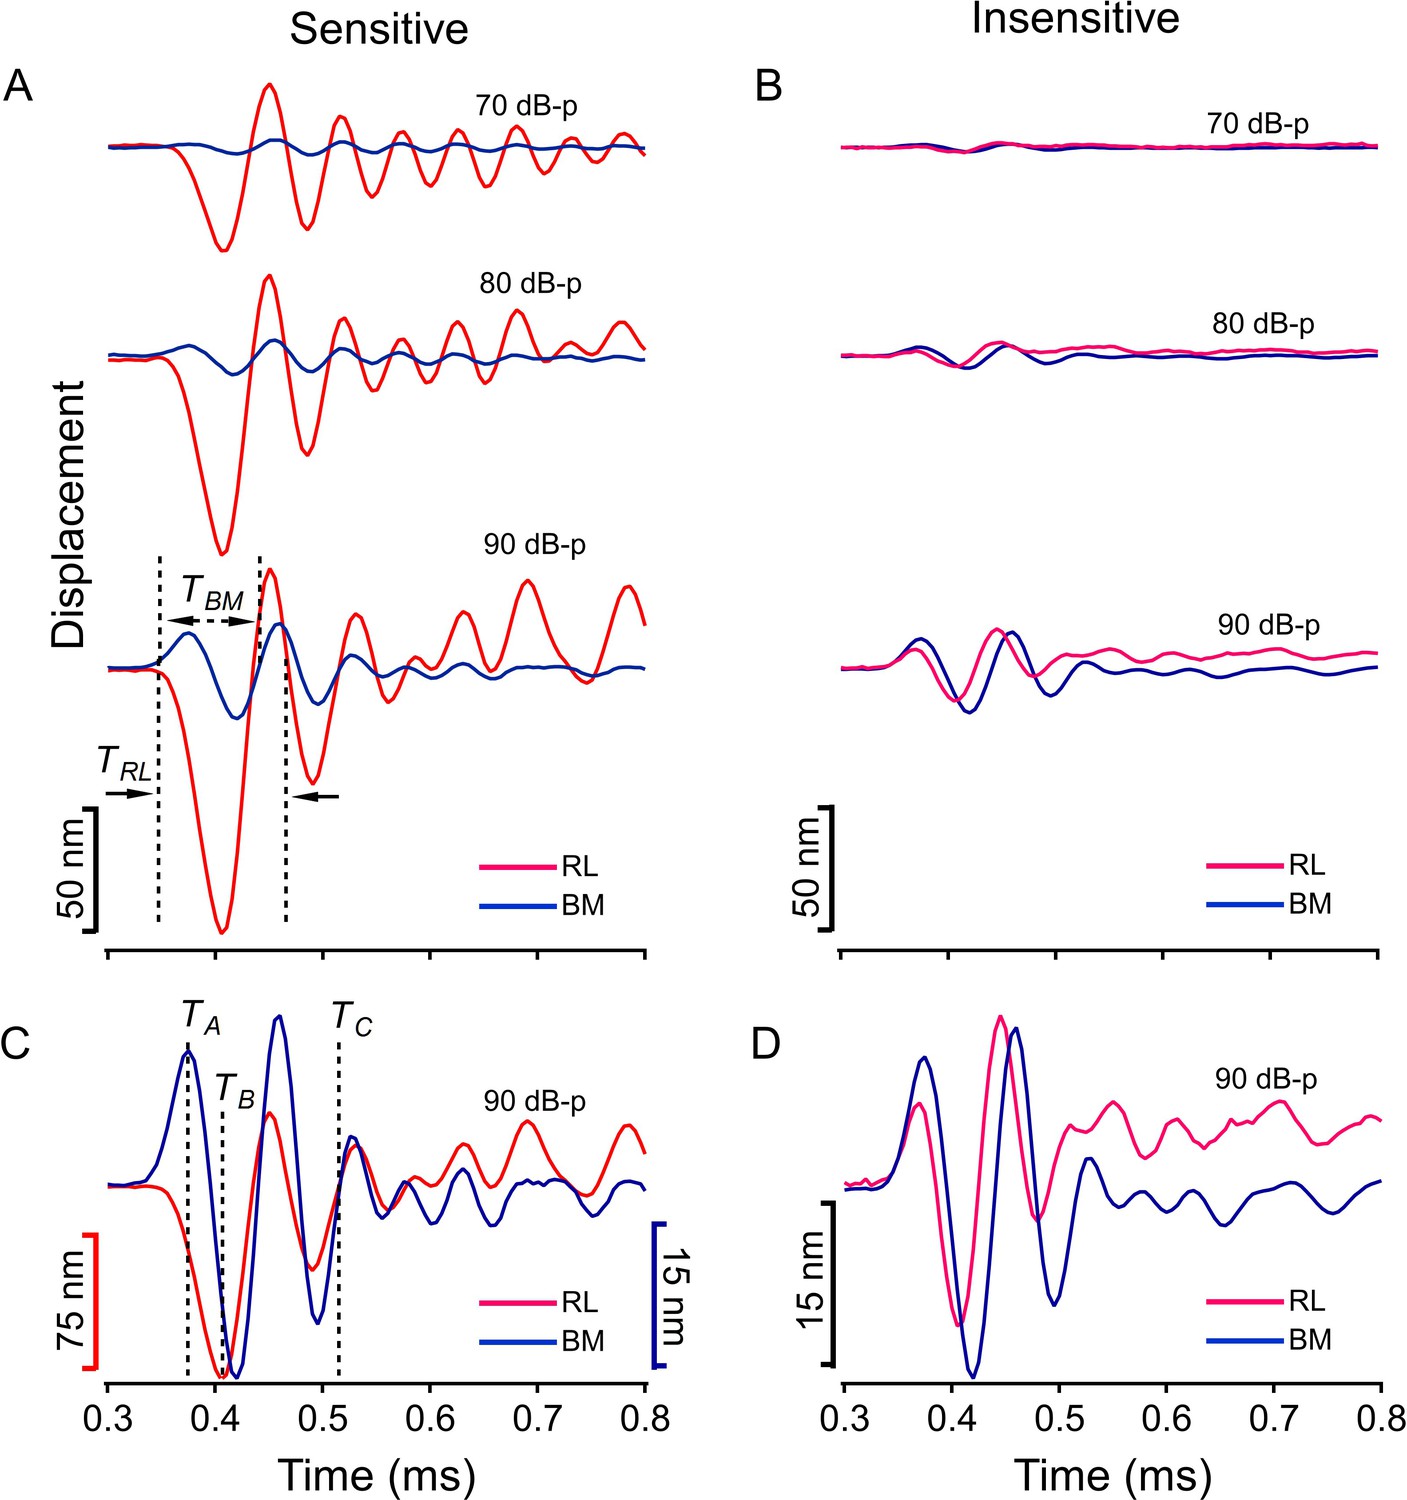
Time waveforms of the reticular lamina and basilar membrane vibration.
(A) Displacements of the reticular lamina (red) and basilar membrane (blue) vibration in response to 10-µs rarefaction clicks as a function of time at 70, 80, and 90 dB-p (0 dB-p = 20 µPa of the peak sound pressure). (B) The reticular lamina and basilar membrane response to clicks measured under postmortem conditions. (C) To show the temporal relationship, the reticular lamina and basilar membrane response at 90 dB-p are plotted with different magnitude scales. (D) Postmortem responses of the reticular lamina and basilar membrane at 90 dB-p. TA, the arriving time of the first peak of the basilar membrane vibration; TB, the arriving time of the first peak of the reticular lamina vibration; TC, the time when the reticular lamina and basilar membrane vibration become in phase; TBM and TRL, the first periods of the basilar membrane and reticular lamina vibration.
Figure 5

Longitudinal patterns of reticular lamina and basilar membrane vibrations.
(A) The longitudinal patterns of the reticular lamina (RL) and basilar membrane (BM) vibrations at 30 dB SPL. RL and BM vibrations occurred within a 0.2 mm region centered at the best-frequency location. (B) At 70 dB SPL, both RL and BM vibrations extended from the best-frequency location to the cochlear base. (C, D) RL and BM phase as a function of the longitudinal location at 30 and 70 dB SPL. (E, F) Time waveforms of the BM (red) and outer hair cell-driven RL movement (green). For clearer comparison, BM time waveforms were shifted down by 4 nm in panel E and by 50 nm in panel F. The time difference between solid and dotted curves is ~6 µs, equivalent to ~57 degree phase difference at 26 kHz. The outer hair cell-driven active RL vibration (green lines) was obtained by vector subtraction of the BM vibration from the measured RL vibration. DBM: basilar membrane displacement; DOHC: outer hair cell-driven reticular lamina displacement. (G) Diagrams of time waveforms of the BM and RL vibration at an intermediate sound pressure level at 26 kHz.
Figure 6
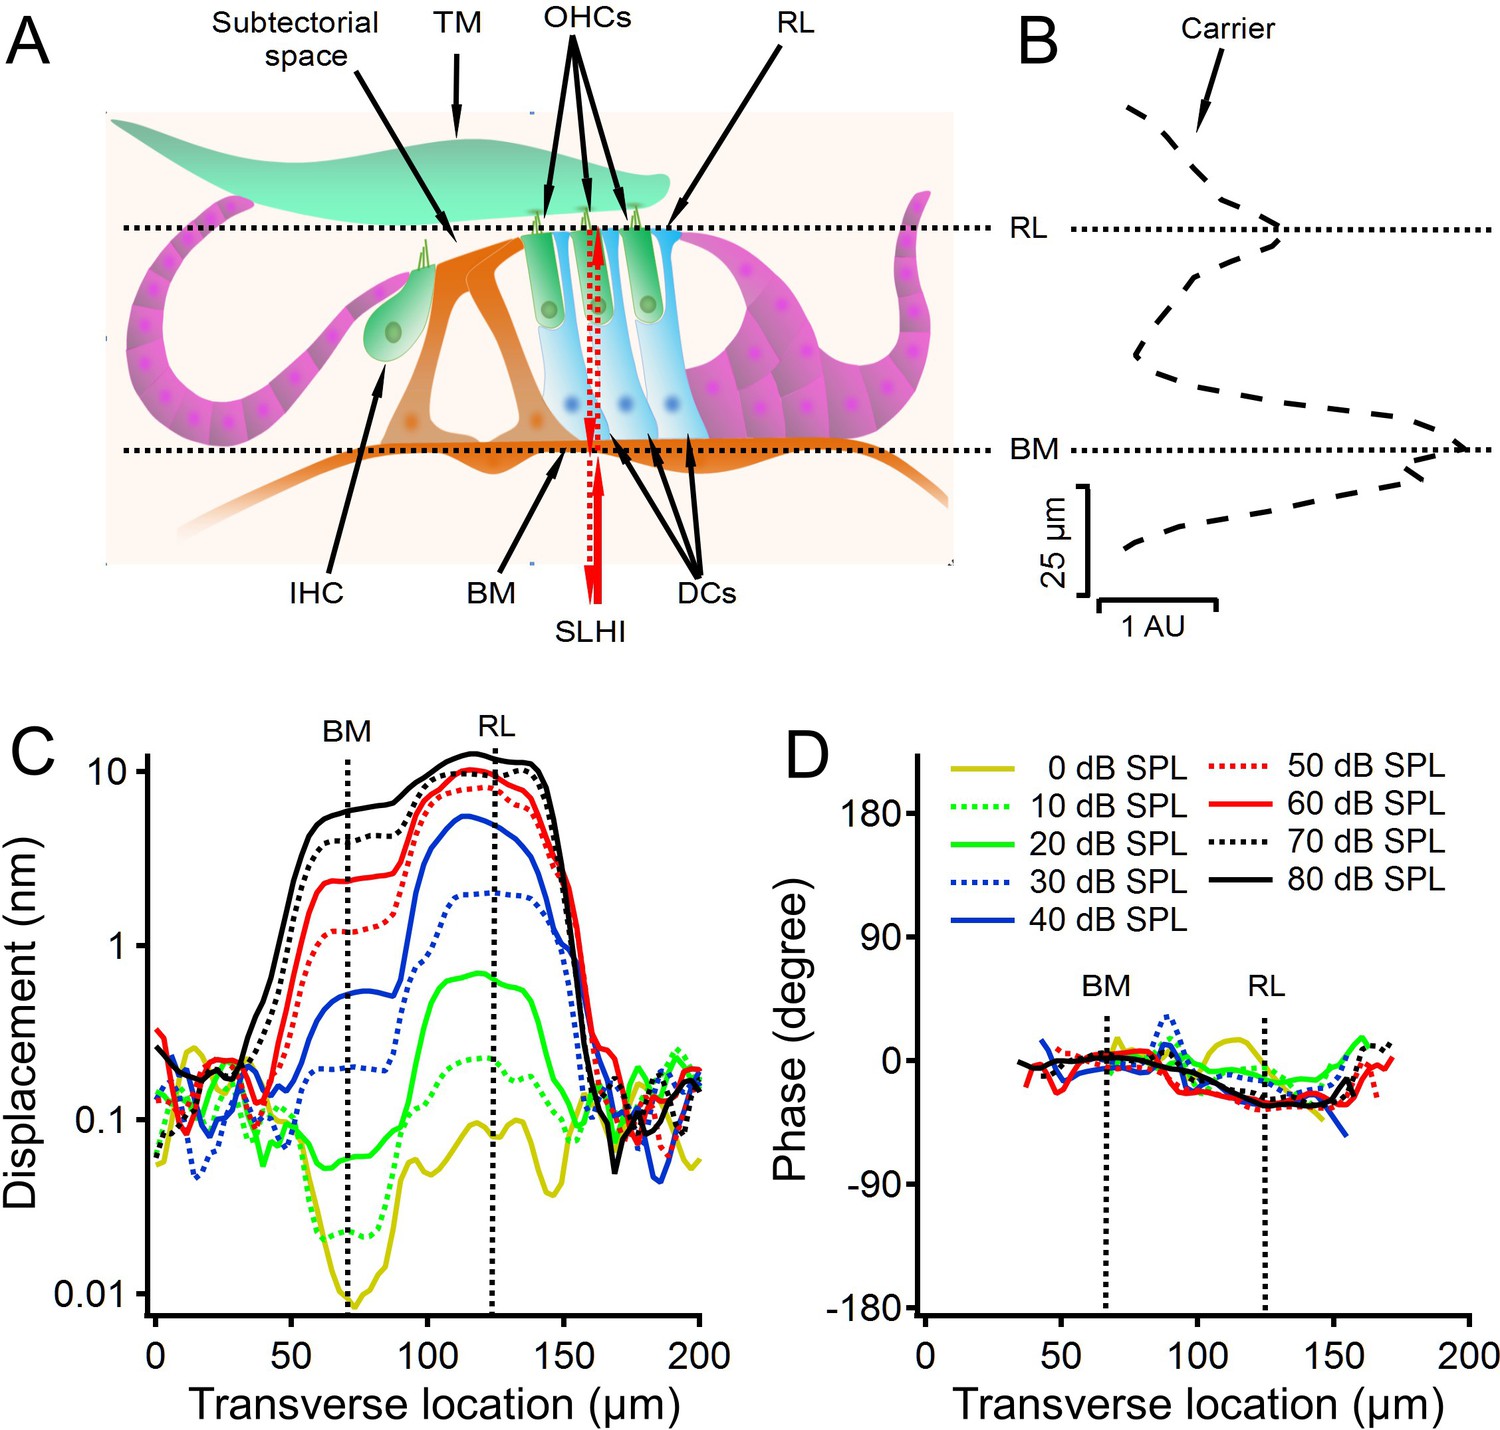
Diagram of a cross section of the organ of Corti and the cochlear partition vibration as a function of the transverse location.
(A) Diagram of a cross section of the organ of Corti. TM, tectorial membrane; OHCs, outer hair cells; RL, reticular lamina; IHC, inner hair cell; BM, basilar membrane; DCs, Deiters' cells. SLHI, scanning low-coherence heterodyne interferometer. Red arrowed lines indicate incident and backscattered low-coherence lights. (B) The backscattered light level (carrier) as a function of the transverse location shows two peaks at locations on the BM and RL. (C) Displacement as a function of the transverse location at different sound levels. Displacements at the RL location are greater and show more compressive growth with sound level than those at the BM location. Line types and colors in this plot are the same as those in panel D. (D) Phase decreased slightly at the RL location. Data were collected from a sensitive gerbil cochlea from the basal turn with best frequency 30 kHz. Due to the extremely low reflectivity of perilymph, the noise level outside the cochlear partition is higher than low-level tone-induced vibrations at the RL and BM location in panel C.
Additional files
-
Transparent reporting form
- https://doi.org/10.7554/eLife.37625.009
Download links
A two-part list of links to download the article, or parts of the article, in various formats.
Downloads (link to download the article as PDF)
Open citations (links to open the citations from this article in various online reference manager services)
Cite this article (links to download the citations from this article in formats compatible with various reference manager tools)
Timing of the reticular lamina and basilar membrane vibration in living gerbil cochleae
eLife 7:e37625.
https://doi.org/10.7554/eLife.37625


