Inhibiting the integrated stress response pathway prevents aberrant chondrocyte differentiation thereby alleviating chondrodysplasia
- University of Hong Kong, China
- University of Kyoto, Japan
- The University of Texas at Dallas, United States
- Tsinghua University, China
Figures
Figure 1 with 3 supplements
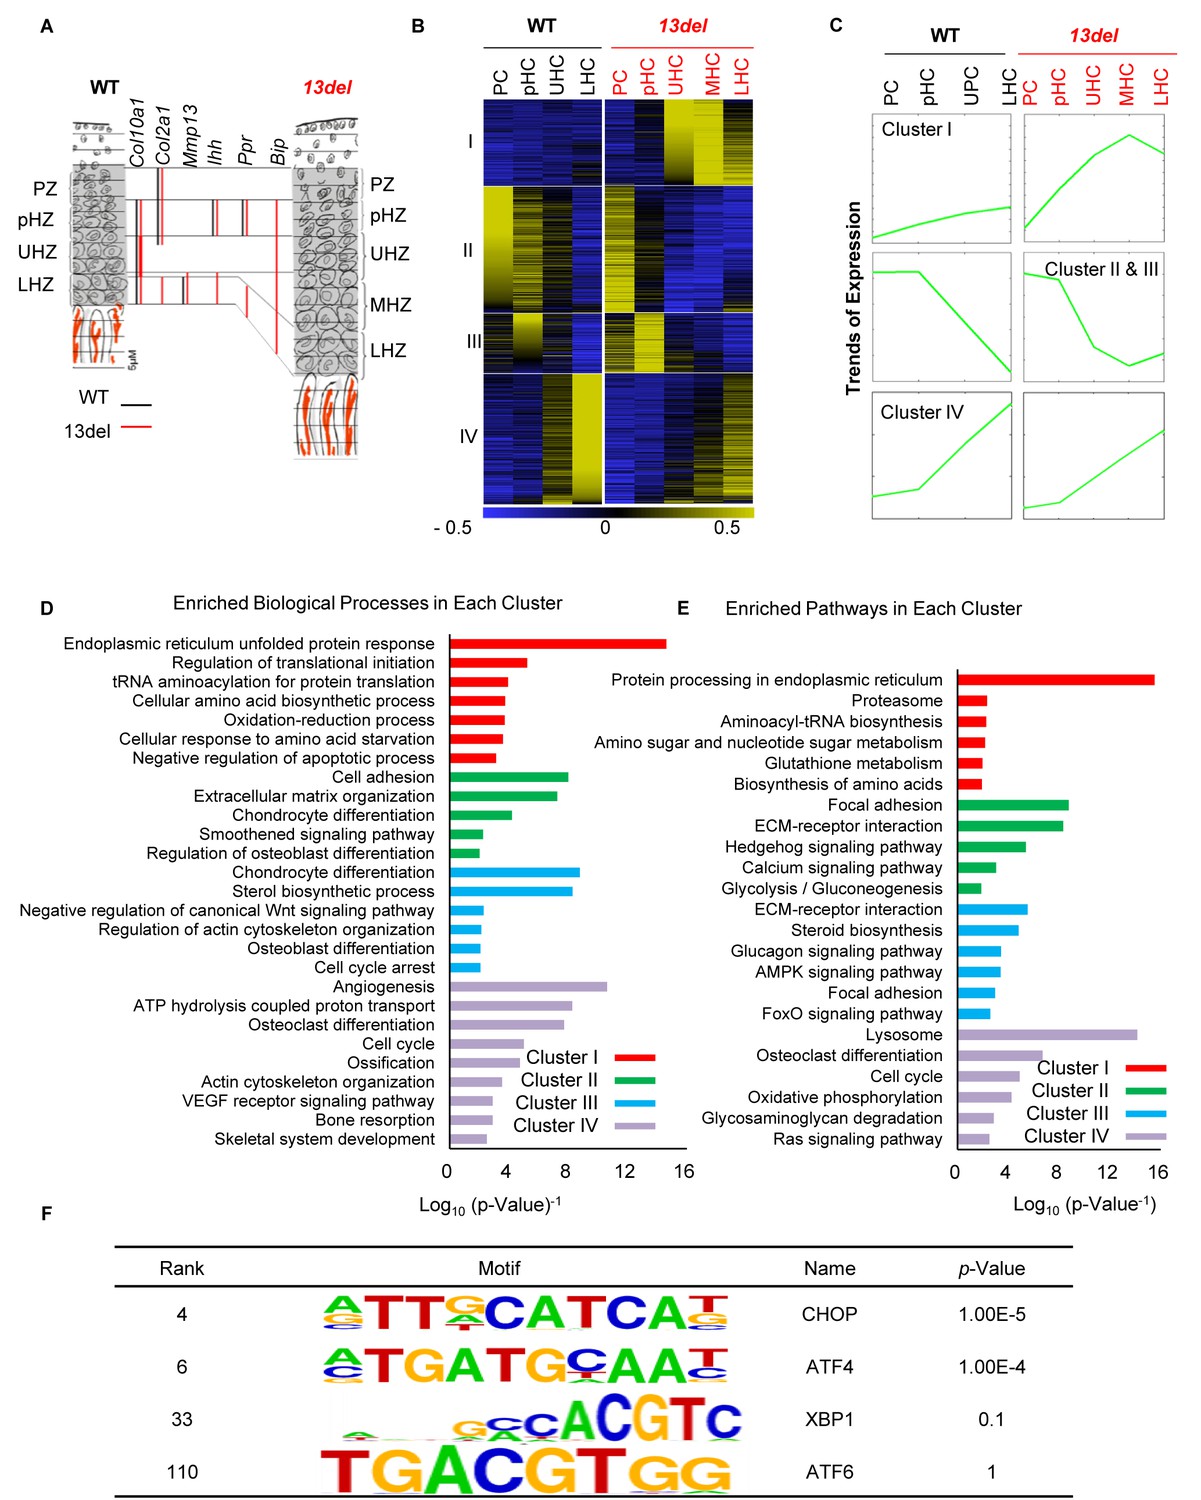
PERK signaling pathway, activated by ER stress, plays an etiological role in MCDS 13del mice.
(A) Schematic diagram of the rationale for fractionating the WT and 13del p10 growth plates into different chondrocyte populations. (B) Clustering analysis of differentially expressed genes in chondrocyte subpopulations in p10 WT and 13del proximal tibial growth plates. Expression levels were normalized from −0.5 (blue) to 0.5 (yellow). Four major clusters were identified. (C) The average expression levels (Log2 scale) of the genes in different clusters revealed significant expression pattern changes in 13del mice. (D–E) Genes in different clusters were functionally categorized using DAVID web tools. The enriched biological processes (D) and enriched pathways (E) were sequentially shown for Cluster I, II, III and IV. The values on the X-axis represented the Log10 (p-value−1). Each category with p-value <0.05 was considered as significantly enriched. (F) Enriched motifs on Cluster I genes were identified, using sequences of the promoter region (±2 kb from the TSS) for these genes. Motifs matched to the TFs in the UPR were shown.
Figure 1—figure supplement 1
Transcriptome analyses of 13del chondrocytes.
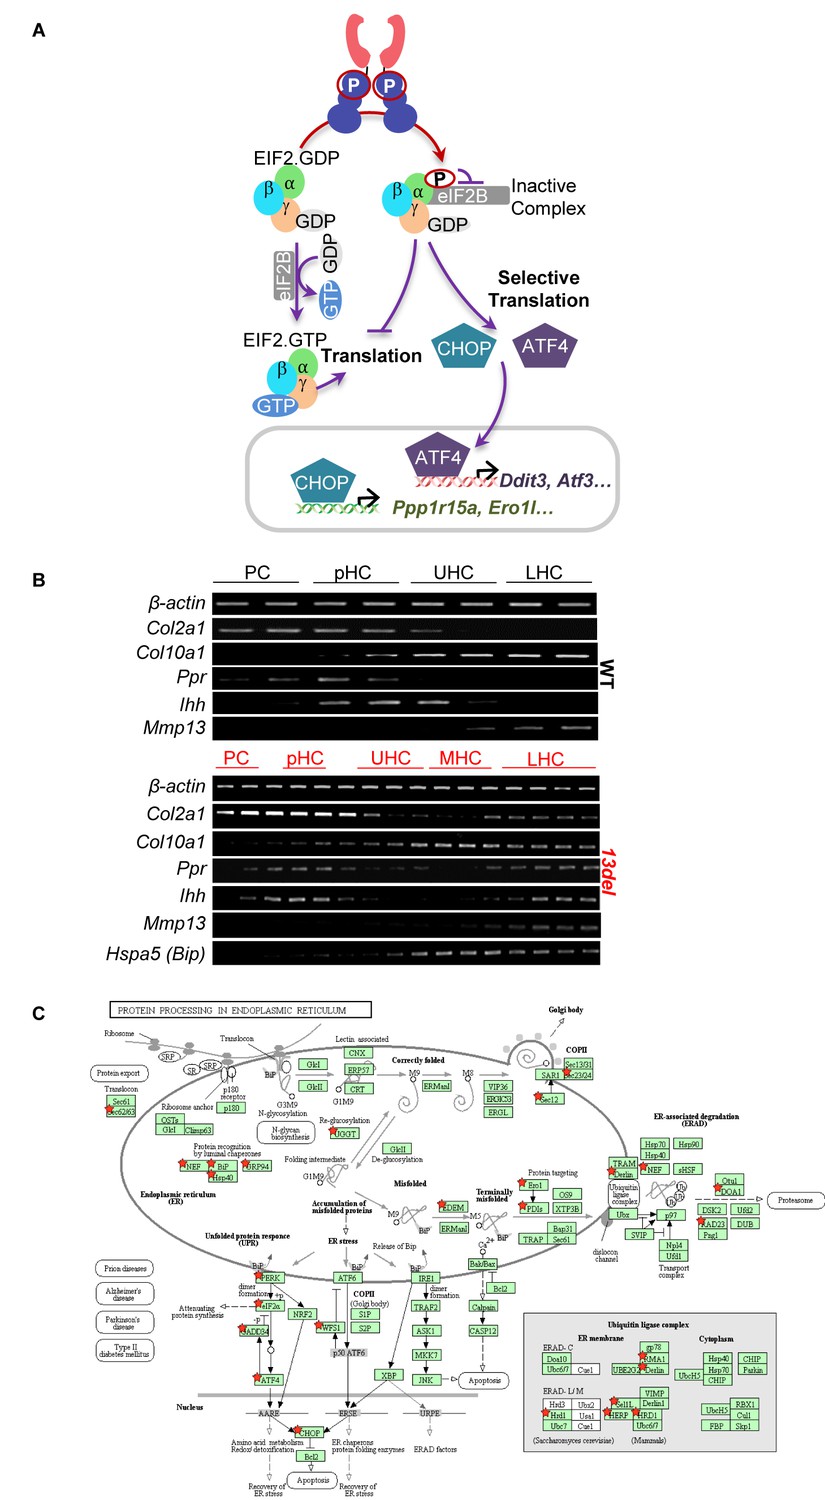
(A) Schematic diagram of PERK signaling pathway activation under ER stress. (B) The rationale for fractionating the WT and 13del p10 growth plates into different chondrocyte populations, based on the expression patterns of chondrogenic markers (Col2a1, Ihh, Ppr, Col10a1 and Mmp13) and ER stress marker (Hspa5). (C) PERK signaling and XBP1S regulating ERAD signaling pathway are highly enriched in KEGG pathway of protein processing in the endoplasmic reticulum in Cluster I. Red stars indicate the mapped genes in this cluster.
Figure 1—figure supplement 2
Activation of PERK pathway in 13del Mice.
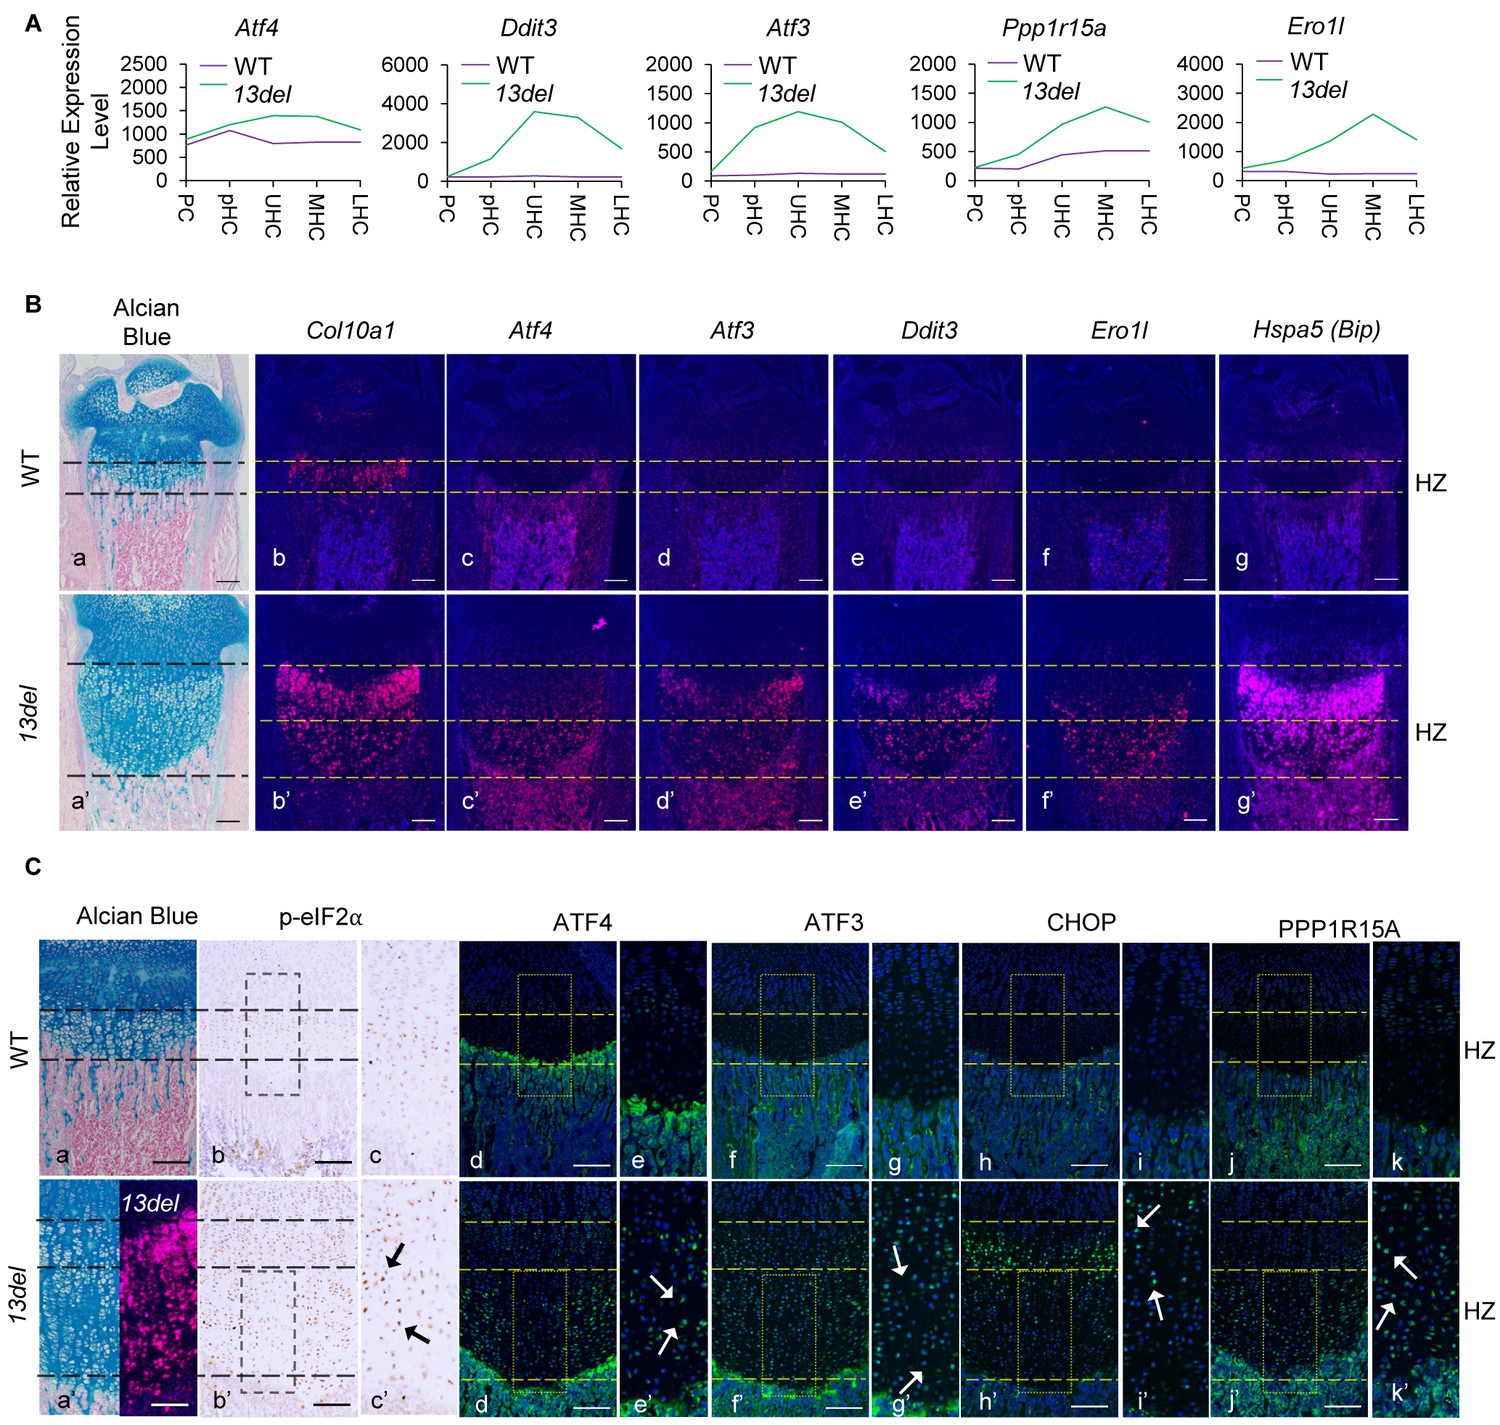
Normalized microarray measurements of major components involved in PERK pathway (Atf4, Ddit3, Atf3, Ppp1r15a and Ero1l) in each zone of WT and 13del growth plates. (B) Histology (a, a’) and gene expression analysis of Atf4 (c, c’), Atf3 (d, d’), Ddit3 (e, e’) and Ero1l (f, f’) by radioactive in-situ hybridization on the wild-type and 13del growth plates at p10 stage (Bar = 200 μm). Hypertrophic chondrocytes are specifically marked by Col10a1 (b, b'). ER-stressed hypertrophic chondrocytes are marked by Hspa5 (g, g’). (C) In vivo validation of p-eIF2α (b, b’, c, c’), ATF4 (d, d’, e, e’), ATF3 (f, f’, g, g’), CHOP (h, h’, i, i’) and PPP1R15A (j, j’, k, k’) by immuno-staining on WT and 13del growth plates at P10 stage. Higher magnification of the boxed region was shown to demonstrate the differential expression of these factors and the positive staining cells were indicated by arrows. (Scale Bar = 200 μm).
Figure 1—figure supplement 3
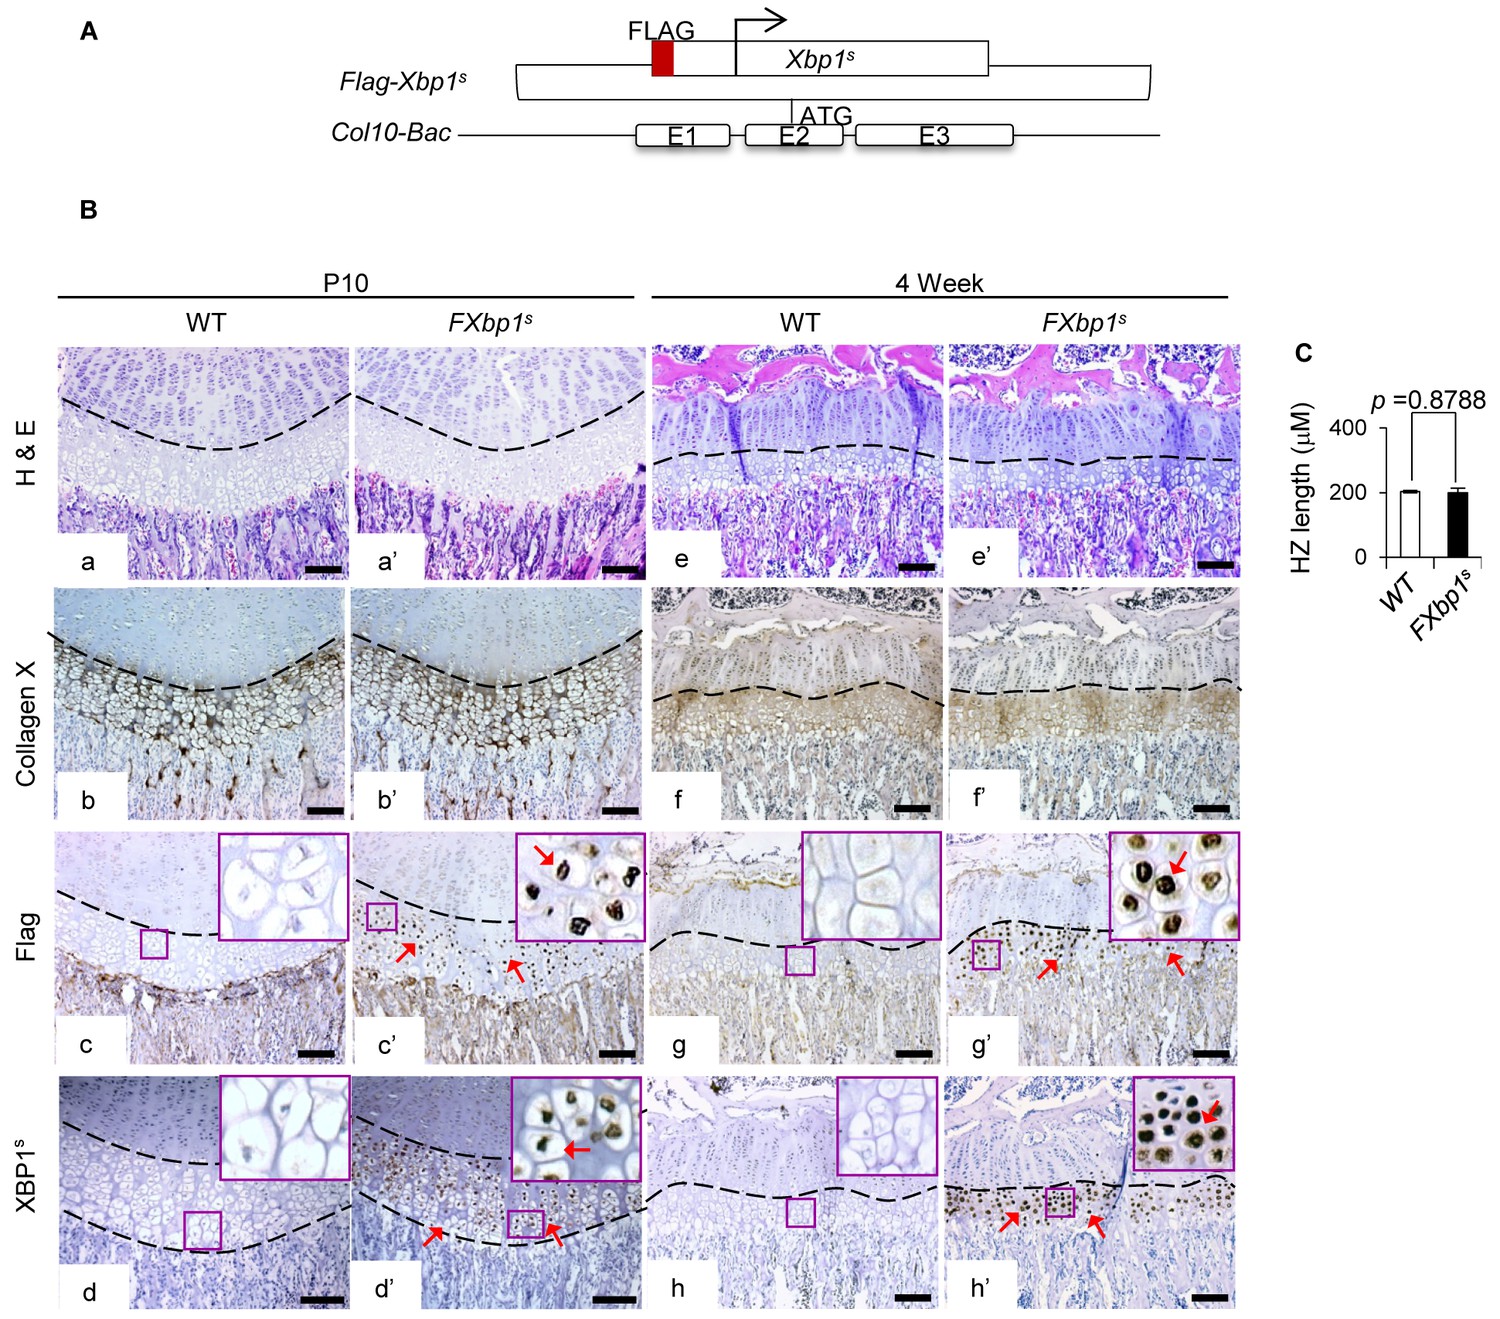
Ectopic expression of XBP1s in HCs does not cause any abnormalities in growth plates.
(A) Scheme of XBP1s (spliced form) overexpressing construct, together with FLAG-tag, for generation of FXbp1s transgenic mice. (B) Hematoxylin and eosin staining (a, a’, e, e’) and immunochemistry of COL10A1 (b, b’, f, f’), FLAG (c, c’, g, g’) and XBP1s (d, d', h, h') were applied to compare the growth plate phenotypes between WT and FXbp1s transgenic mice at P10 and 4 week stages. Higher magnification of the boxed region was shown to demonstrate the differential expression of FLAG and XBP1s and the positive staining cells were indicated by arrows. (Scale Bar = 100 μm) (C) Measurement of HZ length of WT and FXbp1s at p10 stage (n = 3). The vertical length of the central part of the HZ from 10 different sections of each mouse was averaged. Error bars were shown as S.D. and significance was determined by Two-tailed Mann-Whitney U-test. N.S.: p-value>0.05.
Figure 2 with 1 supplement
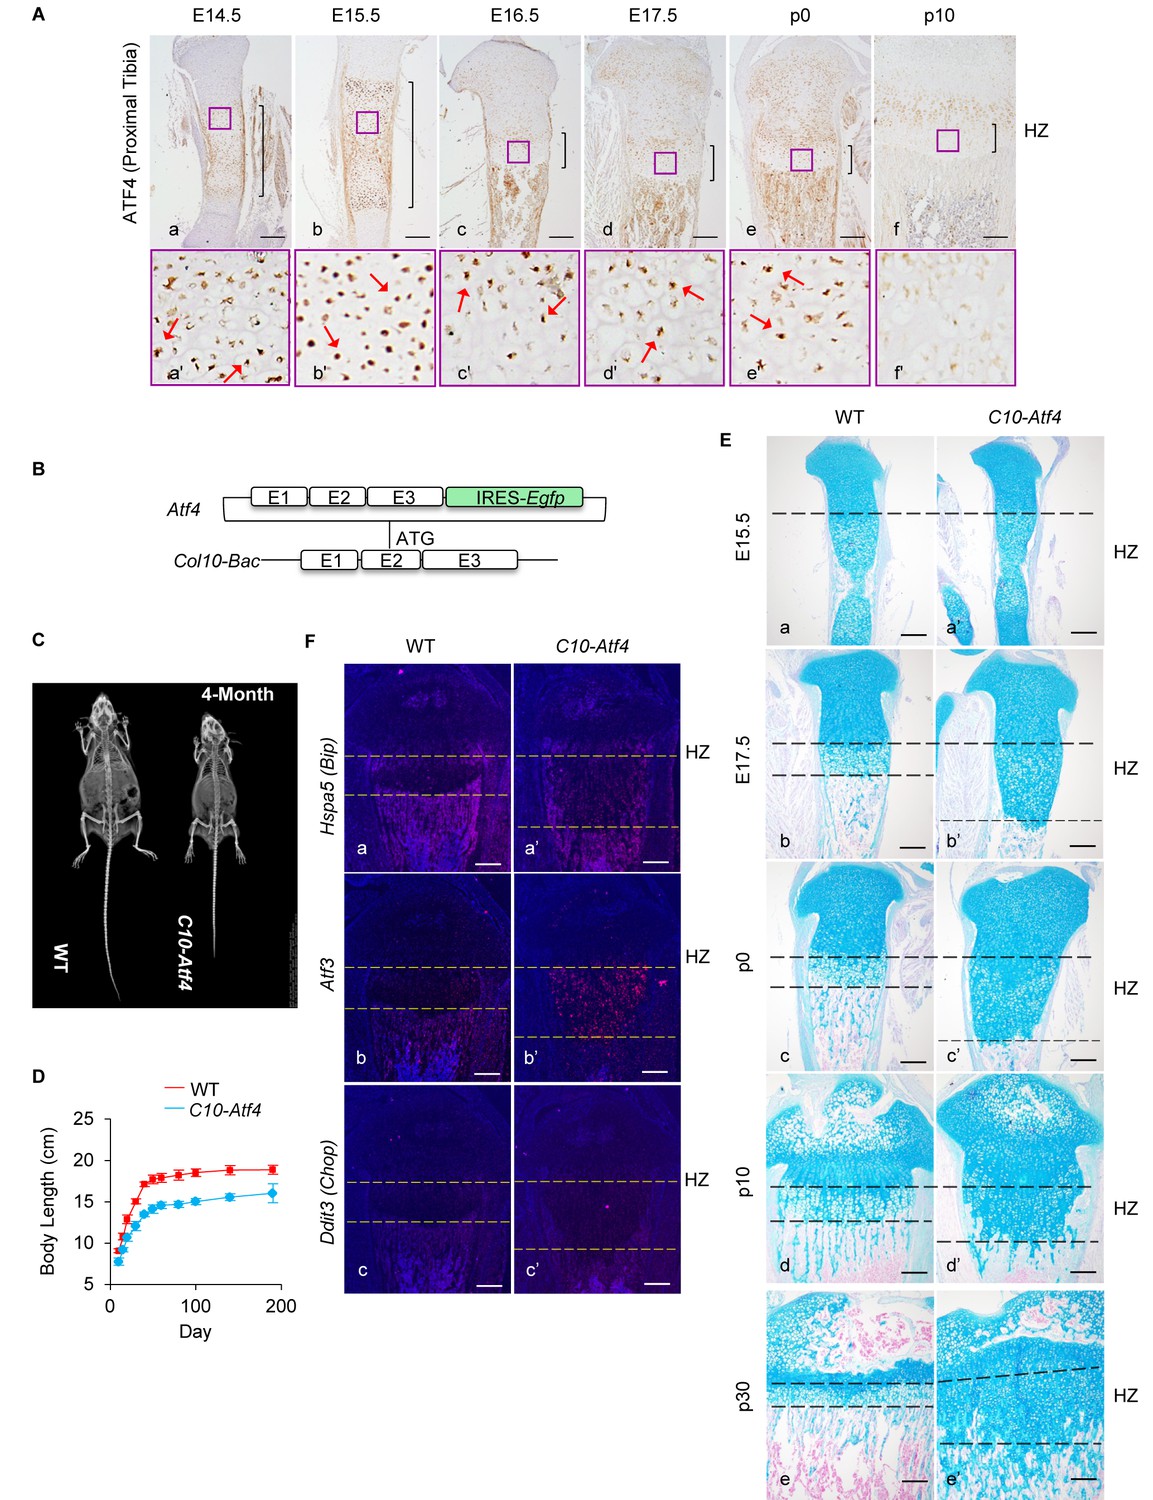
Ectopic activation of ATF4 in HCs recaptures the phenotypes of 13del mice.
(A) Expression profiles of ATF4 (a–f) on the WT growth plates from E14.5 to P10 stages. Higher magnification of the boxed region (a'–f') was shown to demonstrate the differential expression of ATF4 and the positive cells were arrowed. (Scale Bar = 200 μm) (B) Scheme of Atf4 expressing vector. Atf4 cDNA is inserted after the ATG codon in exon 2 of the Col10a1-Bac followed by an IRES-Egfp cassette. (C) Radiographic analysis revealed the dwarfism and skeletal abnormality of C10-Atf4 mice at 4-month-old stage (n = 3). (D) Body lengths of the WT (n = 9) and C10-Atf4 (n = 7) littermates were monitored from birth to 30-week stage, and a consistent reduction of body length in C10-Atf4 mice was observed. (E) Abnormal proximal tibial growth plates with expanded HZ, delimited by dotted lines, were observed in C10-Atf4 mice by Alcian Blue staining. (Scale bar = 200 μm). (F) Ectopic expression of Atf4 in HCs was insufficient for ER stress response induction, indicated by in-situ hybridization of ER stress markers (Hspa5, Atf3 and Ddit3). (Scale bar = 200 μm).
Figure 2—figure supplement 1
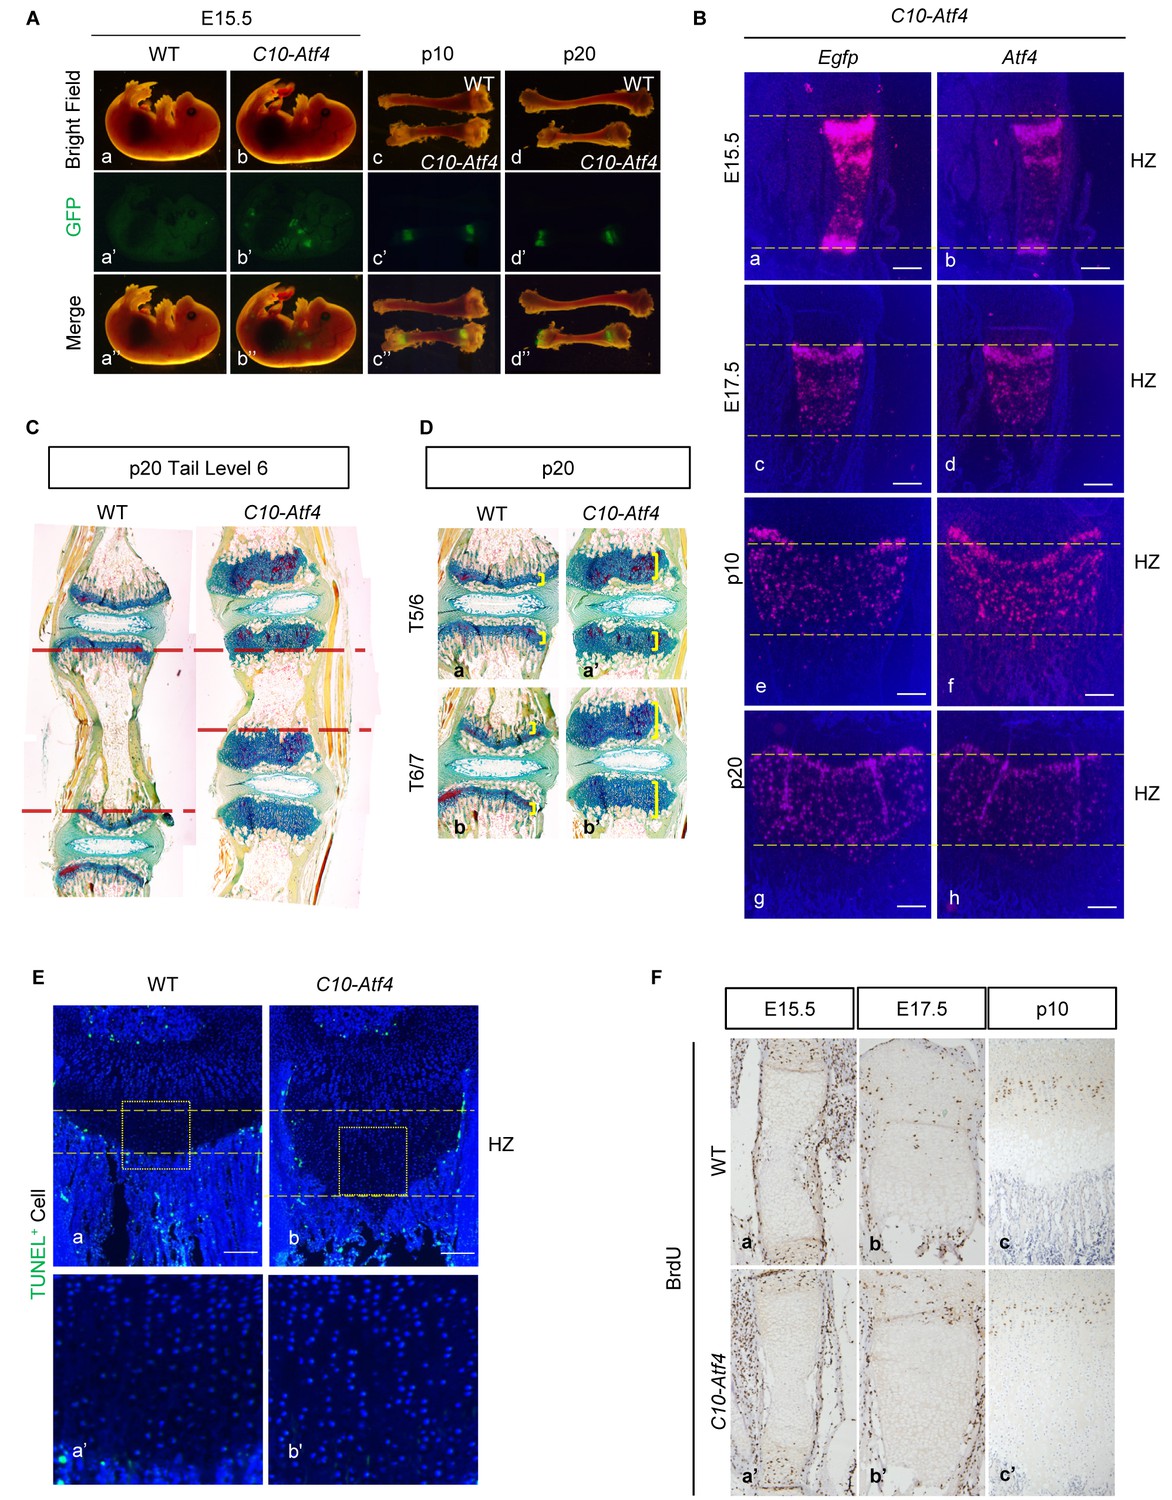
C10-Atf4 transgene is specifically expressed in HCs, and ectopic expression of Atf4 in HCs does not induce cell apoptosis.
(A–B) Expression specificity of the C10-Atf4 transgene was determined by EGFP visualization in developing growth plates (a), and validated by expression profiling of Egfp (a, c, e and g) and Atf4 (b, d, f and h) in C10-Atf4 growth plates at different stages (b). (Scale Bar = 200 μm) (C) FAST staining showing the shortening of axial skeleton in C10-Atf4 mice comparing to WT mice at P20 stage. (D) FAST staining showing the expansion of HZ in the growth plates of axial skeleton in C10-Atf4 mice comparing to WT mice at P20 stage. (E) Ectopic expression of ATF4 does not cause cell death (Scale Bar = 200 μm). (F) Comparison of cell proliferation in WT and C10-Atf4 growth plates by BrdU labeling assay. Mice at E15.5 (a and a’), E17.5 (b and b’) and P10 (c and c’) were injected with a single dose of BrdU and sacrificed 2 hr later for analyses.
Figure 3 with 1 supplement
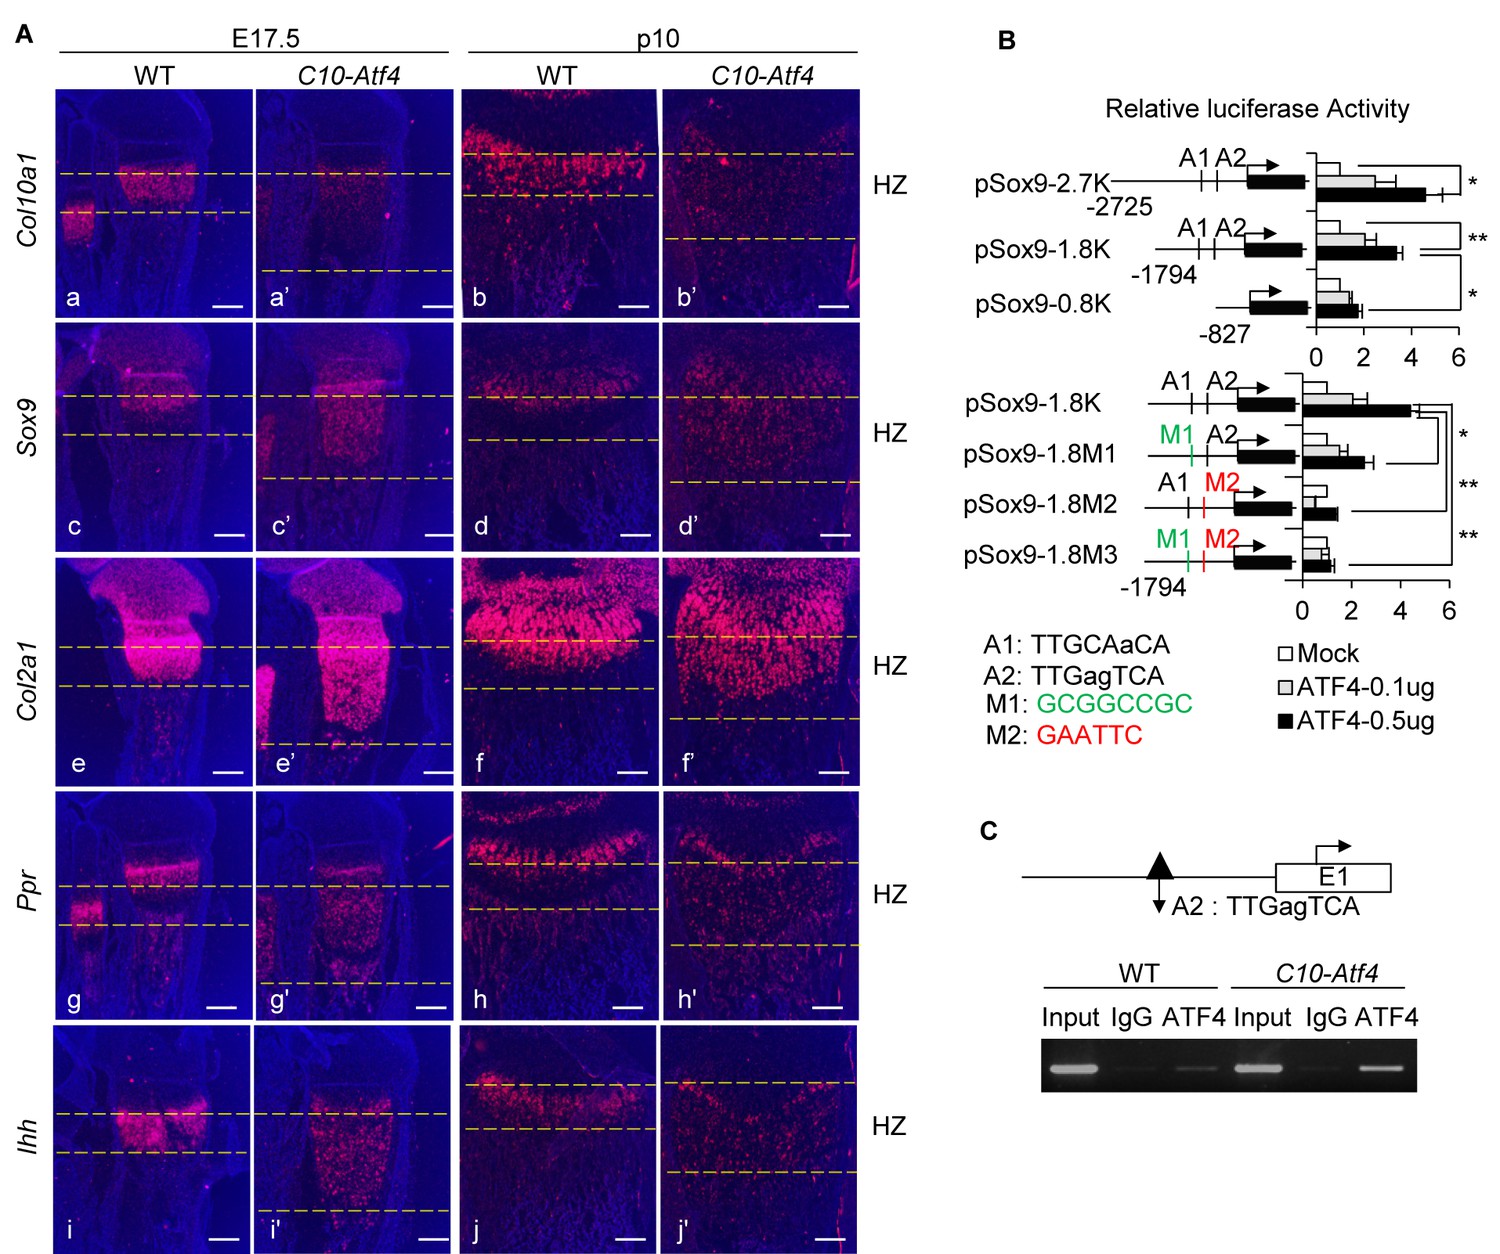
ATF4 governs de-differentiation of HCs via direct regulation of Sox9.
(A) Ectopic expression of Atf4 in HCs leads to accumulation of premature chondrocytes in C10-Atf4 HZ, indicated by expression patterns of chondrogenic markers Col10a1 (a, a’, b, b’), Sox9 (c, c’, d, d’), Col2a1 (e, (e’, f, f’), Ppr (g, g’, h, h’) and Ihh (i, (i’, j, j’) (Scale bar = 200 μm). (B) Luciferase activities of reporters driven by Sox9 promoter with different lengths (pSox9-2.7K, pSox9-1.8K, and pSox9-0.8K) (i) or ATF4 putative binding sites mutants (pSox9-1.8M1, pSox9-1.8M2 and pSox9-1.8M3) (ii) responding to different dosages of ATF4 were measured in ATDC5 cells and results were presented as fold induction compared with mock-transfected cells from three independent experiments. Error bars were shown as S.D. and significance was determined by unpaired Two-tailed Student’s t-test. *: p-value<0.05, **: p-value<0.005, ***: p-value<0.0005. (C) ChIP-PCR showed the direct binding of ATF4 to the putative motif on the Sox9 promoter in vivo, using the nuclear extracts from E15.5 WT and C10-Atf4 limb chondrocytes. Three independent experiments were performed and one presentative result was shown. An ATF4 ChIP-seq peak (dark triangle) around this region has been identified in ER-stressed MEF cells.
Figure 3—figure supplement 1
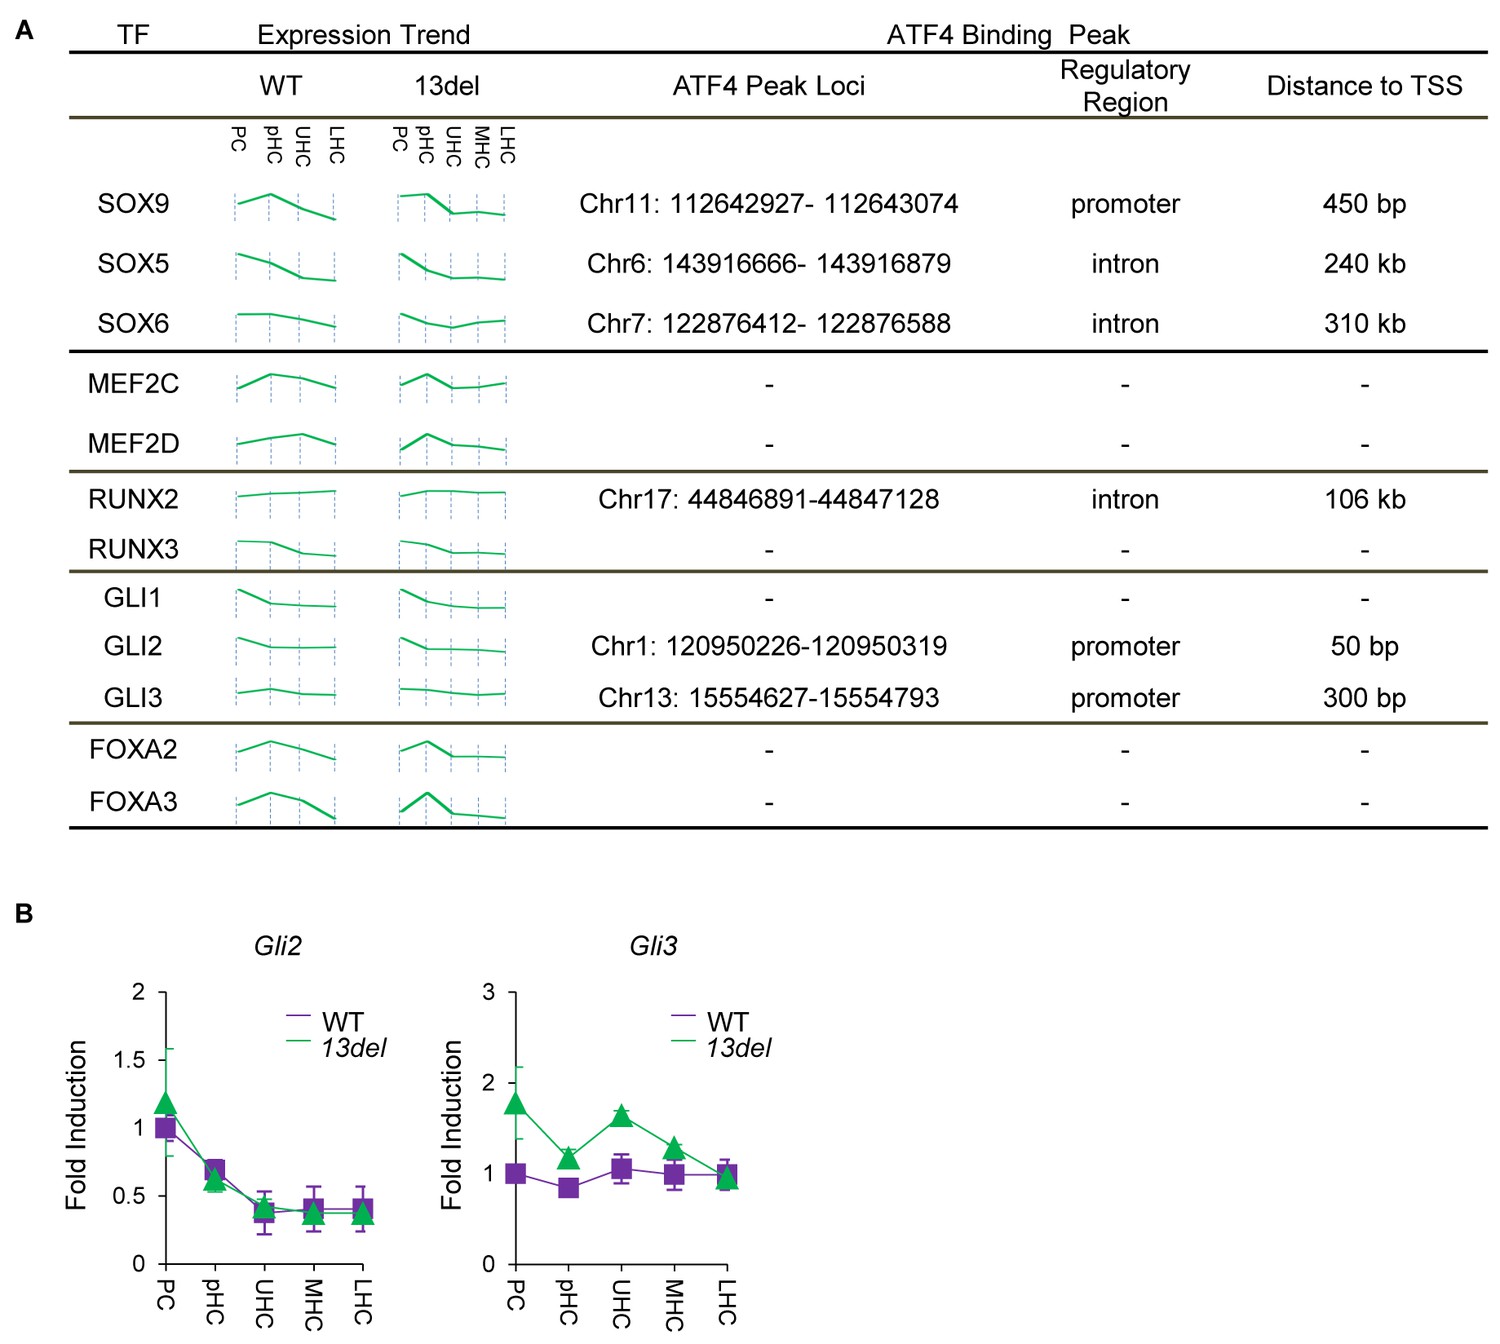
Presentation of ATF4 ChIP peaks on regulatory region of vital chondrogenic transcriptional factors.
(A) Presentation of ATF4 ChIP peaks on the regulatory region (±2 kb from TSS) of SOX, MEF2, RUNX, GLI and FOXA family members. The expression trend of these factors in WT and 13del chondrocytes was measured by normalized microarray expression profile. (B) Validation of the microarray expression of Gli2 and Gli3 by qRT-PCR.
Figure 4 with 1 supplement
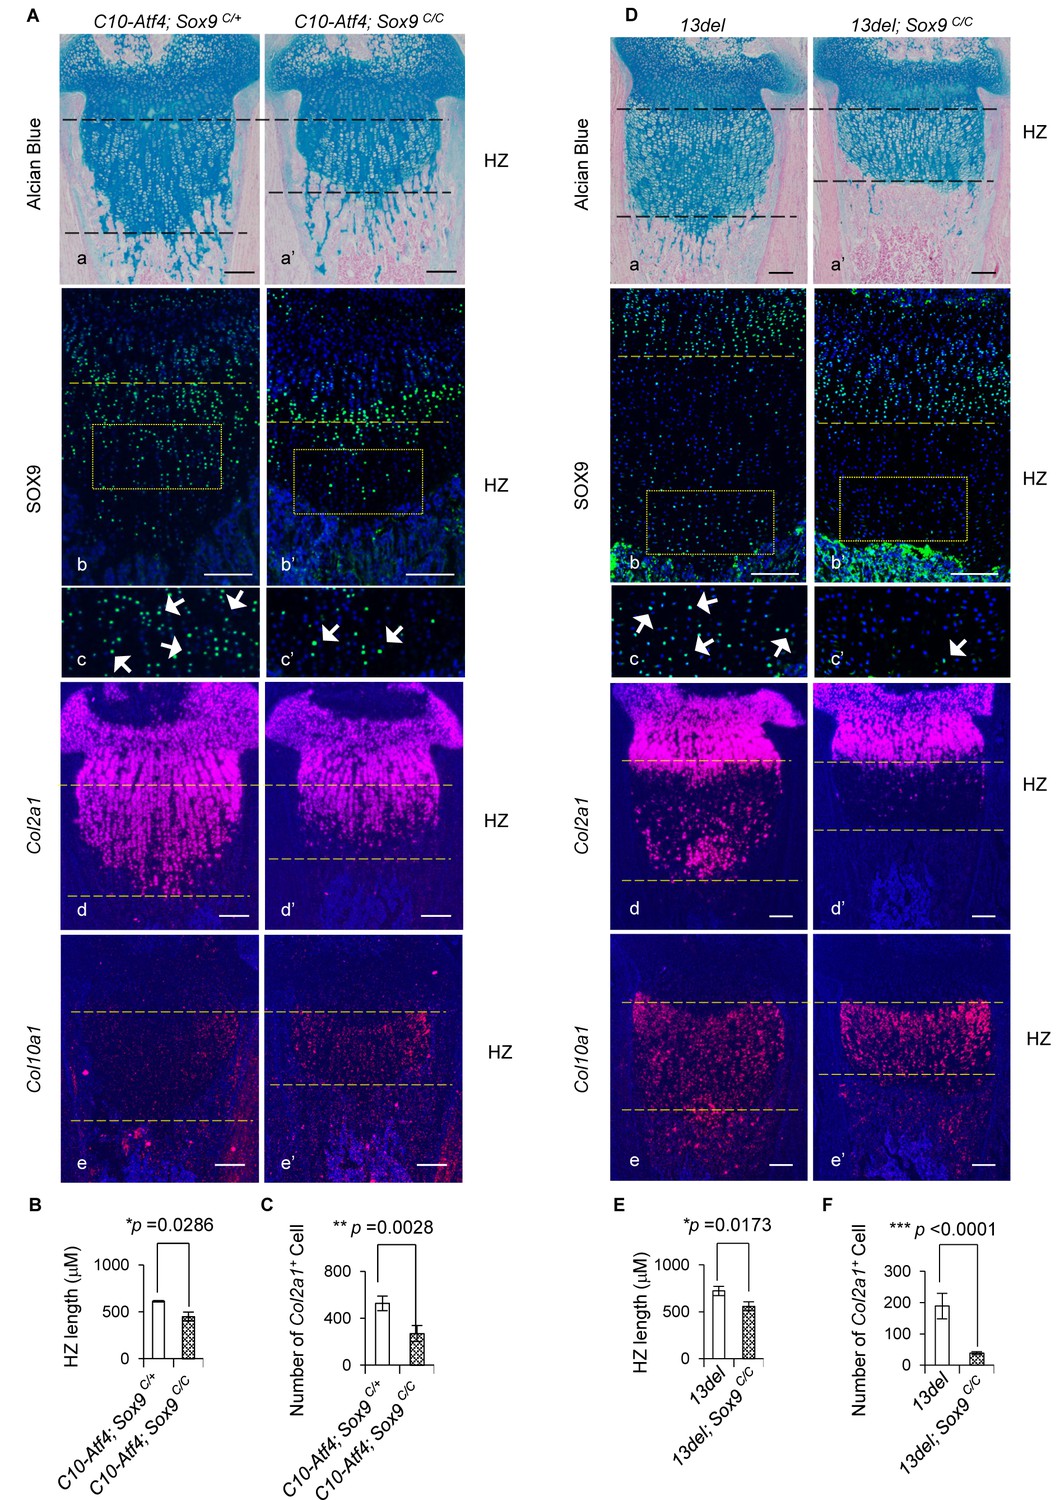
Genetic rescue of growth plate abnormalities in C10-Atf4 and 13del mice via HC-specific inactivation of Sox9.
(A) Removal of Sox9 in C10-Atf4 HCs rescued growth plate abnormalities of C10-Atf4 mice at p10 stage, shown by histology (a, a’), expression analyses of SOX9 (b, b’, c, c’), Col2a1 (d, d’) and Col10a1 (e, e'). Higher magnification of the boxed region was shown to demonstrate the differential expression of SOX9 and the positive cells were indicated by arrows. (Scale bar = 200 μm). (B) Measurement of the HZ lengths of C10-Atf4 and C10-Atf4;Sox9C/C littermates (n = 5). The vertical length of the central part of the HZ from 10 different sections of each mouse was averaged. (C) Quantification of Col2a1 positive cells in HZ of C10-Atf4 and C10-Atf4; Sox9C/C littermates (n = 5). For each mouse, the number of positive cells was counted and average on five non-adjacent sections. (D) Removal of Sox9 in 13del HCs rescued growth plate abnormalities of 13del mice at p10 stage (n = 5), shown by histology (a, a’), expression analyses of SOX9 (b, b’, c’, c’), Col2a1 (d, d’) and Col10a1 (e, e'). Higher magnification of the boxed region was shown to demonstrate the differential expression of SOX9 and the positive cells were arrowed. (Scale Bar = 200 μm). (E) Measurement of the HZ lengths of 13del and 13del;Sox9C/C littermates (n = 5). The vertical length of the central part of the HZ from 10 different sections of each mouse was averaged. (F) Quantification of Col2a1 positive cells in HZ of 13del and 13del;Sox9C/C littermates (n = 5). For each mouse, the number of positive cells was counted and average on five non-adjacent sections. Error bars were shown as S.D. and significance was determined by Two-tailed Mann-Whitney U-test. *: p-value<0.05, **: p-value<0.005, ***: p-value<0.0005.
Figure 4—figure supplement 1
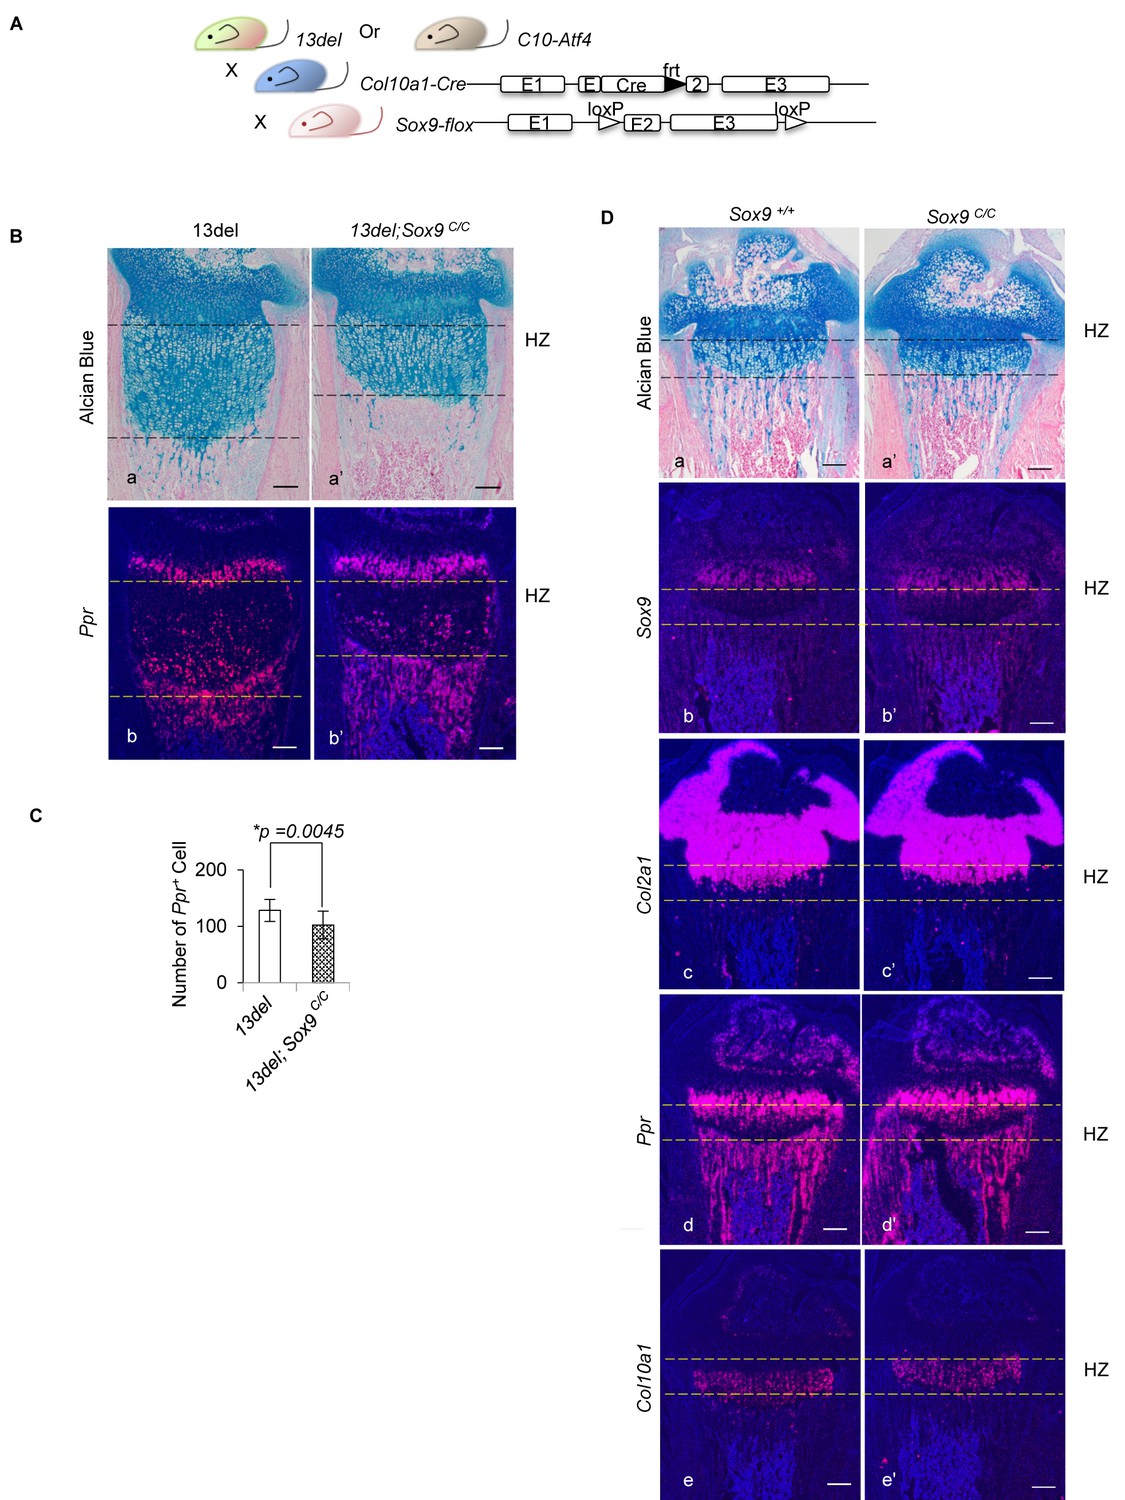
Removal of SOX9 in HCs does not cause any abnormalities in growth plates in WT mice but reduces the number of immature HCs in 13del mice.
(A) Schematic diagram of the generation of C10-Atf4;Sox9C/C and 13del;Sox9C/C mice, by using HC-specific Col10a1-Cre. (B–C) Genetic inactivation of Sox9 in 13del HCs leads to reduced number of Ppr+ HCs at the p10 stage. (n = 5). For each mouse, the number of positive cells was counted and averaged on five non-adjacent sections. Error bars were shown as S.D. and significance was determined by Two-tailed Mann-Whitney U-test. *: p-value<0.05. (D) Ablation of Sox9 in WT HCs does not cause any abnormality at p10 stage, shown by histology (a, a’) and expression profiles of Sox9 (b, b’), Col2a1 (c, c’), Ppr (d, d’) and Col10a1 (e, e’). (Scale Bar = 200 μm).
Figure 5 with 1 supplement
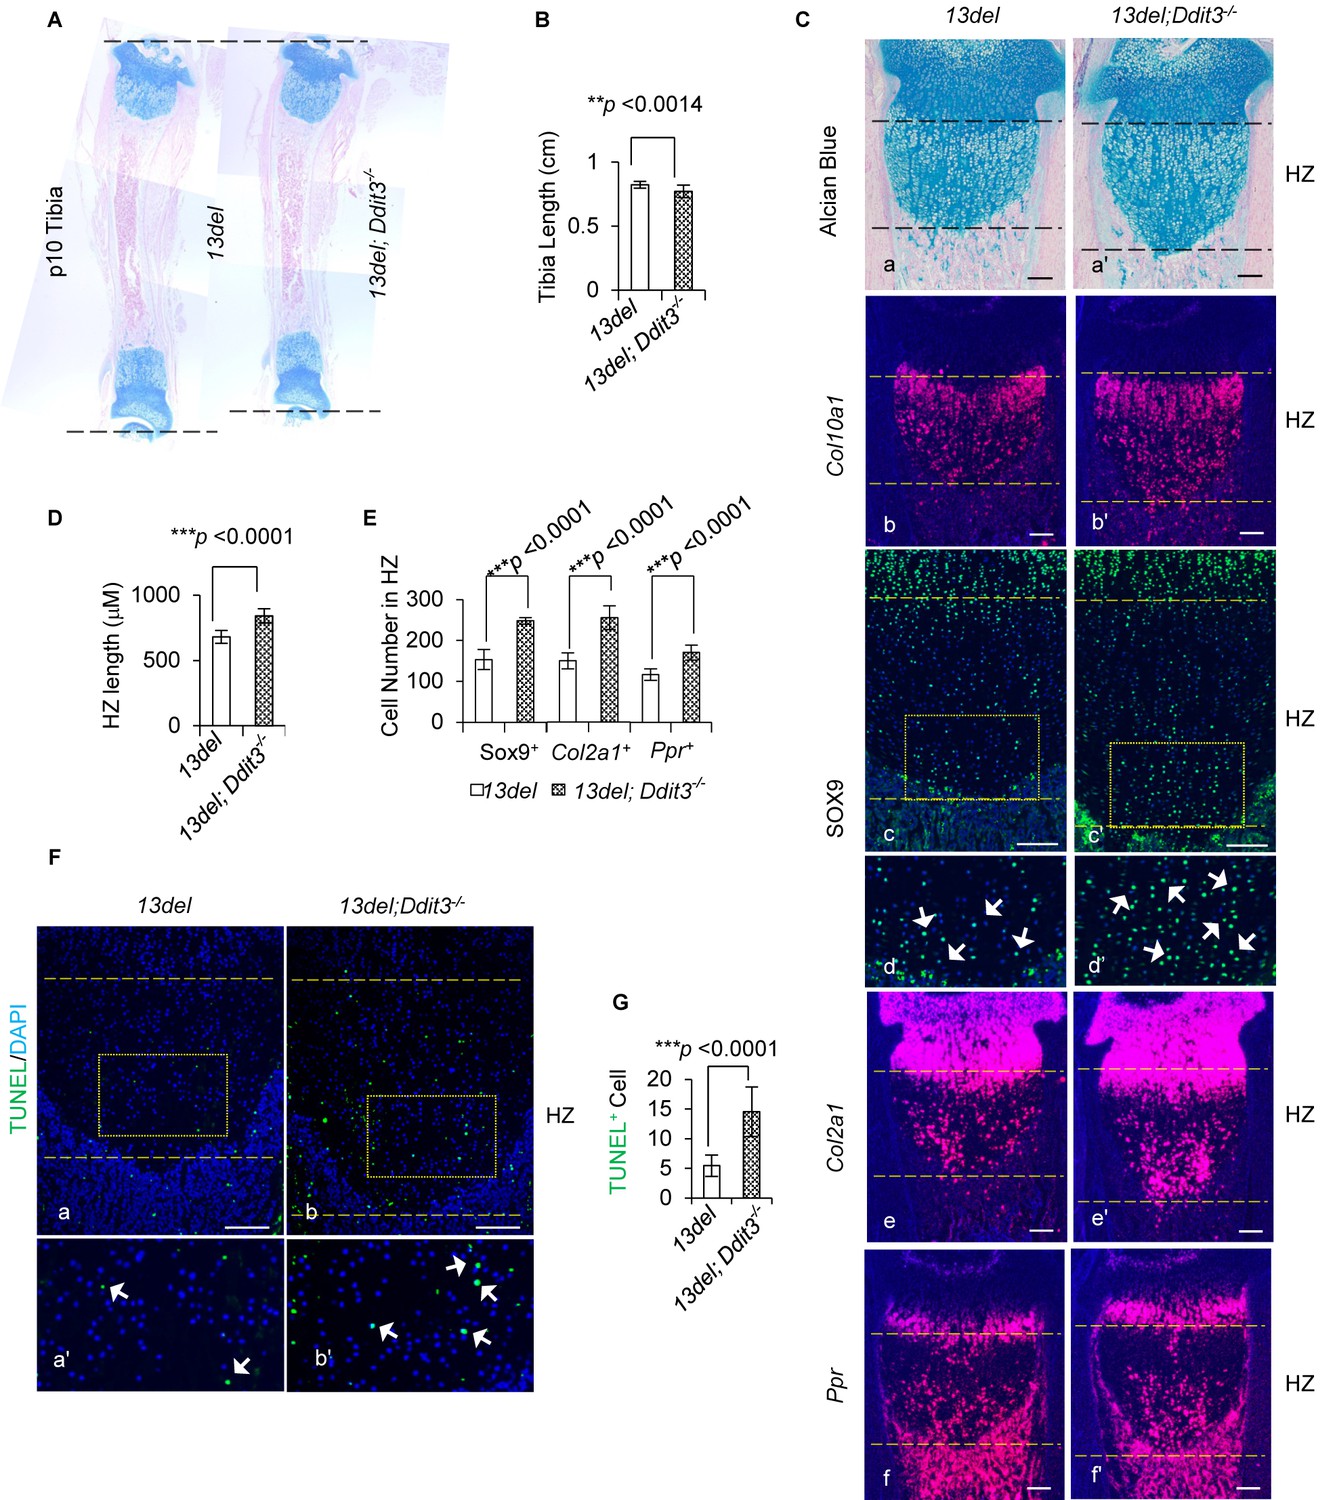
CHOP limits the deleterious consequence of ER Stress in 13del mice.
(A–B) The tibia length is further shortened in 13del;Ddit3-/- mice at the p10 stage. The comparison was performed between 13del and 13del;Ddit3-/- littermates (n = 5). (C) Exacerbated growth plate abnormalities were observed in 13del mice with global loss of Ddit3 at p10 stage (n = 5), shown by histology (a, a’), expression analyses of Col10a1 (b, b’), SOX9 (c, c’, d, d’), Col2a1 (e, e’) and Ppr (f, f'). Higher magnification of the boxed region was shown to demonstrate the differential expression of SOX9 and the positive cells were indicated by arrows. (Scale Bar = 200 μm) (D) Measurement of the HZ lengths of 13del and 13del;Ddit3-/- littermates (n = 5). The vertical length of the central part of the HZ from 10 different sections of each mouse was averaged. (E) Quantification of SOX9, Col2a1 and Ppr-positive cells in HZ of 13del and 13del;Ddit3 -/- littermates (n = 5). For each mouse, the number of positive cells was counted and average on five non-adjacent sections. (F–G) TUNEL assay revealed an increased number of apoptotic cells in 13del;Ddit3-/- HZ (n = 5). Arrows indicate TUNEL-positive cells. (Scale Bar = 200 μm). For each mouse, the number of positive cells was counted and average on five non-adjacent sections. Error bars were shown as S.D. and significance was determined by Two-tailed Mann-Whitney U-test. *: p-value<0.05, **: p-value<0.005, ***: p-value<0.0005.
Figure 5—figure supplement 1
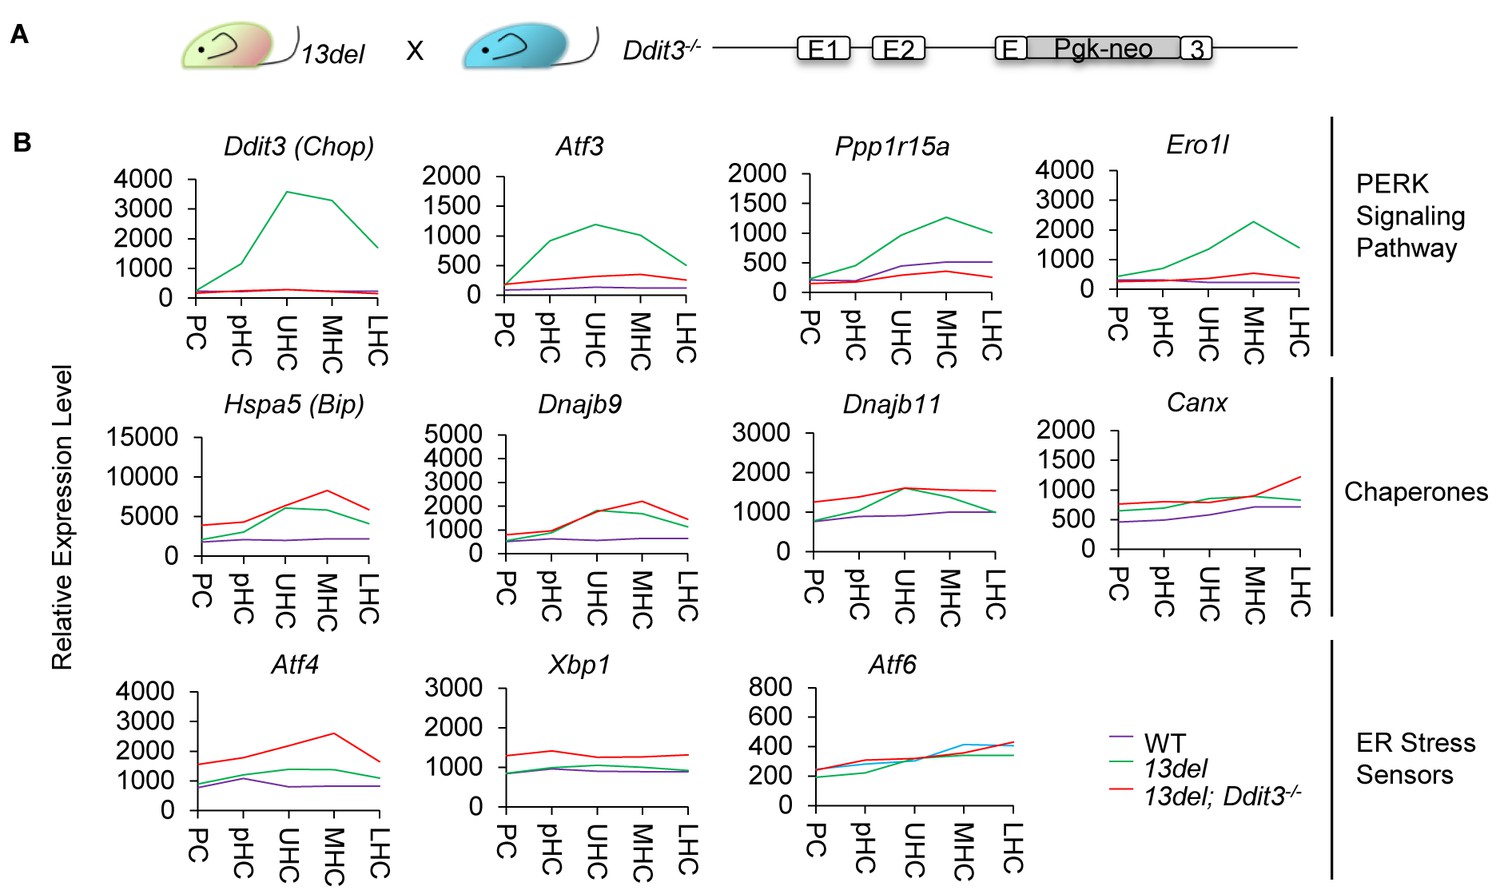
Impaired PERK signaling pathway results in elevated ER stress level in 13del;Ddit3-/- mice.
(A) Schematic diagram of the generation of 13del;Ddit3-/- mice. (B) Normalized microarray measurements of PERK signaling components (Ddit3, Atf3, Ppp1r15a and Ero1l), Chaperone (Hspa5, Dnajb9, Dnajb11 and Canx) and ER stress sensors (Atf4, Xbp1 and Atf6) in WT, 13del and 13del;Ddit3-/- mice at the p10 stage.
Figure 6 with 1 supplement
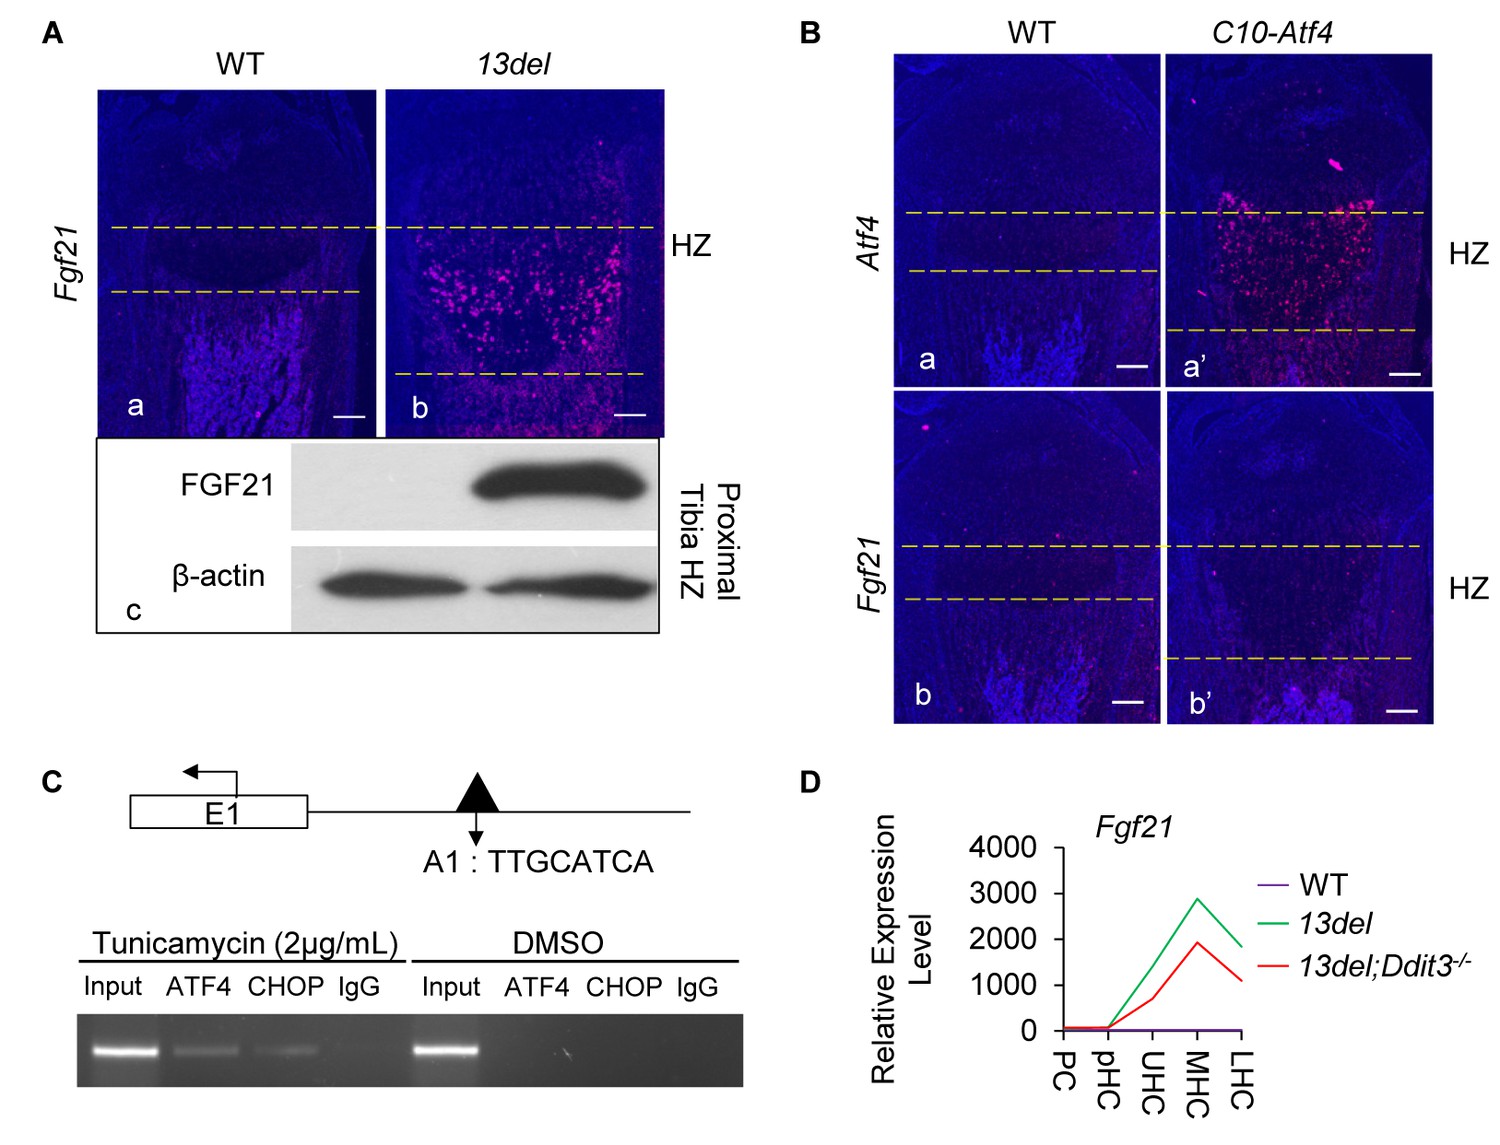
Fgf21 is regulated by ATF4 and CHOP.
(A) Significant activation of Fgf21 in 13del HCs at the p10 stage, revealed by in-situ hybridization (a, b) and western blot (c) (Scale Bar = 200 μm). (B) Ectopic expression of Atf4 (a, a’) is insufficient for Fgf21 (b, b’) induction in HCs (Scale Bar = 200 μm). (C) ChIP-PCR showed the binding of ATF4 and CHOP to the putative motif on the Fgf21 promoter under ER stress in NIH3T3 cells. (D) Normalized microarray measurement of Fgf21 in WT, 13del and 13del;Ddit3-/- chondrocytes. (E–F) FGF21 protects the 13del HCs from apoptosis in a dosage-dependent manner. Arrows indicate TUNEL-positive cells. The quantification of TUNEL positive cells was performed between littermates (n = 5). For each mouse, the number of positive cells was counted and averaged on five non-adjacent sections. (Scale Bar = 200 μm) Error bars were shown as S.D. and significance was determined by Two-tailed Mann-Whitney U-test. *: p-value<0.05, **: p-value<0.005, ***: p-value<0.0005.
Figure 6—figure supplement 1
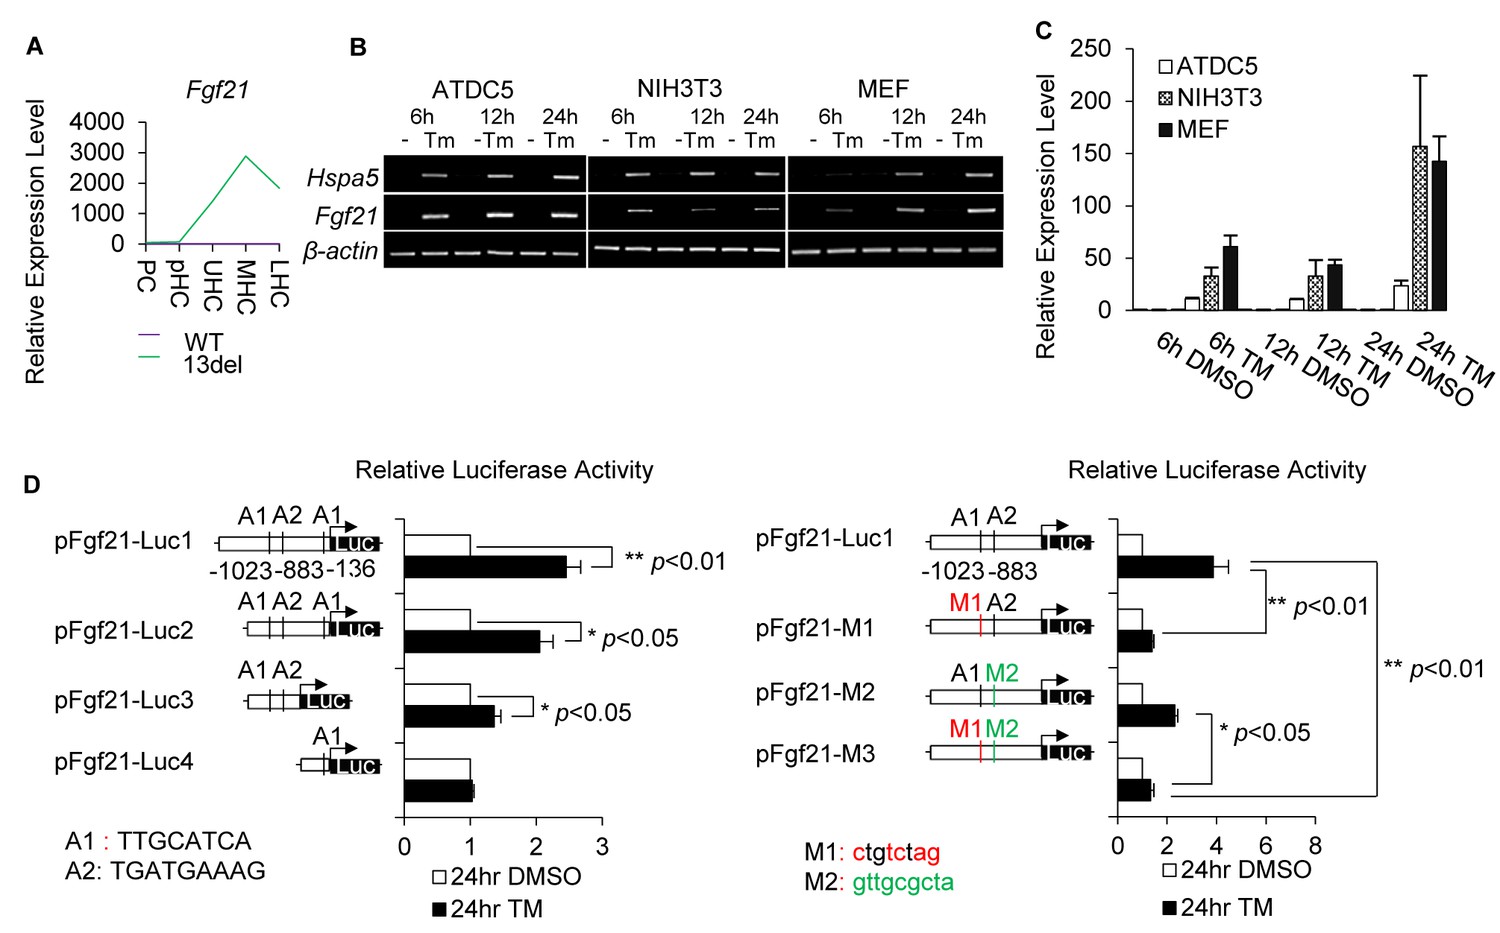
FGF21 was activated by ER stress via ATF4 and CHOP direct regulation.
(A) Normalized microarray measurement of Fgf21 in 13del growth plate comparing with WT. (B) Fgf21 is significantly activated in response to Tunicamycin (Tm) in ATDC5, NIH3T3 and MEF cells, at indicated time points. The activation of Hspa5 indicates ER stress is triggered. (C) The expression level of Fgf21 in Tunicamycin-treated ATDC5, NIH3T3 and MEF was quantified via qRT-PCR, results were presented as fold induction compared with DMSO-treated cells from three independent experiments. (D) Luciferase activities of Fgf21 promoter reporter in response to Tunicamycin or DMSO treatment. Two putative ATF4 binding sites (A1 and A2) were predicted in the Fgf21 promoter region. Renilla luciferase activities of wild-type, deletion or mutated ATF4-binding sites responding to Tunicamycin or DMSO treatment for 24 hr were measured. Results were presented as fold induction compared with DMSO treated cells from three independent experiments. Error bars were shown as S.D. and significance was determined by unpaired Two-tailed Student’s t-test. *: p-value<0.05, **: p-value<0.005, ***: p-value<0.0005.
Figure 7 with 1 supplement

FGF21 protects the HCs from ER stress-induced apoptosis in a cell autonomous manner.
(A–B) FGF21 protects the 13del HCs from apoptosis in a dosage-dependent manner. Arrows indicate TUNEL positive cells. The quantification of TUNEL-positive cells was performed between littermates (n = 5). For each mouse, the number of positive cells was counted and averaged on five non-adjacent sections (Scale Bar = 200 μm). (C) Schematic diagram of 13del;Col10a1Egfp/13del;Fgf21-/- chimera generation. In chimeric HZ, 13del HCs expressing Fgf21 (13del;Col10a1Egfp) can be distinguished from 13del;Fgf21-/- HCs by EGFP expression. (D) The number of TUNEL-positive cells was quantified in GFP+ and GFP negative HCs (n = 7). Error bars were shown as S.D. and significance was determined by Two-tailed Mann-Whitney U-test. *: p-value<0.05, **: p-value<0.005, ***: p-value<0.0005. (E) The correlation between cell death and chimerism (indicated by the percentage of 13del-EGFP expressing cells in HZ) in 13del;Col10a1Egfp/13del;Fgf21-/- chimeras. (F) Boxed region (a) is shown to demonstrate the differential localization of EGFP and TUNEL signal in chimeric HZ. Higher magnification is shown in b-d. Immunostaining for FGF21 and TUNEL assays (e–h) were applied on the chimeric growth plate, showing the mutually exclusive location of FGF21 (green) and TUNEL signal (red).
Figure 7—figure supplement 1
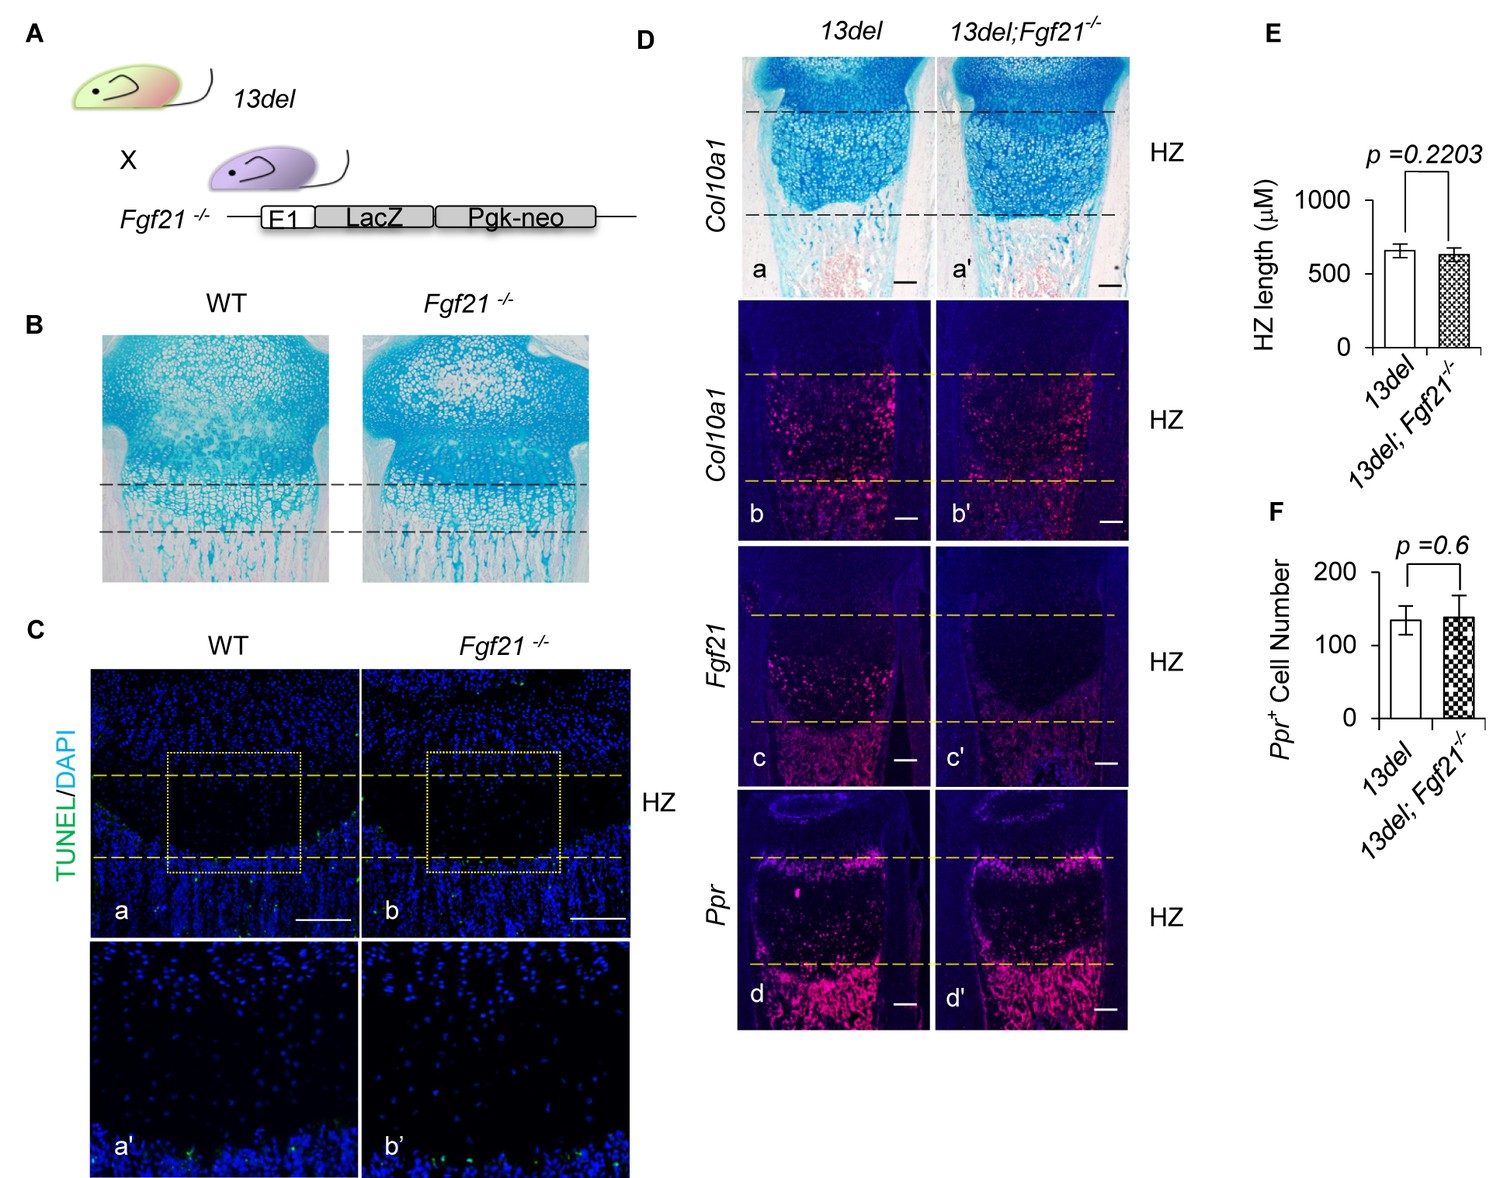
Removal of Fgf21 does not affect the reverted differentiation of 13del HCs.
(A) Schematic diagram of the generation of 13del;Fgf21-/- mice. (B) Ablation of Fgf21 from WT HCs does not affect the normal development of growth plate. (Scale Bar = 200 μm) (C) Ablation of Fgf21 from WT HCs does not affect the cell survival. (Scale Bar = 200 μm) (D–F) The growth plate of 13del;Fgf21-/- mice exhibited comparable phenotype to 13del mice, shown by histology (a, a’), expression analysis of Col10a1 (b, b’), Fgf21 (c, c’) and Ppr (d, d’), measurement of HZ lengths and quantification of Ppr-positive cells (n = 5). (Scale Bar = 200 μm) Error bars were shown as S.D. and significance was determined by Two-tailed Mann-Whitney U-test. N.S.: p-value>0.05.
Figure 8 with 3 supplements
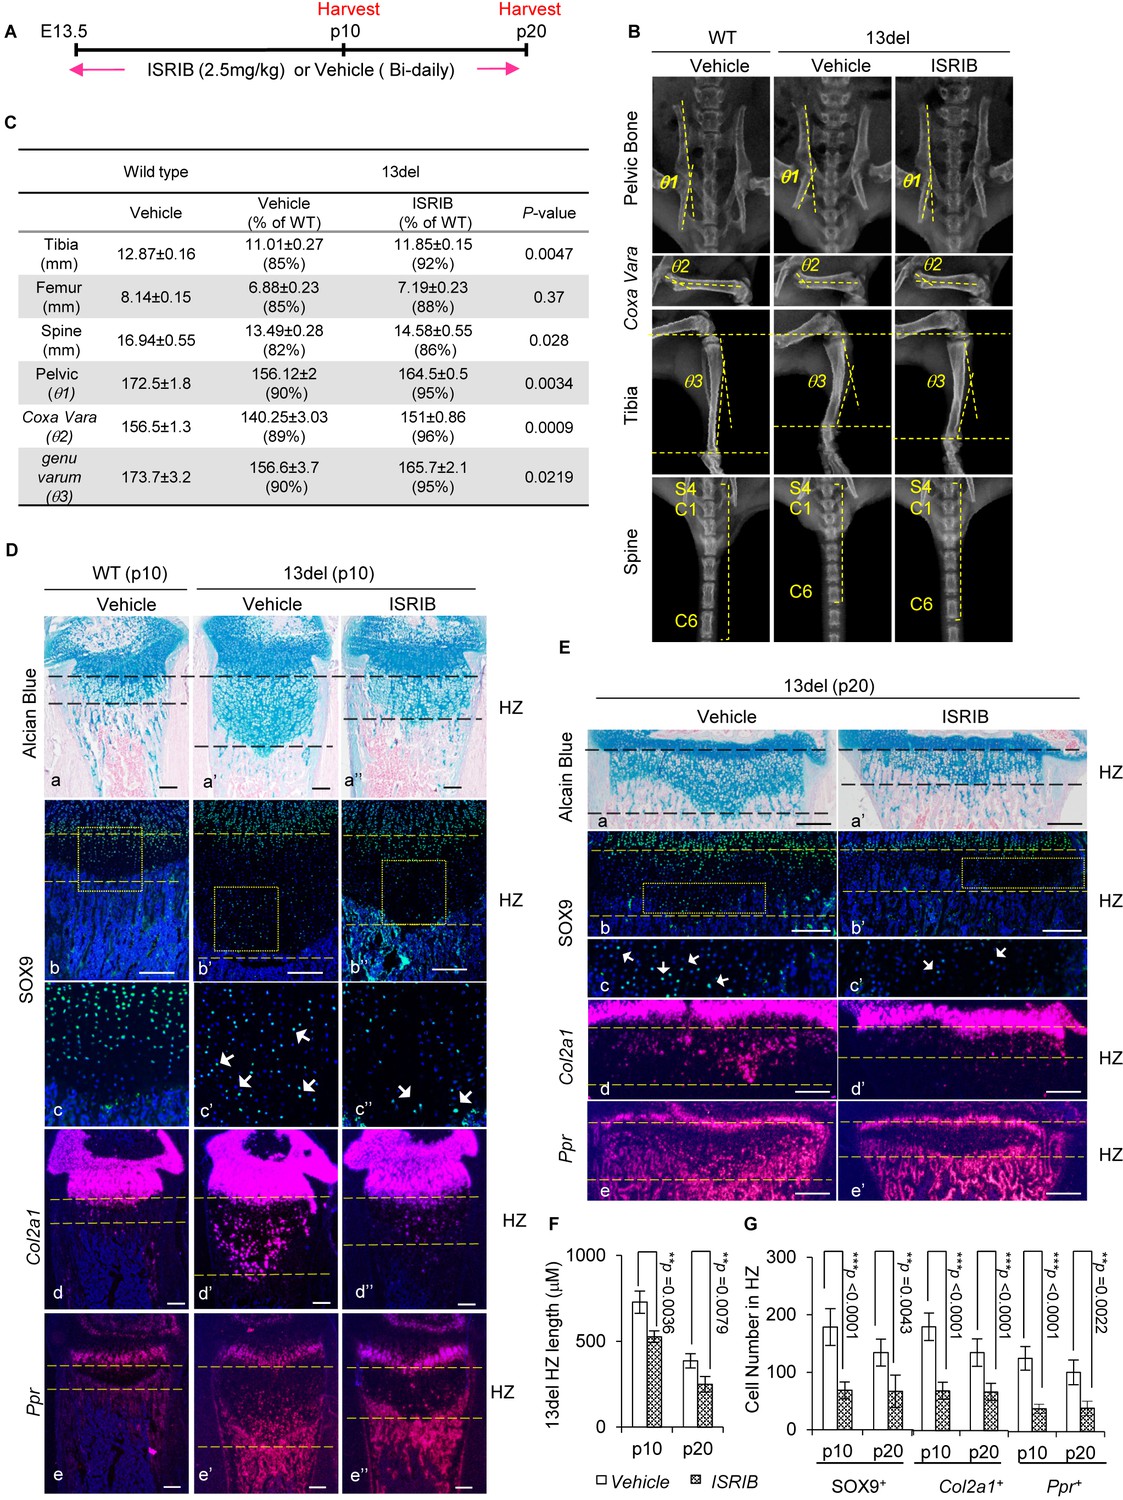
The small molecule ISRIB, preventing ATF4 induction under ER stress, ameliorates 13del skeletal deformities.
(A) Schematic timeline of the ISRIB (2.5 mg/kg) or vehicle (0.5% DMSO in 0.9% saline) administration. The mice were administrated by intraperitoneal injection, starting from E13.5 to the p20 stage. The animals were harvested at indicated time-points. (B–C) Radiographic analyses revealed skeletal deformities of 13del mice were alleviated at p20 stage by ISRIB treatment (n = 3), including length of tibia, femur and spine (spine here indicated by the length of 7 continuous vertebrae consisting of the last sacral and six tail vertebrae), pelvic bone deformation (θ1: the angle between ilium and pubis), Coxa Vara (θ2: the angle between the proximal head and the shaft of the femur) and Genu Varum (θ3: the angle between proximal head and distal head of tibia). The skeletal phenotypes in vehicle- and ISRIB-treated 13del groups were compared, and the significance of changes was determined by one-way ANOVA test. *: p-value<0.05, **: p-value<0.005, ***: p-value<0.0005. (D–E) Rescue of growth plate abnormalities in 13del mice by the treatment of ISRIB at the p10 and p20 stages, shown by histology (a–a") and in vivo expression profiles of SOX9 (b–b” and c–c”), Col2a1 (d–d”) and Ppr (e–e''). Higher magnification of the boxed region was shown to demonstrate the differential expression of SOX9 and the positive cells were indicated by arrows. (Scale Bar = 200 μm). (F) Measurement of the HZ lengths of tested animals at p10 stage (n = 5) and p20 stage (n = 3). The vertical length of the central part of the HZ from 10 different sections of each mouse was averaged. (G) Quantification of SOX9+, Col2a1 + and Ppr + cells in HZ of tested animals at p10 stage (n = 5) and p20 stage (n = 3). For each mouse, the number of positive cells was counted and average on five non-adjacent sections. Error bars were shown as S.D. and significance was determined by Two-tailed Mann-Whitney U-test. *: p-value<0.05, **: p-value<0.005, ***: p-value<0.0005.
Figure 8—figure supplement 1
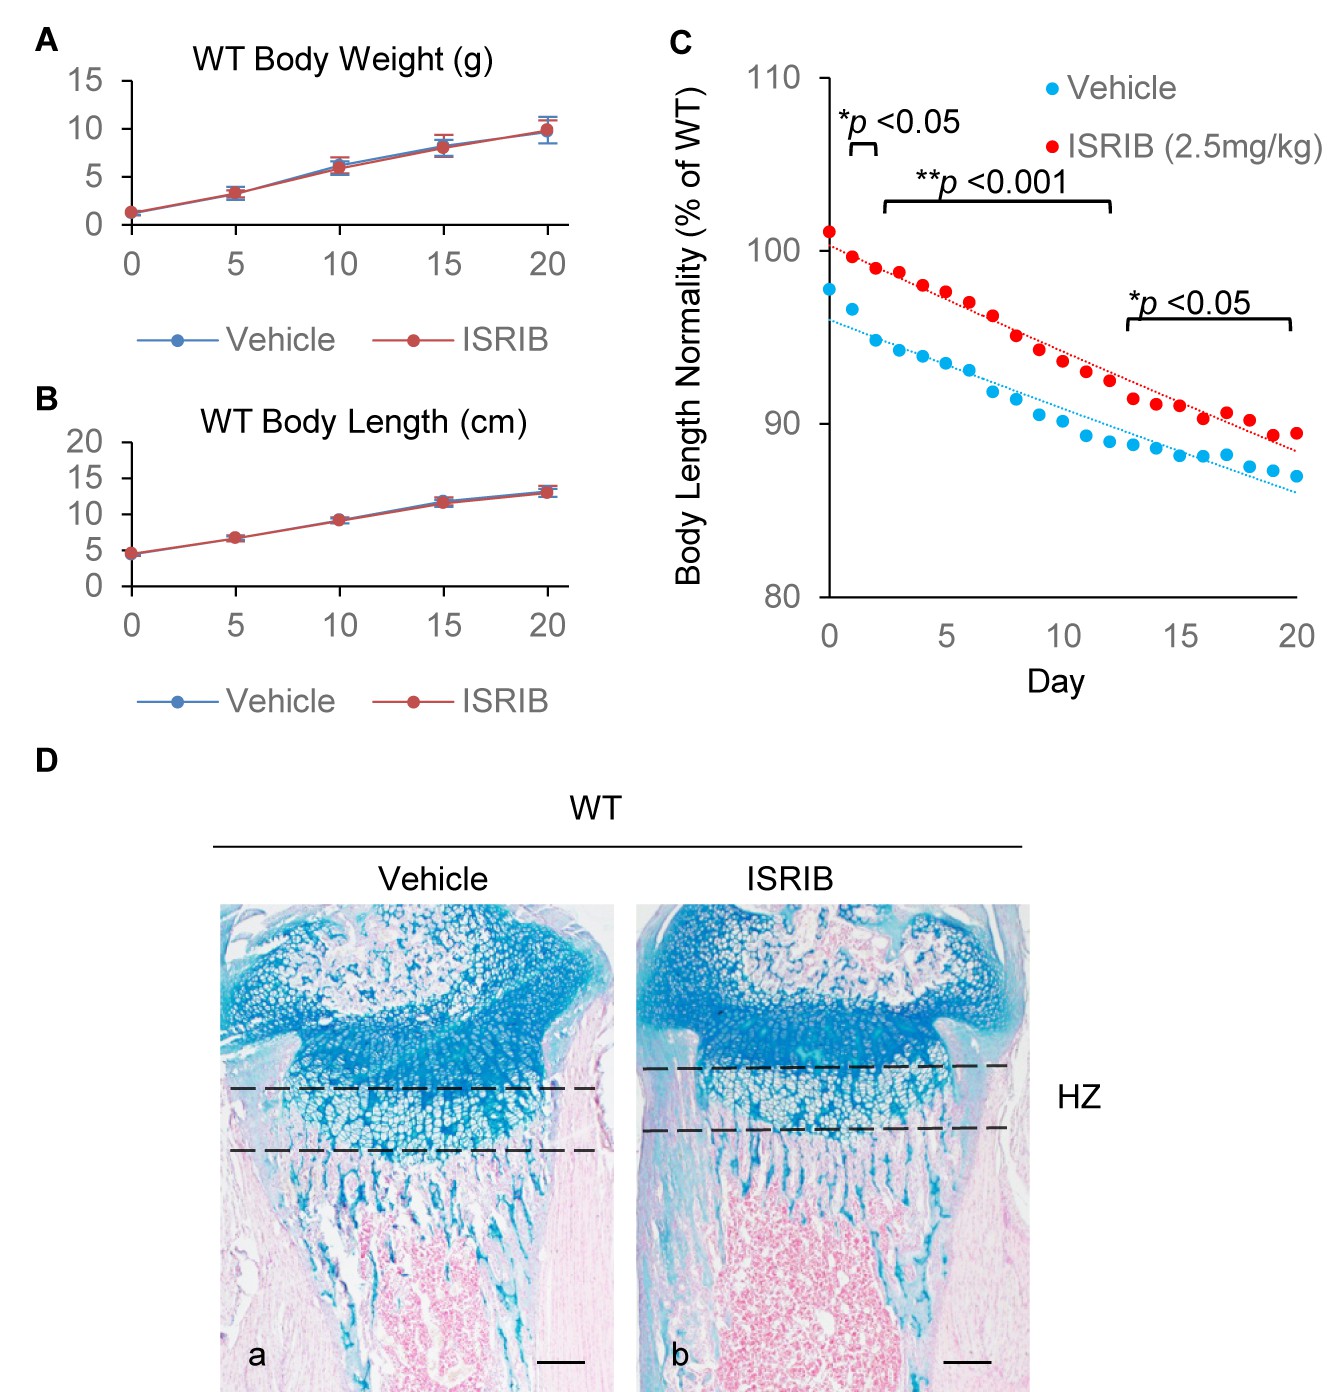
ISRIB ameliorates skeletal deformities in 13del mice but does not affect the growth of WT mice.
(A–B) Treatment of ISRIB (n = 12) does not affect the body weight gain or body length growth in wild-type mice, comparing to the treatment of vehicle (n = 18). (C) Body lengths of the vehicle-treated (n = 20) and ISRIB-treated (n = 16) 13del were monitored from birth to p20 stage, and significantly consistent improvement of body length in ISRIB-treated 13del mice was observed. Results are presented as the percentage of their WT littermates, and significance was determined two-tailed Mann-Whitney U test. *: p-value<0.05, **: p-value<0.005. (D) Histology of p10 growth plates was comparable between ISRIB- and vehicle-treated WT mice.
Figure 8—figure supplement 2

ISRIB ameliorates axial skeleton deformities in 13del mice.
(A) Rescue of the HZ expansion in the tail intervertebral disc (IVD) by the treatment ISRIB in 13del mice at p10 and p20 stages, shown by histology (Scale Bar = 200 μm). (B) HZ measurements of rostral and caudal growth plates of tail IVDs from tested animals at p10 (n = 5) and p20 stages (n = 3). The vertical length of the central part of the HZ from 10 different sections of each mouse was averaged. Error bars were shown as S.D. and significance was determined by Mann-Whitney U test. *: p-value<0.05, **: p-value<0.005. (C) Rescue of the growth plate deformities in tail IVD by the treatment of ISRIB in 13del mice, indicated by the reduced number of SOX9 (a–a", c–c") and Col2a1 (b–b”, d–d”) at p10 and p20 stages.
Figure 8—figure supplement 3

Postnatal administration of ISRIB ameliorates 13del skeletal deformities.
(A) Schematic timeline of the ISRIB (2.5 mg/kg or 5 mg/kg) or vehicle (0.5% DMSO in 0.9% saline) administration. ISRIB or vehicle was administrated by intraperitoneal injection, starting from p0 to 4-week stage. The animals were harvested at indicated time-points. (B) Body lengths of the vehicle-treated WT (n = 7), vehicle- (n = 9), ISRIB (2.5 mg/kg)- (n = 5) and ISRIB (5 mg/kg)-treated (n = 8) 13del were monitored from birth to 4-week stage, and a significantly consistent improvement of body length in ISRIB (5 mg/kg)-treated 13del mice was observed. Results were presented as the percentage of their WT littermates. (C–D) Radiographic analyses revealed skeletal deformities of 13del mice were alleviated at 4-week stage by ISRIB treatment, including length of tibia, femur and spine (spine here indicated by the length of 7 continuous vertebrae consisting of the last sacral and six tail vertebrae), pelvic bone deformation (θ1: the angle between ilium and pubis), Coxa Vara (θ2: the angle between the proximal head and the shaft of the femur) and Genu Varum (θ3: the angle between proximal head and distal head of tibia). Data were collected from seven vehicle-treated WT mice, nine vehicle-treated, 5 ISRIB (2.5 mg/kg)-treated and 8 ISRIB (5 mg/kg)-treated 13del mice. The phenotypic changes in vehicle- and ISRIB-treated 13del groups were analyzed, and the significance of changes was determined by one-way ANOVA test. *: p-value<0.05, **: p-value<0.005, ***: p-value<0.0005.
Figure 9 with 1 supplement
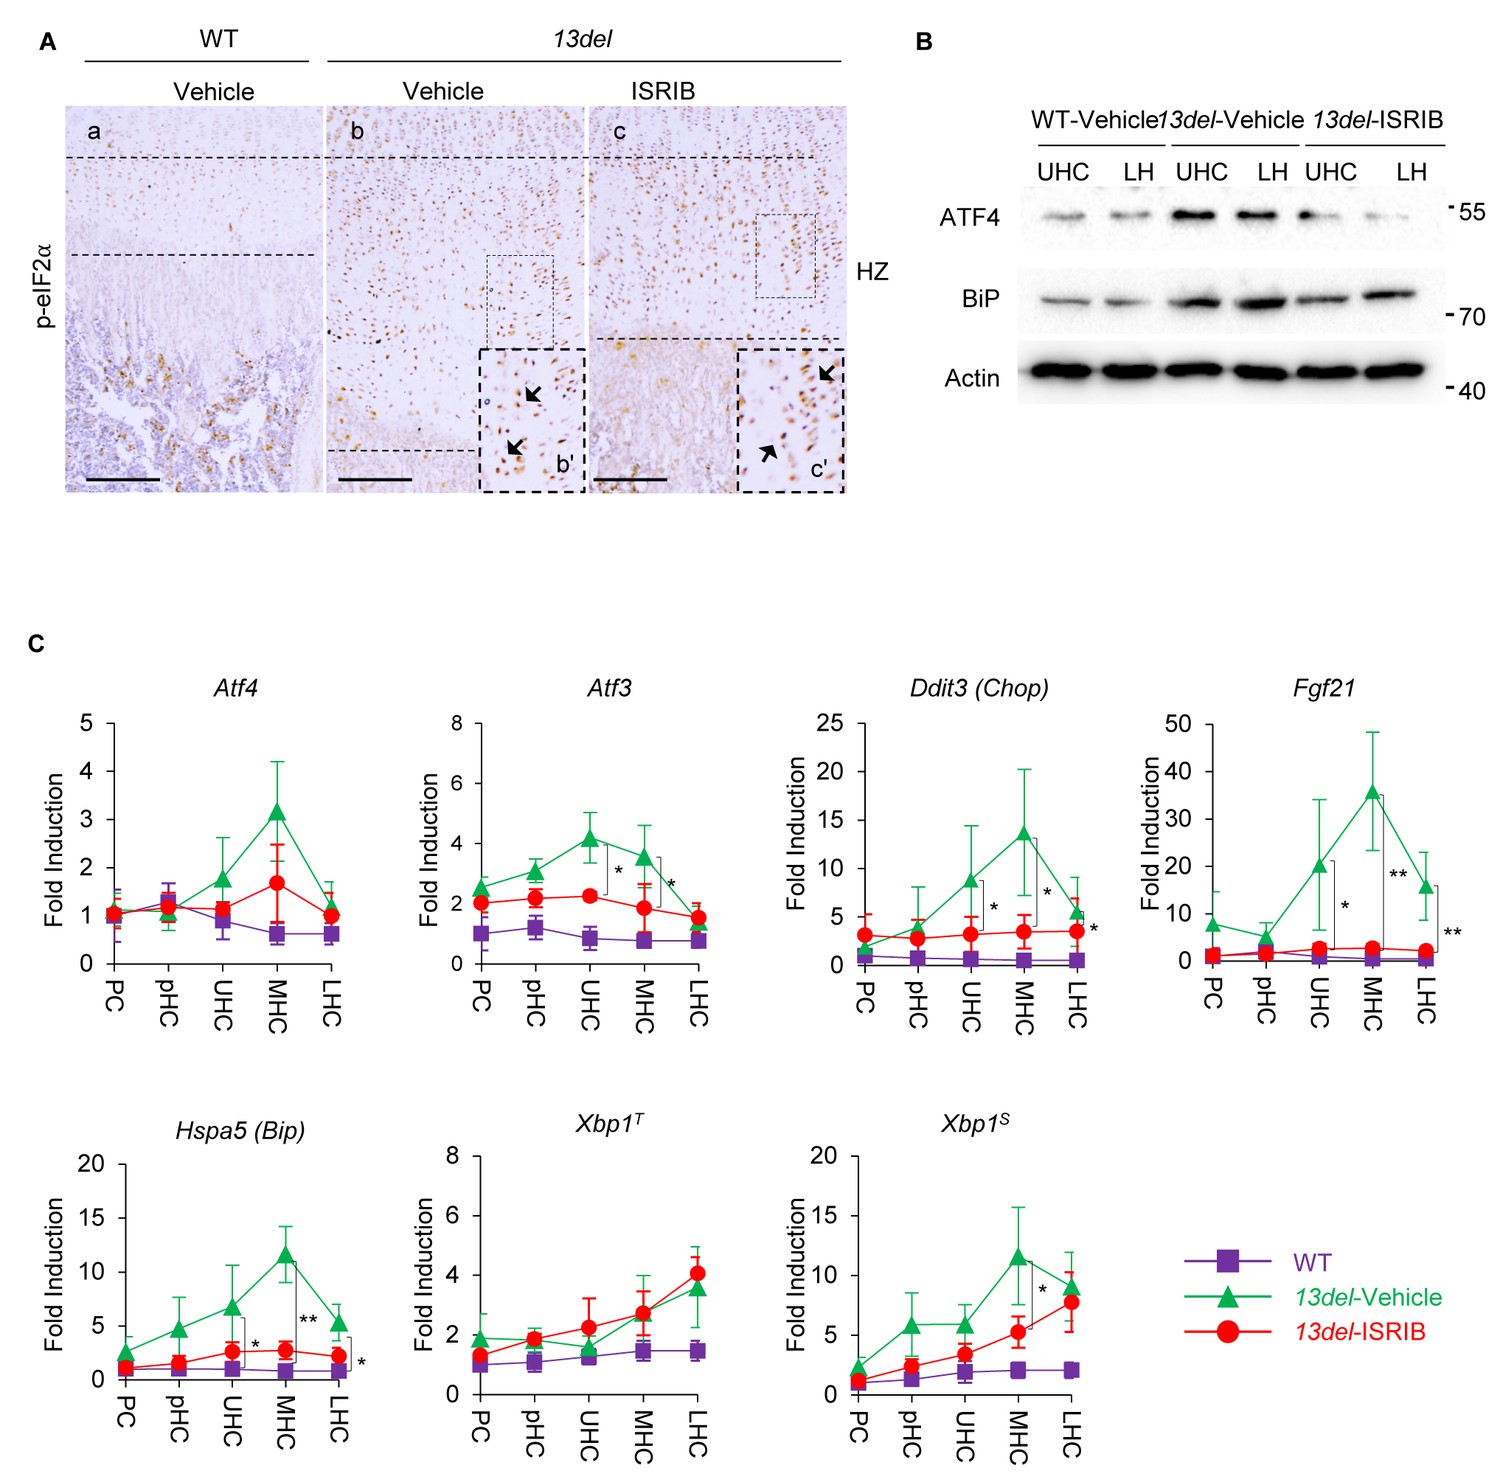
The PERK-p-eIF2α signaling pathway is specifically down-regulated by the treatment of ISRIB in 13del HCs.
At p10 stage, the expression of p-eIF2α in ISRIB-treated 13del HC was not changed. Higher magnification of the boxed region was shown to demonstrate the expression of p-eIF2 clearly, and the positive staining cells were indicated by arrows. (Scale Bar = 200 μm) (B) The vehicle-treated WT, vehicle- and ISRIB-treated 13del p10 HZ were equally fractionated into two chondrocyte populations (UHC and LHC), and protein from each population was isolated. The protein expression level of ATF4 and ER stress sensor BiP were examined via western blot. Beta-actin was used as internal control. (C) The WT, vehicle- and ISRIB-treated 13del p10 growth plates were fractionated into different chondrocyte populations (PC, pHC, UHC, MHC and LHC), and total RNA from each population was isolated. The expression levels of Atf4, its downstream targets (Atf3, Ddit3, and Fgf21), ER stress sensor Hspa5, total Xbp1T and its active form Xbp1S were quantified via qRT-PCR, results were presented as fold induction compared with WT proliferating chondrocytes (PC) from five independent animals of each group. Error bars shown as S.D. and significance between vehicle- and ISRIB-treated HCs was determined Two-tailed Mann-Whitney U-test. *: p-value<0.05, **: p-value<0.005.
Figure 9—figure supplement 1
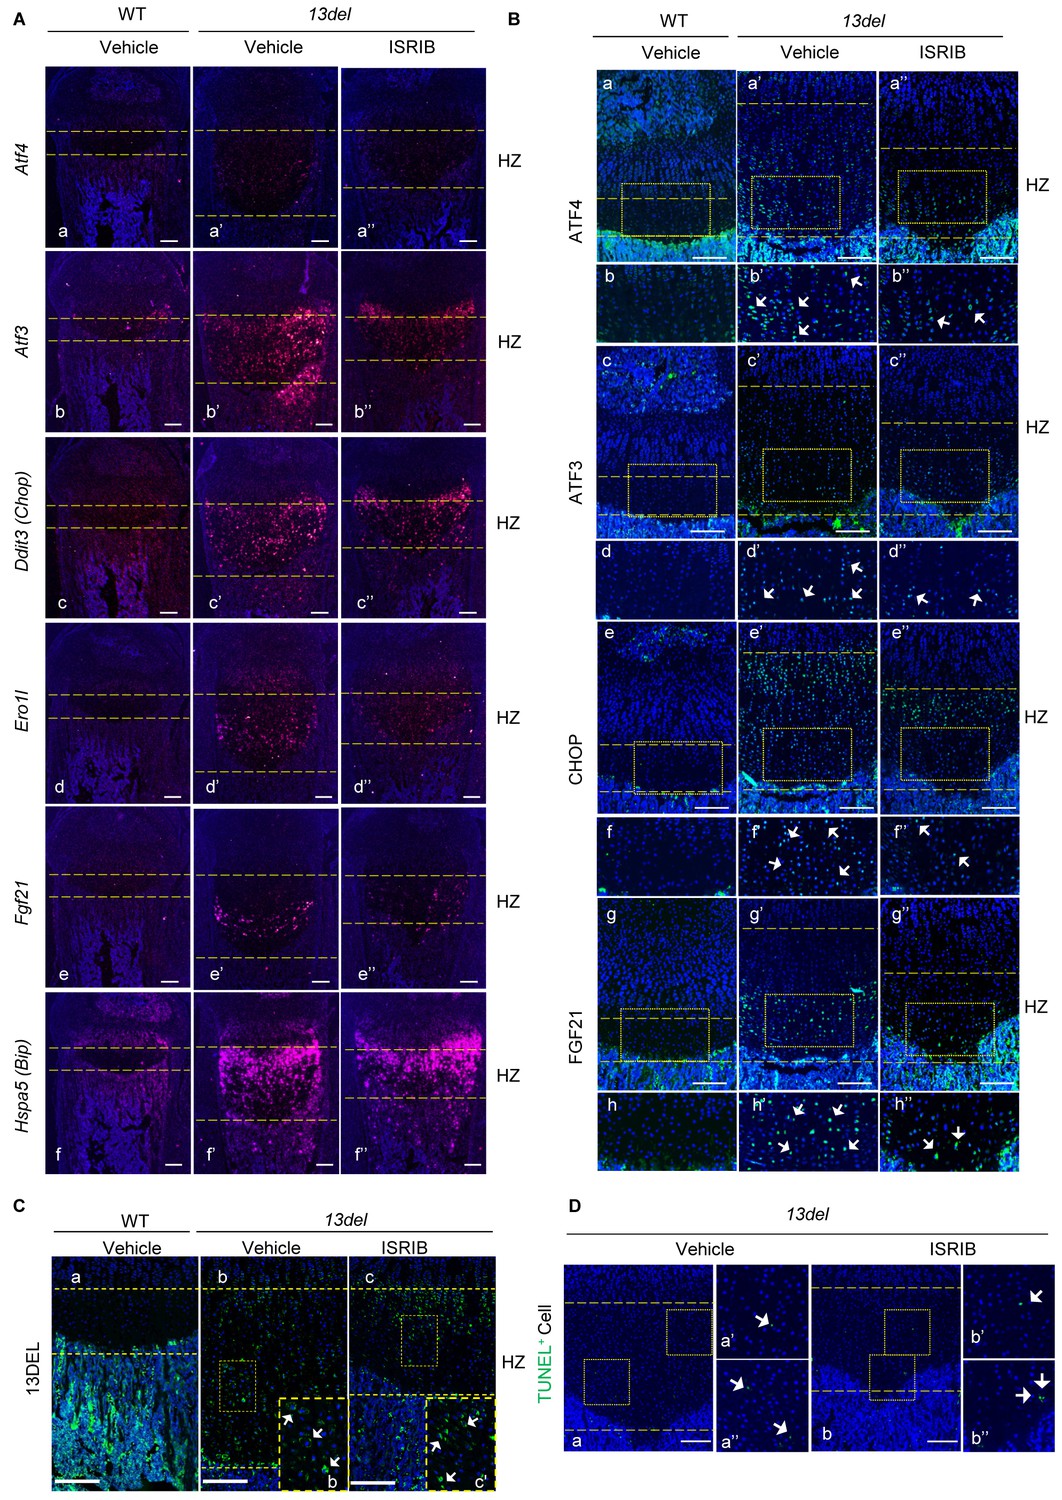
The p-eIF2α signaling pathway is down-regulated by the treatment of ISRIB.
(A) At p10, the transcripts of Atf4 (a–a”), Atf3 (b–b”), Ddit3 (c–c”), Ero1l (d–d”) and Fgf21 (e–e”) were down-regulated in HZ from ISRIB-treated 13del mice, while Hspa5 (f– f”) was not affected. (Scale Bar = 200 μm). (B) At p10, the protein level of ATF4 (a–b”), ATF3 (c–d”), CHOP (e–f”) and FGF21 (g–h”) were down-regulated in HZ from ISRIB-treated 13del mice. Higher magnification of the boxed region was shown to clearly demonstrate the differential expression of ATF4, ATF3, CHOP and FGF21, and the staining positive cells were indicated by arrows, respectively. (Scale Bar = 200 μm). (C) At p10, the expression of 13DEL mutant protein were detectable in ISRIB-treated 13del HZ. Higher magnification of the boxed region was shown to demonstrate the expression of 13DEL mutant protein clearly, and the positive staining cells were indicated by arrows (Scale Bar = 200 μm). (D) ISRIB treatment does not induce apoptosis in 13del mice. (Scale Bar = 200 μm).
Figure 10
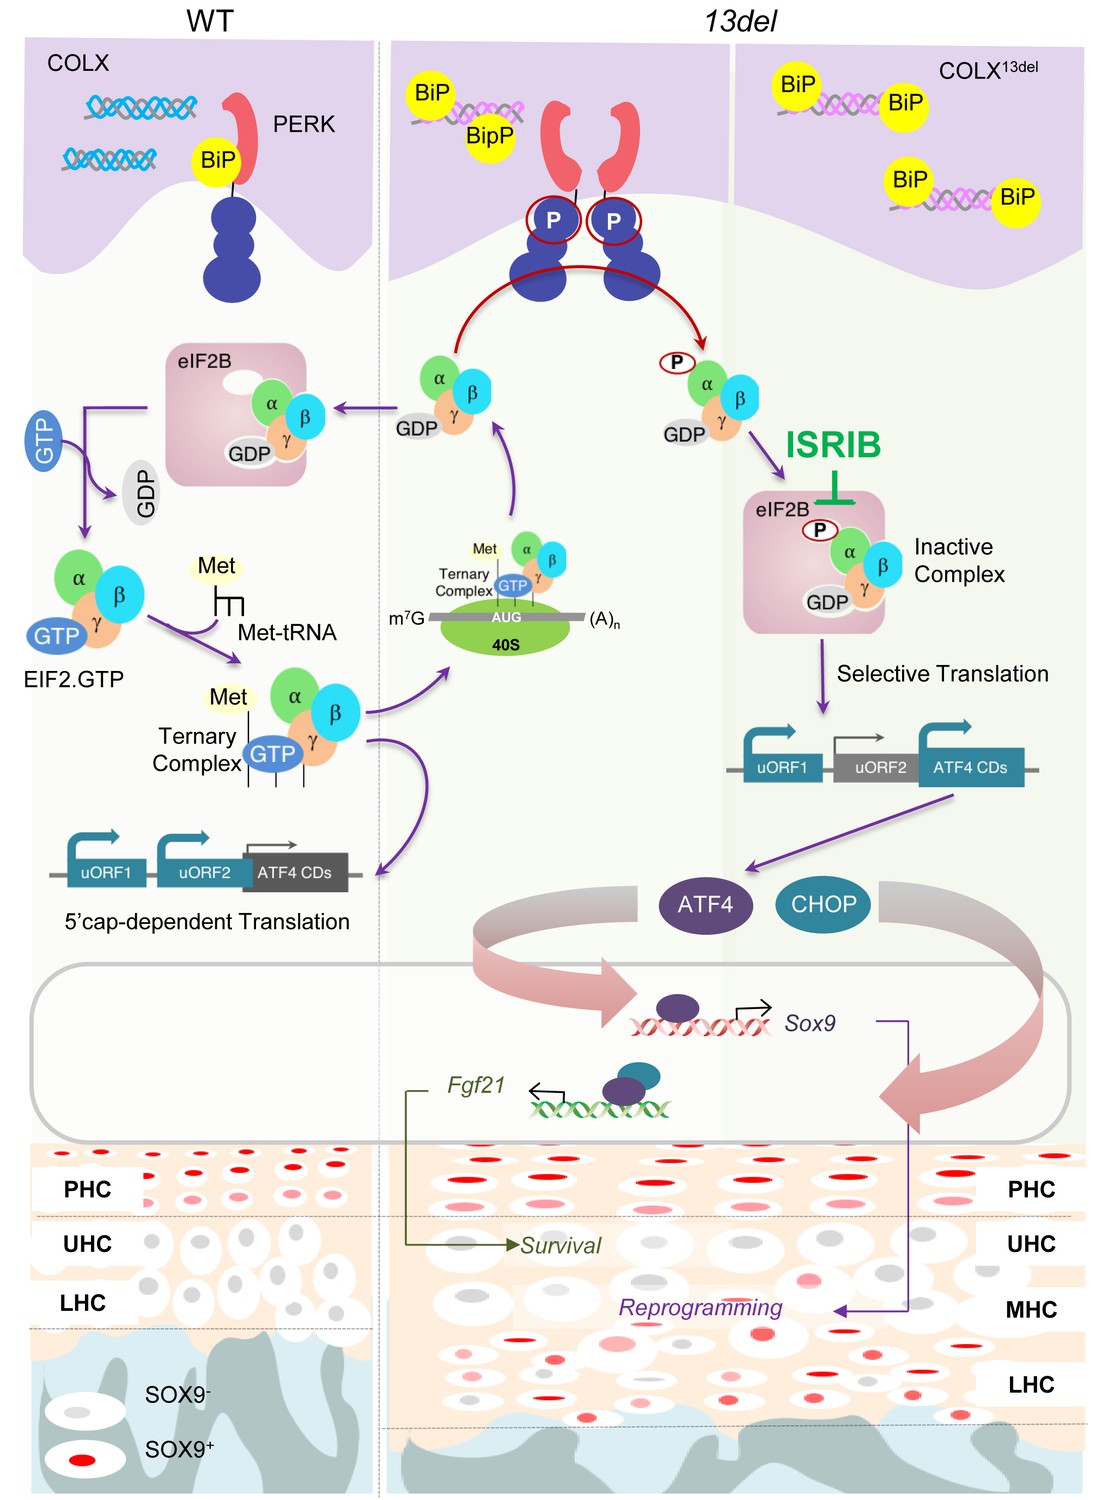
A schematic model for PERK signaling pathway in modulating skeletal phenotype in MCDS 13del mice.
ISRIB eased the MCDS symptoms by inhibiting the ectopic expression of ATF4, induced by inactive eIF2(p)-eIF2B complex, and the consequent expression of Sox9.
Tables
Key resources table
| Reagent type (species) or resource | Designation | Source or reference | Identifiers | Additional information |
|---|---|---|---|---|
| Strain, strain background (Mus musculus) | 13del | PMID: 17298185 | Maintained in F1 (C57BL/6 x CBA) background | |
| Strain, strain background (Mus musculus) | C10-Atf4 | This paper | ||
| Strain, strain background (Mus musculus) | Ddit3-/- | PMID: 9531536 | Gift from Prof. David Ron’s lab (University of Cambridge, UK) | |
| Strain, strain background (Mus musculus) | Fgf21-/- | PMID:19589869 | Gift from Prof. Nobuyuki Itoh’s lab (University of Kyoto, Japan) | |
| Strain, strain background (Mus musculus) | Col10a1Egfp | PMID:25092332 | ||
| Strain, strain background (Mus musculus) | Sox9flox/flox | PMID:12414734 | Gift from Prof. Andreas Schedl’s lab (Institute of Biology Valrose, France) | |
| Strain, strain background (Mus musculus) | Col10a1Cre | PMID:25092332 | ||
| Cell line (Mus musculus) | ATDC5 | RCB0565; PMID:8609176 | Chisa Shukunami | |
| Cell line (Mus musculus) | MEF | Isolated from E13.5 mouse embryo (F1) | Mouse Embryonic Fibroblast | |
| Cell line (Mus musculus) | NIH 3T3 | ATCC CRL-1658 | Mouse fibroblast suitable for transfection | |
| Transfected construct | pSox9-2.7K | This paper | 2.7K Sox9 promoter inserted into pGL3 basic vector (Promega) | |
| Transfected construct | pSox9-1.8K | This paper | 1.8K Sox9 promoter inserted into pGL3 basic vector (Promega) | |
| Transfected construct | pSox9-0.8K | This paper | 0.8K Sox9 promoter inserted into pGL3 basic vector (Promega) | |
| Transfected construct | pSox9-1.8M1 | This paper | 1.8K Sox9 promoter with one mutated ATF4 binding site inserted into pGL3 basic vector (Promega) | |
| Transfected construct | pSox9-1.8M2 | This paper | 1.8K Sox9 promoter with one mutated ATF4 binding site inserted into pGL3 basic vector (Promega) | |
| Transfected construct | pSox9-1.8M3 | This paper | 1.8K Sox9 promoter with two mutated ATF4 binding sites inserted into pGL3 basic vector (Promega) | |
| Transfected construct | pFgf21-Luc1 | This paper | 2K Fgf21 promoter inserted into pGL3 basic vector (Promega) | |
| Transfected construct | pFgf21-Luc2 | This paper | 1.2K Fgf21 promoter inserted into pGL3 basic vector (Promega) | |
| Transfected construct | pFgf21-Luc3 | This paper | 0.8K Fgf21 promoter inserted into pGL3 basic vector (Promega) | |
| Transfected construct | pFgf21-Luc4 | This paper | 0.4K Fgf21 promoter inserted into pGL3 basic vector (Promega) | |
| Transfected construct | pFgf21-M1 | This paper | 1.2K Fgf21 promoter with one mutated ATF4 binding site inserted into pGL3 basic vector (Promega) | |
| Transfected construct | pFgf21-M2 | This paper | 1.2K Fgf21 promoter with one mutated ATF4 binding site inserted into pGL3 basic vector (Promega) | |
| Transfected construct | pFgf21-M3 | This paper | 1.2K Fgf21 promoter with two mutated ATF4 binding site inserted into pGL3 basic vector (Promega) | |
| Antibody | anti-ATF4 | sc-200 | Santa Cruz | rabbit IgG |
| Antibody | anti-CHOP | sc-575 | Santa Cruz | rabbit IgG |
| Antibody | anti-SOX9 | AB5535 | Millipore | rabbit IgG |
| Antibody | anti-ATF3 | HPA001562 | Sigma | rabbit IgG |
| Antibody | anti-FGF21 | 42189 | AIS | rabbit IgG |
| Antibody | anti-PPP1R15A | sc-825 | Santa Cruz | rabbit IgG |
| Antibody | anti-BiP | ADI-SPA-826 | ENZO | rabbit IgG |
| Antibody | anti-beta Actin | A2228 | Sigma | mouse IgG |
| Commercial assay or kit | In Situ Cell Death Detection Kit | 12156792910 | Roche | TUNEL assay |
| Commercial assay or kit | Dual-Luciferase Reporter Assay System | E1910 | Promega | Luciferase assay |
| Commercial assay or kit | BrdU staining kit | 93–3943 | Thermo Fisher Scientific | |
| Chemical compound, drug | ISRIB | SML0843 | Sigma | |
| Software, algorithm | RMA algorithm | R Bioconductor | Robust Multi-chip Average | |
| Software, algorithm | k-Means Clustering algorithm | DOI: https://doi.org/10.1016/j.patrec.2009.09.011 | ||
| Software, algorithm | Gene Ontology database | PMID:10802651 | ||
| Software, algorithm | HOMER software package | PMID:20513432 | ||
| Software, algorithm | Bowtie program | PMID:19261174 | ||
| Software, algorithm | Picard toolkit of Broad Institute | https://tldrlegal.com/license/mit-license | MIT | |
| Software, algorithm | Prism | GraphPad software |
Additional files
-
Supplementary file 1
List of differentially expressed genes in clusters I, II, III and IV.
(Related to Figure 1)
- https://doi.org/10.7554/eLife.37673.025
-
Supplementary file 2
Genes involved in enriched biological processes in cluster I, II, III and IV.
(Related to Figure 1)
- https://doi.org/10.7554/eLife.37673.026
-
Supplementary file 3
Genes involved in enriched pathways in cluster I, II, III and IV.
(Related to Figure 1)
- https://doi.org/10.7554/eLife.37673.027
-
Supplementary file 4
Differentially expressed genes between 13del and published MCDS transcriptome.
(Related to Figure 1)
- https://doi.org/10.7554/eLife.37673.028
-
Supplementary file 5
Enriched motifs identified in cluster I genes using HOMER software package.
(Related to Figure 1)
- https://doi.org/10.7554/eLife.37673.029
-
Supplementary file 6
List of ATF4 and CHOP target genes in each cluster.
Genes containing ATF4 and CHOP binding peaks within 10 kb from TSS were listed. (Related to Figure 1)
- https://doi.org/10.7554/eLife.37673.030
-
Supplementary file 7
Primers used for genotyping, probe synthesis and qRP-PCR.
(Related to Materials and methods)
- https://doi.org/10.7554/eLife.37673.031
-
Transparent reporting form
- https://doi.org/10.7554/eLife.37673.032
Download links
A two-part list of links to download the article, or parts of the article, in various formats.
Downloads (link to download the article as PDF)
Open citations (links to open the citations from this article in various online reference manager services)
Cite this article (links to download the citations from this article in formats compatible with various reference manager tools)
Inhibiting the integrated stress response pathway prevents aberrant chondrocyte differentiation thereby alleviating chondrodysplasia
eLife 7:e37673.
https://doi.org/10.7554/eLife.37673


