A novel pathway of LPS uptake through syndecan-1 leading to pyroptotic cell death
- National Cancer Institute, National Institutes of Health, United States
- APCBIo Innovations Inc., United States
- Frederick National Laboratory for Cancer Research, Leidos Biomedical Inc., United States
Figures
Figure 1
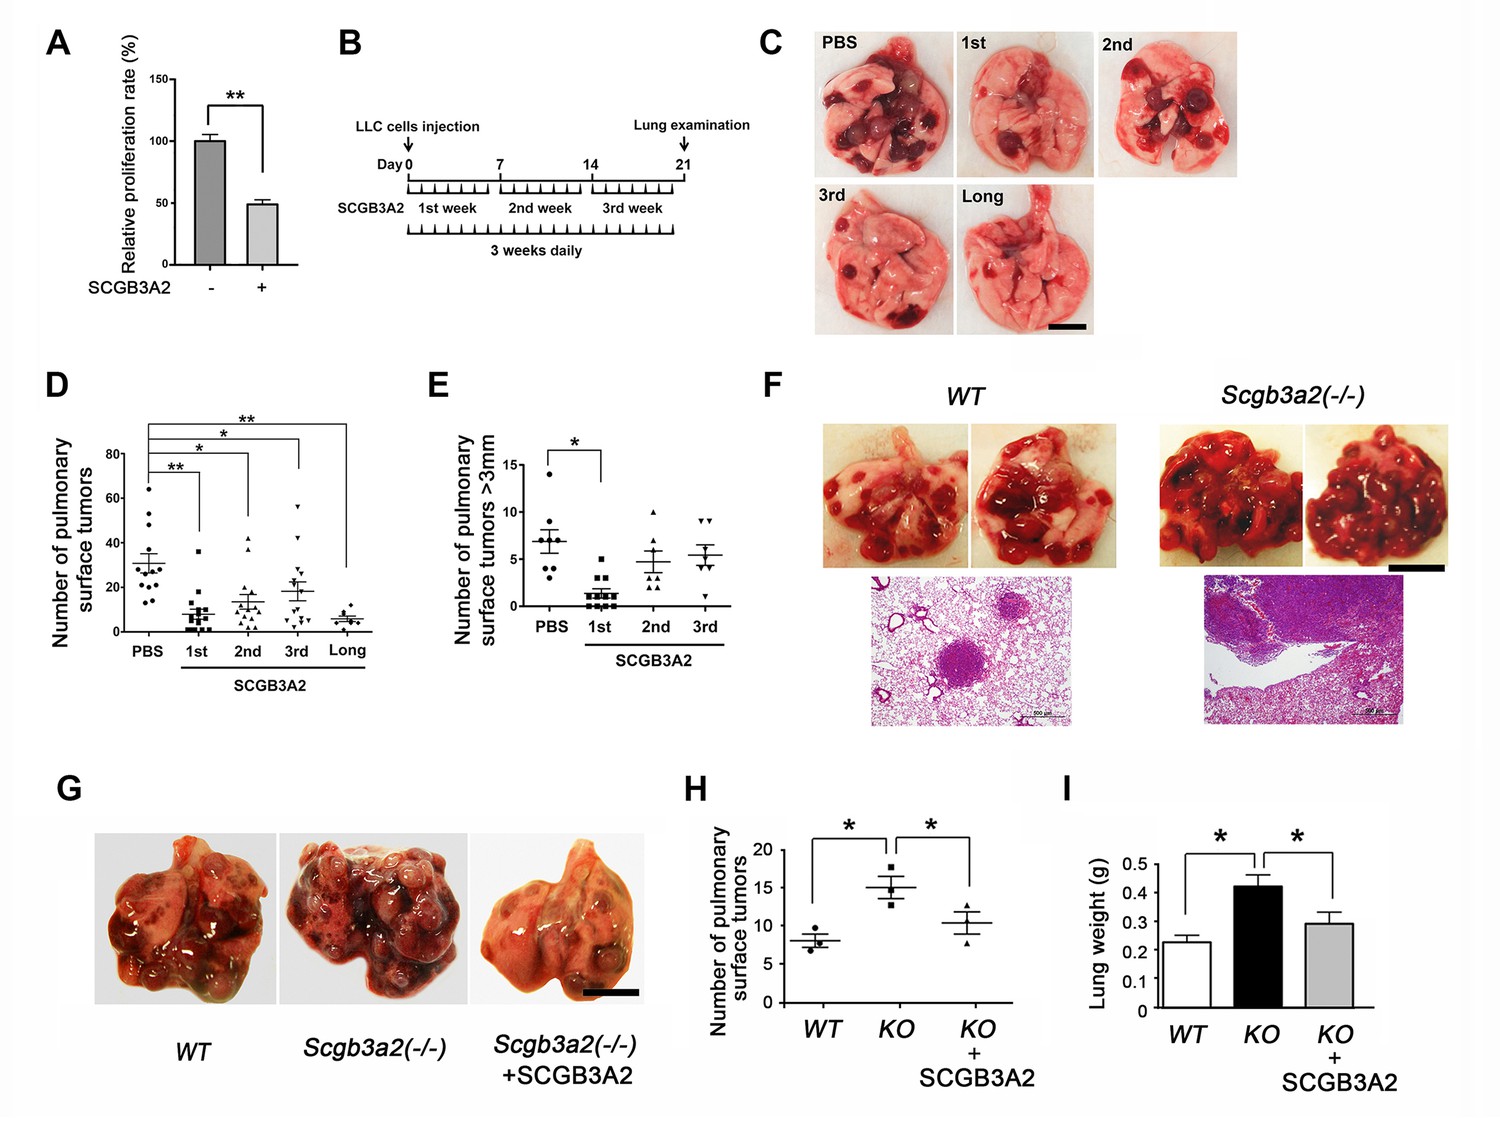
SCGB3A2-induced suppression of LLC cell proliferation.
(A) Effect of SCGB3A2 on proliferation of LLC cells. Cells were maintained without serum for 24 hr, followed by 1% FBS-RPMI1640 media with or without mouse SCGB3A2 (1 μg/ml). CCK8 assay was carried out 72 hr after the addition of SCGB3A2. Averages ± SD from three independent experiments, each in triplicate. **p<0.01 by student’s t-test. (B) LLC cell intravenous metastasis model scheme. Mice inoculated with LLC cells received daily intravenous administration of mouse recombinant SCGB3A2 for 7 consecutive days for the 1st, 2nd, or 3rd week, or the entire experimental period of 21 days (long). Control mice received PBS alone. The number of the pulmonary surface tumors was counted on day 21. N = 7–14 per group. (C) Representative lung images from each SCGB3A2 administration group. Scale bar = 1 cm. (D) Summary for the numbers of pulmonary surface tumors. A dot indicates a mouse. Averages ± SD are shown. *p<0.05, **p<0.01. (E) Number of pulmonary surface tumors larger than 3 mm. Averages ± SD are shown. *p<0.05. (F) (upper panel) Representative pictures of metastasized lung tumors from wild-type (WT) and Scgb3a2-null (Scgb3a2(-/-)) mice. Scale bar = 1 cm. (lower panel) H & E staining of lungs. Scale bar = 500 µm. (G) Representative lungs from wild-type littermate (WT), Scgb3a2-null (Scgb3a2(-/-)), and Scgb3a2-null mice given SCGB3A2 (ie. Scgb3a2(-/-)+SCGB3A2) for the 1st week. N = 3 per group. This was a separate independent experiment from those presented in C-E. WT and Scgb3a2(-/-) mice received daily PBS as a control. Lung necropsy was carried out on day 21. (H) Graph showing the number of pulmonary surface tumors of experiment in G. Averages ± SD are shown. (I) Lung weights of each LLC cell metastasis model in G. Averages ± SD are shown. KO: Scgb3a2-null. *p<0.05. Statistical differences calculated by One-way ANOVA except in A.
Figure 2 with 1 supplement
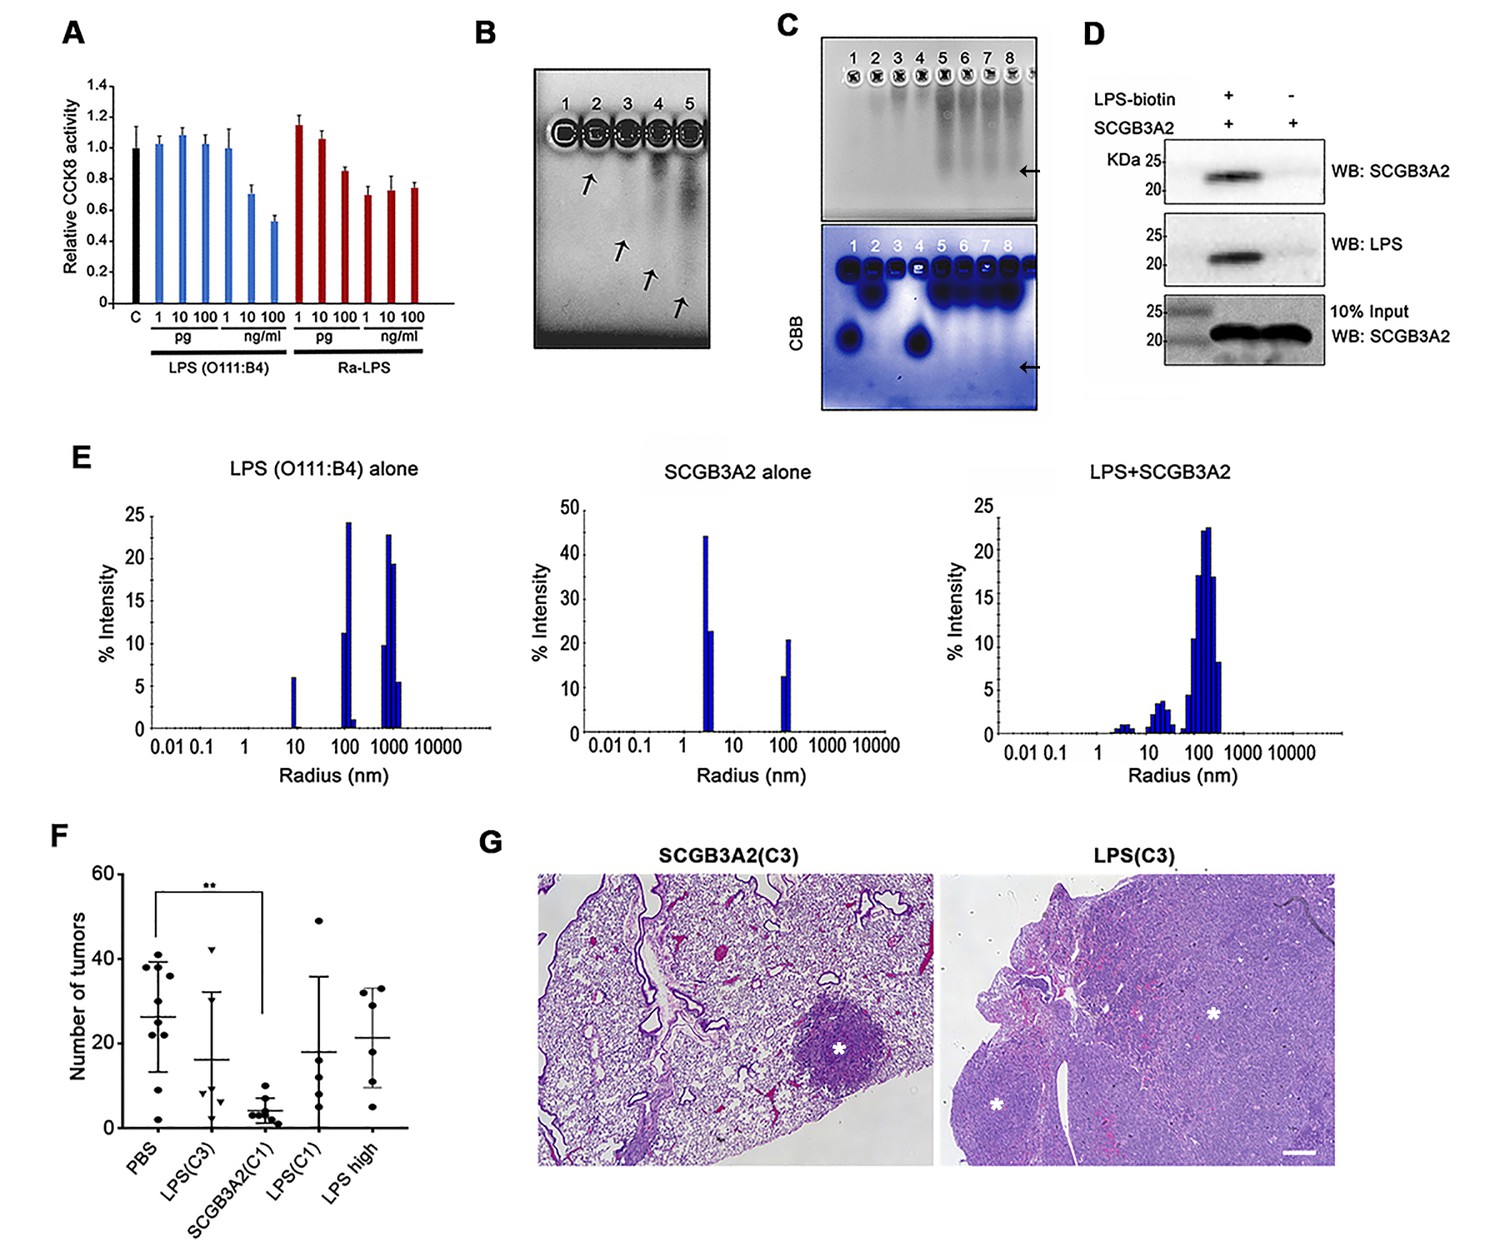
SCGB3A2 as an LPS binding protein.
(A) CCK8 analysis using various concentrations as shown in the bottom (pg, ng/ml) of smooth LPS (E.coli O111:B4 serotype) and rough LPS (Ra-LPS) after 72 hr in culture. C; control without any addition of LPS. Averages ± SD from three independent experiments, each in triplicate. (B) Reverse staining of aggregation of LPS. Imidazole-zinc staining of E.coli O111:B4 serotype LPS on agarose gel. LPS (10 µg) was incubated with human SCGB3A2 in lane 1 to 5: 0, 10, 100 ng, 1, and 10 µg, respectively. Arrows indicate the bottom of the aggregate or smeary bands. (C) Reverse staining of aggregation of LPS. Imidazole-zinc staining of E.coli O111:B4 serotype LPS on agarose gel. BSA 10 µg (lane1), human SCGB3A2 10 µg (lane 2), LPS 10 µg (lane 3), BSA +LPS pre-incubation at 37 ˚C, 30 min (lane 4), SCGB3A2 + LPS pre-incubation at 37 ˚C, 30 min (lane 5), SCGB3A2 + LPS pre-incubation at RT, 30 min (lane 6), SCGB3A2 + LPS pre-incubation at 37 ˚C, 10 min (lane 7), SCGB3A2 + LPS pre-incubation at RT, 10 min (lane 8). Bottom image is Coomassie Brilliant Blue (CBB) staining of the same gel. Arrows indicate the bottom of the aggregate or smeary bands. (D) Streptavidin pull-down assay of LPS-Biotin and recombinant SCGB3A2. IP and western blotting were sequentially carried out using anti-SCGB3A2 and anti-LPS antibody, respectively. Input is 10%. (E) DLS assay. Size deformation of LPS micelles by human SCGB3A2 pre-incubation. Histogram shows the intensity of hydrodynamic radii (nm) of O111:B4 LPS (20 µg/ml), human SCGB3A2 (20 µg/ml), and LPS pre-incubated with SCGB3A2 for 30 min at RT. Gel analysis and DLS assay were carried out more than 3 separate times and each time, similar results were obtained. (F) Effect of SCGB3A2 or LPS on the number of lung surface tumors in LLC cell intravenous metastasis model. LPS(C3): LPS concentration equivalent to that contained in mouse SCGB3A2(C3) (see Figure 1 and Supplementary file 1), SCGB3A2(C1): human SCGB3A2(C1) protein without addition of exogenous LPS, LPS(C1): LPS concentration equivalent to that contained in human SCGB3A2(C1), and LPS high: LPS (1 μg/mouse). A dot indicates a mouse. Averages ± SD are shown. **p<0.01. (G) Representative images of lung of mice with SCGB3A2(C3) or LPS(C3) administration. Asterisks indicate tumors. Bar = 300 µm.
Figure 2—figure supplement 1
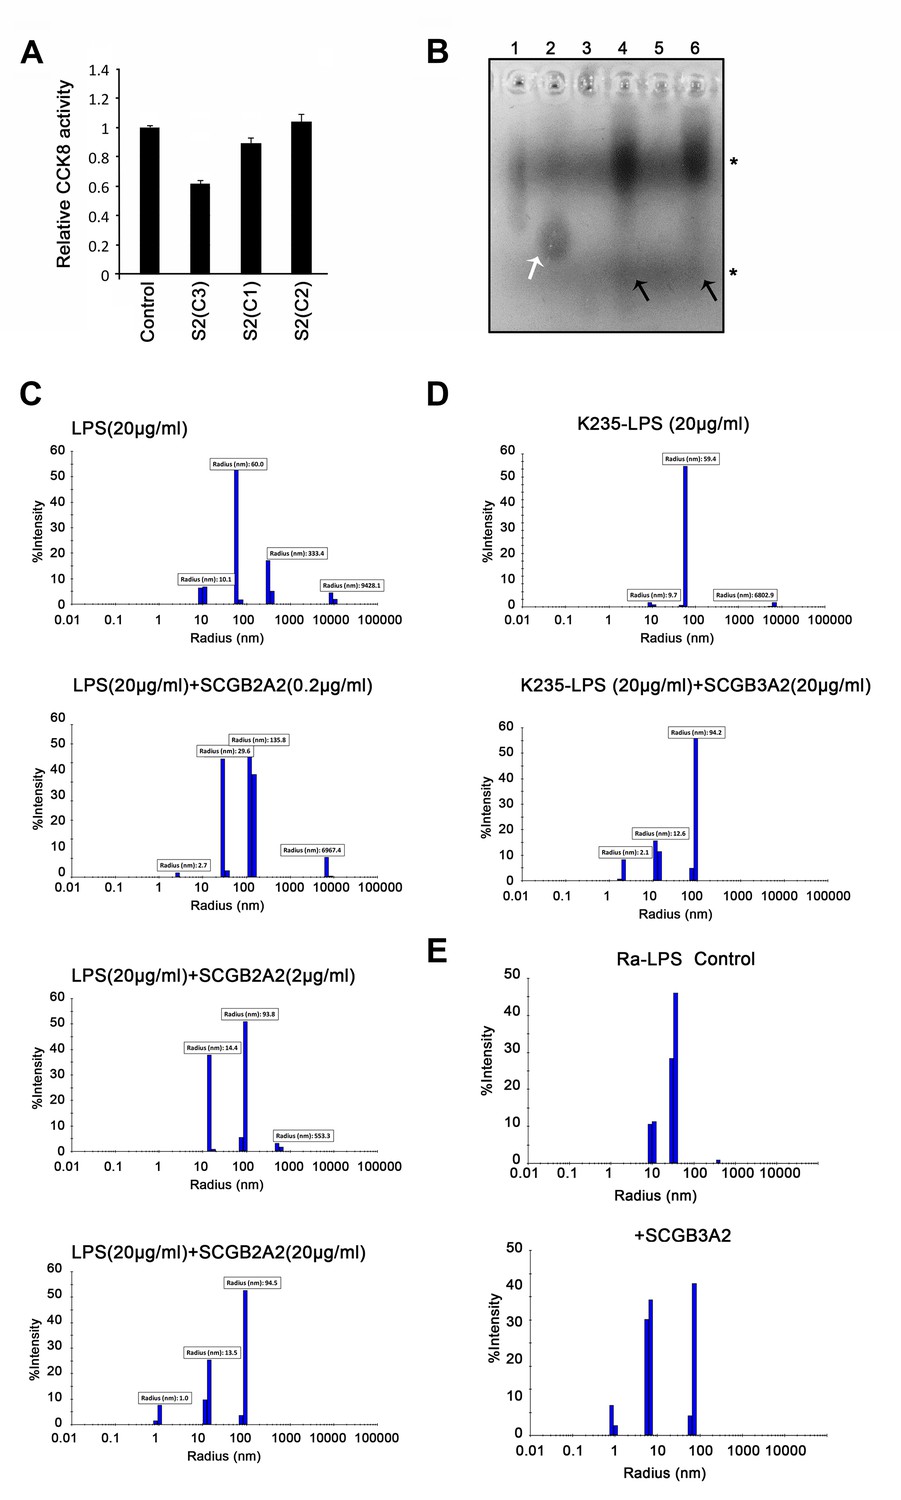
Analysis of LPS-SCGB3A2 complex.
(A) CCK8 analysis using various recombinant SCGB3A2s (1 µg/ml) obtained from different sources/batches. LLC cells grown in 1% FBS-RPMI 1640 medium were harvested at 72 hr and analyzed. Averages ± SD from more than three experiments, each in triplicate. S2; SCGB3A2. For C1, C2, and C3, please see Supplementary file 1. (B) Reverse staining of aggregation of LPS. Imidazole-zinc staining of LPS from E. coli EH 100 (Ra mutant) (lane1 and 2), LPS from Salmonella typhimurium (lane 3 and 4), LPS from E. coli K235 (lane 5 and 6). Each form of LPS (10 µg) was incubated with human SCGB3A2 (10 µg) in lane 2, 4 and 6. Asterisks (*) indicate the size of background staining of loading dye. White arrow points to the small size band appeared upon addition of SCGB3A2. Black arrows indicate the appearance of small size smeary band upon addition of SCGB3A2. (C) DLS analysis using LPS (O111:B4, 20 µg/ml) and pre-incubation with SCGB3A2, 0 as control, 0.2, 2, and 20 µg/ml. (D) DLS analysis using E.coli K235 serotype LPS (20 µg/ml) without and with human SCGB3A2 (20 µg/ml). (E) DLS results for Ra-LPS (20 µg/ml) with or without pre-incubation with human SCGB3A2 (20 µg/ml). Experiments in B-E were carried out at least 2–3 times, and each time, similar results were obtained.
Figure 3 with 1 supplement
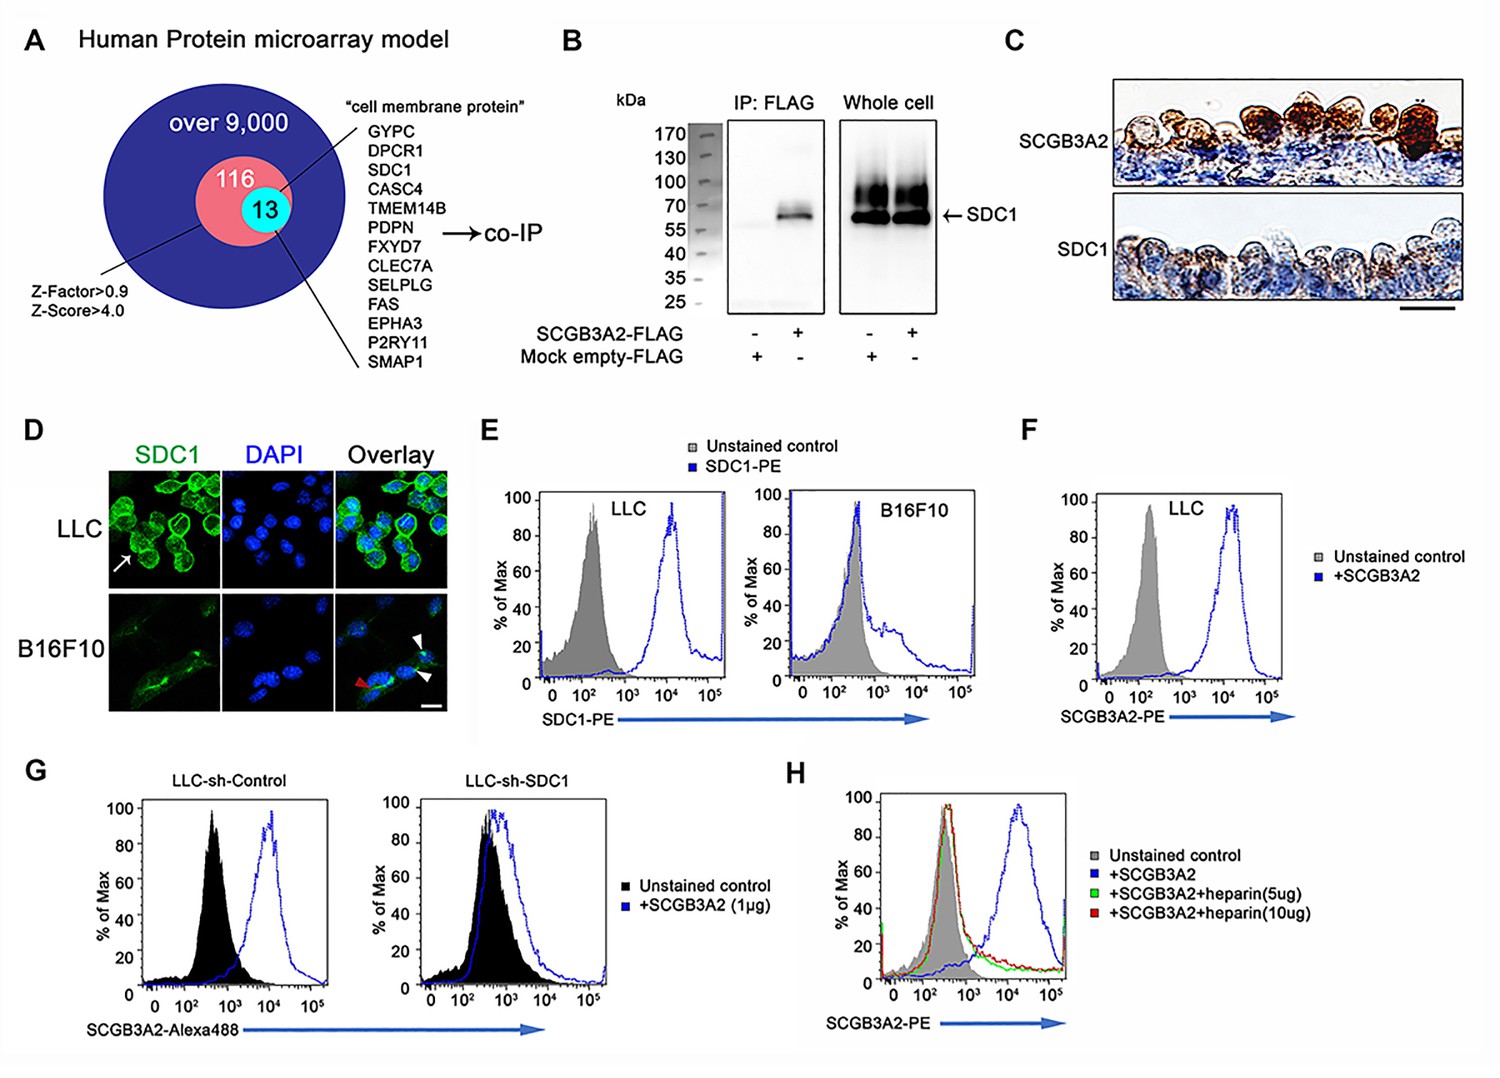
SCGB3A2 binding to LLC cells through HS of SDC1.
(A) Schematic model of a human protein array for the isolation process of candidate genes shown as a Venn diagram. (B) Co-immunoprecipitation assay of SCGB3A2-FLAG and SDC1-Myc-His in COS-1 cells. IP and western blotting were sequentially carried out using anti-FLAG and anti-Myc antibody, respectively. (C) SCGB3A2 and SDC1 immunostaining in the airway epithelial cells of adult wild-type mouse lungs. Counterstained with Hematoxylin. Bar = 10 µm. (D) Immunofluorescent staining of SDC1 in LLC and B16F10 cells grown in 10%FBS-RPMI 1640 medium for 24 hr. DAPI was used for nuclear staining. White arrow indicates SDC1 cell surface expression in LLC. Red arrowhead points to the staining at cell-cell junction and white arrowheads point to focal SDC1 staining near the nucleus in B16F10 cells. Bar = 20 µm. (E) Flow cytometric analysis for SDC1 expression on cell surfaces of LLC and B16F10 cells using PE conjugated anti-SDC1 ectodomain specific antibody. (F) Flow cytometric analysis for SCGB3A2 binding to LLC cells using anti-SCGB3A2 antibody. GST tagged mouse SCGB3A2 (3 µg) was incubated with LLC cells at 4 ˚C for 30 min. Cells were stained with rabbit anti-mouse SCGB3A2 antibody, followed by staining with PE-anti-rabbit IgG antibody at 4 ˚C for 30 min. (G) SCGB3A2 binding assay on LLC-sh-Control or sh-SDC1 cells. GST tagged mouse SCGB3A2 (1 µg) was incubated with each cell type at 4 ˚C for 30 min, followed by staining with Alexa 488 anti-rabbit IgG antibody at 4 ˚C for 30 min. (H) SCGB3A2 binding assay on LLC cells. Cells were co-incubated with or without GST tagged mouse SCGB3A2 (1 µg) or SCGB3A2 + heparin. Cells were stained with PE-anti-rabbit IgG antibody at 4 ˚C for 30 min. Data except A are the representative from more than three independent experiments.
-
Figure 3—source data 1
Results of whole protein-protein interaction array.
- https://doi.org/10.7554/eLife.37854.008
Figure 3—figure supplement 1
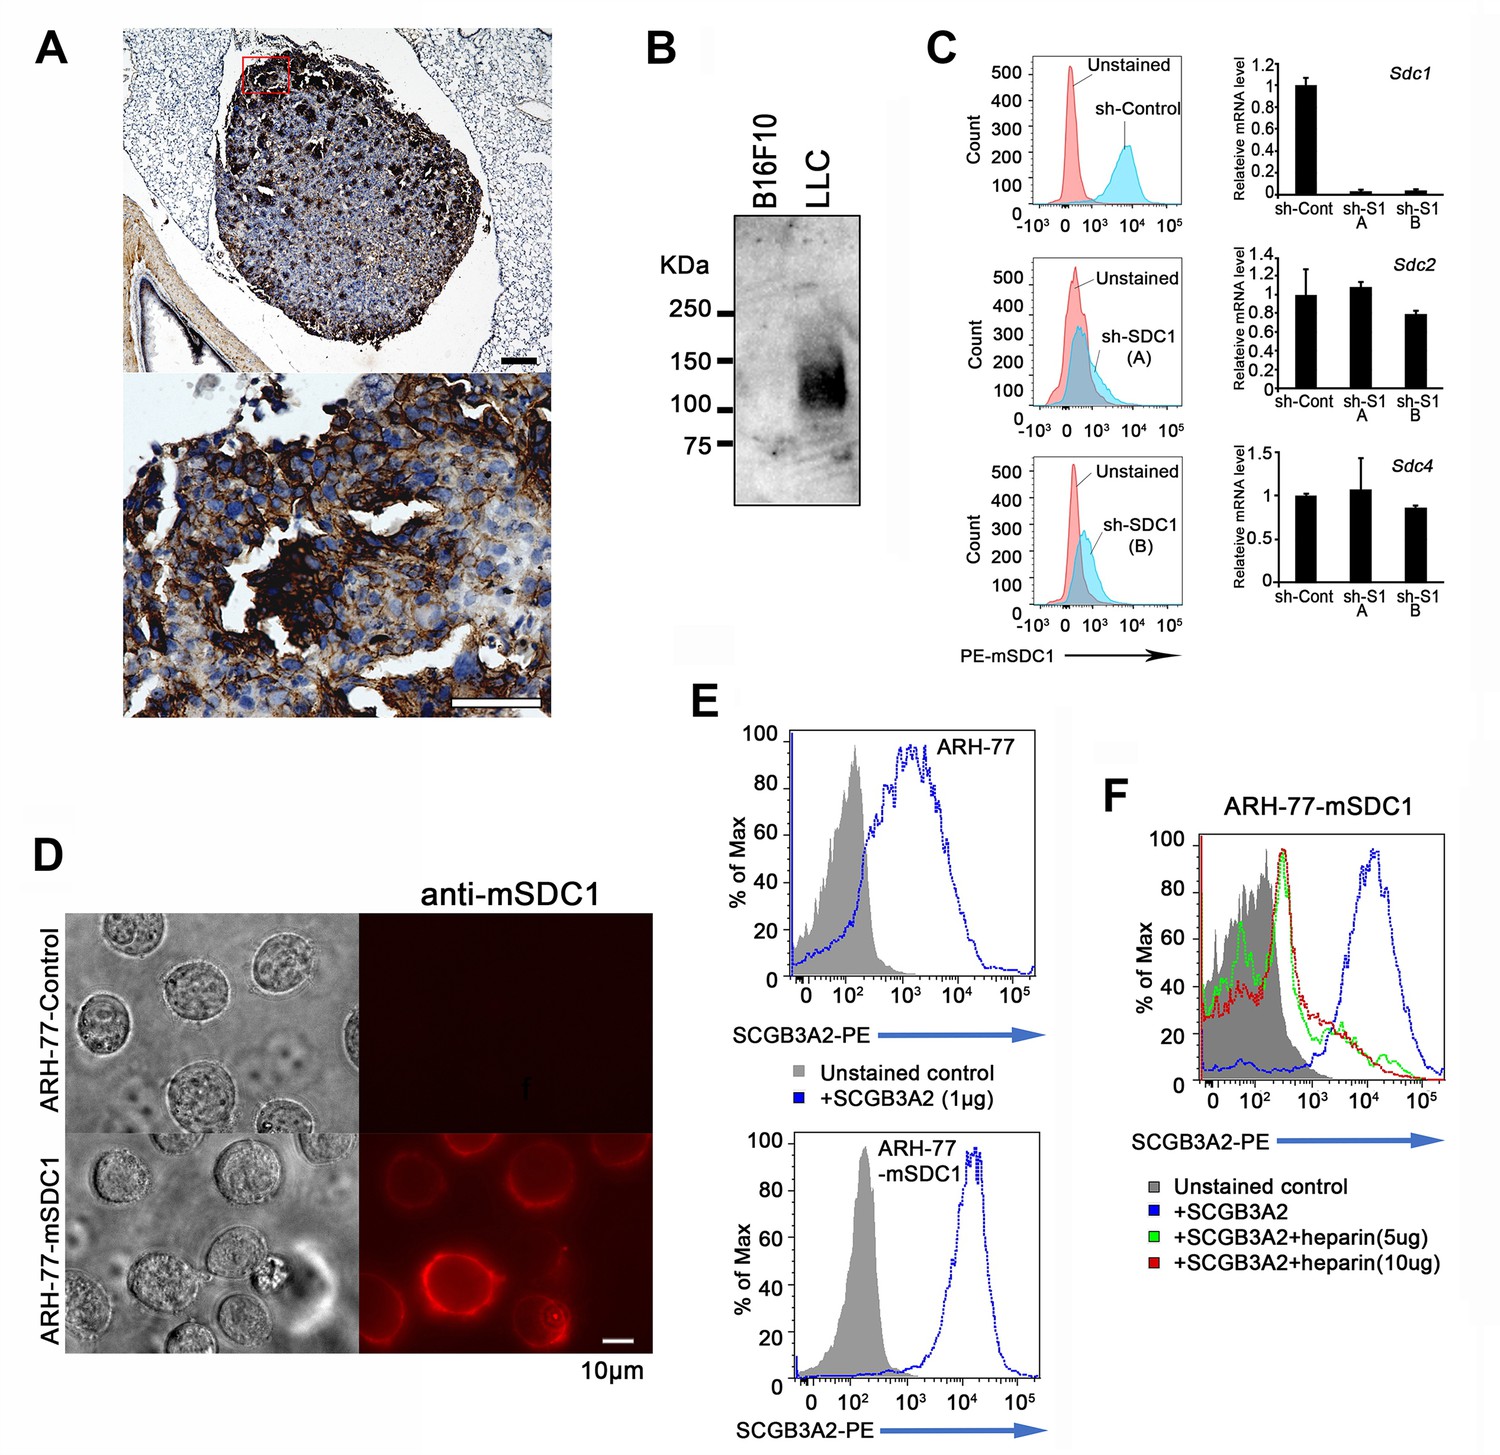
Cell surface expression of SDC1 and validation of sh-SDC1 and ARH-77-mSDC1 clones.
(A) Representative IHC for SDC1 in lung metastasized LLC cells in mice. Bar = 200 µm (upper), 50 µm (bottom). Bottom is magnified image of red rectangle area. (B) LLC and B16F10 cells grown in 10% FBS-RPMI 1640 for 24 hr were subjected to subcellular fractionation using kit (see Materials and methods) and SDC1 expression on the cell membrane fraction was examined by western blotting using anti-SDC1 ectodomain specific antibody. (C) Left: FACS analysis for mouse SDC1 expression using LLC-sh-Control and two different LLC-sh-SDC1 clones (A and B). Right: qPCR analysis for Sdc1, Sdc2 and Sdc4 mRNA expressions using LLC-sh-Control and two different sh-SDC1 clones (A and B). Accordingly, sh-SDC1(A) clone was used in the current studies. (D) Validation of mouse SDC1 expressions on ARH-77-mSDC1 cells using anti-mouse SDC1 antibody. Images are the representatives of two independent experiments. Bar = 10 µm. (E) SCGB3A2 binding assay on ARH-77-control or ARH-77-mSDC1 cells. GST tagged mouse SCGB3A2 (1 µg) was incubated with each cell type at 4 ˚C for 30 min, followed by staining with PE-anti-rabbit IgG antibody at 4 ˚C for 30 min. (F) SCGB3A2 binding assay on ARH-77-mSDC1 cells. Cells were co-incubated with or without GST tagged mouse SCGB3A2 (1 µg) or SCGB3A2 + heparin. Western blotting and flow cytometric analysis were carried out more than three times, and each time, similar results were obtained.
Figure 4 with 5 supplements
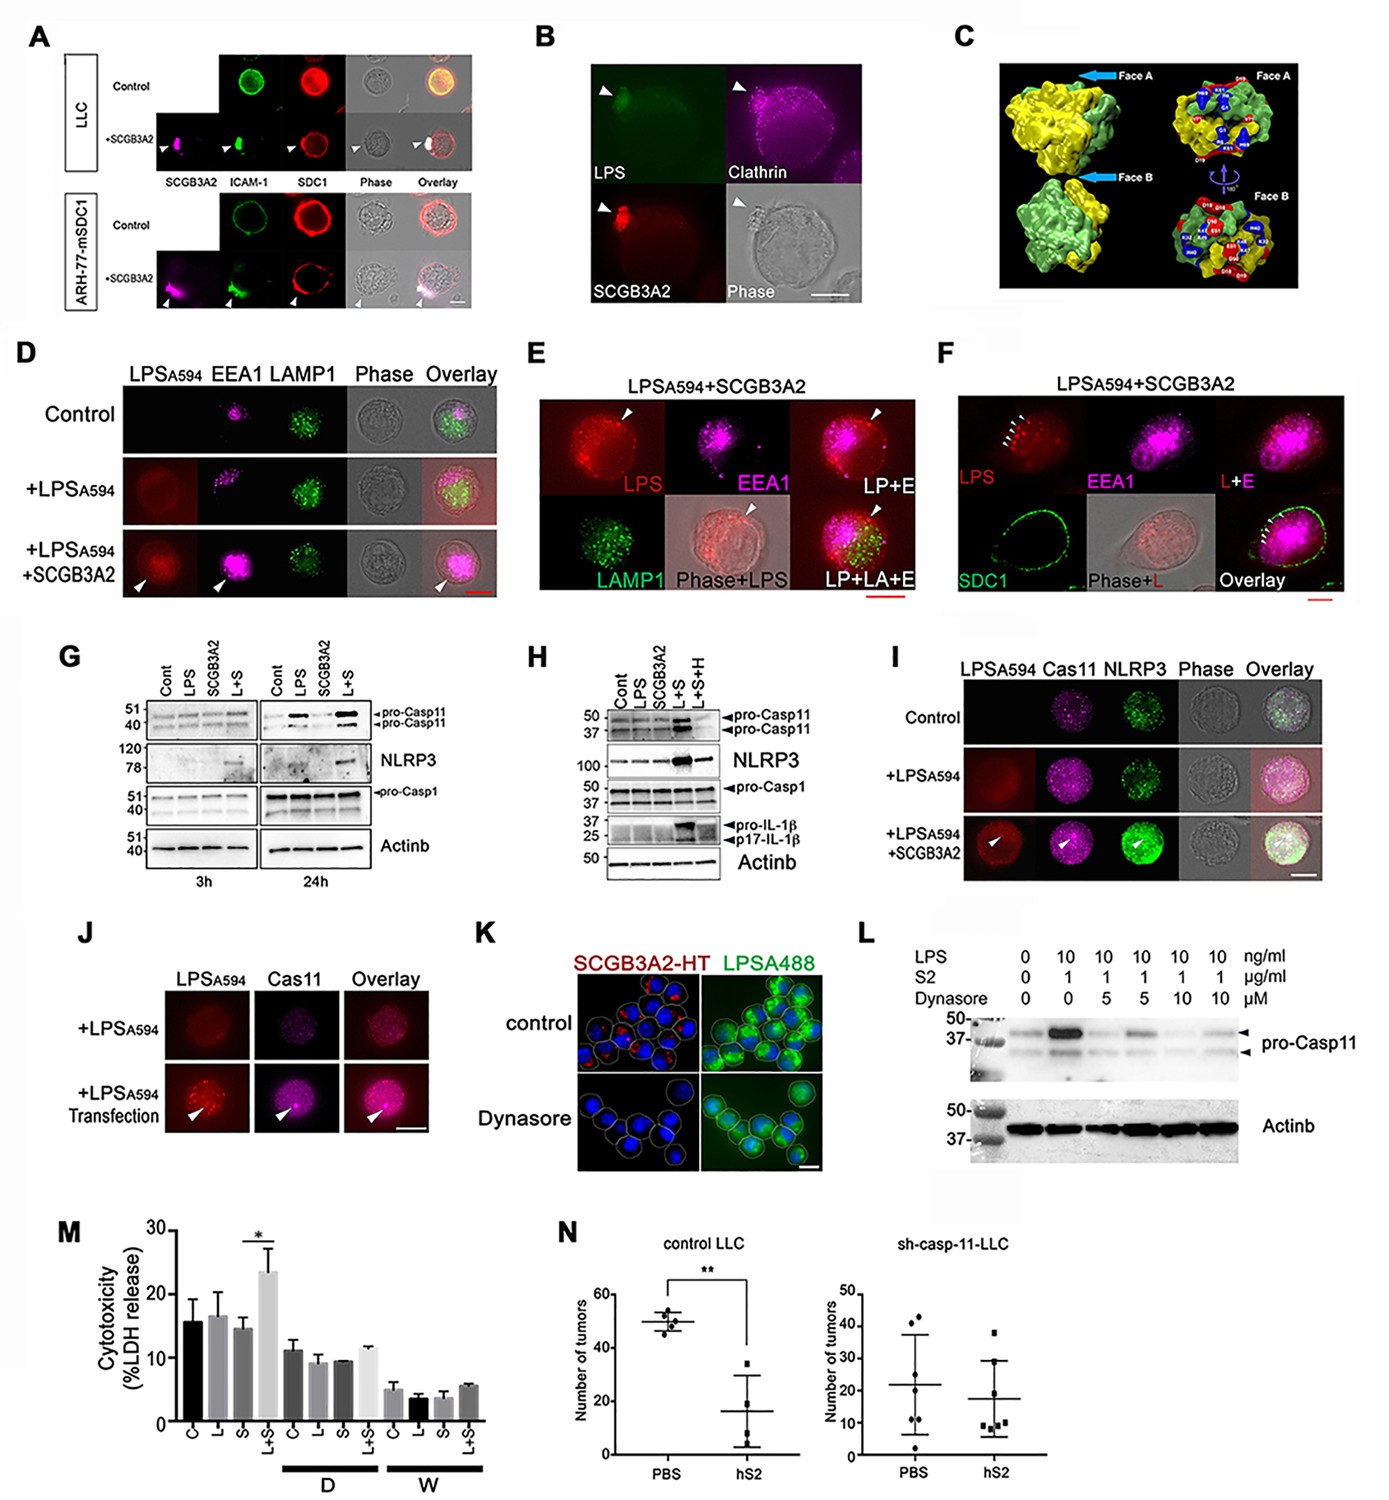
SCGB3A2-LPS uptake activates inflammasome signaling.
(A) Immunofluorescence analysis of LLC and ARH-77-mSDC1 cells for SCGB3A2, SDC1, and ICAM-1. Arrowheads: uropod-like structures. Cells were incubated in 0% FBS-RPMI 1640 for 40 min (0%40 m) with or without GST-mSCGB3A2 (1 µg). Scale bar = 10 µm. (B) Immunofluorescence analysis of LLC cells for clathrin and HT (HaloTag). Cells were incubated with LPSA488 (1 µg/ml) and SCGB3A2-HT supernatant (SN) in 0%1 hr. Arrowheads: uropod structure. Bar = 10 µm. (C) SCGB3A2 tetramer model (see Figure 4—figure supplement 2A–2F). Left: Exploded view of the tetramer model showing the two dimers, which are colored to identify the two monomers. The dimer structure reveals a pocket accessible from Face A and flanked by positively charged residues (Gly 1 N termini-; Arg 6 and Lys 61) forming a pattern consistent with a heparan or LPS binding motif. Face A is exposed in the tetramer while Face B (right) is occluded. (D) Immunofluorescence analysis of LLC cells maintained in 0%5 hr for EEA1, LAMP1 and LPSA594. Arrowhead: overlapping staining of LPSA594 and EEA1. Bar = 10 µm. (E) Immunofluorescence analysis of LLC cells after 1%16 hr incubation with LPSA594 (2 µg/ml) and SCGB3A2 (2 µg/ml). Arrowheads: cytosolic LPS signal, not overlapping with EEA1 and LAMP1 staining. LP; LPS, E; EEA1, LA; LAMP1. Bar = 10 µm. (F) Immunofluorescence analysis of LLC cells for LPSA594, EEA1, SDC1 after 1%16 hr incubation with LPSA594 (2 µg/ml) and SCGB3A2 (2 µg/ml). Arrowheads: cytosolic LPS signal, not overlapping with EEA1 and SDC1 staining. Bar = 10 µm. (G) Immunoblots of LLC-sh-TLR4 cells after treatment with or without LPS (O111:B4, 10 ng/ml) or SCGB3A2 (200 ng/ml) for 3 and 24 hr in OPTI-MEM. (H) Immunoblots of RAW264.7 cells after treatment with or without LPS (O111:B4, 1 µg/ml), SCGB3A2 (1 µg/ml), and/or heparin (1 µg/ml) for 16 hr in OPTI-MEM. Abbreviations for G and H, L: LPS, S: SCGB3A2, H: Heparin. Immunoblots shown in G and H were carried out more than 3 separate times, and each time similar results were obtained. (I) Immunofluorescence analysis of LLC cells for caspase-11 and NLRP3, incubated for 0 %5 hr with or without LPSA594 (2 µg/ml), LPSA594 +SCGB3A2 (2 µg/ml). Arrowheads: LPS, caspase-11, NLRP3 overlapping focus. Bar = 10 µm. (J) Immunofluorescence analysis of caspase-11 in LPS transfected LLC. LPSA594 (1 µg) was transfected using X-tremeGENE HP in 10%5 hr. Arrowheads: LPS and caspase-11 focus. Bar = 10 µm. All images are the representative of three independent experiments. (K) Immunofluorescence analysis of LLC cells for SCGB3A2-HT and LPSA488. Cells were incubated for 1%24 hr with or without Dynasore (10 µM), and LPSA488 (1 µg)+SCGB3A2-HT supernatant. Dotted lines depict the outer membrane of cells. Bar = 10 µm. (L) Immunoblots of LLC cells after treatment with or without LPS (O111:B4, 10 ng/ml), SCGB3A2 (1 µg/ml) or Dynasore (5 or 10 µM) for 2%3 hr. (M) LDH release from LLC cells in control condition or in the presence of Dynasore (D, 5 µM) or Wedelolactone (W, 10 µM), with or without LPS (1 µg/ml) and/or SCGB3A2 (1 µg/ml) for 2%48 hr. Average ±SD from three independent experiments, each in triplicate. S: SCGB3A2, L + S; LPS +SCGB3A2. *: p<0.05 by one-way ANOVA. (N) Summary for the numbers of pulmonary surface tumors in lungs of intravenous metastasis model mice using LLC-control or LLC-sh-Casp-11 cells and indicated treatments. hS2; human SCGB3A2. A dot indicates a mouse. **: p<0.01 by student’s t-test.
Figure 4—figure supplement 1
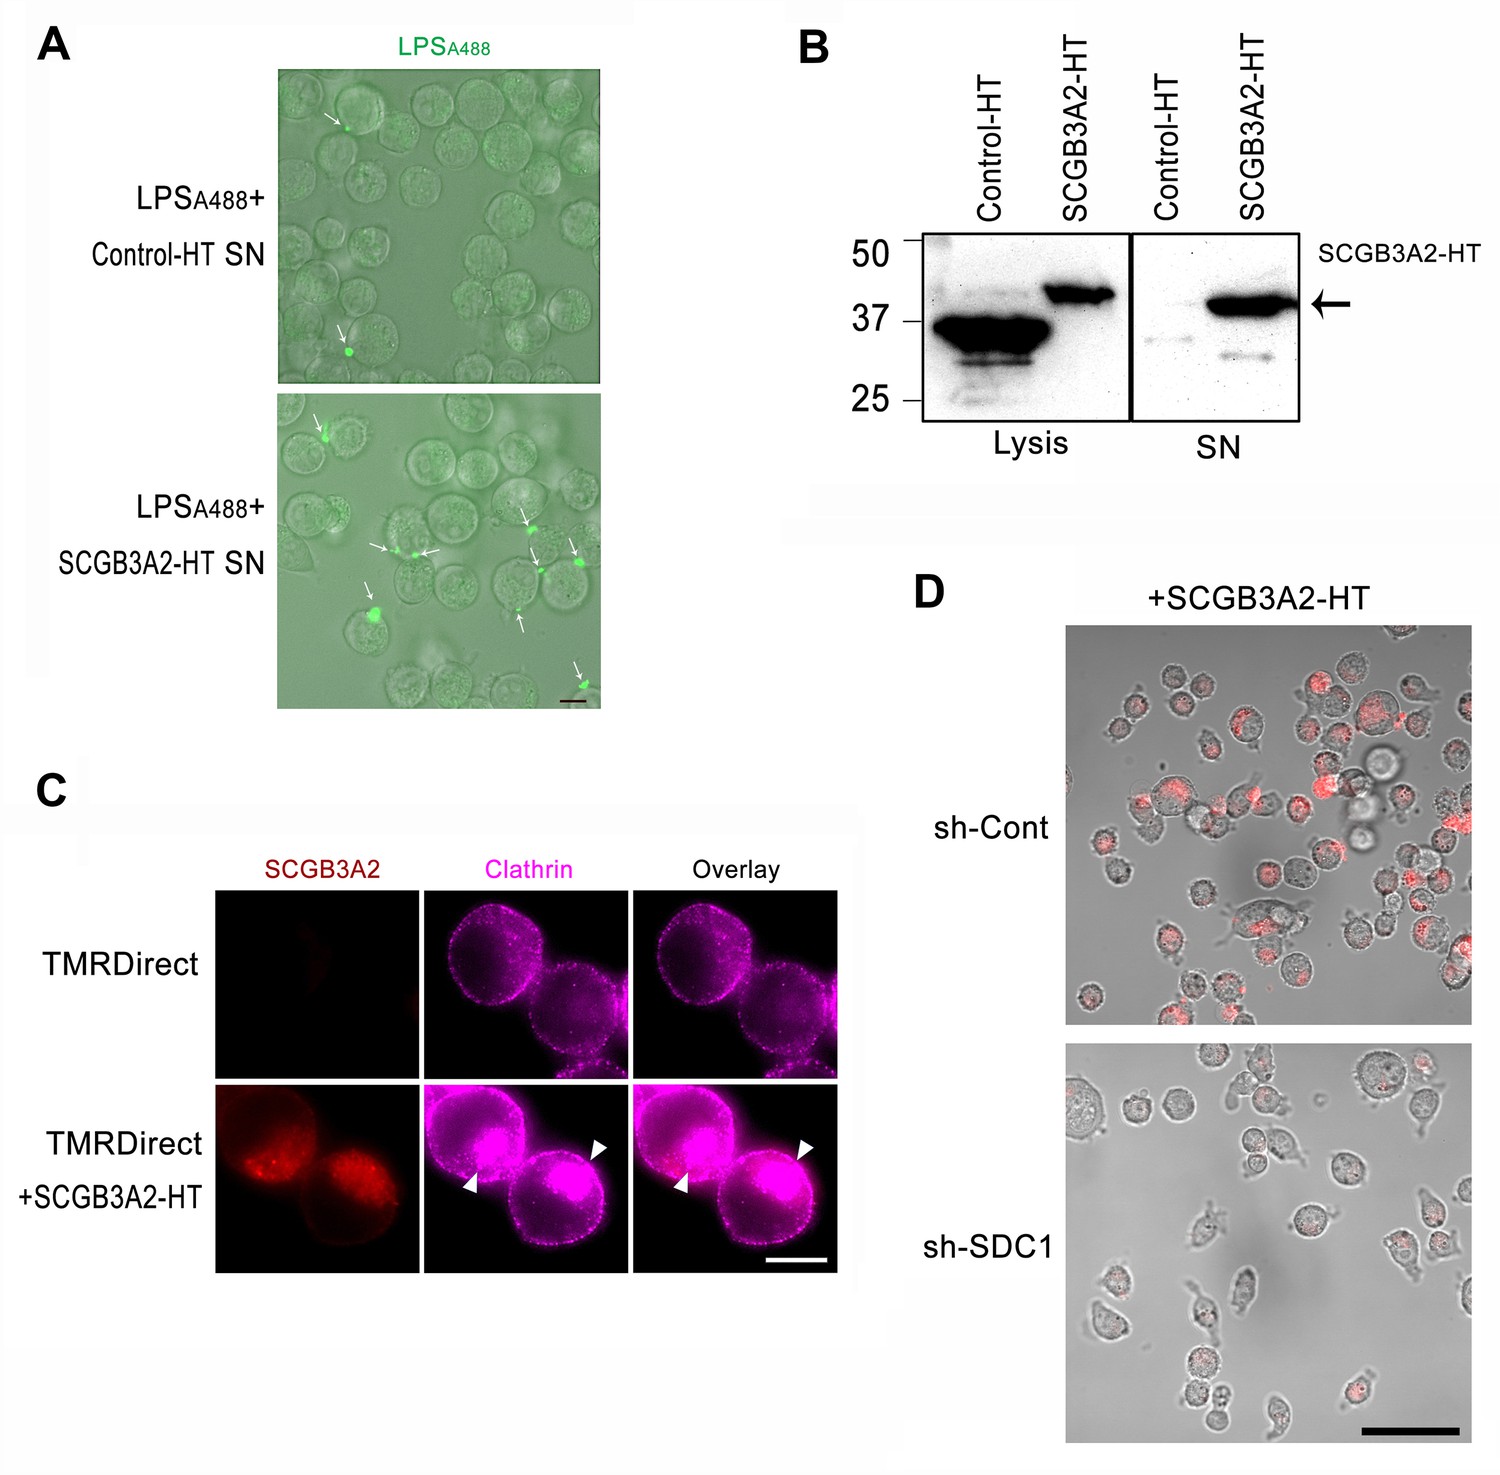
Analysis of SCGB3A2-HaloTag protein trafficking.
(A) Live cell imaging of LPSA488 binding to LLC cells. LLC cells were incubated in 1%FBS-RPMI1640 with LPSA488 (1 µg/ml) for 16 hr with HaloTag control vector-transfected supernatant (SN) or mouse SCGB3A2 HaloTag (HT) construct-transfected SN. White arrows indicate the binding of LPSA488 on cell surfaces. Images are overlaid with phase contrast. Bar = 10 µm. (B) Immunoblot for HaloTag protein using cell lysis or culture supernatant of HEK293 cells transfected with HaloTag control vector or mouse SCGB3A2-HT vector (cf. Methods). (C) Immunofluorescence staining using Halotag TMRDirect ligand and anti-clathrin antibody. LLC cells were incubated with or without SCGB3A2-HT supernatant and TMRDirect ligand in 1% FBS-RPMI 1640 for 16 hr. After fixation, cells were stained with anti-clathrin antibody. Arrowheads indicate polarized clathrin staining. Bar = 10 µm. (D) Live cell imaging using Halotag TMRDirect ligand. LLC-sh-Control or LLC-sh-SDC1 cells were grown in 10% FBS for 16 hr with SCGB3A2-HT and Halotag TMRDirect ligand (red). Image was taken under confocal microscope. Bar = 50 µm. All experiments were carried out two-three times, and each time, similar results were obtained.
Figure 4—figure supplement 2
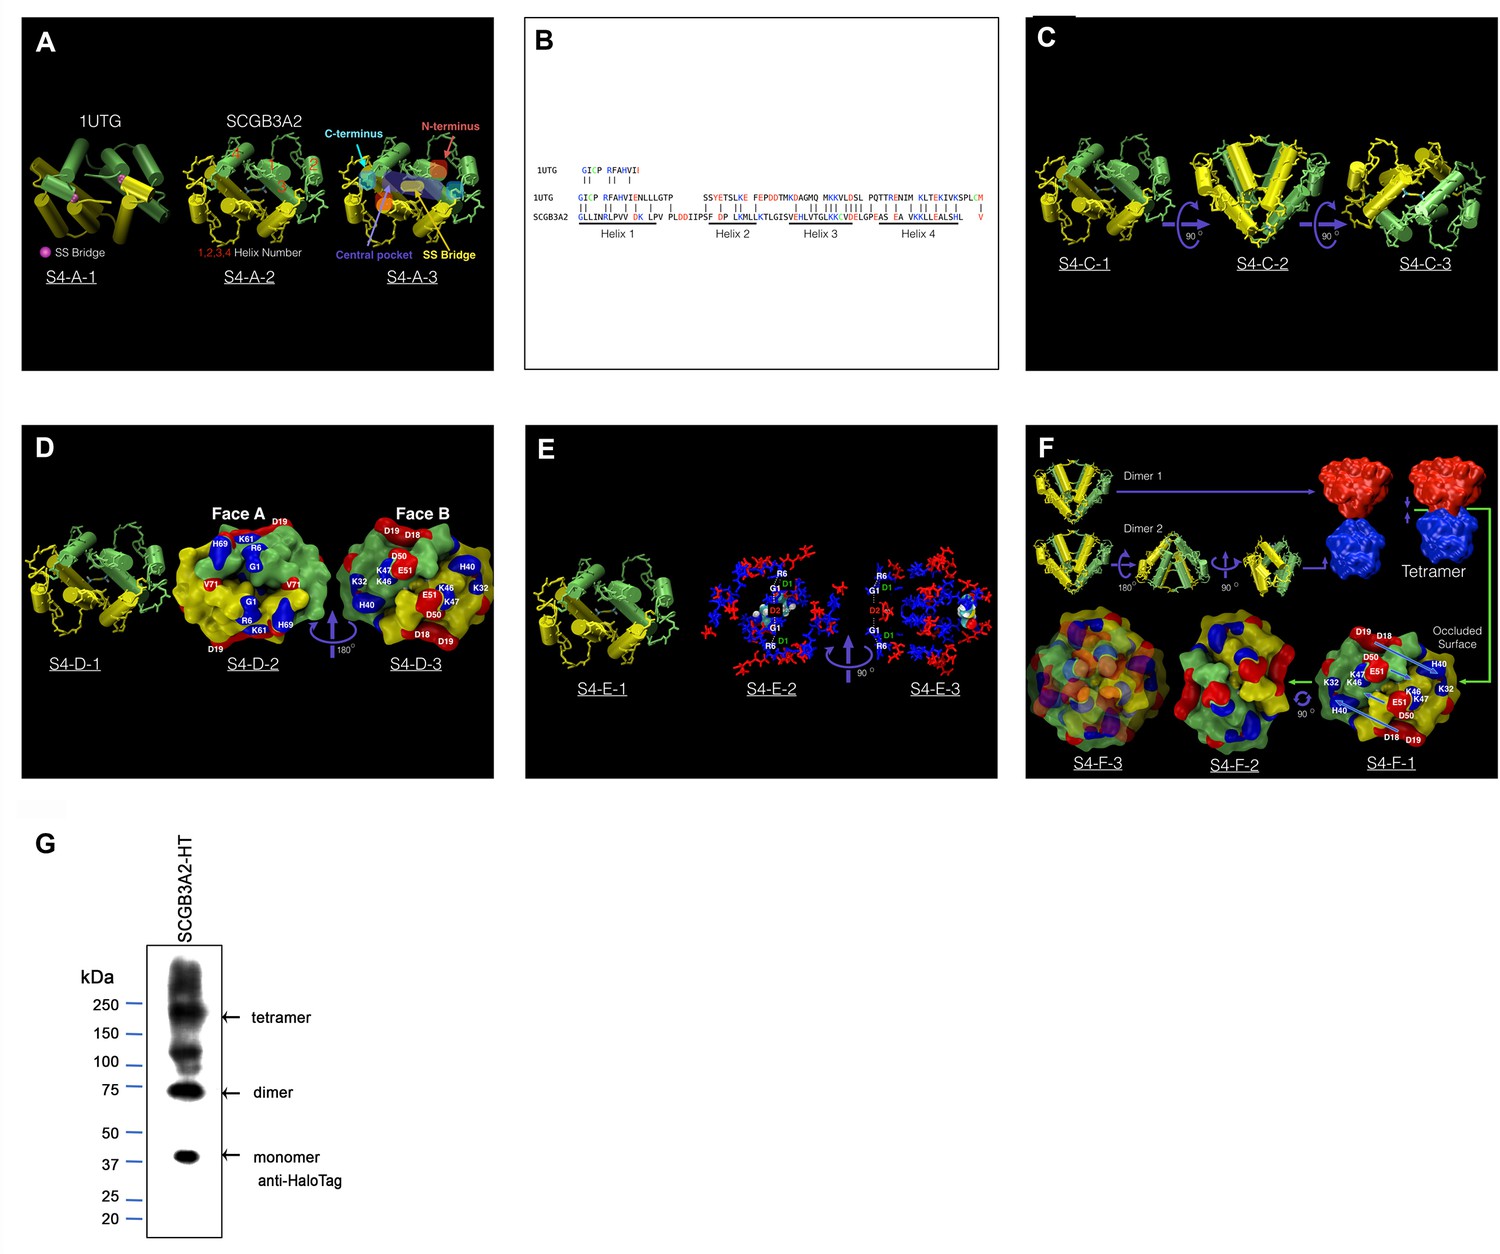
SCGB3A2 modeling.
(A) Side-by side comparison of 1UTG (uteroglobin, SCGB1A1) structure (PDBID:1UTG) and our model (SCGB3A2). S4-A-2 shows the helix number and their relative order (2-3-1-4) similar to what is observed in 1UTG. S4-A-3 shows the relative disposition of the C-terminus (cyan), N-terminus (red-brown), disulfide bridge (yellow) and the central pocket (purple). The pocket is about half the size of the one observed in 1UTG. Note the very different disposition of the termini and the disulfide bridges in both structures. 1UTG contains two Cys per monomer whereas SCGB3A2 has only one. The disposition of 1UTG disulfide bridges restricts the dimer flexibility controlling the geometry of the pocket mouth. SCGB3A2 shows a much higher flexibility of the corresponding region suggesting a more flexible pocket. (B) 1UTG/SCGB3A2 sequence alignment obtained from the structural alignment of the two dimers. SCGB3A2 initial model was obtained by aligning the core regions of helices 1 to 4 against the structure of 1UTG. The helix motifs were obtained by analyzing the consensus predictions from several modeling methods (see Materials and methods, SCGB3A2 Modeling). The initial alignment of the predicted helical motifs was performed ignoring the placement of the charged amino acids and cysteines to lower the model bias. After the initial placement was obtained the connecting sections were built as coil sections, and the entire model relaxed using FRMD (see Materials and methods, SCGB3A2 Modeling). The perceived sequence correspondence between 1UTG and SCGB3A2 is presented. Most noticeable albeit not detected in the sequence alignment is the resulting spatial arrangement of SCGB3A2 Cys at the end of the model refinement, placing the cysteins from the monomers in the dimer in a perfect arrangement to satisfy the constraint imposed by a disulfide bridge. The overall sequence functional similarity between 1UTG and SCGB3A2 can be estimated from this alignment at 46% with a similar number of positively charged residues for both structures (11 aa per monomer if His is included) and 11 negatively charged residues per monomer for SCGB3A2 (12 for 1UTG) which may help explain the high propensity of SCGB3A2 to interacting with negatively charged motifs. (C) General view of the SCGB3A2 dimer rotated 180 Deg in 90 Deg increments to emphasize the placement of the disulfide bridge. The view presented in S4-C-1 is similar to the one previously shown in S4-A-2 (D) This view presents the dimer model in a surface decomposition with the monomers in yellow and lime color and charged residues in blue (positive) and red (negative). The view presented in S4-D-1 is similar to the one previously shown in S4-C-1 and is presented for reference purposes. The model is rotated 180 Deg to expose to faces A and B (Image S4-D-2 and S4-D-3). The anterior (Face A) is dominated by a cluster of positive residues involving G1 (N-termini), R6, K61 and possibly H69 flanking the mouth of the pocket. The posterior orientation (Face B) is dominated by a cluster formed by residues K46, K47, D50, and E51 flanked by D18, D19, K32, and H40. (E) The relative disposition of the positively charged residues in Face A (Image S4-D-2) corresponds well with a motif capable of a strong interaction with both Heparan and/or LPS showing an ideal separation between the charged motifs of 3.3 Å (D1) and 12.5 Å (D2) (see Materials and methods, SCGB3A2 Modeling) (F) A model of a tetramer was explored by rolling a rigid dimer over a second one followed by distance optimization and refinement of the most promising geometries. Putative models for a tetramer were built from the resulting geometries. The most promising arrangements were the result of the mutual avoidance of charges as expected from the highly charged surface of the dimer. The most promising arrangement obtained resulted from the screw rotation of a dimer respect of another with the two interacting by the posterior side of each dimer (Face B, Image S4-D-3). This arrangement resulted in the approximate interleaving on charges as indicated by the arrows in S4-F-1 and observed in the 90 Deg rotated view of Face B (S4-F-2). S4-F-3 presents a semi-translucent overlapping of S-F-2 and S-F-1 (after removal of the annotation) emphasizing the interleaving of the charged residues. The tetramer motif places the two Face A from each dimer far apart minimizing the interaction between the surface positively residues in both dimers. This model suggests the tetrameric form may be capable of simultaneous binding of two negatively charged motifs (i.e. Heparin and LPS). (G) SDS-PAGE image of mSCGB3A2-HT using anti-HaloTag antibody.
Figure 4—figure supplement 3
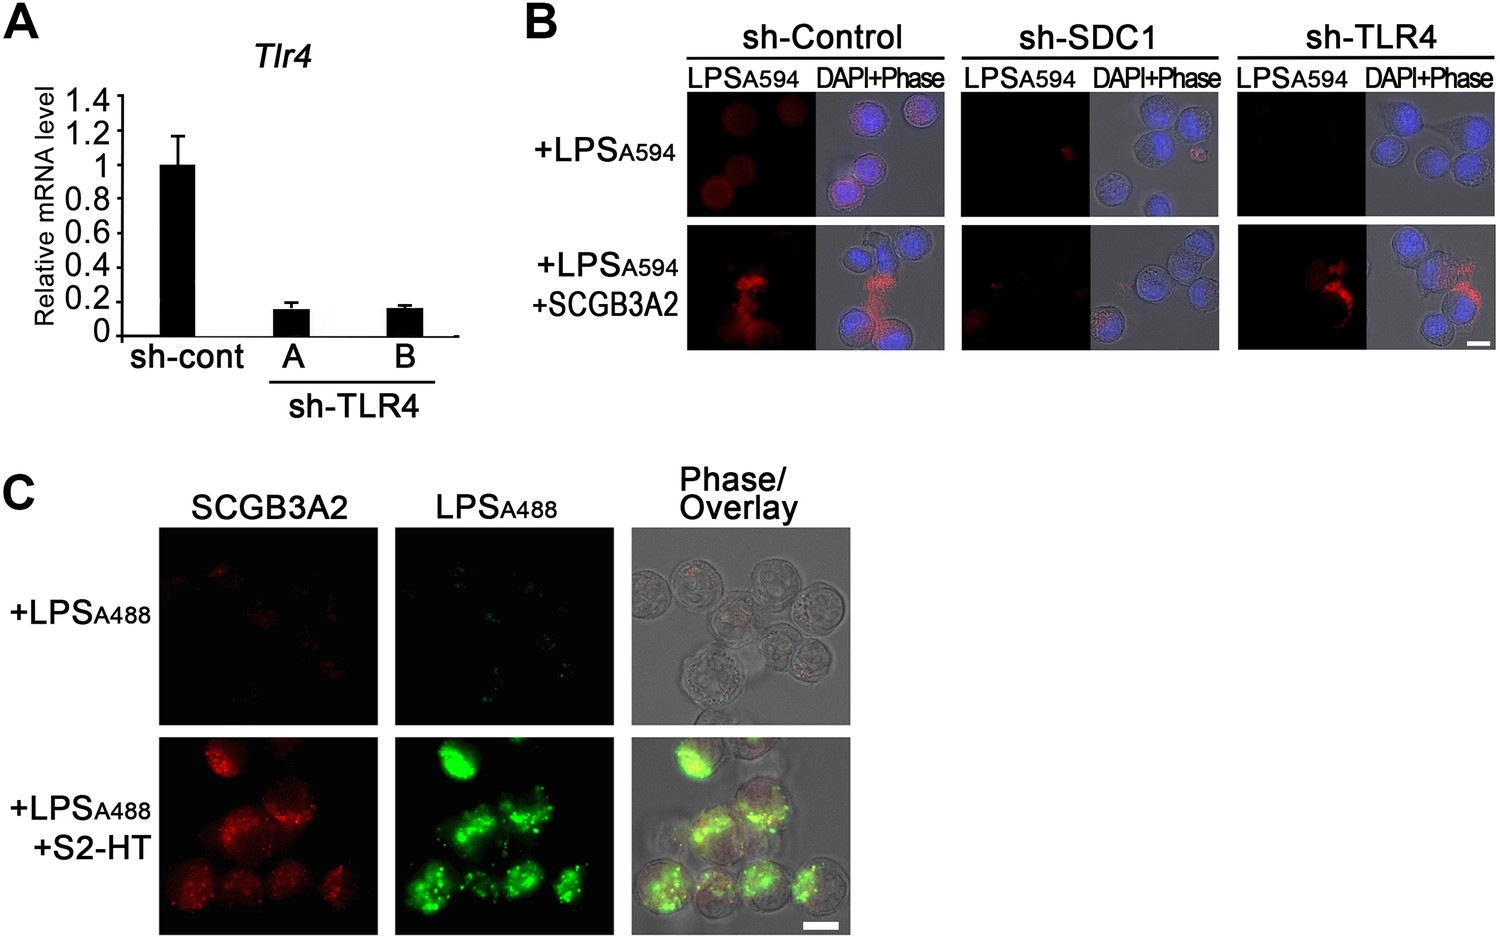
Establishment of LLC-sh-TLR4 cells and analysis of SCGB3A2/LPS binding/incorporation.
(A) Assessment of shRNA knockdown efficiency in LLC Cells. LLC cells were transfected with sh-TLR4 plasmid using retrovirus vector and stable cell clones were prepared. Each clone was grown in 2% FBS-RPMI 1640 and total RNA was collected after 48 hr. qPCR analysis of Tlr4 mRNA expression in LLC-sh-Control, and two clones (A, B) of LLC-sh-TLR4. Accordingly, sh-TLR4(A) clone was used in the current studies. Graphs are the representatives of three independent experiments, each in triplicate. (B) Immunofluorescent staining for LPSA594 binding to LLC cells. LLC-sh-Control, LLC-sh-SDC1, or LLC-sh-TLR4 cells were incubated with LPSA594 (2 µg/ml) with or without SCGB3A2 (4 µg/ml) in 0% FBS-RPMI 1640 for 3 hr. Nuclei were stained with DAPI. Images are the representatives of three independent experiments. Bar = 10 µm. (C) Live cell imaging using SCGB3A2-HT supernatant, Halotag ligand, and LPSA488 of LLC-sh-TLR4 cells. Cells were cultured in 1% FBS-RPMI 1640 for 16 hr. Halotag signals conjugated with SCGB3A2 were visualized with HaloTag TMRDirect ligand. Images are the representatives of three independent experiments. S2:SCGB3A2. Bar = 10 µm.
Figure 4—figure supplement 4
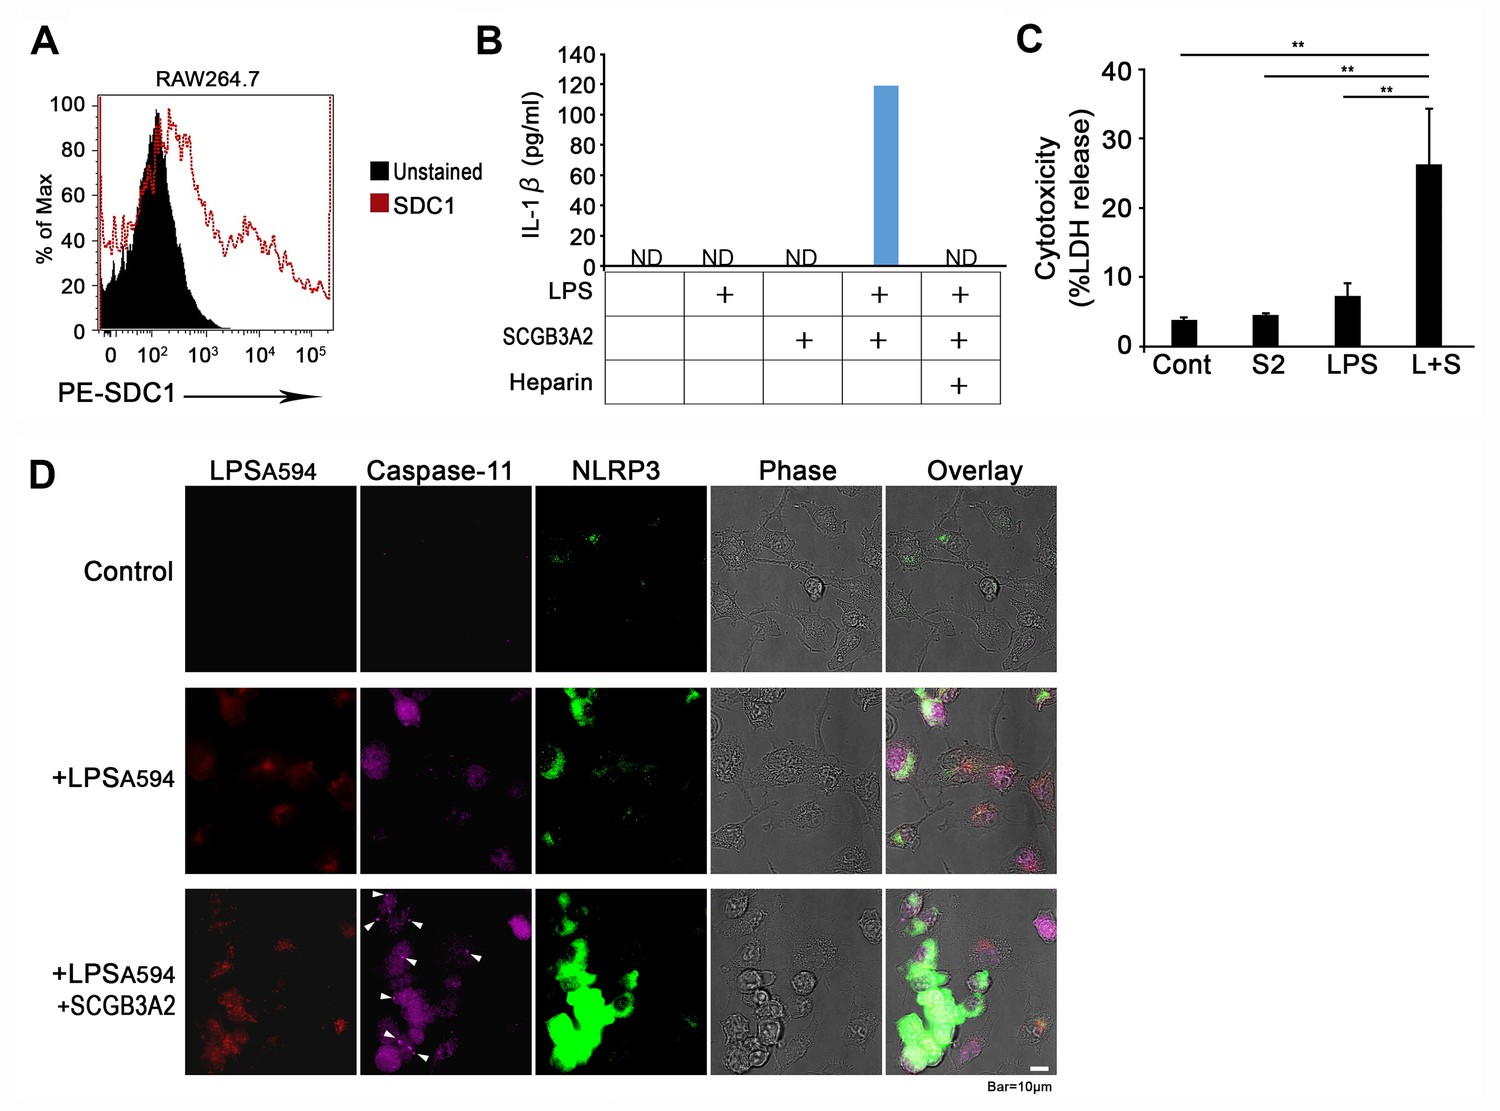
Effect of SCGB3A2-LPS on RAW264.7 cells.
(A) Flow cytometric analysis for SDC1 expression on RAW264.7 cells. PE conjugated mouse SDC1 ectodomain specific antibody was used for detection of cell surface SDC1 expressions on RAW264.7 cells. (B) IL-1β secretion into culture medium determined by ELISA. RAW 264.7 cells treated with human SCGB3A2 (1 µg/ml), LPS (O111:B4) (1 µg/ml), and/or heparin (1 µg/ml) were cultured in OPTI-MEM for 16 hr and supernatant was harvested and analyzed. Data are the representative of three independent experiments. ND; not detectable. (C) LDH release from unprimed RAW264.7 cells with or without LPS (1 µg/ml) and/or SCGB3A2 (1 µg/ml) for 16 hr in OPTI-MEM. Averages ± SD from three independent experiments, each in triplicate. S2: SCGB3A2, L + S; LPS +SCGB3A2. **: p<0.01 by one-way ANOVA. (D) Immunofluorescence analysis of RAW264.7 cells using LPSA594, anti-caspase-11, or anti-NLRP3 antibodies. Cells were treated with or without LPSA594 (1 µg/ml) and/or human SCGB3A2 (1 µg/ml) in 1% FBS-RPMI 1640 for 16 hr. Arrowheads indicate caspase-11 foci. Bar = 10 µm. Flow cytometry and imaging results shown are the representatives of three independent experiments.
Figure 4—figure supplement 5
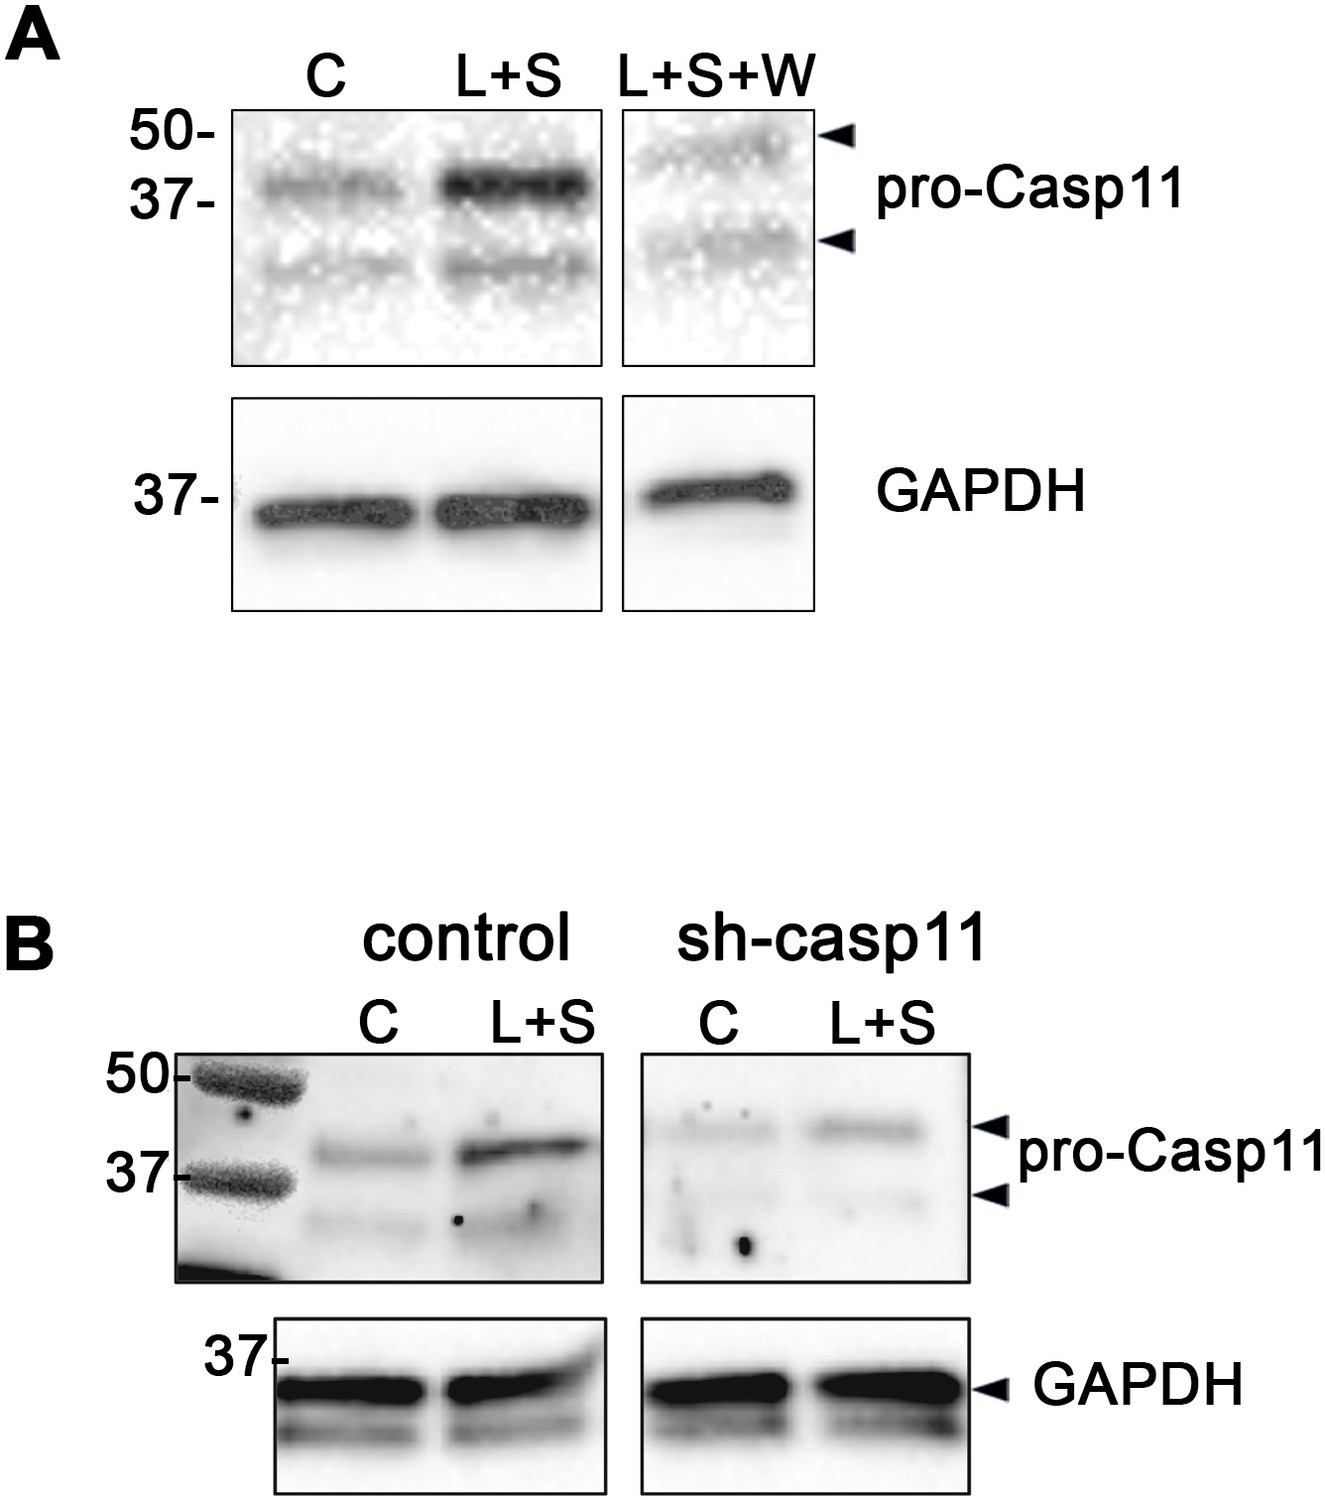
Confirmation of caspase-11 knockdown in LLC cells in the presence of Wedelolactone or LLC-sh-casp11 cells.
(A) Immunoblots of LLC cells for caspase-11 and GAPDH after treatment with or without LPS (L, 10 ng/ml), SCGB3A2 (S, 200 ng/ml), Wedelolactone (W, 50 µM) in 2%FBS-RPMI for 3 hr. C: control. (B) Immunoblots for caspase-11 and GAPDH using cell lysis of control LLC or sh-casp11 shRNA transfected LLC cells after treatment with or without LPS (L, 10 ng/ml), SCGB3A2 (S, 200 ng/ml) in 2%FBS-RPMI for 3 hr. C: control.
Figure 5
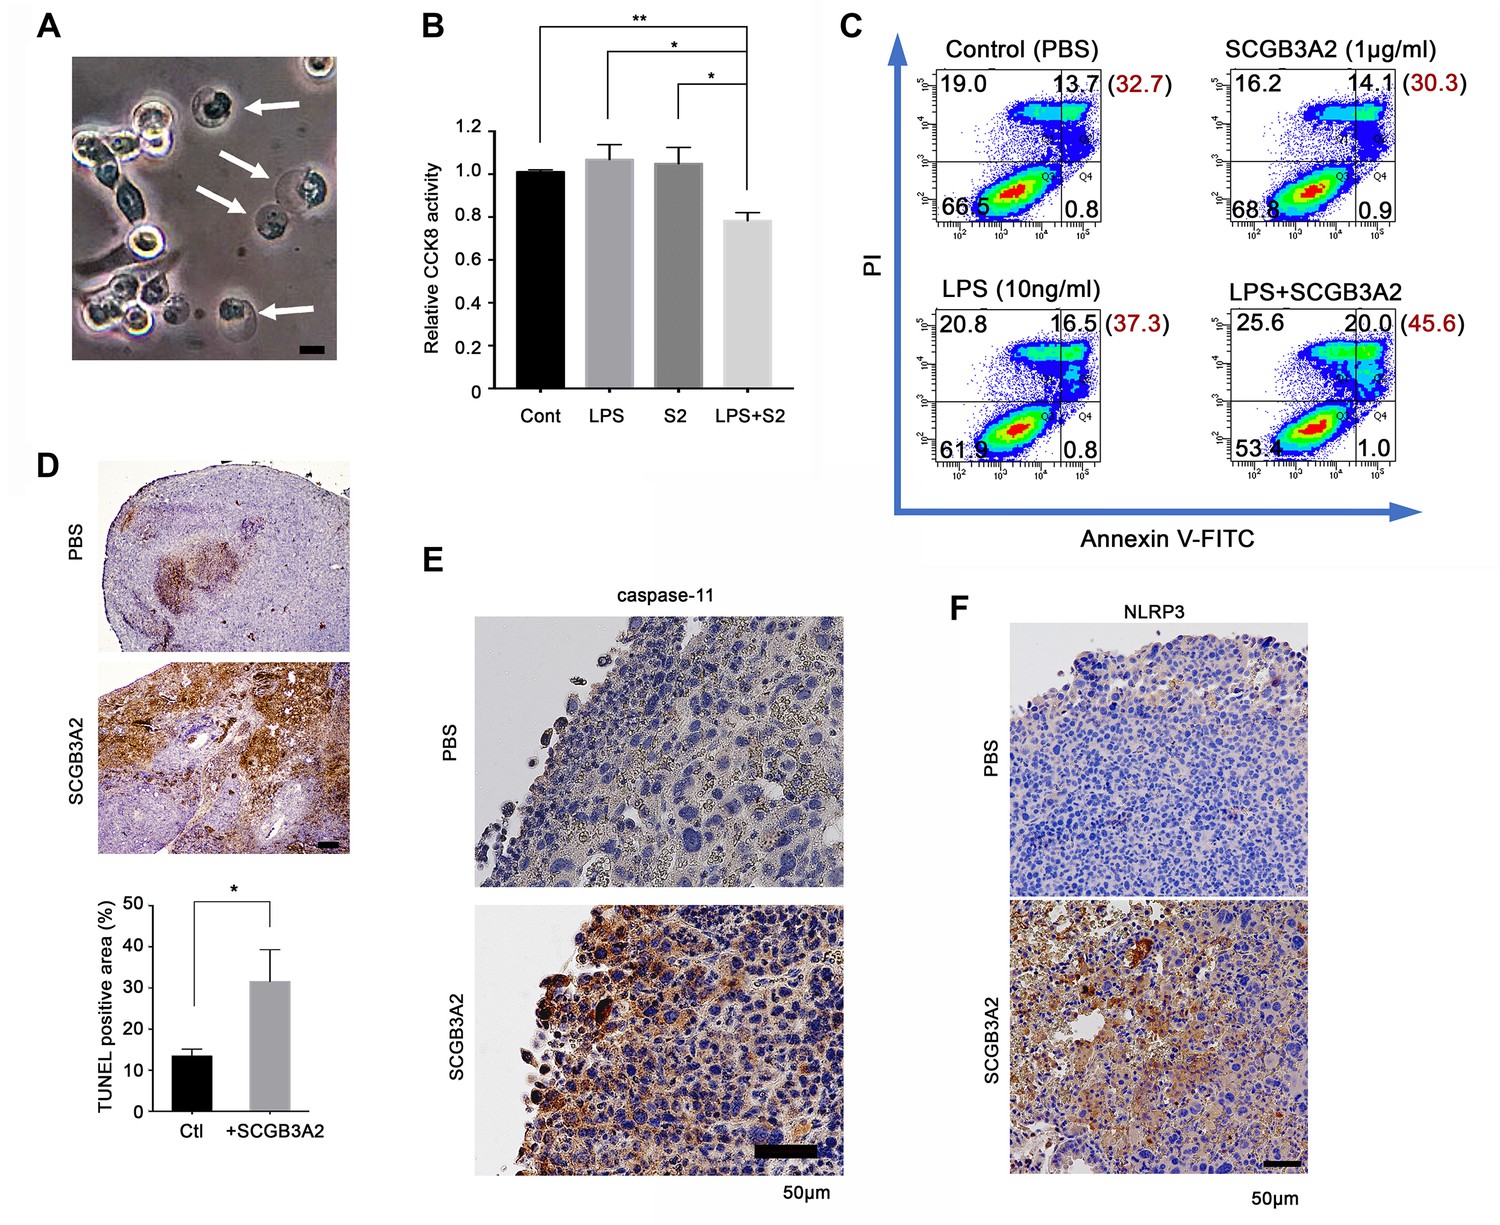
SCGB3A2-LPS promotion of pyroptotic cell death.
(A) Representative phase contrast image of LLC cells incubated with LPS (O111:B4, 1 µg/ml) and SCGB3A2 (1 µg/ml) in 1% FBS-RPMI 1640 for 72 hr. Arrows indicate cells undergoing pyroptosis (swollen cells). Bar = 10 µm. Image is the representative of three independent experiments (B) CCK8 analysis using LLC cells with LPS (O111:B4) (1 ng/ml) and/or human SCGB3A2 (C2; see Supplementary file 1) (10 ng/ml) in 2%FBS-RPMI for 72 hr culture. Data are the representative from more than three independent experiments, each in triplicate. Averages ± SD are shown. (**p<0.01, *p<0.05 by One-way ANOVA). S2; SCGB3A2. (C) Flow cytometry analysis for Annexin V/PI staining. 1 µg/ml SCGB3A2 and 10 ng/ml LPS (O111:B4) were used. LLC cells were maintained for 24 hr in 1%FBS-RPMI medium, then treated with or without SCGB3A2/LPS, and further cultured for 48 hr. The numbers in the graph indicate the cell percentage in each quadrants. The number in blanket show the total percentage of PI positive cells in each graph. Experiments were carried out more than 3 times, and each time similar results were obtained. (D) TUNEL staining of lung sections of lung metastasized LLC cells in the intravenous administration model. Images are shown for control (PBS) and mouse SCGB3A2 administered during the 2nd week. The bottom graph indicates the percentage of TUNEL positive areas per total LLC tumor areas as measured using imageJ. +SCGB3A2 indicates lungs of mice that received SCGB3A2 during the 1 st week. Ctl, control. Three independent lung samples were evaluated for each group. *p<0.05 by student’s t-test. (E) Representative IHC staining of caspase-11 for metastasized nodules of LLC cells in lung in vivo. Images are shown for control (PBS) and mouse SCGB3A2 administered during the 1 st week. Counterstained with Haematoxylin. Bar = 50 µm. (F) Representative IHC staining of NLRP3 for metastasized nodules of LLC cells in lung. Images are shown for control (PBS) and mouse SCGB3A2 administered during the 1 st week. Counterstained with Haematoxylin. Bar = 50 µm. IHC staining was carried out using more than three independent lung samples.
Figure 6
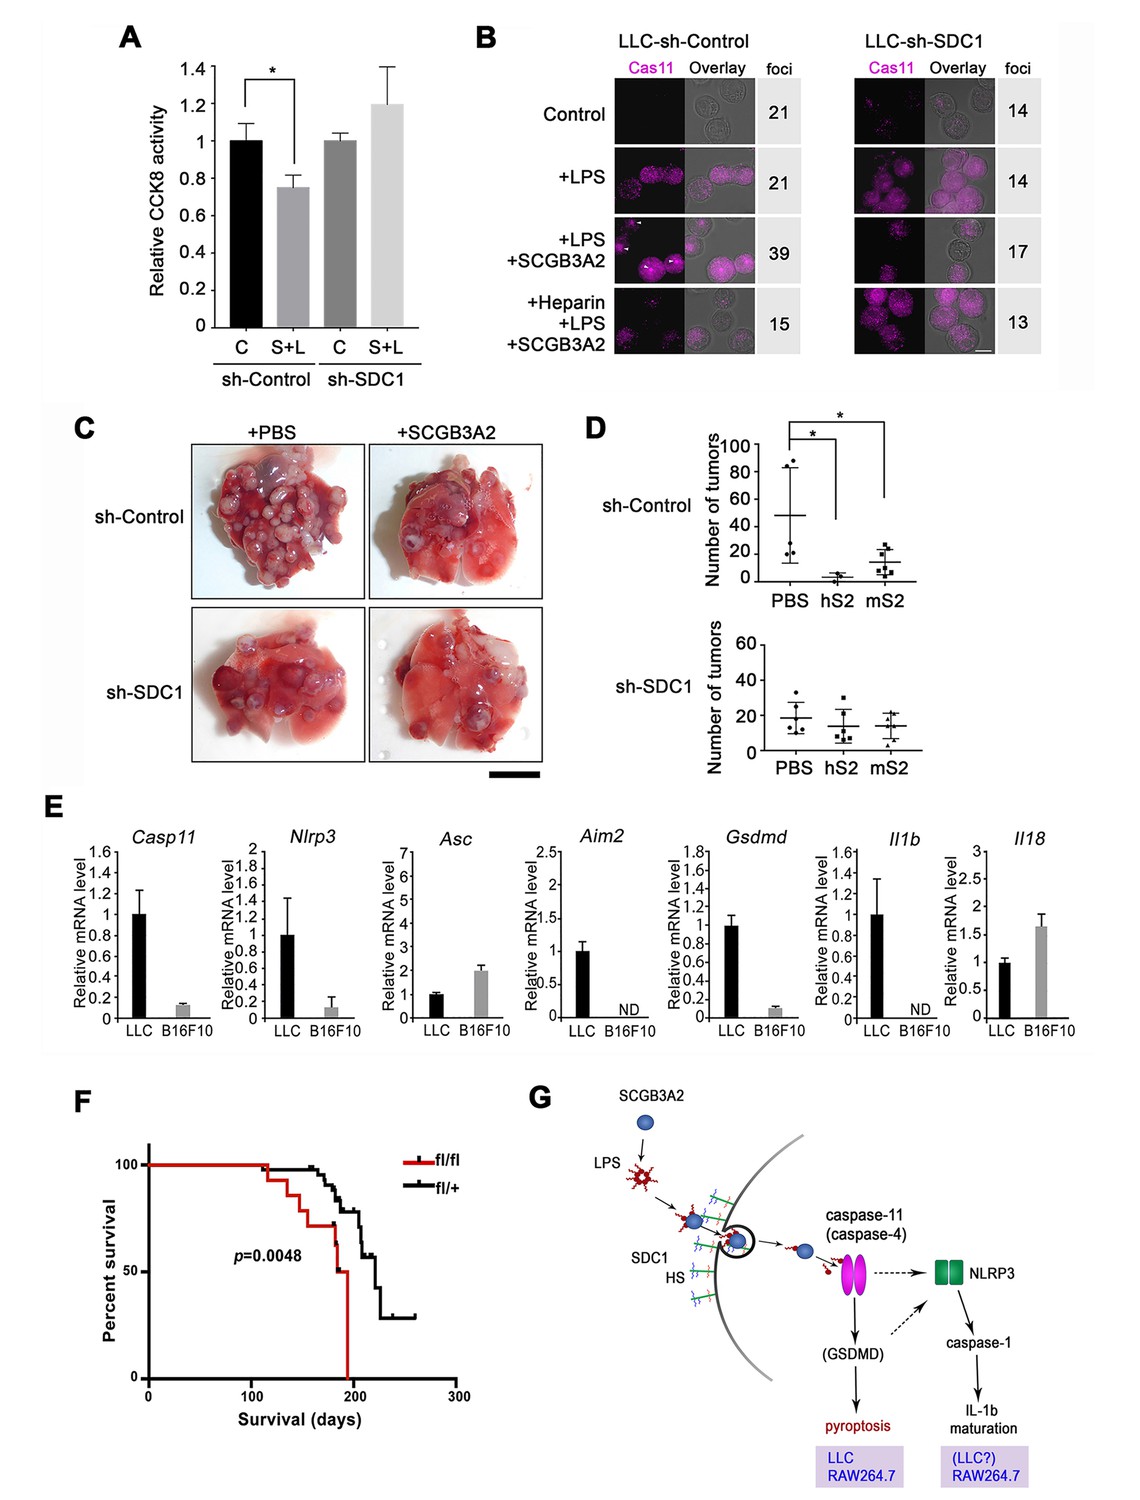
Evaluation for the requirement of SDC1 and other genes for SCGB3A2-LPS effect.
(A) CCK8 assay using LLC-sh-Control and LLC-sh-SDC1 for 72 hr in 1% FBS-RPMI 1640 medium. C; control, S; human SCGB3A2 (200 ng/ml), L; LPS (O111:B4, 1 pg/ml). Averages ± SD from more than three independent experiments, each in triplicate are shown. *: p<0.05 by one-way ANOVA. (B) Immunofluorescent staining of caspase-11 and LPSA594 using LLC-sh-Control and LLC-sh-SDC1 cells. Cells were maintained in 1% FBS-RPMI 1640 medium for 16 hr with or without human SCGB3A2 (1 µg/ml), LPS (1 µg/ml), and/or heparin (1 µg/ml). Arrowheads: caspase-11 foci. Bar = 10 µm. Numbers on the right indicate cells containing caspase-11 foci per a total 100 cells counted for each cell type. Data are the representatives of three independent experiments. (C) Intravenous metastasis model using LLC-sh-Control or LLC-sh-SDC1 cells. Representative lungs from the control (PBS) and SCGB3A2 groups that received treatment in the 1 st week. N = 3–6 per group. Bar = 1 cm. (D) Summary of C for the numbers of pulmonary surface tumors in lungs of animals receiving treatment as indicated. hS2; human SCGB3A2, mS2; mouse SCGB3A2. A dot indicates a mouse. *p<0.05 by One-way ANOVA. (E) qPCR quantification of the relative mRNA expression levels for inflammasome related genes in LLC and B16F10 cells. Cells grown in 10%FBS-RPMI 1640 medium were harvested at 24 hr. Averages ± SD from more than three independent experiments, each in triplicate. ND; not detectable. (F) KrasG12D-induced lung carcinogenesis survival curve for KrasG12D;Scgb3a2(fl/fl) (red line; fl/fl, n = 14) and littermate KrasG12D;Scgb3a2(fl/+) (black line; fl/+, n = 44) mice. (G) Schematic model for LPS entry into cells by SCGB3A2 through SDC1 receptor, leading to pyroptotic cell death.
Tables
Key resources table
| Reagent type (species) Or resource | Designation | Source or reference | Identifiers | Additional information |
|---|---|---|---|---|
| Strain, strain background (M. musculus) | Scgb3a2-/- (C57BL/6N background) | In house | Kido et al., 2014 | |
| Strain, strain background (M. musculus) | Scgb3a2fl/fl (C57BL/6N background) | In house | Kido et al., 2014 | |
| Strain, strain background (M. musculus) | Ccsp-Cre;LSL-K-rasG12D (mixed background) | Francesco DeMayo (Baylor College of Medicine, now NIEHS) | Moghaddam et al., 2009 | |
| Cell line (M. musculus) | LLC-Mhi | Glenn Merlino (NCI) | Highly metastatic, MAP test negative | |
| Cell line (M. musculus) | B16F10 | ATCC | CRL-6475 | |
| Cell line (M. musculus) | RAW264.7 | Raymond Donnelly (FDA) | MAP test negative, authenticated by STR | |
| Cell line (human) | ARH-77 ARH-77-mSDC1 | Ralph Sanderson (The University of Alabama at Birmingham) | MAP test negative, authenticated by STR | |
| Recombinant protein | mouse SCGB3A2 | NCI Protein Expression Core | Kurotani et al., 2008 | |
| Recombinant protein | mouse SCGB3A2 | Hölzel Diagnostics | CSB-BP846028MO | |
| Recombinant protein | mouse SCGB3A2 | CosmoBio USA | CSB-EP846028MO | |
| Recombinant protein | human SCGB3A2 | In house (APCBio Innovations) | Cai et al., 2014 | |
| Antibody | anti-mouse SCGB3A2 (rabbit polyclonal) | E. Coli expressed mature SCGB3A2 in vector pET-32a(+) used as an antigen to produce a polyclonal antibody (produced by Macromolecular Resources, Fort Collins, CO) | Niimi et al., 2001 | 1:5000 for IHC |
| Antibody | anti-human SCGB3A2 (polyclonal) | In house (APCBIo Innovations) | Cai et al., 2014 | 1:1000 for WB |
| Antibody | anti-mouse/human SDC1 | Pynog W Park (Harvard Med Sch) | 1:200 for IHC/IF 1:1000 for WB | |
| Antibody | PE-rat anti-mouse SDC1 | BD Pharmingnen | clone 281.2 | 1:200 for FACS |
| Antibody | anti-clathrin heavy chain | Cell Signaling Technology | P1663 | 1:200 for IF |
| Antibody | anti-EEA1 (monoclonal) | Cell Signaling Technology | C45B10 | 1:200 for IF |
| Antibody | anti-IL-1β (monoclonal) | Cell Signaling Technology | Clone 3A6 | 1:1000 for WB |
| Antibody | anti-caspace-11 (monoclonal) | Thermo Fisher Scientific | Clone 17D9 | 1:1000 for WB 1:100 for IHC/IF |
| Antibody | anti-ICAM1 (monoclonal) | Thermo Fisher Scientific | MA5407 | 1:200 for IF |
| Antibody | anti-caspace-1 (monoclonal) | Thermo Fisher Scientific | Clone 5B10 | 1:1000 for WB 1:100 for IF |
| Antibody | anti-NLRP3 (monoclonal) | Adipogen | AG-20B-0014 | 1:1000 for WB 1:200 for IHC/IF |
| Antibody | anti-LAMP1 (monoclonal) | Santa Cruz | sc-17768 | 1:200 for IF |
| Antibody | anti-HaloTag (polyclonal) | Promega | G9281 | 1:100 for IF 1:1000 for WB |
| Antibody | anti-GAPDH (monoclonal) | Proteintech | 60004–1-Ig | 1:5000 for WB |
| Antibody | anti-LPS (monoclonal) | Abcam | ab35654 | 1:1000 for WB |
| Chemical compound, drug | LPS from E. coli O111:B4 | Sigma-Aldrich | L4391 | |
| Chemical compound, drug | Ra mutant LPS from E.coli EH-100 | Sigma-Aldrich | L9641 | |
| Chemical compound, drug | LPS from E.coli K-235 | Sigma-Aldrich | L2018 | |
| Chemical compound, drug | LPS from Salmonella typhimurium | Sigma-Aldrich | L2262 | |
| Chemical compound, drug | heparin sodium salt from porcine intestinal mucosa | Sigma-Aldrich | H3393 | |
| Chemical compound, drug | imidazole | Sigma-Aldrich | I5513 | |
| Chemical compound, drug | zinc sulfate solution | Sigma-Aldrich | Z2876 | |
| Chemical compound, drug | Dynasore | AdooQ Bioscien | A12726 | |
| Chemical compound, drug | Wedelolactone | AdooQ Bioscien | A14804 | |
| Chemical compound, drug | LPS-EB Biotin | InvivoGen | tlrl-3blps |
Additional files
-
Supplementary file 1
LPS contents in various preparations/batches of recombinant SCGB3A2
- https://doi.org/10.7554/eLife.37854.017
-
Supplementary file 2
116 proteins identified as those significantly bound to human SCGB3A2 in protein array.
Proteins with Z-Factor >0.9, Z-Score >4.0 are listed. High score indicates a strong protein-protein interaction.
- https://doi.org/10.7554/eLife.37854.018
-
Supplementary file 3
SCGB3A2 candidate receptors identified by human protein interaction array
- https://doi.org/10.7554/eLife.37854.019
-
Transparent reporting form
- https://doi.org/10.7554/eLife.37854.020
Download links
A two-part list of links to download the article, or parts of the article, in various formats.
Downloads (link to download the article as PDF)
Open citations (links to open the citations from this article in various online reference manager services)
Cite this article (links to download the citations from this article in formats compatible with various reference manager tools)
A novel pathway of LPS uptake through syndecan-1 leading to pyroptotic cell death
eLife 7:e37854.
https://doi.org/10.7554/eLife.37854


