Acute perturbation of Pet1-neuron activity in neonatal mice impairs cardiorespiratory homeostatic recovery
- Harvard Medical School, United States
- The Geisel School of Medicine at Dartmouth, United States
Figures
Figure 1 with 1 supplement
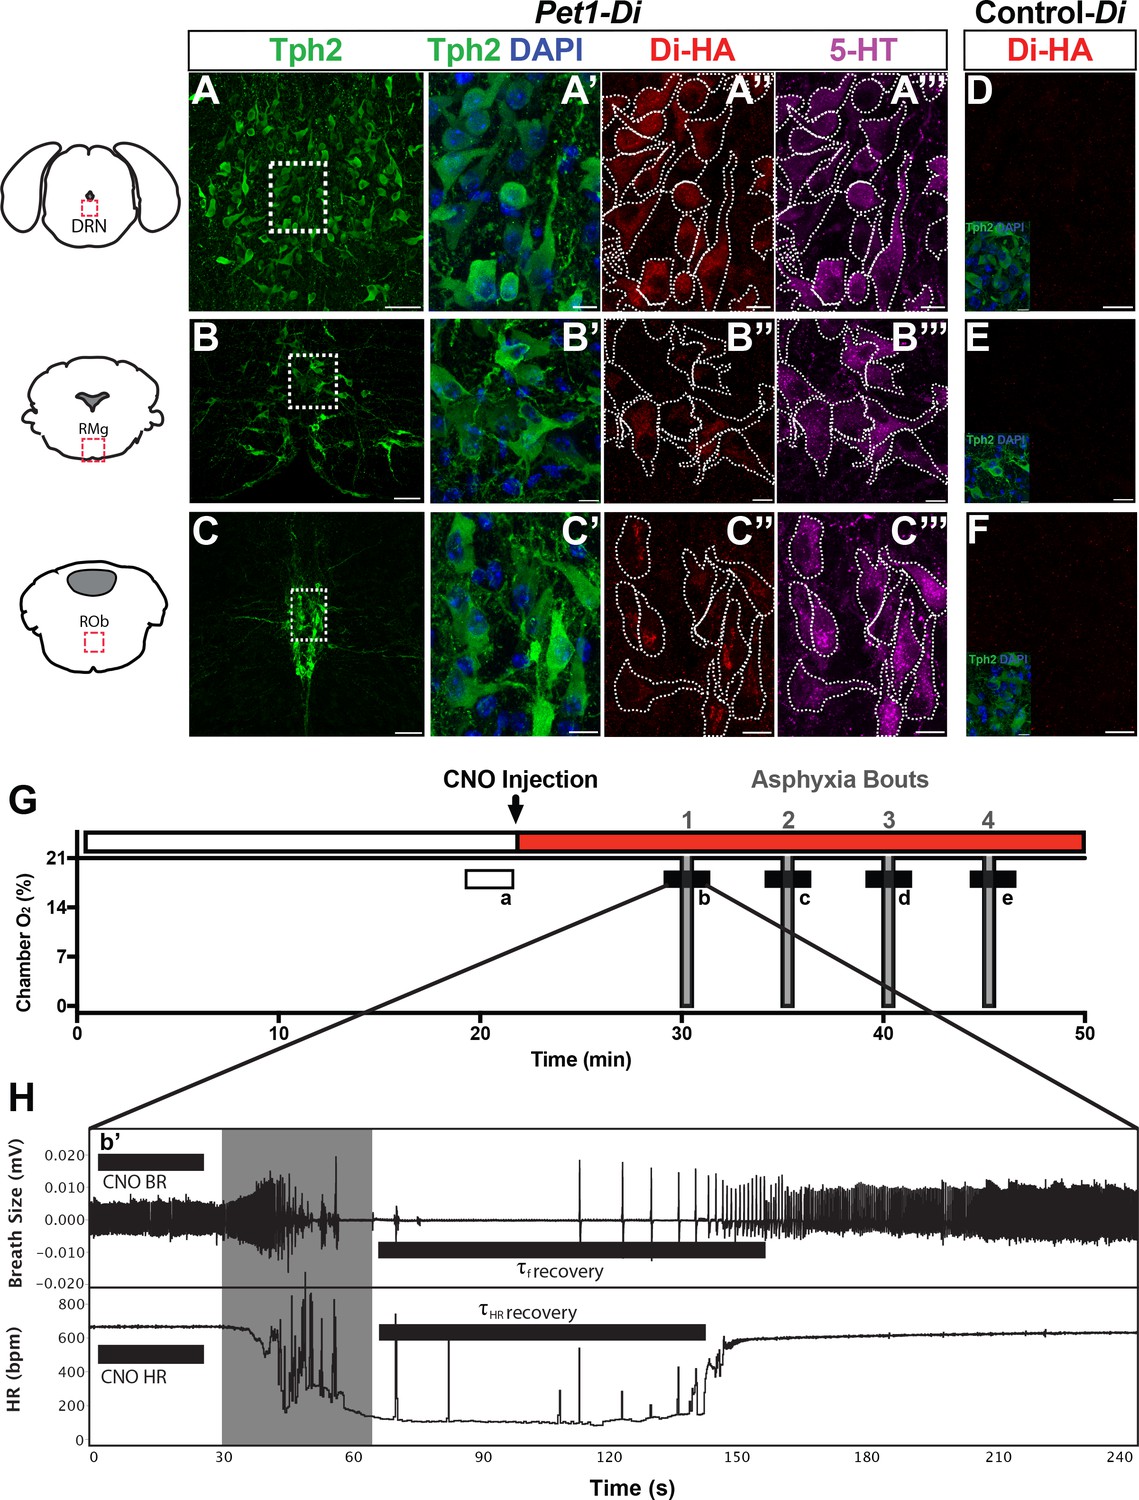
Genetic mouse model and postneonatal autoresuscitation assay.
(A–C”’) HA-tagged Di receptor expression targeted to Pet1-raphe serotonergic neurons in double-transgenic Pet1-Flpe; RC-FDi (referred to as Pet1-Di) pups at P8, as shown previously in adult mice (Brust et al., 2014). (A–C) Low magnification view of 20 µm coronal section showing neurons immunopositive for tryptophan hydroxylase 2 (Tph2), identifying serotonergic neurons in the dorsal raphe nucleus (DRN) (A), the raphe magnus nucleus (RMg) (B), and the raphe obscurus (ROb) (C). Fields demarcated by dashed rectangles in A–C are shown at higher magnification in A’–C’”, with Tph2 immunoreactivity again in green (A’–C’), HA-Di immunopositivity in red (A”–C”), serotonin (5-HT) immunopositivity in magenta (A”’–C”’), and dashed cell outlines as grossly determined by the Tph2 immunodetection signal. The raphe location, proportion, and intensity of HA-Di immunodetection signal was qualitatively similar across Pet1-Di pups from independent litters (Figure 1—figure supplement 1). (D–F) Representative fields from negative-control single transgenics harboring the unrecombined RC-FDi allele (referred to as Control-Di), showing no detectable HA-Di, in line with prior validation that Di-expression from RC-FDi requires Flpe-recombination. Insets show Tph2 immunodetection of serotonergic neurons in these fields. Scale bars in A–C equal 50 µm, and in A’–C”” and D-F, 10 µm. (G–H) Schematic of repeated asphyxia-induced apnea and autoresuscitation recovery, during which breath size and heart rate are continuously monitored. (G) Plethysmograph chamber oxygen (O2) percent across assay time, starting with ~20 min of pup acclimation to chamber air (21% O2) including extraction of baseline cardiorespiratory values during the temporal window indicated by the open rectangle a. I.P. injection of CNO immediately follows; red rectangle indicates CNO exposure window. Asphyxia-apnea bouts are indicated by the four periods (b–e) of ~0% O2 (97% N2, 3% CO2) shown in gray. (H) Temporally expanded view of an asphyxia-apnea bout including example tracing of breath size (and calculated breathing rate, BR) and heart rate (HR) over time. Primes (b’ and similarly for c-e) indicate the bout-specific baseline post CNO injection immediately preceding asphyxia. The gray window indicates the period of asphyxia that induced the apnea, which is followed by immediate return to 21% O2 during which autoresuscitation recovery ensues. Black bars after asphyxia indicate τf or τHR (τ defined as 63% of the baseline value before that specific asphyxic bout). Light gray box indicates period of asphyxia (97% N 3% CO2) used to induce the apnea.
Figure 1—figure supplement 1
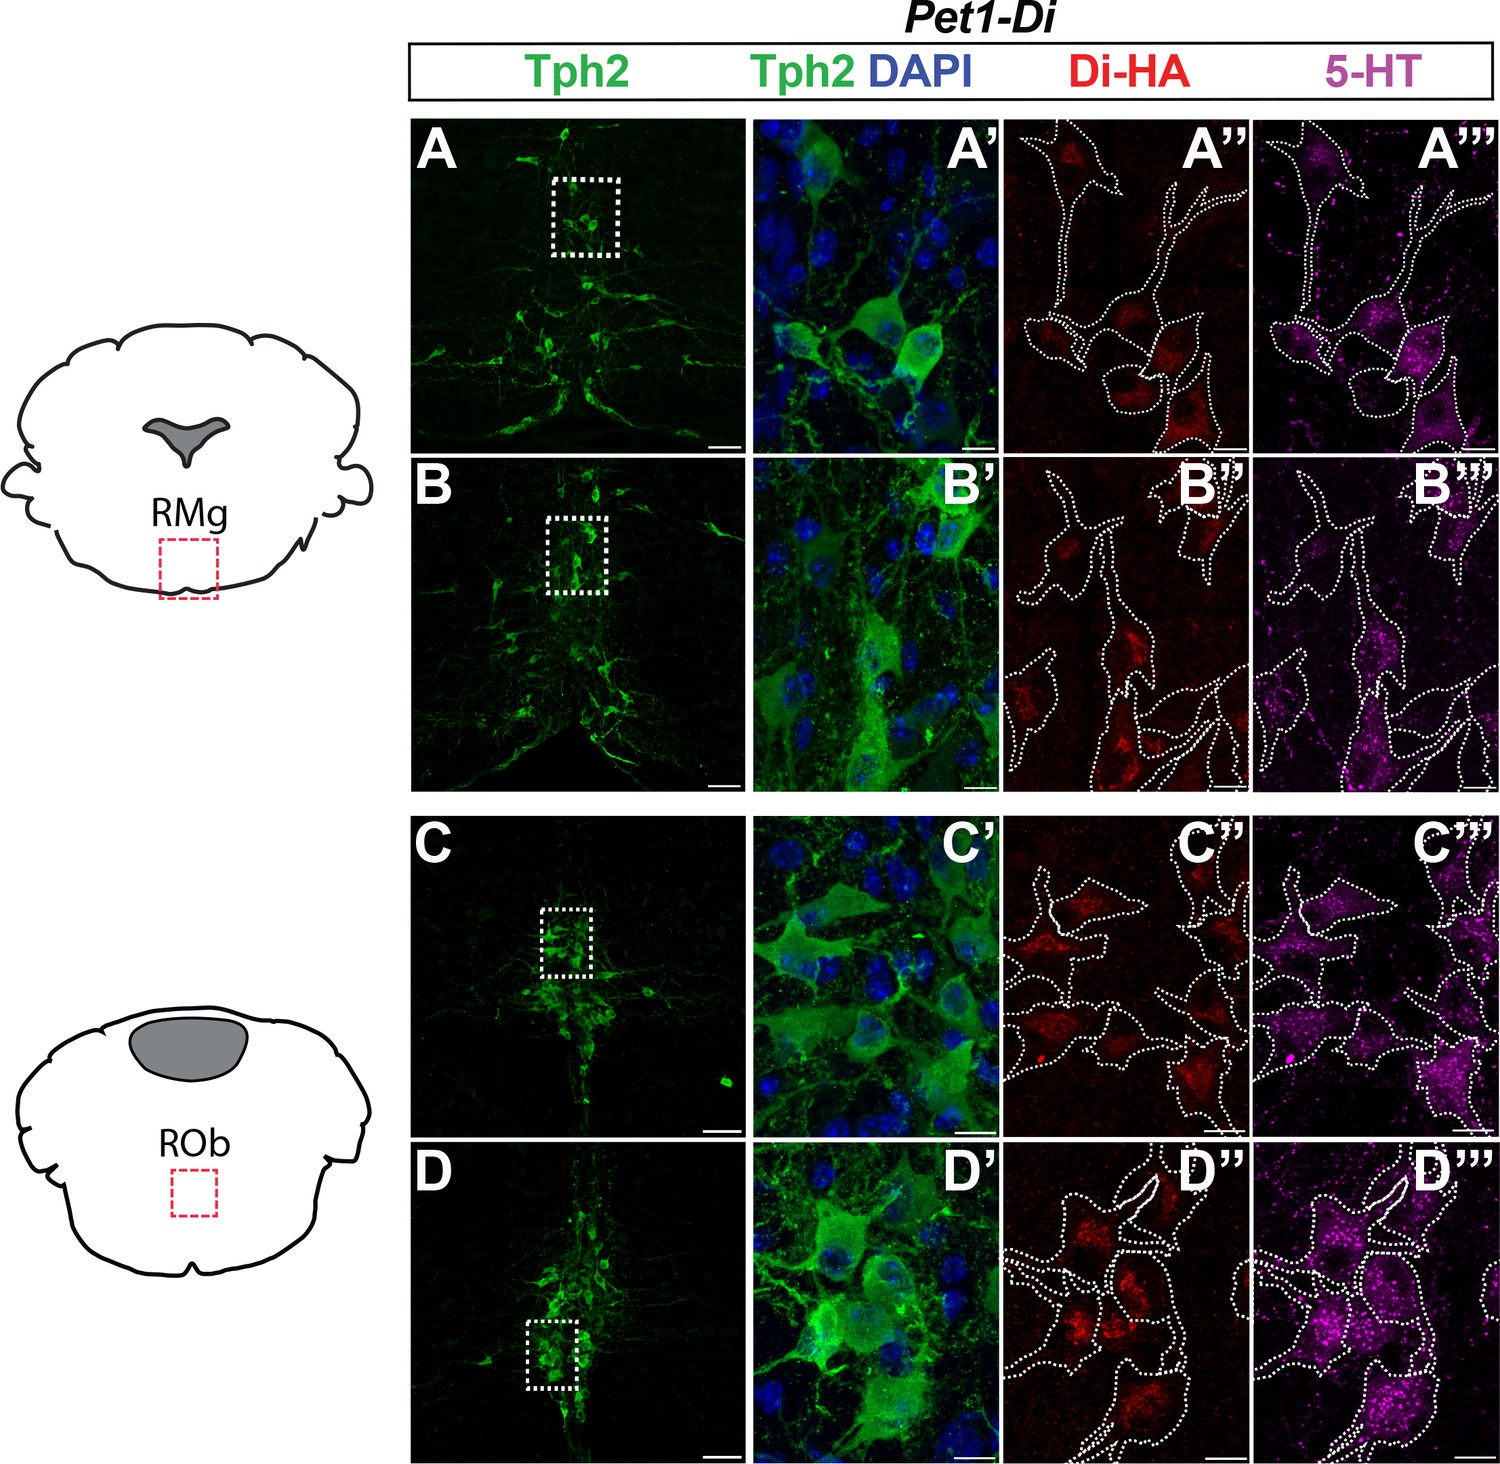
Additional examples of HA-Di expression in medullary brain tissue of Pet1-Di pups from independent litters.
(A–D”’) HA-tagged Di receptor expression targeted to Pet1-raphe serotonergic neurons in double-transgenic Pet1-Flpe; RC-FDi (referred to as Pet1-Di) pups at P8, as shown in Figure 1. A-A’’ and C-C’’’ are from the same pup, which is distinct from the pup (and litter) source for the tissue in B-B’’’ and D–D’”, and from that in Figure 1. (A–D) Low magnification view of 20 µm coronal section showing neurons immunopositive for tryptophan hydroxylase 2 (Tph2), identifying serotonergic neurons in the raphe magnus nucleus (RMg) (A–B) and the raphe obscurus (ROb) (C–D). Dashed rectangles in A–D are shown at higher magnification in A’-D’”, with Tph2 immunoreactivity in green (A’–D’), HA-Di immunopositivity in red (A”–D”), serotonin (5-HT) immunopositivity in magenta (A”’–D”’), and dashed cell outlines (white) as determined by the Tph2 signal. Scale bars: A–D, 50 µm; A’–D’’’, 10 µm.
Figure 2 with 3 supplements

Acute perturbation of Pet1 neurons alters baseline cardiorespiratory values.
(A–B’) A and B represent minute ventilation (, ml min−1 •kg−1) and heart rate (HR, beats per minute, bpm), respectively, in sibling controls harboring the unrecombined RC-FDi allele (non-Di-expressors referred to as Control-Di) before and during CNO exposure. No detectable change was observed in or HR before and during CNO exposure. (A’ and B’) show and HR, respectively, before and during CNO-induced disruption of Pet1-neurons in double transgenic Pet1-Flpe, RC-FDi (Di-expressors, referred to as Pet1-Di) pups. Coefficient-of-variation calculations for breathing f and HR during CNO exposure versus baseline prior to CNO injection are presented in Figure 2—figure supplement 1. (C–C’) Linear regression of pre-CNO plotted against change in for control-Di pups (C) (correlation p=0.47 and R2 = 0.04) and Pet1-Di pups (C’) (correlation p<0.0001 and R2 = 0.76). (D–D’) Linear regression of pre-CNO HR plotted against change in HR for control-Di pups (D) (correlation p=0.52 and R2 = 0.03) and Pet1-Di pups (D’) (correlation p=0.45 and R2 = 0.03). Abbreviation (ventilation prior to CNO injection), (ventilation during CNO exposure), HRPre (heart rate prior to CNO injection), HRCNO (heart rate during CNO exposure), bpm (beats per minute), mL (milliliters), min (minutes), kg (kilograms). ‘Dies’ refers to pups that go on to die in future bouts – red lines (A–B’) and red circles (C–D’), ‘survives’ refers to pups that survive the full set of asphyxic-apnea challenges – gray lines (A–B’) and black circles (C–D’). Linear regression of pre-CNO plotted against change in HR, and change in plotted against change in HR are presented in Figure 2—figure supplement 2. Ventilatory equivalents for oxygen () and oxygen consumption data pre- versus during CNO exposure are plotted in Figure 2—figure supplement 3.
Figure 2—figure supplement 1
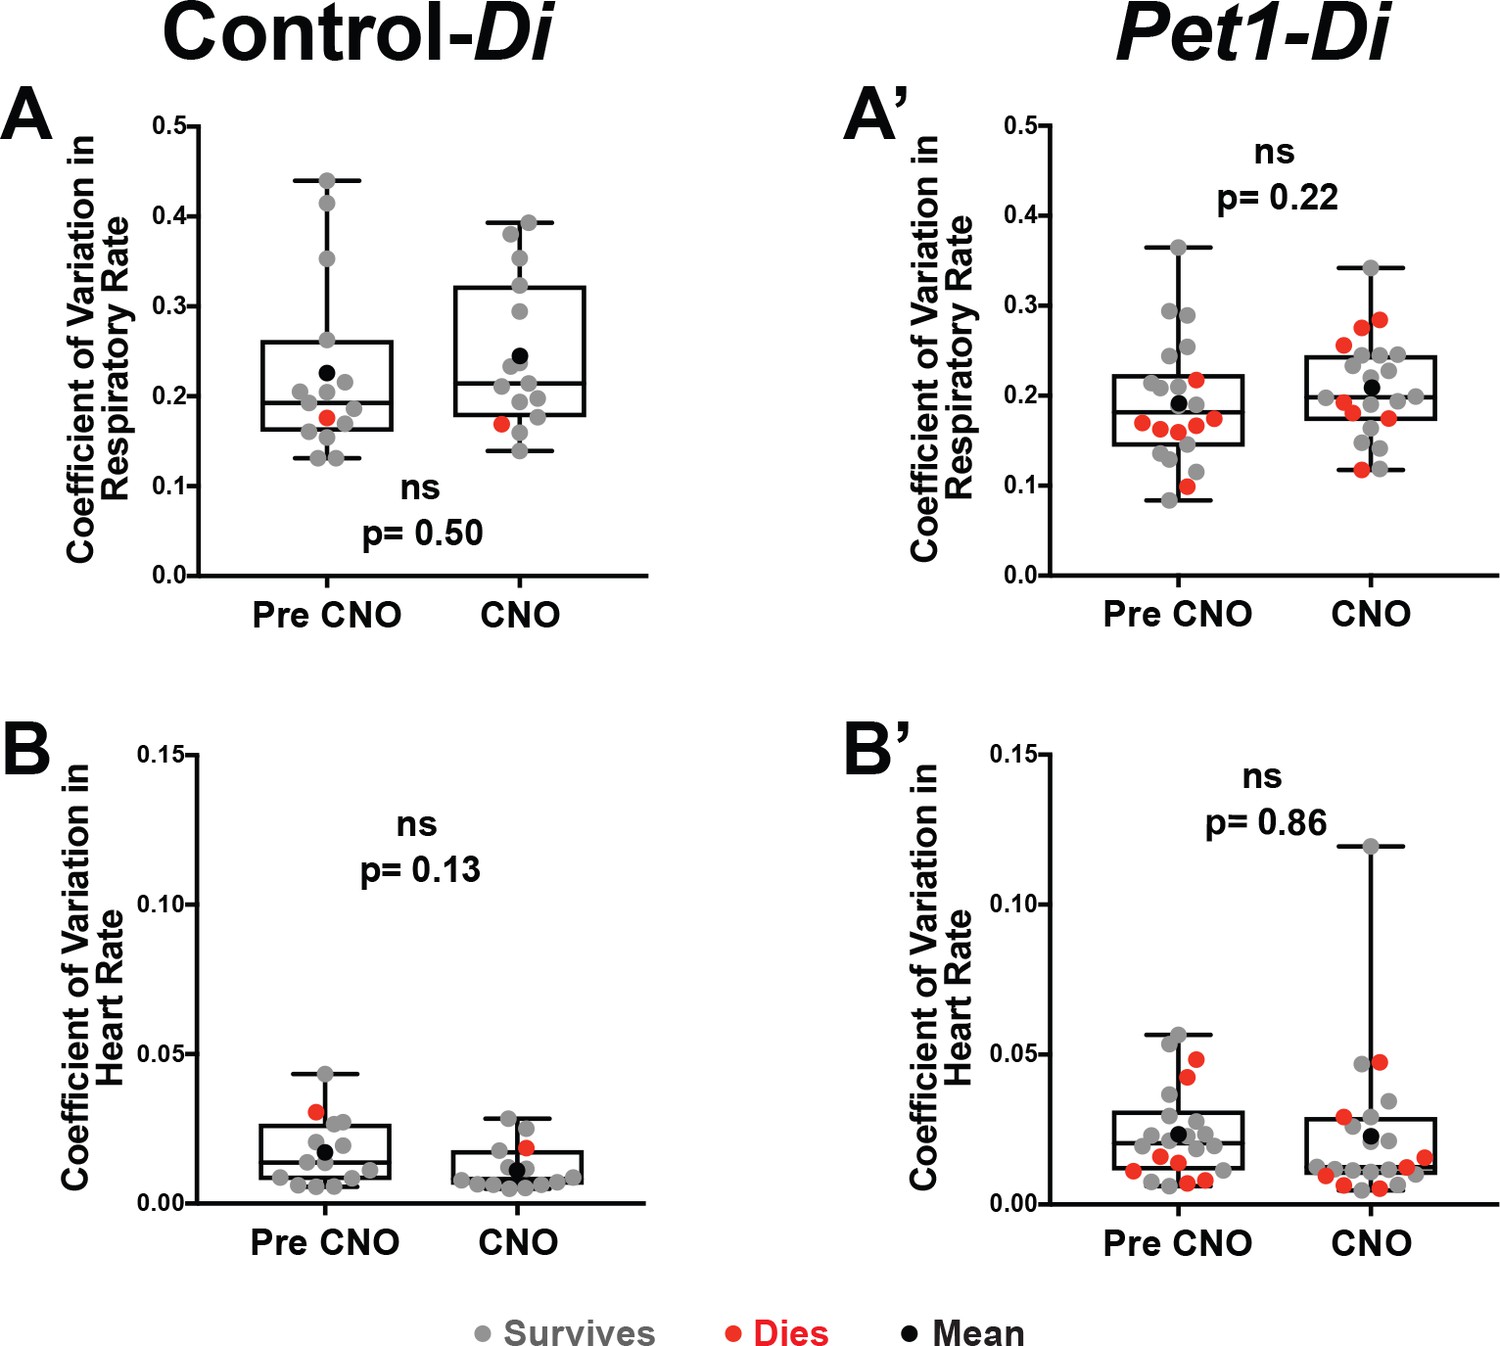
Variation in heart rate and respiratory rate.
(A–A’) Plotted coefficient of variation for respiratory rate determined across the 30 s stable trace analyzed in Figure 2 (and described in the Methods section) for pre- versus CNO exposure (measurement window a versus b’ illustrated in Figure 1G and H) for control-Di pups (A) and Pet1-Di pups (A’). (B–B’) Plotted coefficient of variation for heart rate across the 30 s stable trace analyzed in Figure 2 for pre- versus CNO exposure for control-Di pups (B) and Pet1-Di pups (B’). Gray dots represent pups that survived all four asphyxia-induced apnea bouts. Red dots represent pups that go on to die. Black dot represents the mean of all pups in that cohort.
Figure 2—figure supplement 2
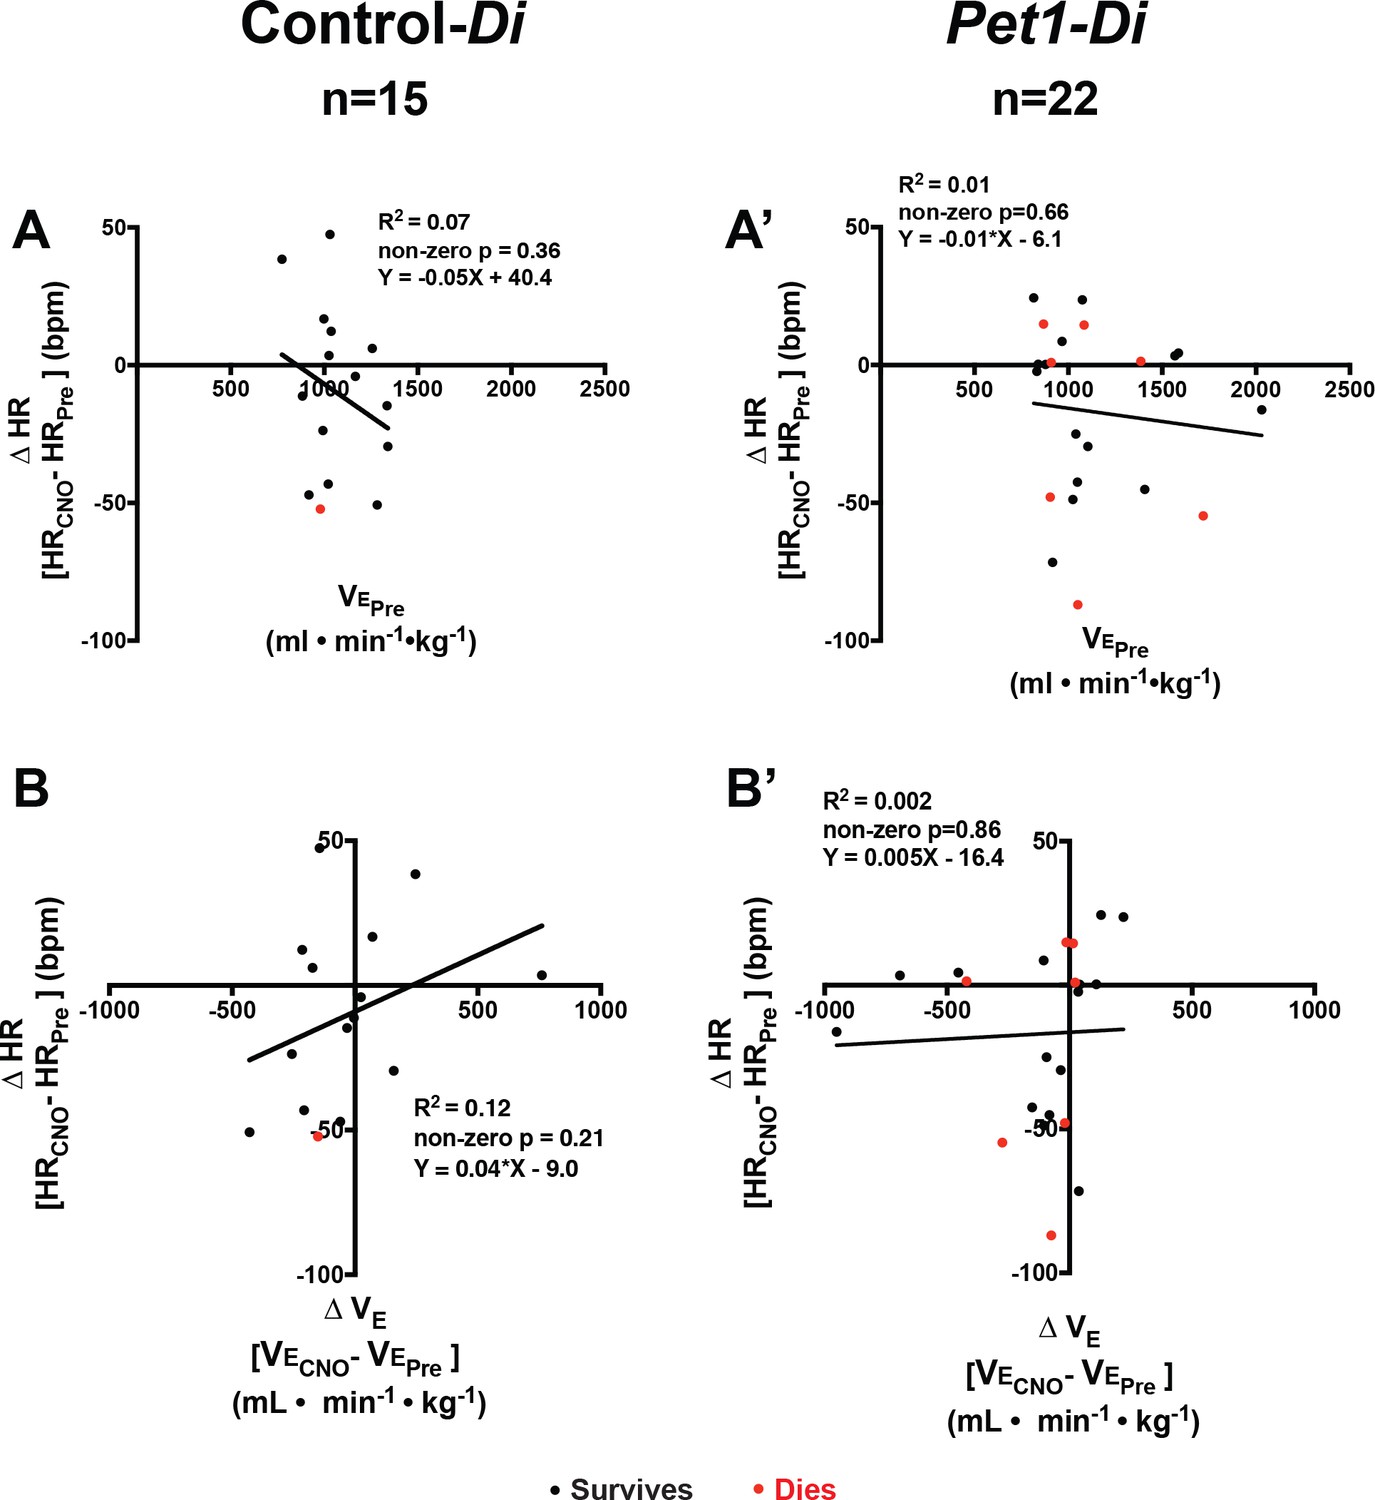
Changes in baseline heart rate in relation to ventilation.
(A–A’) Linear regression of pre-CNO minute ventilation (•min−1•kg−1) plotted against change in heart rate (HR, bpm) for control-Di pups (A) and Pet1-Di pups (A’). (B–B’) Linear regression of Δ (during versus before CNO exposure) plotted against change in heart rate (ΔHR, bpm) for control-Di pups (B) and Pet1-Di pups (B’). Abbreviations: (ventilation prior to CNO), (ventilation during CNO exposure), HRPre (heart rate prior to CNO), HRCNO (heart rate during CNO exposure), bpm (beats per minute), mL (milliliters), min (minutes), kg (kilograms). Red dots represent pups that go on to die in future bouts; black dots represent pups that survive.
Figure 2—figure supplement 3
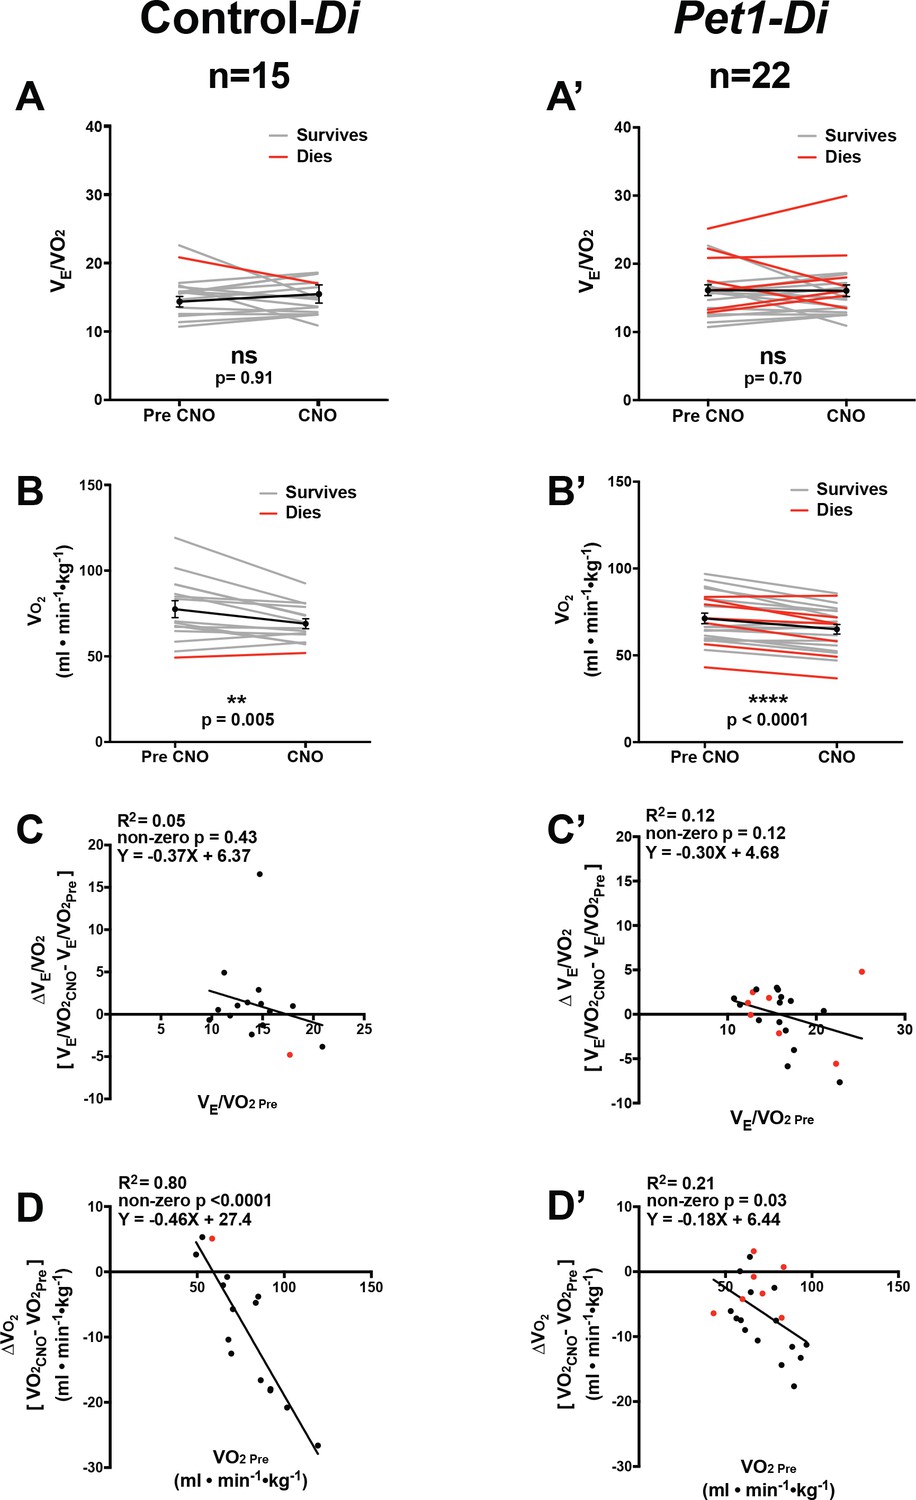
Analyses of ventilatory equivalents for oxygen and oxygen consumption before and during CNO exposure.
(A–B’) A and B represent ventilatory equivalents for oxygen () and maximal oxygen consumption (, ml • min−1 • g−1), respectively, in sibling controls harboring the unrecombined RC-FDi allele (non-Di-expressors referred to as Control-Di) before and during CNO exposure; A’ and B’ represent such measurements for double transgenic Pet1-Flpe, RC-FDi pups (Di-expressors, referred to as Pet1-Di). before versus during CNO exposure showed no statistically significant differences for either Control-Di (A) or Pet1-Di (A’) pups. values generally decreased following CNO and return to the pleythysmograph chamber for both genotypes (B, B’). (C–C’) Linear regression of pre-CNO (x-axis) plotted against change in for control-Di pups (C) (correlation p=0.43 and R2 = 0.05) and Pet1-Di pups (C’) (correlation p=0.12 and R2 = 0.12). (D–D’) Linear regression of pre-CNO plotted against change in for control-Di pups (D) (correlation p<0.0001 and R2 = 0.80) and Pet1-Di pups (D’) (correlation p=0.030 and R2 = 0.21). Abbreviation (ventilatory equivalents for oxygen prior to CNO injection), (ventilatory equivalents for oxygen during CNO exposure), (maximal oxygen consumption prior to CNO injection), (maximal oxygen consumption during CNO exposure). ‘Dies’ refers to pups that go on to die in future bouts – red lines (A–B’) and red circles (C–D’), ‘survives’ refers to pups that survive the full set of asphyxic-apnea challenges – gray lines (A–B’) and black circles (C–D’).
Figure 3
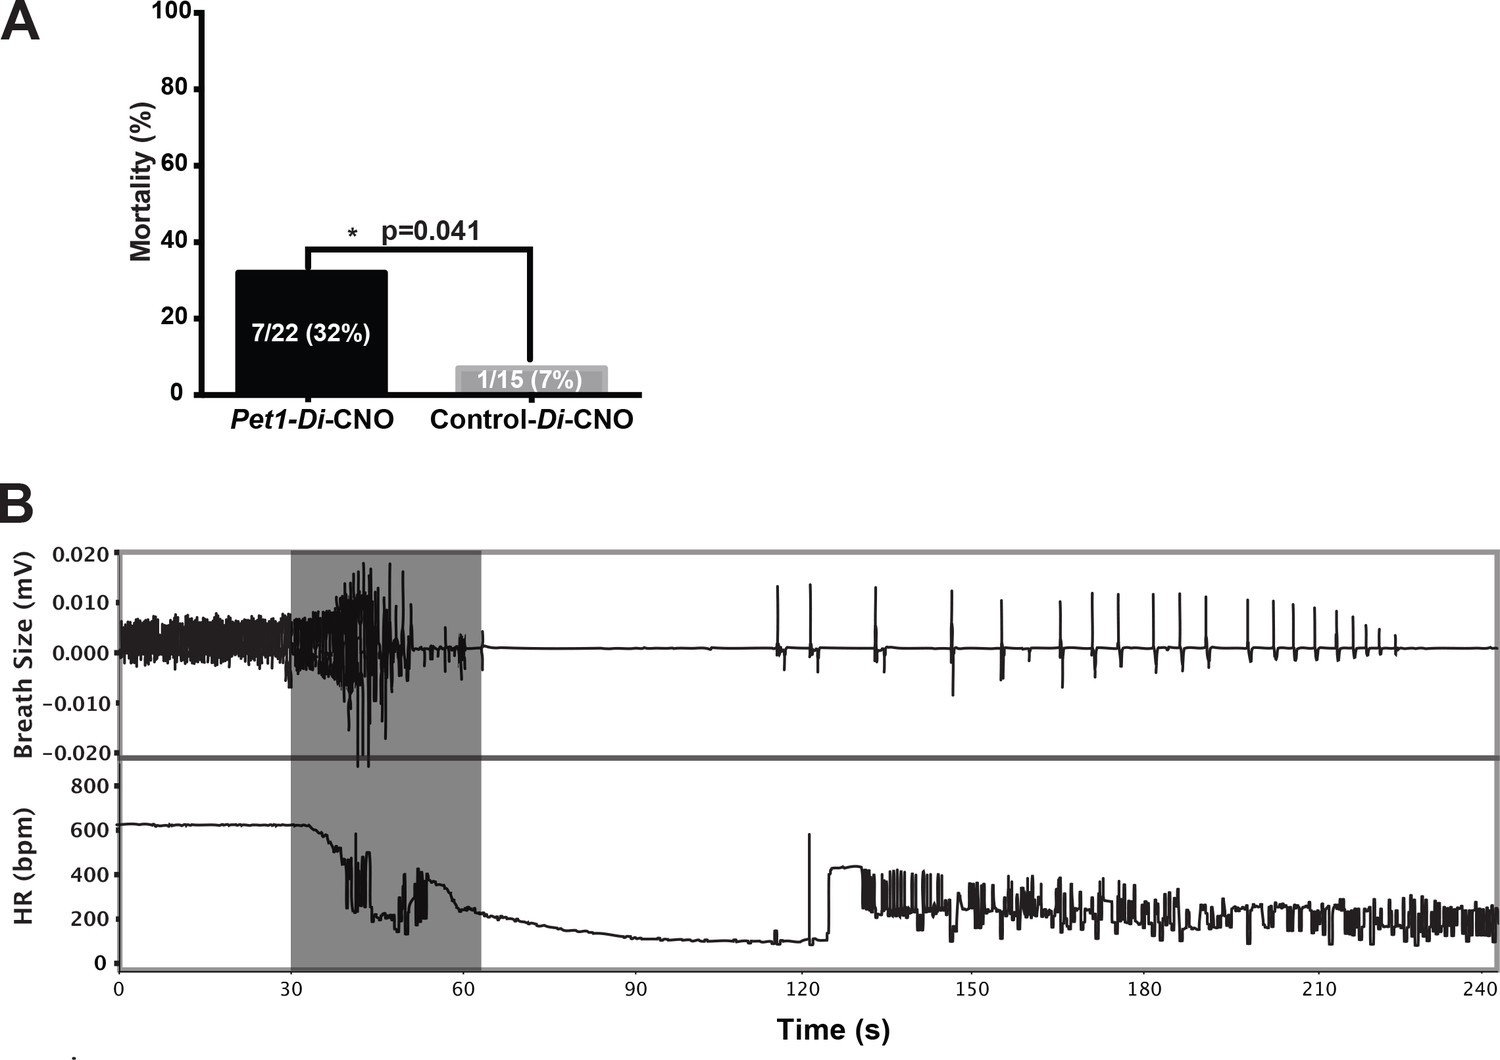
Acutely disrupting Pet1-neuron activity impairs pup ability to recover from multiple apneas.
(A) Percent mortality after repeated asphyxia-induced apneas plotted as a function of genotype (one-sided Fisher’s Exact Test with Lancaster’s Mid P correction p=0.041). (B) Example breathing and heart rate response trace from a Pet1-Di-CNO pup that failed to recover. Gray box indicates the window of asphyxic conditions (97% N 3% CO2). n = 15 for control-Di-CNO pups, n = 22 for Pet1-Di-CNO pups.
Figure 4
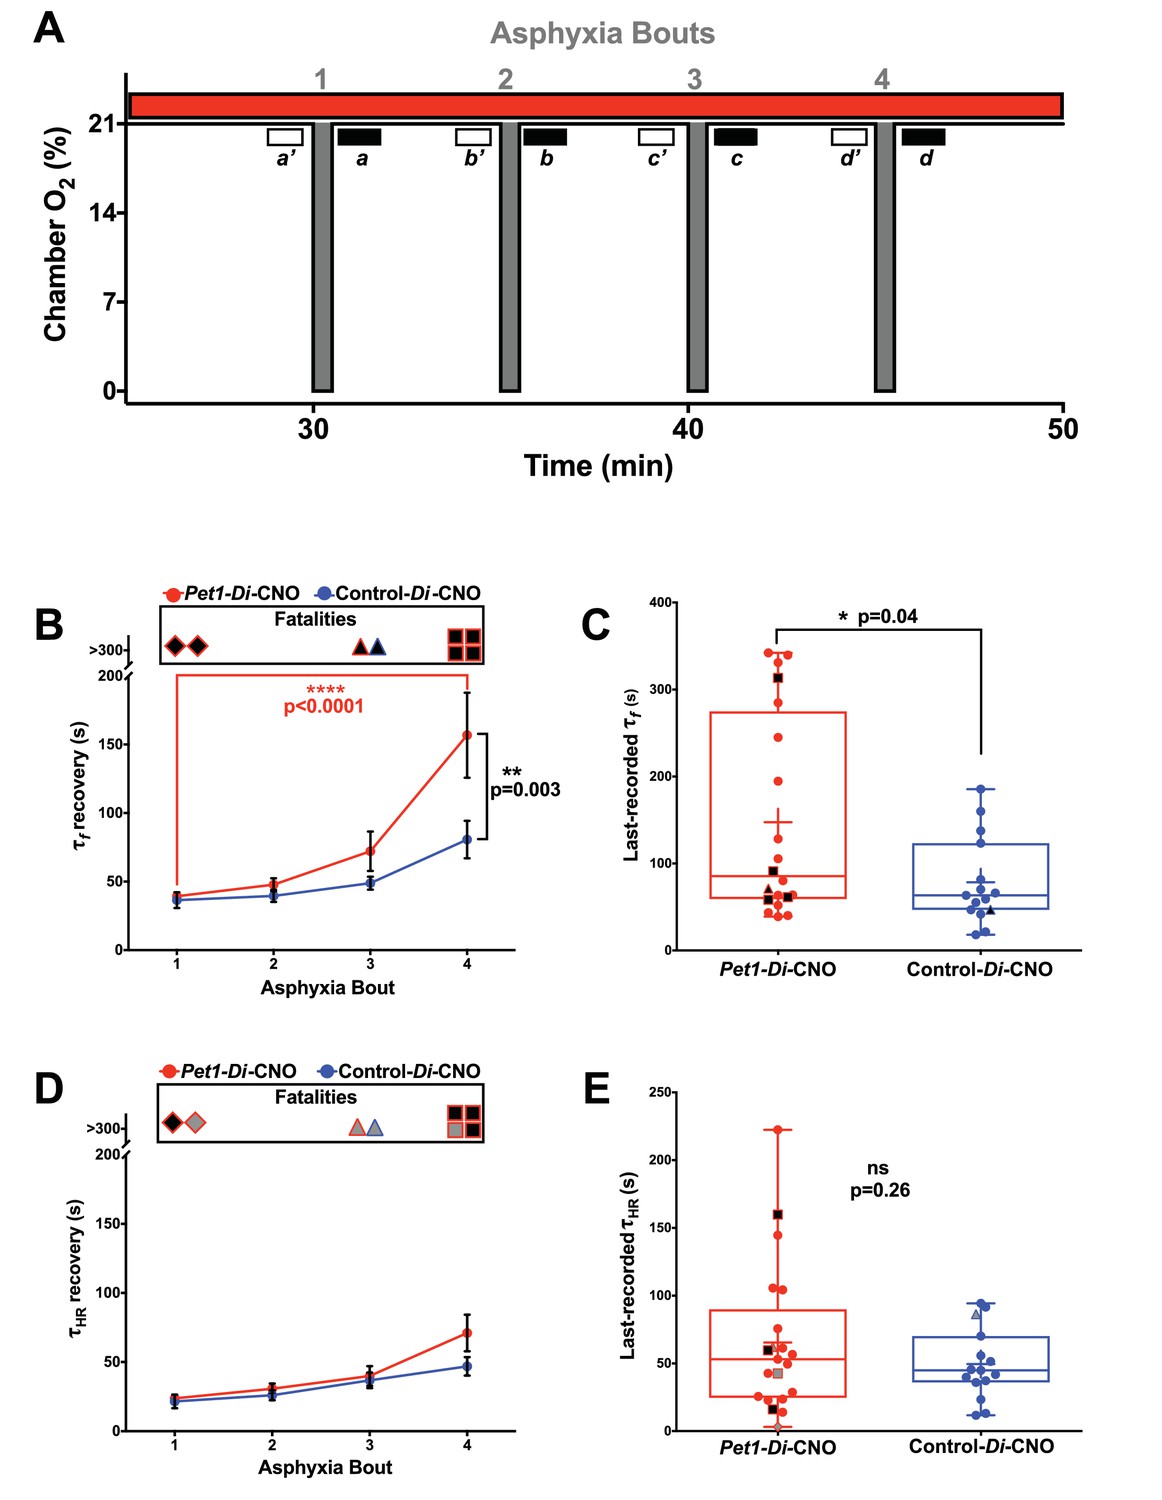
Acutely disrupting Pet1-neuron activity primarily affects respiratory components during apnea recovery
(A) Compressed schematic of autoresuscitation assay timeline indicating asphyxia-apnea bouts and data extraction windows; open windows a’-d’ reflect bout-specific baseline measurements, filled windows a-d reflect temporally when recovery to 63% of baseline values was determined (τf and τHR). (B and D) τf (B) or τHR (D) across bouts, with open ‘Fatalities’ rectangle above each graph denoting animals that died during the assay; the contained shapes represent the fatal apnea bout – diamond (bout 1), triangle (bout 3), square (bout 4) – while black fill reflects mortality during that recovery response. Pet1-Di-CNO pups indicated in red (n = 22), control-Di-CNO pups (sibling non-Di-expressors), in blue (n = 15). (C and E) τf (C) or τHR (E) during the last-recovered bout (final bout during which a pup was able to achieve 63% of baseline characteristic). Black-fill continues to reflect mortality, shape reflects bout that was fatal. Gray-filled shapes reflect animals that recovered HR to 63% of baseline although went on to die during that apnea bout despite meeting τHR criteria. Plotted circles reflect pups that survived all bouts; +indicates the mean; box-whisker plot shows median as the horizontal line, 1st and 3rd quartiles as the ‘box,’ and maximum and minimum values as the ‘whiskers.’.
Figure 5 with 1 supplement
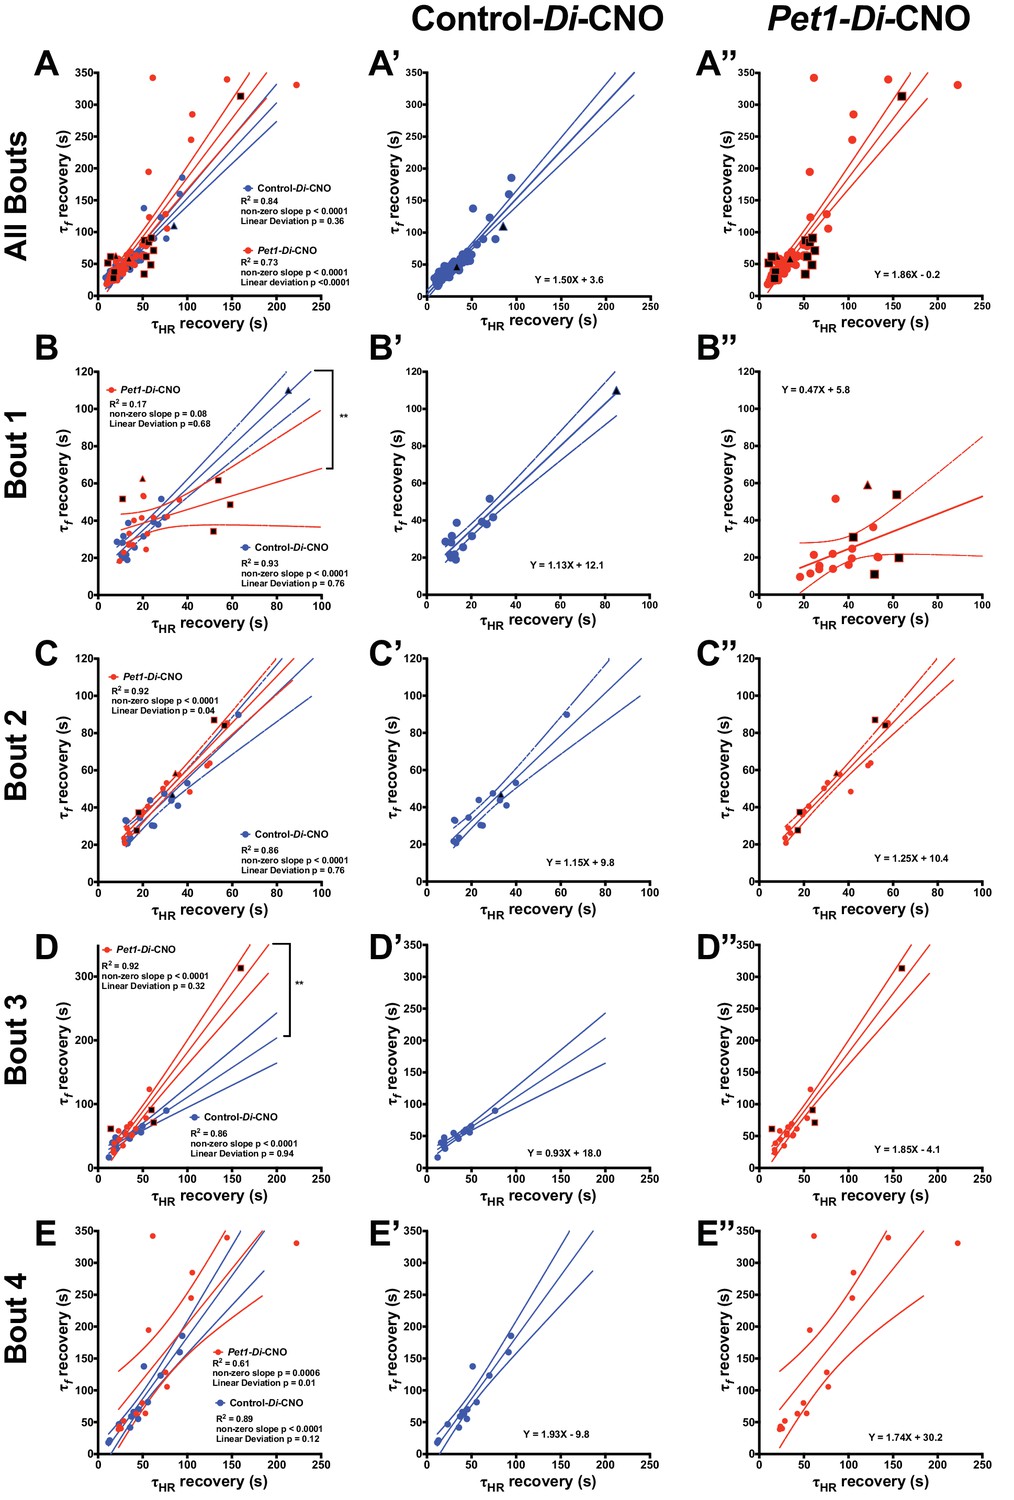
Pet1-Di-CNO pups show a decoupling of heart rate and breathing rate recovery times.
(A–A”) Scatter plot of recovery τf (seconds, s) versus τHR (s) that includes all possible apnea recoveries of both groups, with data points from Pet1-Di-CNO pups in red, and control-Di-CNO pups in blue, superimposed for ease in comparing. For additional clarity, results from each group are presented separately in A’, control-Di-CNO; and A”, Pet1-Di-CNO. Similar scatter plots but only including recovery data from the first asphyxia-apnea bout (B–B”), from bout 2 (C–C”), bout 3 (D–D”), and bout 4 (E–E”). Solid lines reflect a linear regression with dotted lines denoting 95% confidence intervals. Black filled shapes represent fatal bouts – diamond (bout 1), triangle (bout 3), square (bout 4). Circles reflect pups that survived all bouts. ** (p<0.01). Illustrative breathing and HR recovery tracings from a Pet1-Di-CNO pup and a Control-Di-CNO pup are presented in Figure 5—figure supplement 1.
Figure 5—figure supplement 1
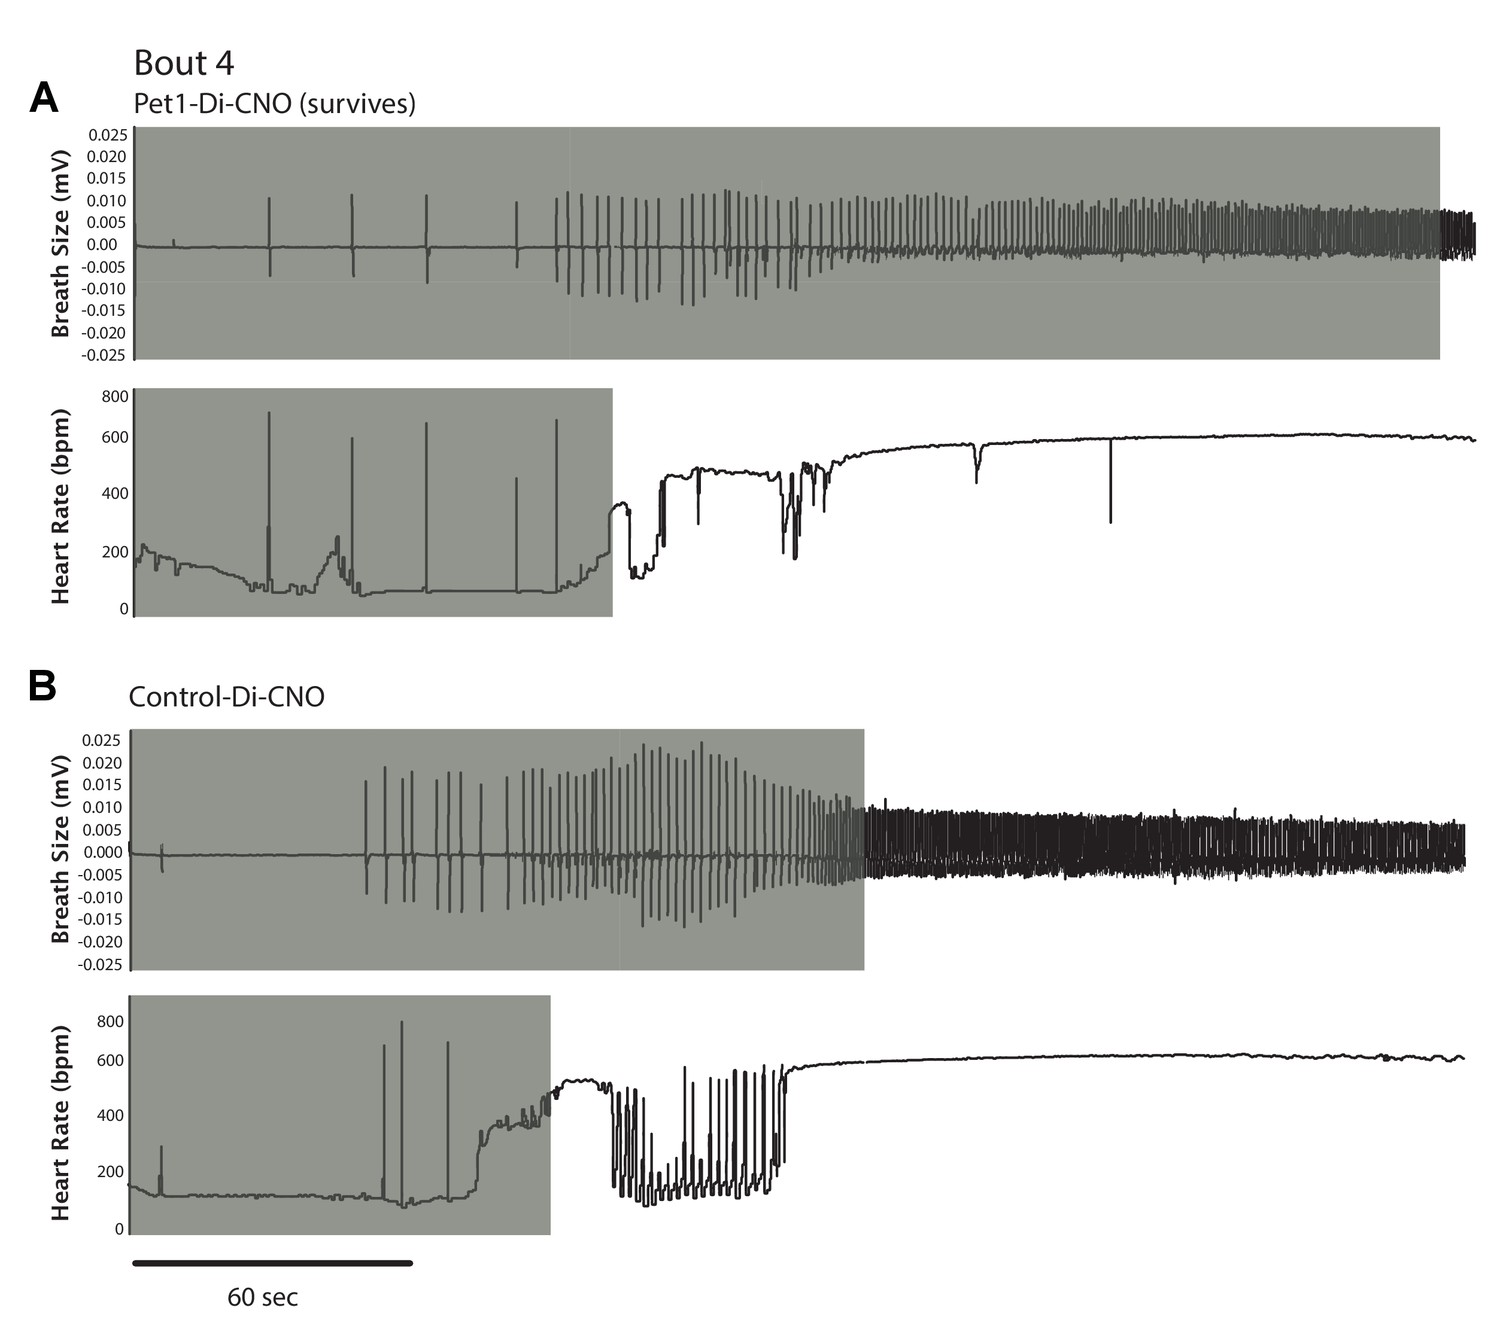
Example traces showing differential breathing and HR recovery responses to asphyxia-induced apnea in a Pet1-Di-CNO pup (A) as compared to control (B).
In each panel (A, B), the top trace reflects breathing response expressed as the raw tracing with millivolts (mV) reflecting breath size; bottom trace reflects HR in beats per min (bpm). Gray-shaded extent reflects recovery duration to achieve 63% of pre-bout baseline level.
Figure 6 with 2 supplements

Pet1-Di-CNO pups demonstrate a disordered gasp response to the initial asphyxic bout and induced apnea.
(A) Example respiratory traces immediately following the first asphyxia-induced apnea: top trace, from a Pet1-Di-CNO pup that goes on to die during a subsequent bout; bottom trace, from a control-Di-CNO pup (non-Di-expressor). Illustrated are differences in gasp characteristics and components that are plotted in B–D. (B) First gasp size (normalized to body weight). (C) Time to first gasp during initial apnea. (D) Time difference (s, seconds) between gasp intervals. (E) Mean heart rate (HR) between gasp intervals. (F) Baseline ventilatory equivalents per oxygen, , prior to CNO administration in relation to genotype coupled with CNO exposure (neuron perturbation) and assay survival. Abbreviations: (I–IV) – time difference (s) between 1st and 2nd (I), 2nd and 3rd (II), 3rd and 4th (III), or 4th and 5th (IV) gasps, respectively. Red * or bracket compares Pet1-Di-CNO pups that go on to die versus Pet1-Di-CNO pups that survive. Blue * or bracket compares Pet1-Di-CNO pups that go on to die versus control-Di-CNO pups that survive. Shapes representing fatal bout – diamond (bout 1), triangle (bout 3), square (bout 4). Circles represent pups that survived all bouts. * (p<0.05) and **** (p<0.0001). Variability of baseline breathing and HR pre- versus during CNO exposure (prior to any asphyxic-apnea challenge) for Pet1-Di and control-Di pups is analyzed in Figure 6—figure supplement 1 and Figure 6—figure supplement 2, respectively.
Figure 6—figure supplement 1
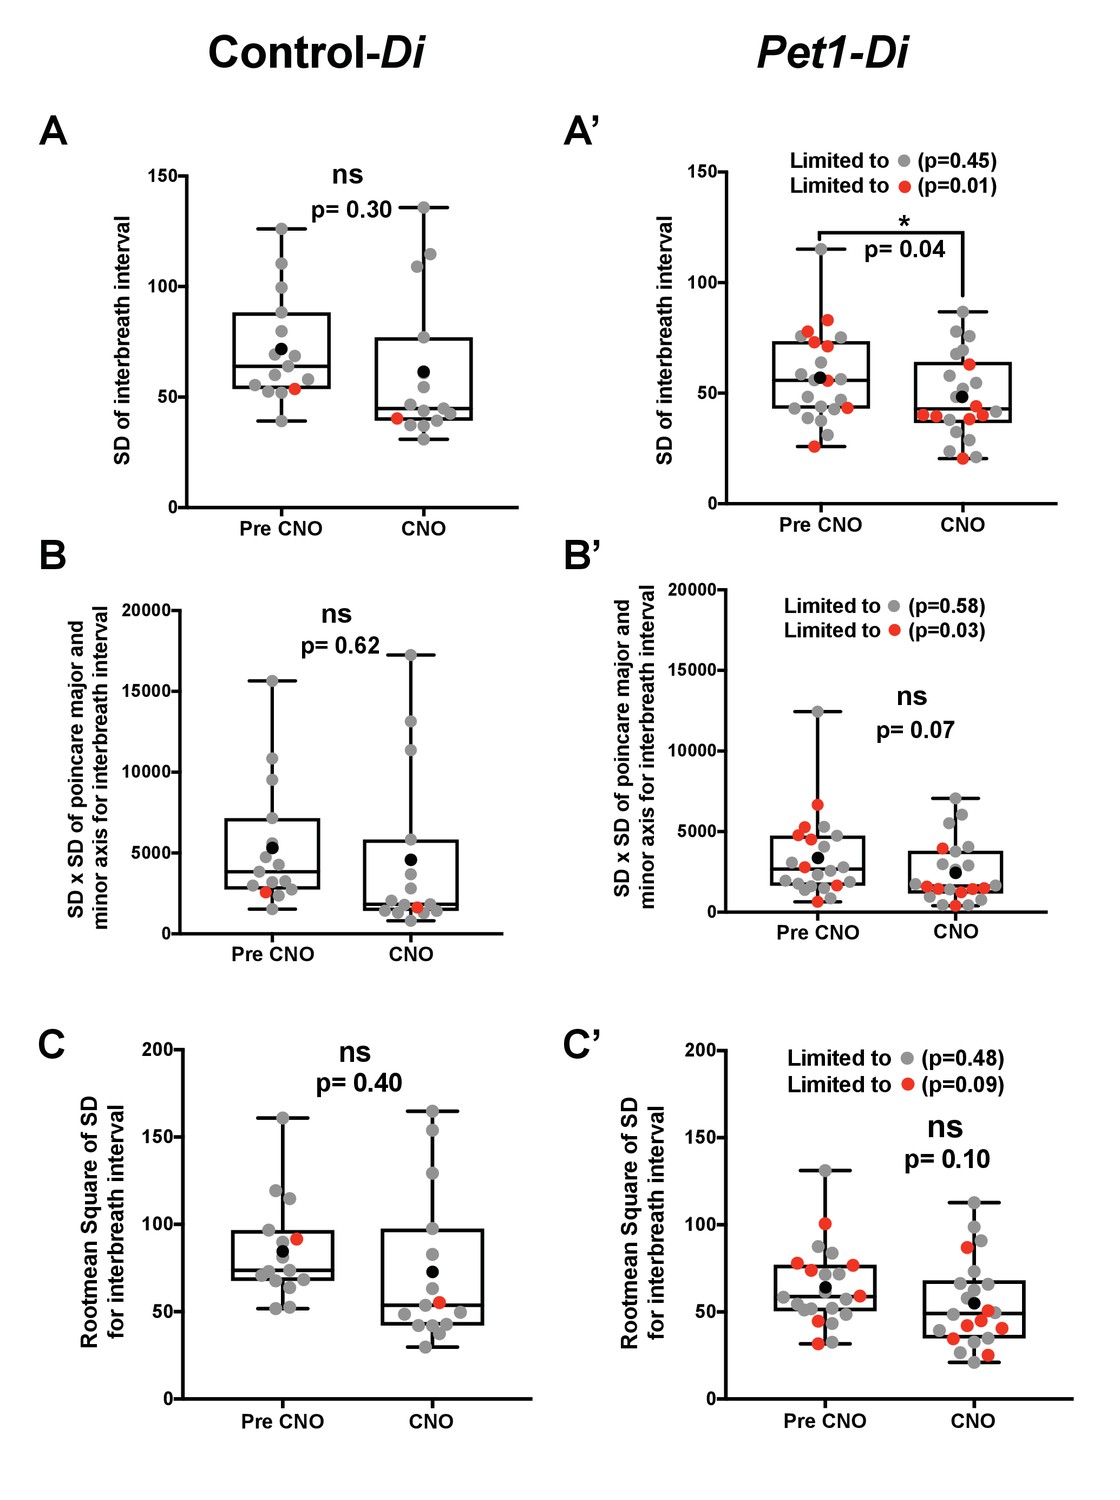
Variability for the baseline room air interbreath interval in Control-Di and Pet1-Di pups prior to and during CNO exposure.
(A–C) Control-Di pups; (A’–C’) Pet1-Di pups; gray dots reflect pups that survived all four asphyxia-induced apnea challenges; red dots, pups that died during the assay; black dots reflect the mean; box-whisker plot shows median as the horizontal line, 1st and 3rd quartiles as the ‘box,’ and maximum and minimum values as the ‘whiskers.’ Variability expressed as (A, A’) the standard deviation (SD) of the interbeat interval, (B, B’) the product of the length times the width of the distribution of the Poincare plot, and (C, C’) the root mean square of successive differences (RMSSD). Significant differences pre- versus during CNO exposure were detected for Pet1-Di mice (A’ and B’ as well when limiting analyses to animals that died).
Figure 6—figure supplement 2
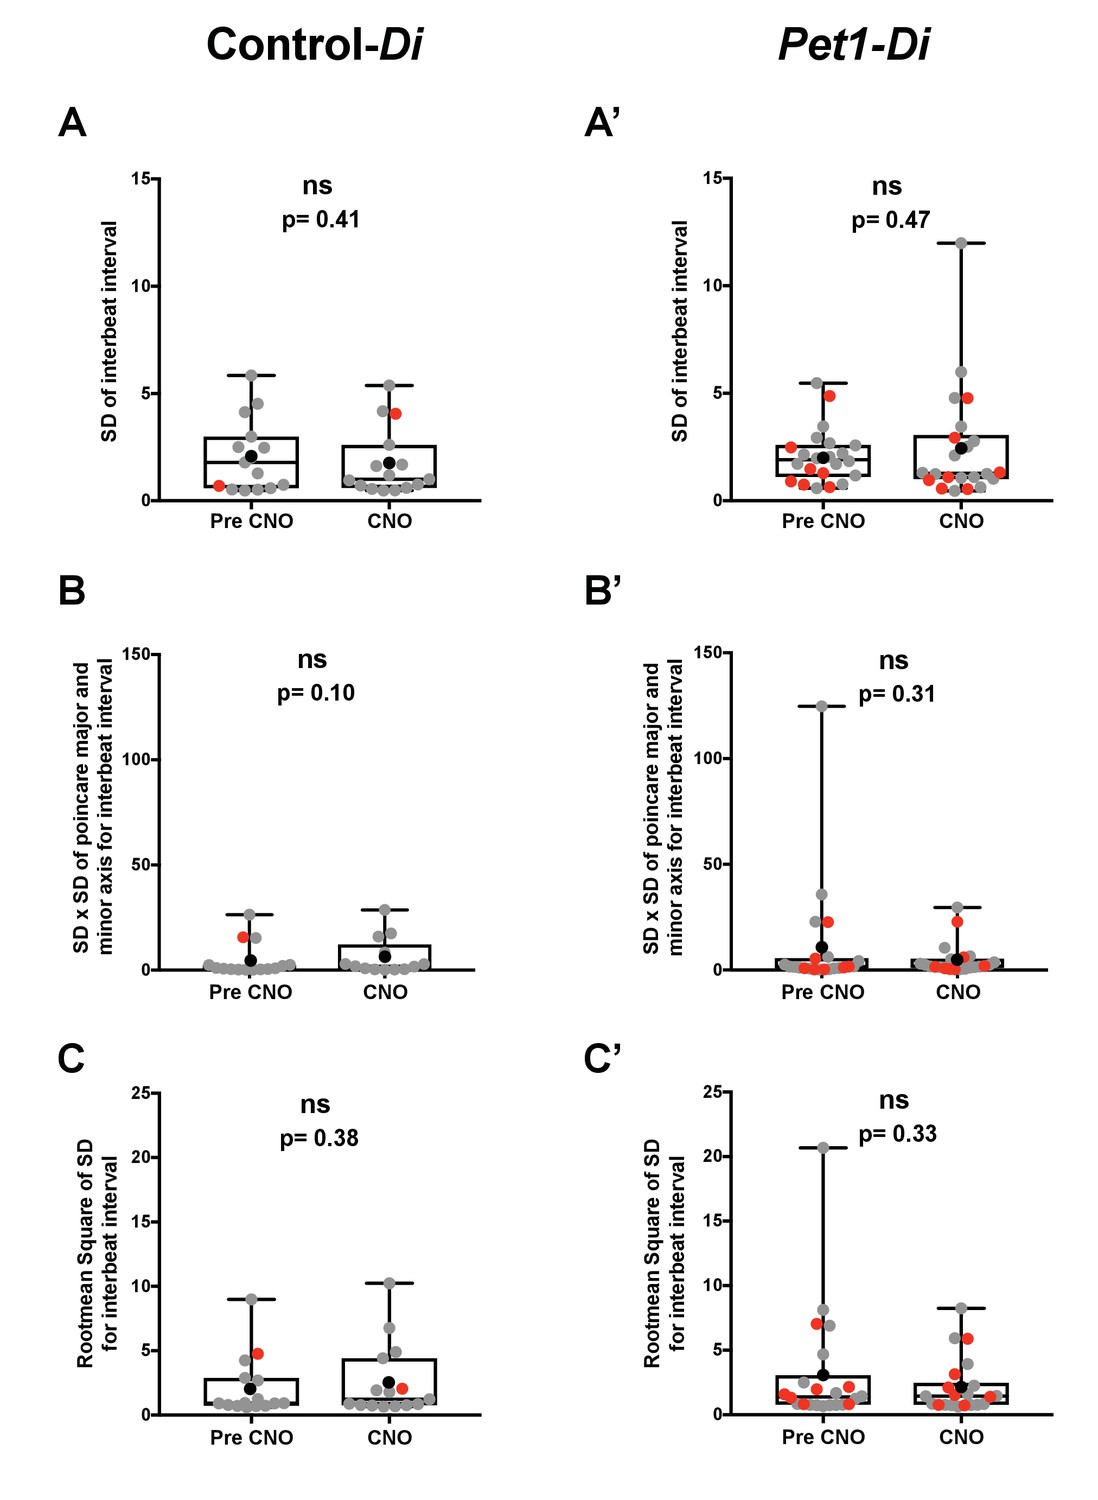
Variability for the baseline room air interbeat interval in Control-Di and Pet1-Di pups prior to and during CNO exposure.
(A–C) Control-Di pups; (A’–C’) Pet1-Di pups; gray dots reflect pups that survived all four asphyxia-induced apnea challenges; red dots, pups that died during the assay; black dots reflect the mean; box-whisker plot shows median as the horizontal line, 1st and 3rd quartiles as the ‘box,’ and maximum and minimum values as the ‘whiskers.’ Variability expressed as (A, A’) the standard deviation (SD) of the interbeat interval, (B, B’) the product of the length times the width of the distribution of the Poincare plot, and (C, C’) the root mean square of successive differences (RMSSD). No significant differences pre- versus during CNO exposure were detected for either genotype.
Figure 7
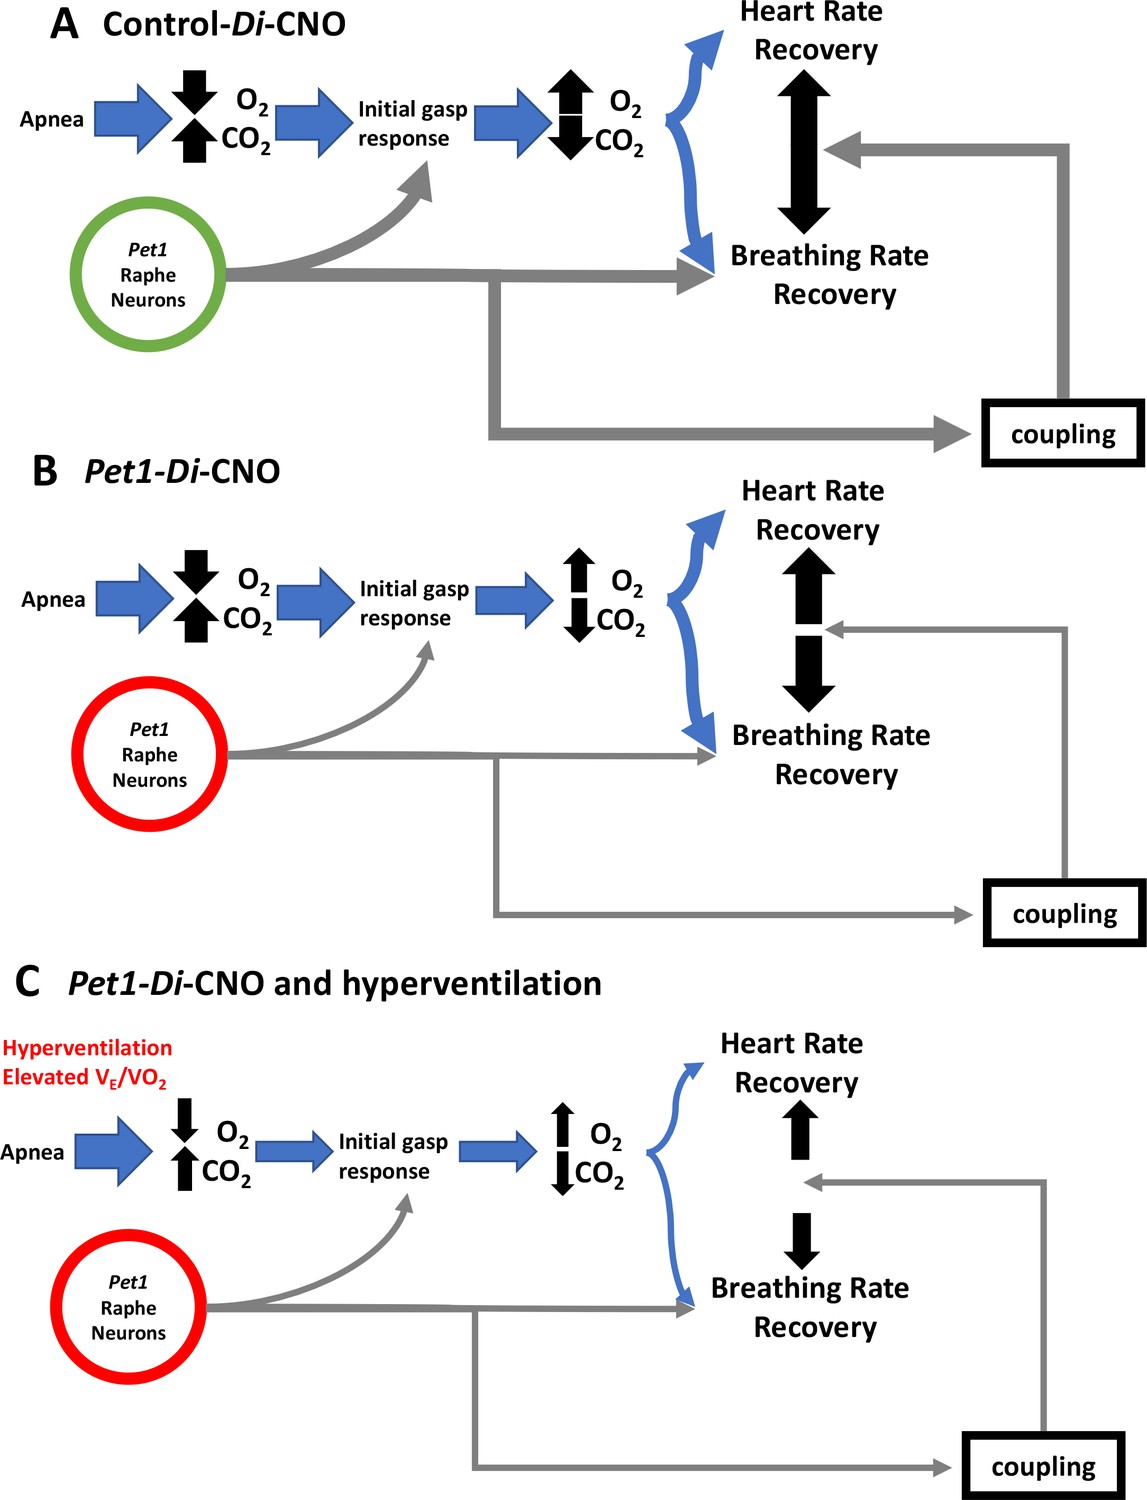
Proposed Pet1-neuron involvement in the postneonatal autoresuscitation response to apneas.
(A) In control pups (unrecombined RC-FDi allele harboring, non-Di expressors exposed to CNO), an apnea (with associated bradycardia) would lead to blood/tissue oxygen tension (PO2) reduction and carbon dioxide tension (PCO2) elevation, which in turn would stimulate Pet1 raphe neuron activity along with other brainstem areas to trigger gasping, resulting in homeostatic PO2 elevation and PCO2 reduction enabling heart and breathing rate recovery, which occurs in a linearly coupled fashion, ultimately restoring life-supporting PO2 and PCO2 levels. (B) In Pet1-Di-CNO pups in which Pet1 neurons are acutely perturbed, the initial gasp response is disordered and diminished, as is the breathing rate recovery, which becomes decoupled from the more normal heart rate recovery trajectory. Collectively this leads to prolonged and potentially life-threatening PO2 andPCO2 levels. (C) Worsening yet is when spontaneous conditions of hyperventilation (elevated ) couple with Pet1 neuron perturbation. The dual insult results in diminished collective drive across Pet1 and other neuron types, resulting in greater impairment in gasping and a more severe decoupling of the breathing and heart rate recovery responses, increasing significantly the risk likelihood of death.
Tables
Table 1
Baseline cardiorespiratory values prior to CNO-induced disruption of Pet1-neurons.
Data (mean ±standard deviation) for each time point were obtained prior to CNO-induced silencing (Figure 1G open window a). Student’s t-test was used to assess differences between genotypes.
| RC-FDi(Control-Di)n=15 | Pet1-Flpe;RC-FDi(Pet1-Di)n=22 | ||||
|---|---|---|---|---|---|
| Mouse baseline characteristics | Mean | SD | Mean | SD | t-test p value |
| Weight (BW) (g) | 5.503 | 1.115 | 5.04 | 1.275 | 0.2616 |
| Breathing frequency (ƒ) (breaths • min−1) | 241.6 | 26.87 | 246.3 | 30.93 | 0.6406 |
| Tidal volume (VT) (ml • g−1) | 4.51 | 1.034 | 4.757 | 1.784 | 0.6322 |
| Minute ventilation () (ml • min−1 • g−1) | 1070 | 169.9 | 1139 | 331.9 | 0.4618 |
| Heart rate (HR) (bpm) | 634.6 | 40.88 | 612.8 | 42.01 | 0.1271 |
| Oxygen consumption () (ml • min−1 • g−1) | 77.43 | 19.19 | 71.25 | 14.39 | 0.2705 |
| Ventilatory equivalents () | 14.33 | 2.989 | 16.13 | 3.741 | 0.1281 |
Table 2
Mortality by homeostatic characteristics prior to neuron perturbation.
Logistic regression results of different homeostatic characteristics and mortality outcomes of Pet1-Di-CNO pups.
| Baseline characteristic | Odds ratio | Confidence interval | p-value* | |
|---|---|---|---|---|
| Heart rate | 1.017 | 0.994 | 1.040 | 0.15 |
| Ventilation | 1.001 | 0.999 | 1.004 | 0.38 |
| Maximum Oxygen Consumption | 0.965 | 0.907 | 1.026 | 0.25 |
| Ventilatory Equivalents | 1.399 | 1.039 | 1.883 | 0.027 |
-
*logistic regression, controlling for genotype
Key resources table
| Reagent type (species) or resource | Designation | Source or reference | Identifiers | Additional information |
|---|---|---|---|---|
| Genetic reagent (M. musculus) | Pet1-Flpe | PMID: 18344997 | Dr. Susan Dymecki (Department of Genetics, Harvard Medical School) | |
| Genetic reagent (M. musculus) | RC-FDi Gt(ROSA)26Sortm(CAG-FSF-CHRM4*(Di))Dym | PMID: 21798952 | derivative of MGI:5790683 Gt(ROSA)26Sortm9(CAG-mCherry,-CHRM4*)Dym | Dr. Susan Dymecki (Department of Genetics, Harvard Medical School) |
| Antibody | Rabbit polyclonal anti-Tph2 | Novus Biological | Cat. #: NB100-74555 RRID:AB_1049988 | IHC (1:1000) |
| Antibody | Rat monoclonal anti-HA | Chromotek | Cat. # 7C9 RRID: AB_2631399 | IHC (1:200) |
| Antibody | Goat polyclonal anti-5-HT | Abcam | Cat. # ab66047 RRID:AB_1142794 | IHC (1:1000) |
| Antibody | Donkey anti-rabbit IgG-Alexa Fluor 488 | ThermoFisher Scientific | Cat. # A-21206 RRID:AB_2535792 | IHC (1:500) |
| Antibody | Donkey anti-rat IgG-Alexa Fluor 594 | ThermoFisher Scientific | Cat. # A-21209 RRID:AB_2535795 | IHC (1:500) |
| Antibody | Donkey anti-goat igG-Alexa Fluor 647 | ThermoFisher Scientific | Cat. # A-21447 RRID:AB_2535864 | IHC (1:500) |
| Recombinant DNA reagent | Flpe forward primer | 5’-GCATCTGGGAGATCACTGAG-3’ | PCR genotyping | |
| Recombinant DNA reagent | Flpe reverse primer | 5’-CCCATTCCATGCGGGGTATCG-3’ | PCR genotyping | |
| Recombinant DNA reagent | FDi forward primer | 5’-CGAATTCGGAAACATAACTTCG-3’ | PCR genotyping | |
| Recombinant DNA reagent | FDi reverse primer | 5’-GGCAATGAAGACTTTCCACCG-3’ | PCR genotyping | |
| Chemical compound, drug | clozapine-N-oxide (CNO) | Sigma | Cat. # C0832 | fresh stock solution 1 mg/ml in saline |
| Chemical compound, drug | DAPI (4', 6-diamidino-2-phenylindole) | ThermoFisher Scientific | Cat. # D1306 | nuclear counter staining, final concentraion at 5 µg/mL |
Additional files
-
Transparent reporting form
- https://doi.org/10.7554/eLife.37857.019
Download links
A two-part list of links to download the article, or parts of the article, in various formats.
Downloads (link to download the article as PDF)
Open citations (links to open the citations from this article in various online reference manager services)
Cite this article (links to download the citations from this article in formats compatible with various reference manager tools)
Acute perturbation of Pet1-neuron activity in neonatal mice impairs cardiorespiratory homeostatic recovery
eLife 7:e37857.
https://doi.org/10.7554/eLife.37857


