Loss of p53 suppresses replication-stress-induced DNA breakage in G1/S checkpoint deficient cells
- The Netherlands Cancer Institute, The Netherlands
- VU University Medical Center, The Netherlands
- University of Birmingham, United Kingdom
- University Medical Center Groningen, The Netherlands
Figures
Figure 1 with 1 supplement
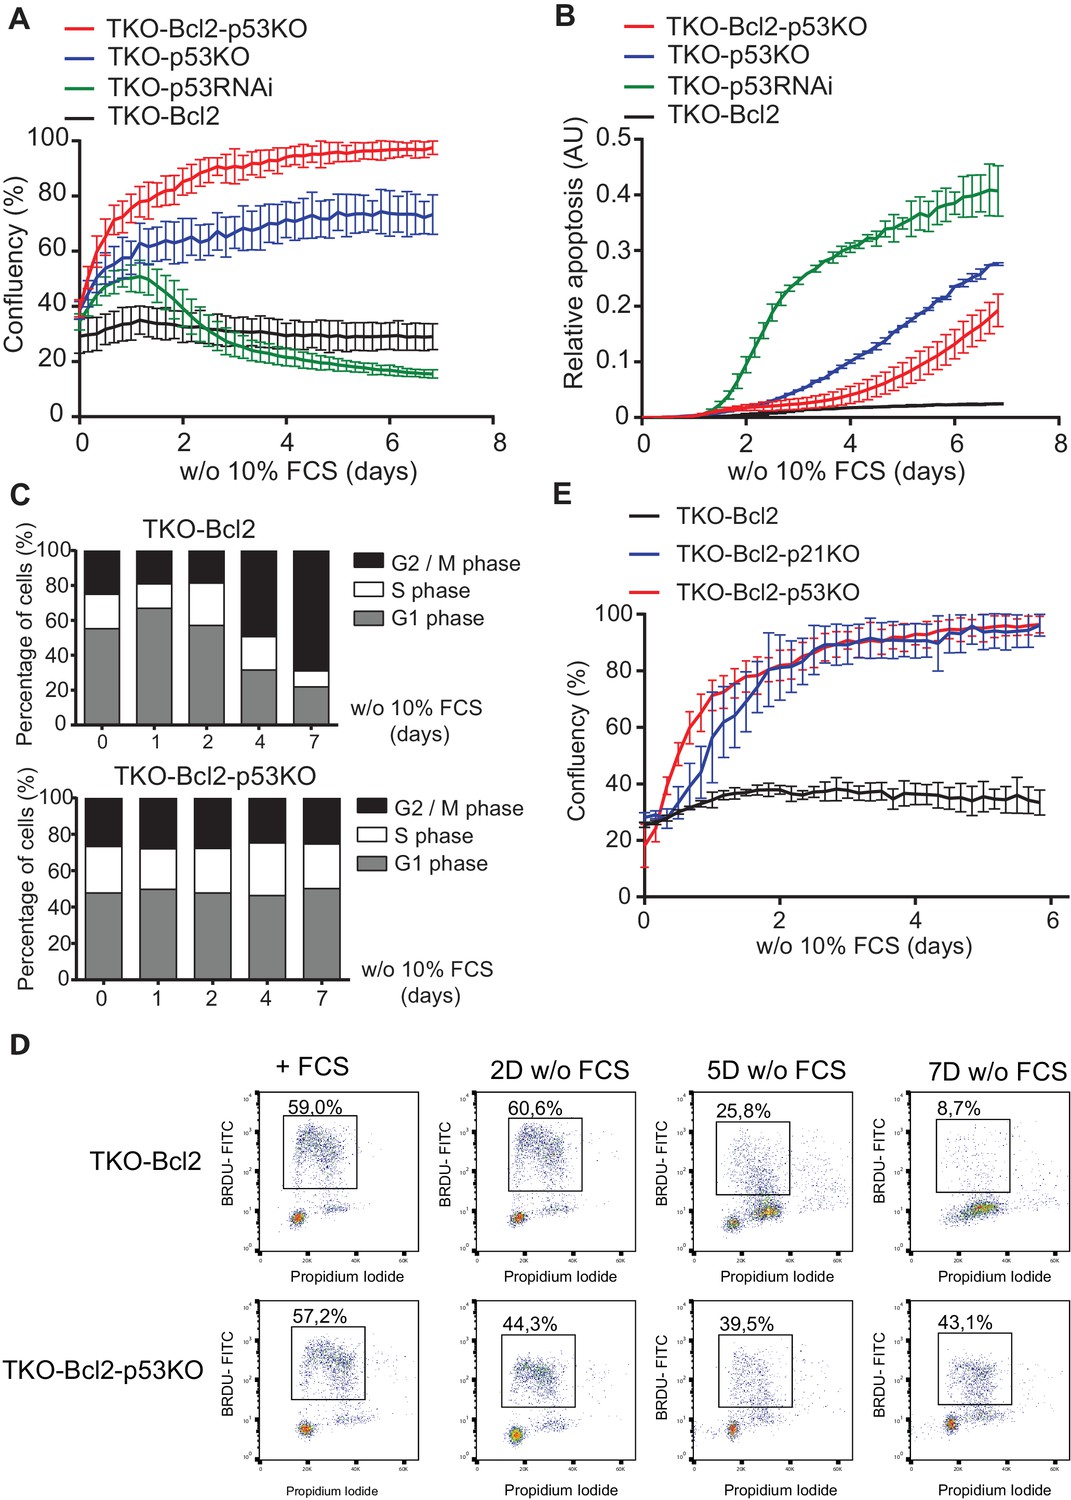
Loss of p53/p21Cip1 promotes proliferation of mitogen-deprived MEFs lacking G1/S phase checkpoint.
(A) IncuCyte growth curves of TKO-Bcl2 (black), TKO-p53RNAi (green), TKO-p53KO (blue) and TKO-Bcl2-p53KO (red) MEFs in the absence of 10% FCS. (B) Apoptosis levels of TKO-Bcl2 (black), TKO-p53RNAi (green), TKO-p53KO (blue) and TKO-Bcl2-p53KO (red) MEFs in the absence of 10% FCS. Apoptosis was measured by fluorescent signal upon caspase three cleavage and normalized to cell confluency. (C) Cell cycle distribution based on propidium iodide content of TKO-Bcl2 MEFs (upper panel) and TKO-Bcl2-p53KO MEFs (lower panel) in the absence of 10% FCS for the indicated days. (D) BrdU flow cytometry analysis of the cell cycle distribution of TKO-Bcl2 and TKO-Bcl2-p53KO MEFs in the absence of 10% FCS for the indicated days. Percentage of BrdU-labeled cells is indicated. (E) IncuCyte growth curves of TKO-Bcl2 (black), TKO-Bcl2-p53KO (red) and TKO-Bcl2-p21KO (blue) MEFs in the absence of 10% FCS. Experiments in A, B and E were performed in triplicate. Error bars show standard deviation (sd).
Figure 1—figure supplement 1
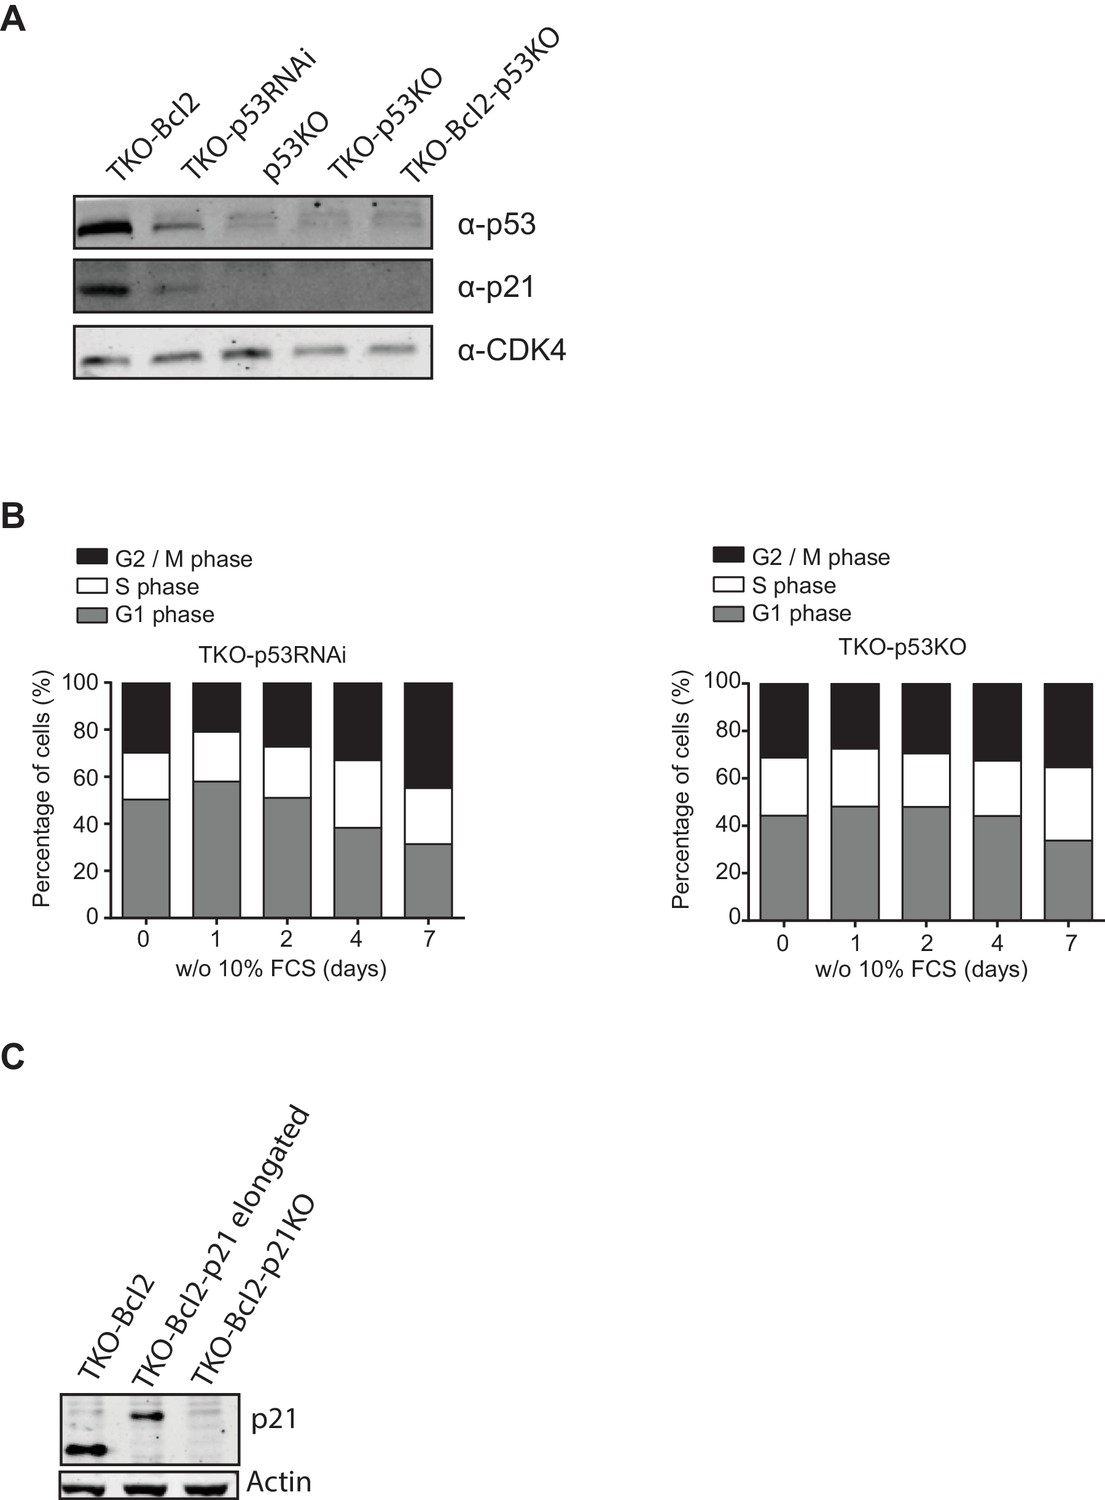
Reduced G2 arrest in mitogen-starved TKO-p53RNAi and TKO-p53KO MEFs.
(A) p21Cip1 and p53 protein levels in TKO-Bcl2, TKO-p53RNAi, p53KO, TKO-p53KO andTKO-Bcl2-p53KO MEFs. Anti-CDK4 was used as a loading control. (B) Cell cycle distribution based on propidium iodide content of TKO-p53RNAi MEFs (left panel) and TKO-p53KO MEFs (right panel) in the absence of 10% FCS for the indicated days. (C) Using a CRISPR vector, Cdkn1a was disrupted in TKO-Bcl2 cells. p21Cip1 protein levels were measured after irradiation with 10 Gy. One of the clones expressed elongated p21Cip1 protein. The clone with absent p21Cip1 staining (TKO-Bcl2-p21KO) was used in further experiments. Anti-actin was used as a loading control.
Figure 2
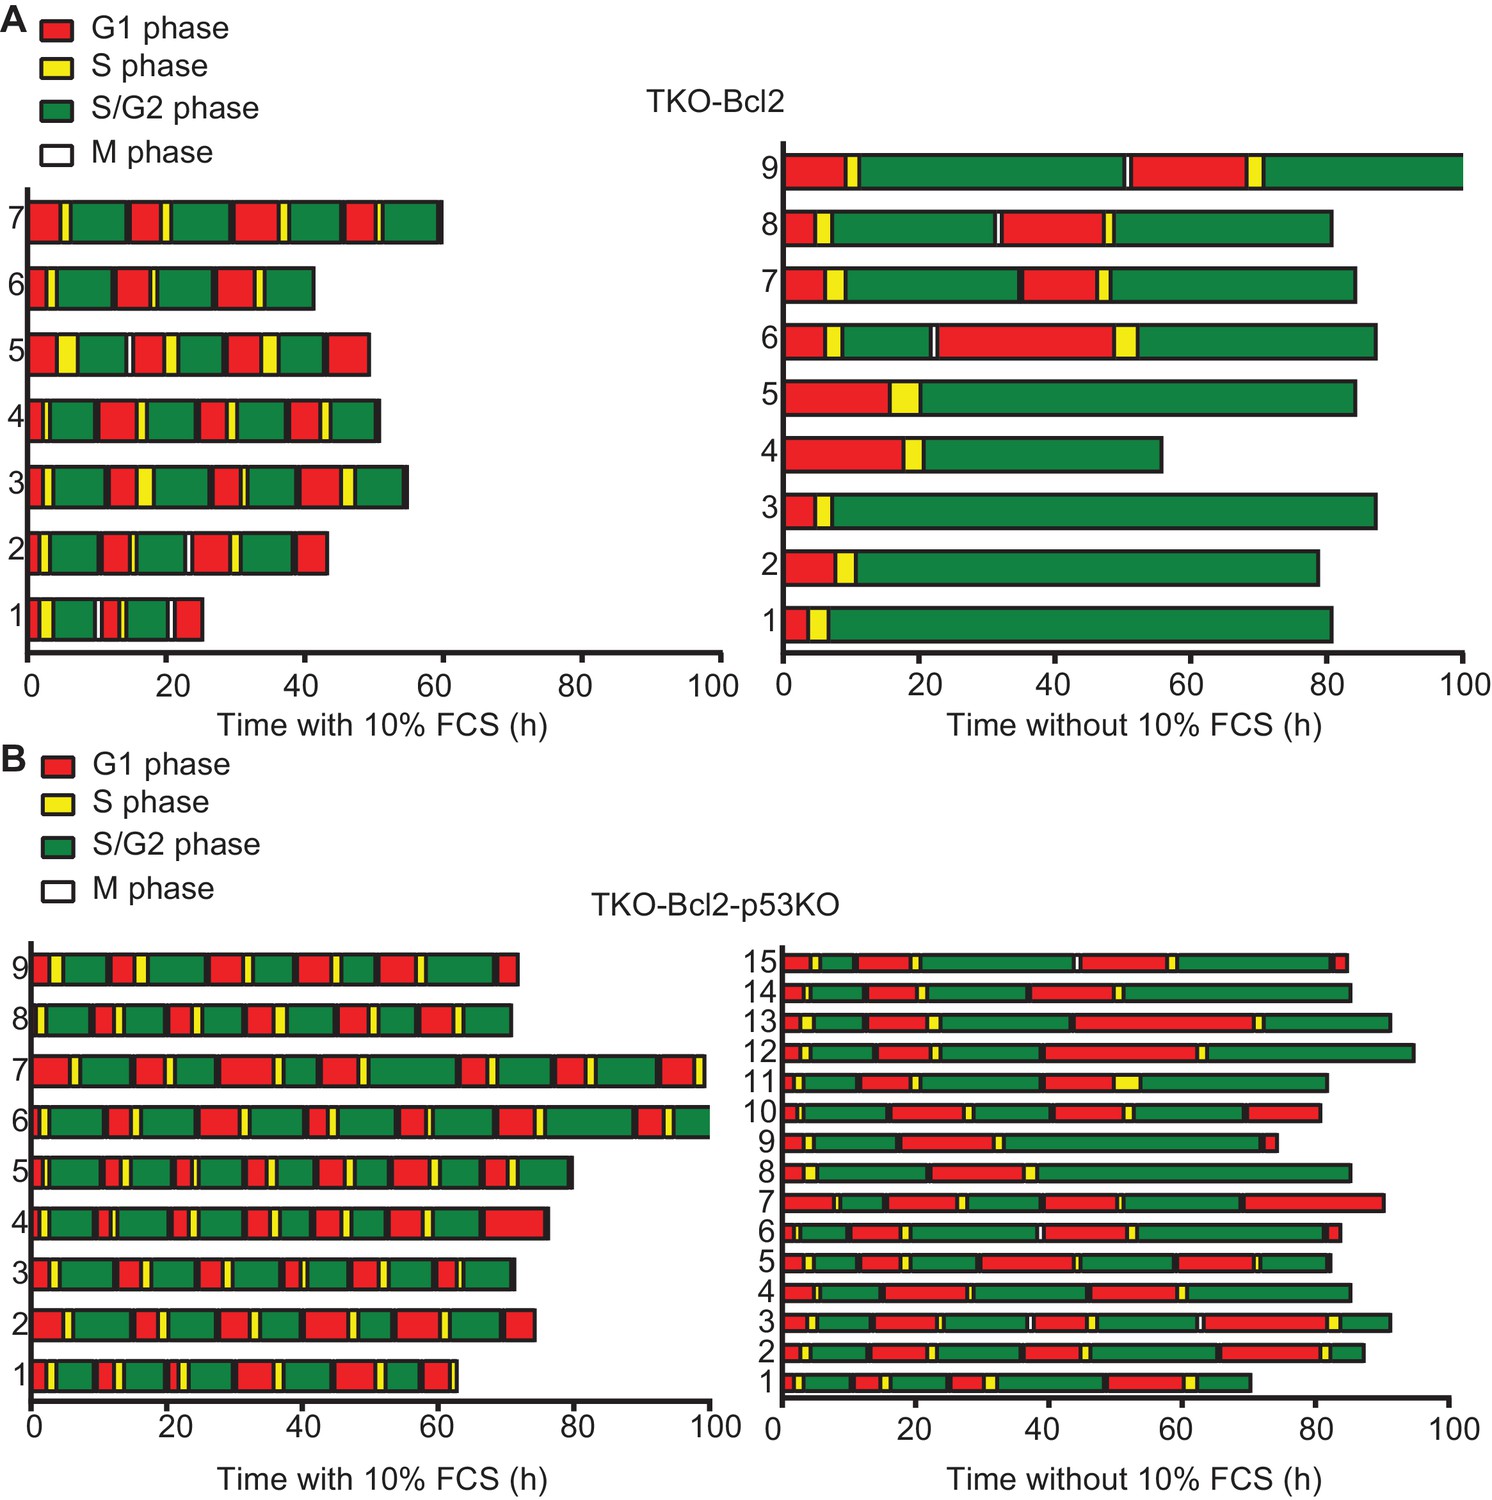
Loss of p53 rescues G2 arrest in mitogen-deprived TKO-Bcl2 MEFs.
Timing of cell cycle phases in (A) TKO-Bcl2 MEFs and (B) TKO-Bcl2-p53KO MEFs expressing mKO-hCdt1 and mAG-hGem and cultured in the presence (left panels) or absence (right panels) of 10% FCS. The period a cell only expressed mKO-hCdt1 (G1 phase) is marked red, only expressed mAG-hGem (S/G2/M phase) is marked green, expressed both mKO-hCdt1 and mAG-hGem (early S phase) is marked yellow. During mitosis both markers are absent (white).The y-axes represent individual cells.
Figure 3 with 1 supplement
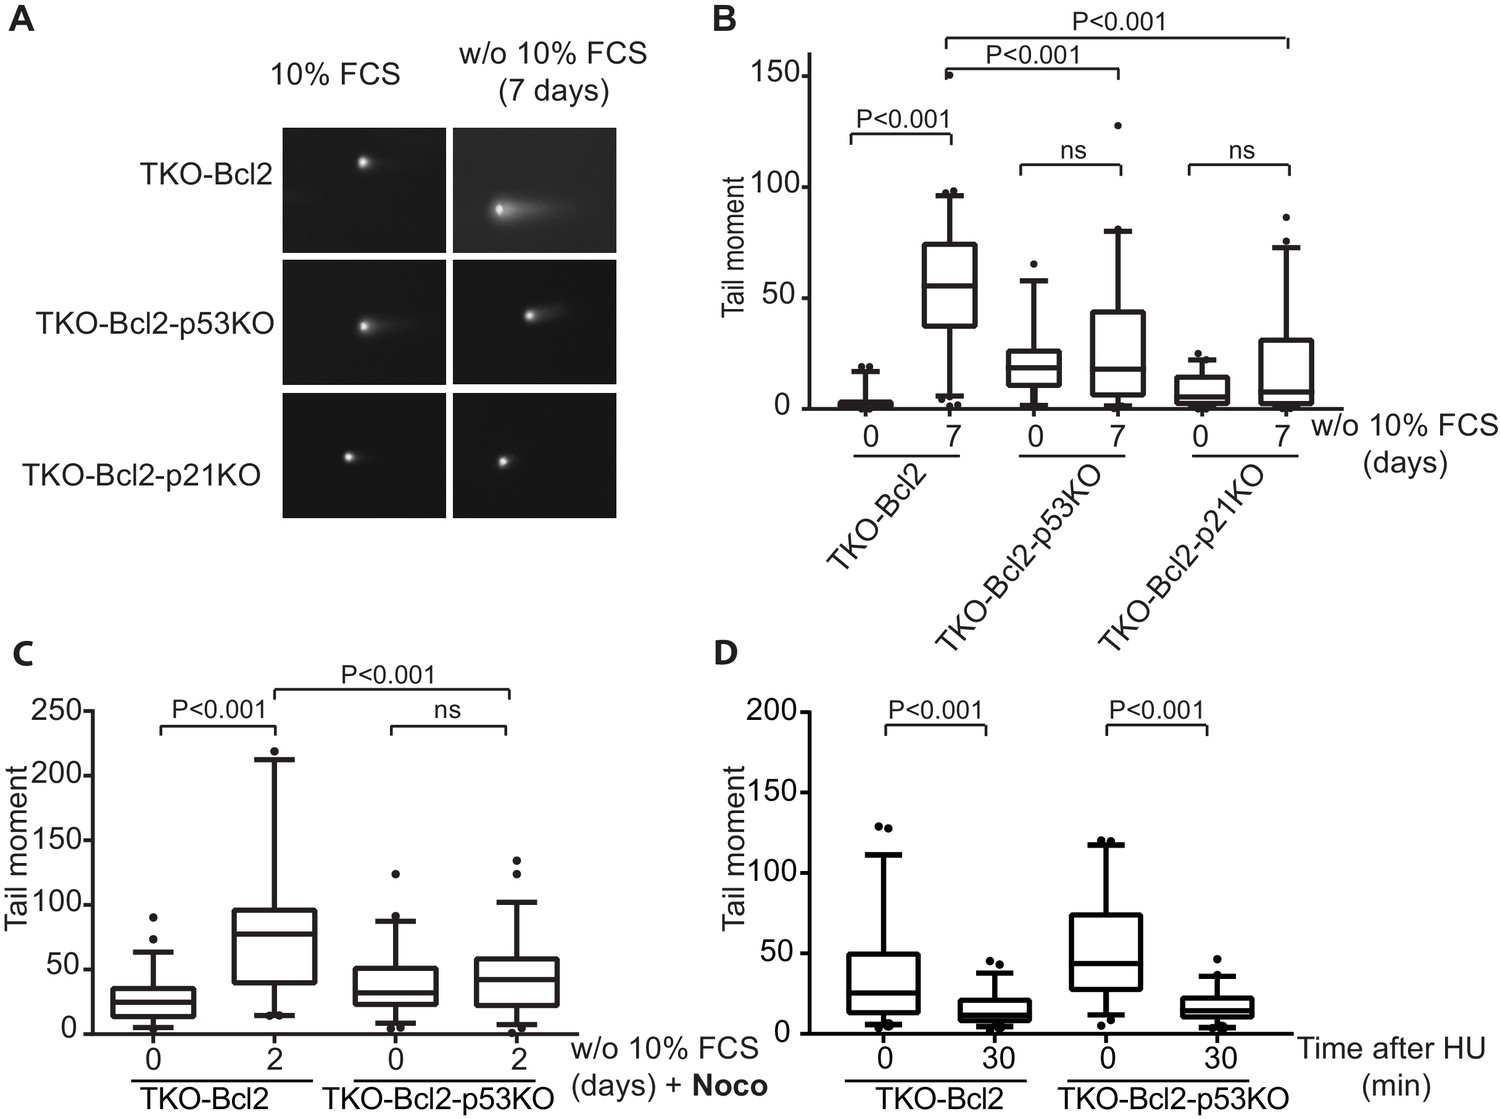
Loss of p53 reduces DNA double-stranded breaks.
(A) Representative comets of nuclei of TKO-Bcl2, TKO-Bcl2-p53KO MEFs and TKO-Bcl2-p21KO MEFs stained with propidium iodide in the presence or absence of 10% FCS (7 days). (B) Tail moments obtained from TKO-Bcl2, TKO-Bcl2-p53KO and TKO-Bcl2-p21KO MEFs cultured in the presence or absence of 10% FCS (7 days). (C) Tail moments obtained from TKO-Bcl2 and TKO-Bcl2-p53KO MEFs cultured in the presence or absence of 10% FCS (2 days) and in the presence of nocodazole. (D) Tail moments obtained from TKO-Bcl2 and TKO-Bcl2-p53KO MEFs immediately and 30 min after 1 hr treatment with 2 mM HU. In B, C and D, box plots represent interquartile ranges, horizontal bars denote the median and points indicate outliers. For each condition, more than 50 cells were analyzed using the CASP software. Significance is indicated (1-way Anova nonparametric Kruskal-Wallis test).
Figure 3—figure supplement 1
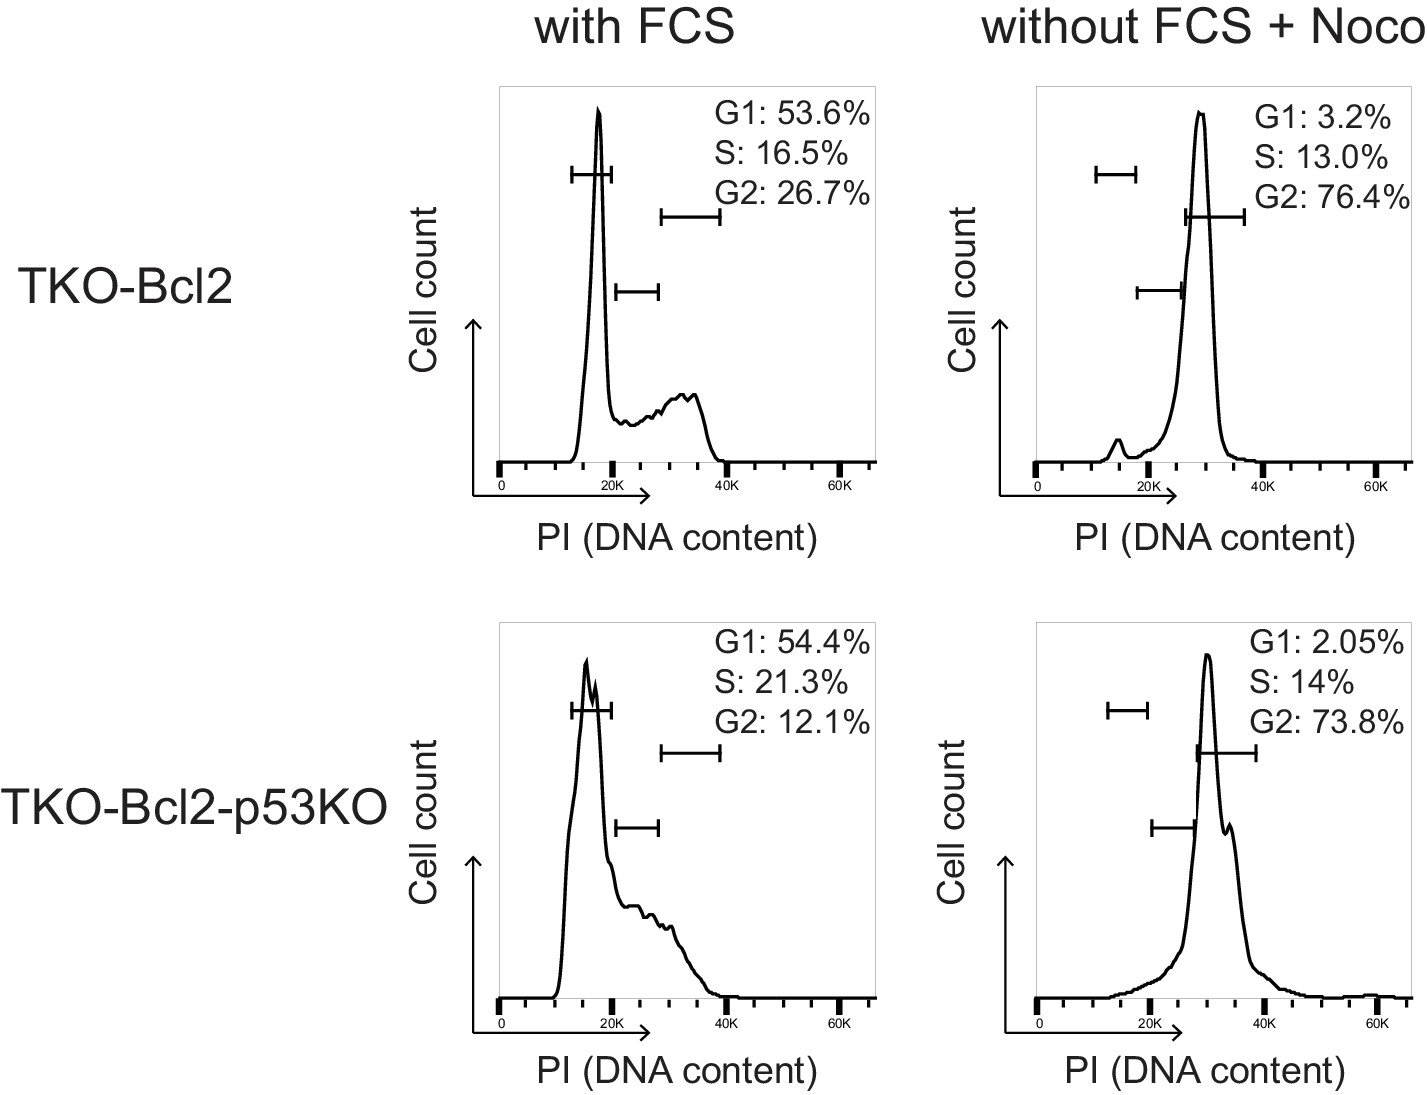
Nocodazole-induced cell cycle arrest to prevent G1 entry.
Propidium iodide staining cell cycle analysis of TKO-Bcl2 and TKO-Bcl2-p53KO MEFs cultured in the presence of 10% FCS (left panels) and in the absence of 10% FCS and in the presence of 250 ng/ml nocodazole (right panels).
Figure 4
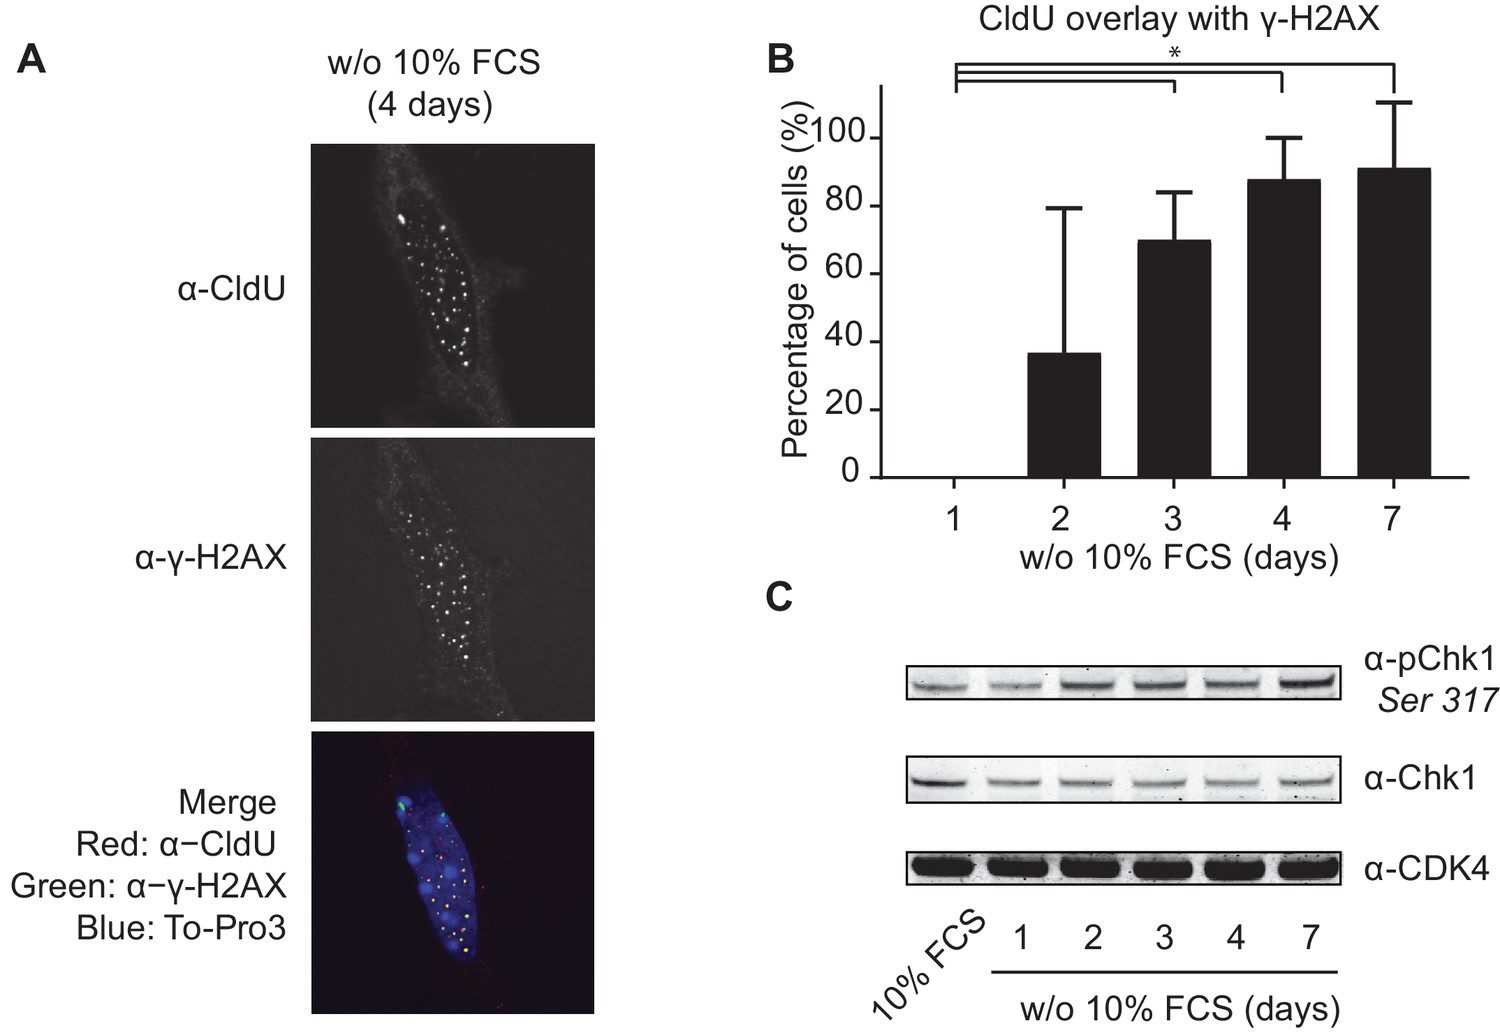
Mitogen-deprived TKO-Bcl2 MEFs suffer from replication stress.
(A) CldU and γ-H2AX foci in TKO-Bcl2 MEFs cultured in the absence of 10% FCS for 4 days. DNA was labeled with To-Pro3. In the merged picture, DNA is blue, γ-H2AX is green, CldU is red and co-localization of γ-H2AX and CldU is seen as yellow foci. (B) Quantification of CldU positive TKO-Bcl2 MEFs cultured in the absence of 10% FCS for the indicated days that contained five or more superimposed γ-H2AX and CldU foci. At least 100 cells were counted per condition. Standard deviation (error bars) between at least five different microscopic slides are shown. Significant differences between average values are indicated with an asterisk (Student’s t-test, p<0.01). (C) pChk1 (Chk1 phosphorylated on Ser317, upper panel) and Chk1 protein levels (middle panel) in TKO-Bcl2 MEFs cultured in the presence or absence of 10% FCS for the indicated days. Anti-CDK4 was used as loading control (lower panel).
Figure 5 with 2 supplements

Loss of p53 restores the level of origin firing.
(A) Schematic representation of replication tracks generated after pulse labeling with CldU (red) and IdU (green). Ongoing forks were used to determine fork speeds (kb/min); 1st label and 2nd label origins are origins of replication initiated during the labelling period with CldU and IdU, respectively (upper panel). Representative images of DNA fibers of TKO-Bcl2 MEFs with and without 10% FCS (lower panel). (B) Replication fork speeds in TKO-Bcl2 and TKO-Bcl2-p53KO MEFs cultured in the presence or absence of 10% FCS for 1–7 days. Box plots represent interquartile ranges, horizontal bars denote the median, whiskers indicate 5–95 percentile and points are outliers. At least 350 track lengths of ongoing forks were measured (from three independent experiments) with ImageJ. Significant differences between median values are indicated with an asterisk (nonparametric Kruskal-Wallis test, p<0.05). (C) Quantification of origin firing in TKO-Bcl2, TKO-Bcl2-p53KO and TKO-Bcl2-p21KO MEFs cultured in the presence or absence of 10% FCS for 1–5 days. 1st label and 2nd label origins are shown as percentage of all labeled tracks (from three independent experiments). Significant differences between average values are indicated with an asterisk (p<0.05, Student’s t-test).
Figure 5—figure supplement 1
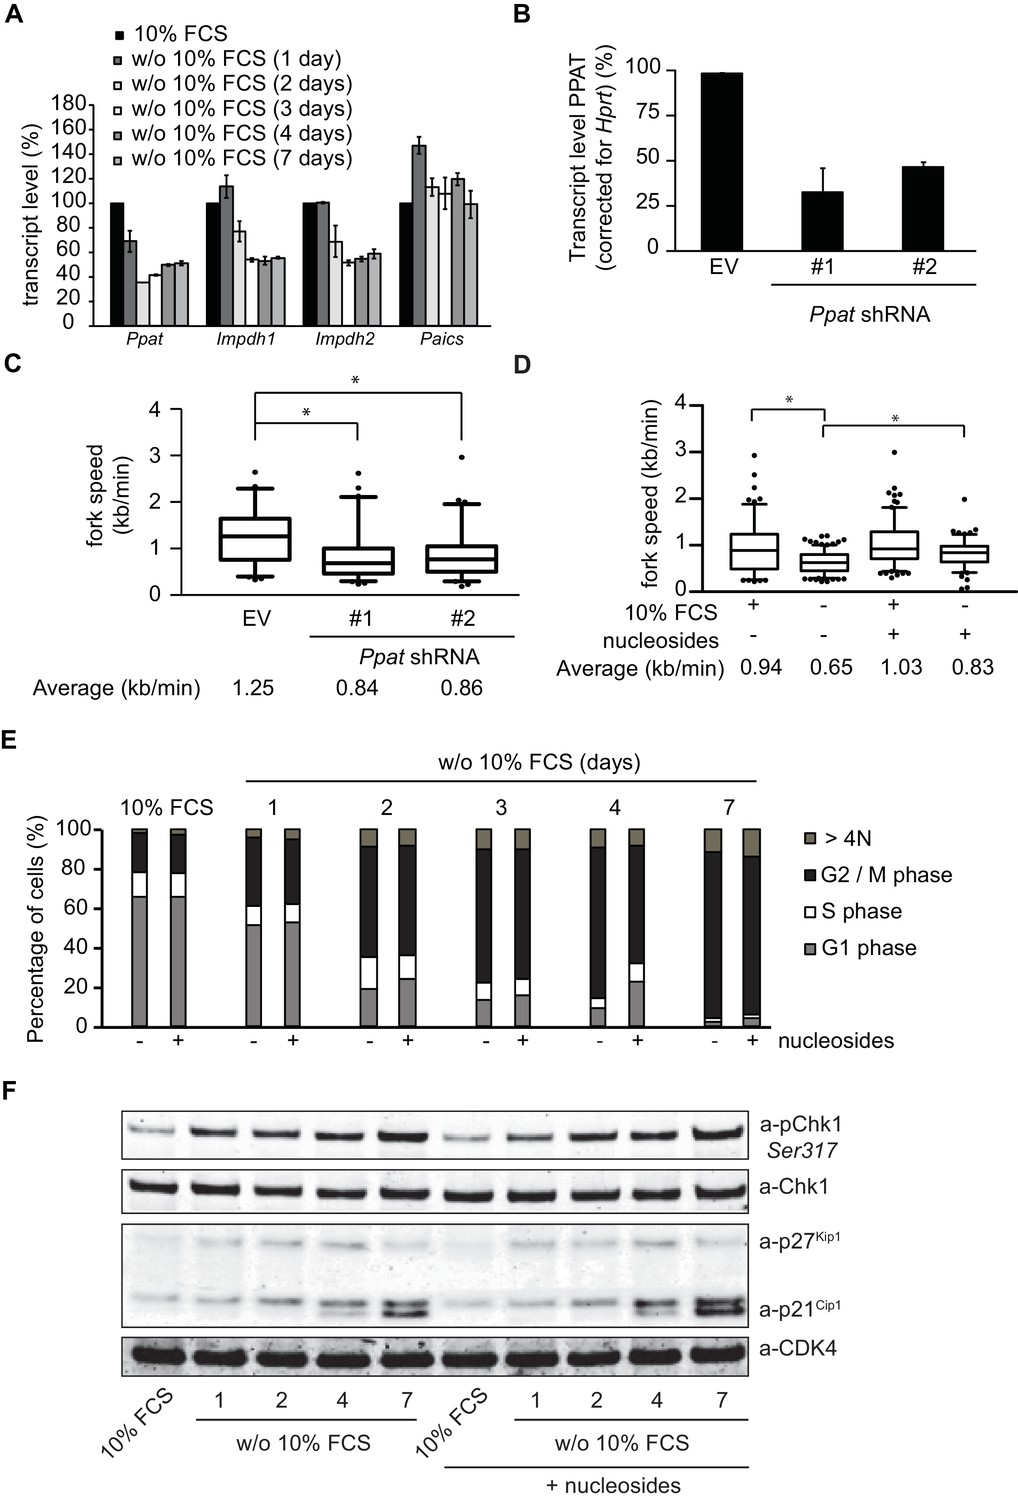
Nucleotide deficiency is not causal to G2 arrest.
(A) Transcript levels of Ppat, Impdh1, Impdh2 and Paics (corrected for Hprt transcript levels) in TKO-Bcl2 MEFs cultured in the presence or absence of 10% FCS for the indicated days. The expression in the presence of 10% FCS is set as 100%. Standard deviation (bars) from two independent experiments is shown. (B) Transcript level of Ppat (corrected for Hprt transcript level) in TKO-Bcl2 MEFs 2 days after transduction with shRNAs against Ppat (#1 and #2) or non-targeting shRNA (EV, set as 100%). Standard deviation (bars) of three independent experiments is shown. (C) Replication fork speeds in TKO-Bcl2 MEFs 2 days after transduction with shRNAs against Ppat (#1 and #2) or non-targeting shRNA (EV). (D) Replication fork speeds in TKO-Bcl2 MEFs cultured in the presence or absence of 10% FCS for 1 day with or without the exogenous supply of nucleosides. For C and D, box plots represent interquartile ranges, horizontal bars denote the median, whiskers indicate 5–95 percentile and points are outliers. At least 100 track lengths of ongoing forks were measured. Average values marked with asterisk are significantly different (nonparametric Kruskal-Wallis test, p<0.05). (E) Cell cycle distribution of TKO-Bcl2 MEFs cultured in the presence or absence of 10% FCS for the indicated days with or without daily exogenous supply of nucleosides. (F) pChk1 (Ser317), Chk1, p21Cip1 and p27Kip1 protein levels in TKO-Bcl2 MEFs cultured in the presence or absence of 10% FCS for the indicated days in the presence or absence of nucleosides. Anti-CDK4 was used as loading control.
Figure 5—figure supplement 2
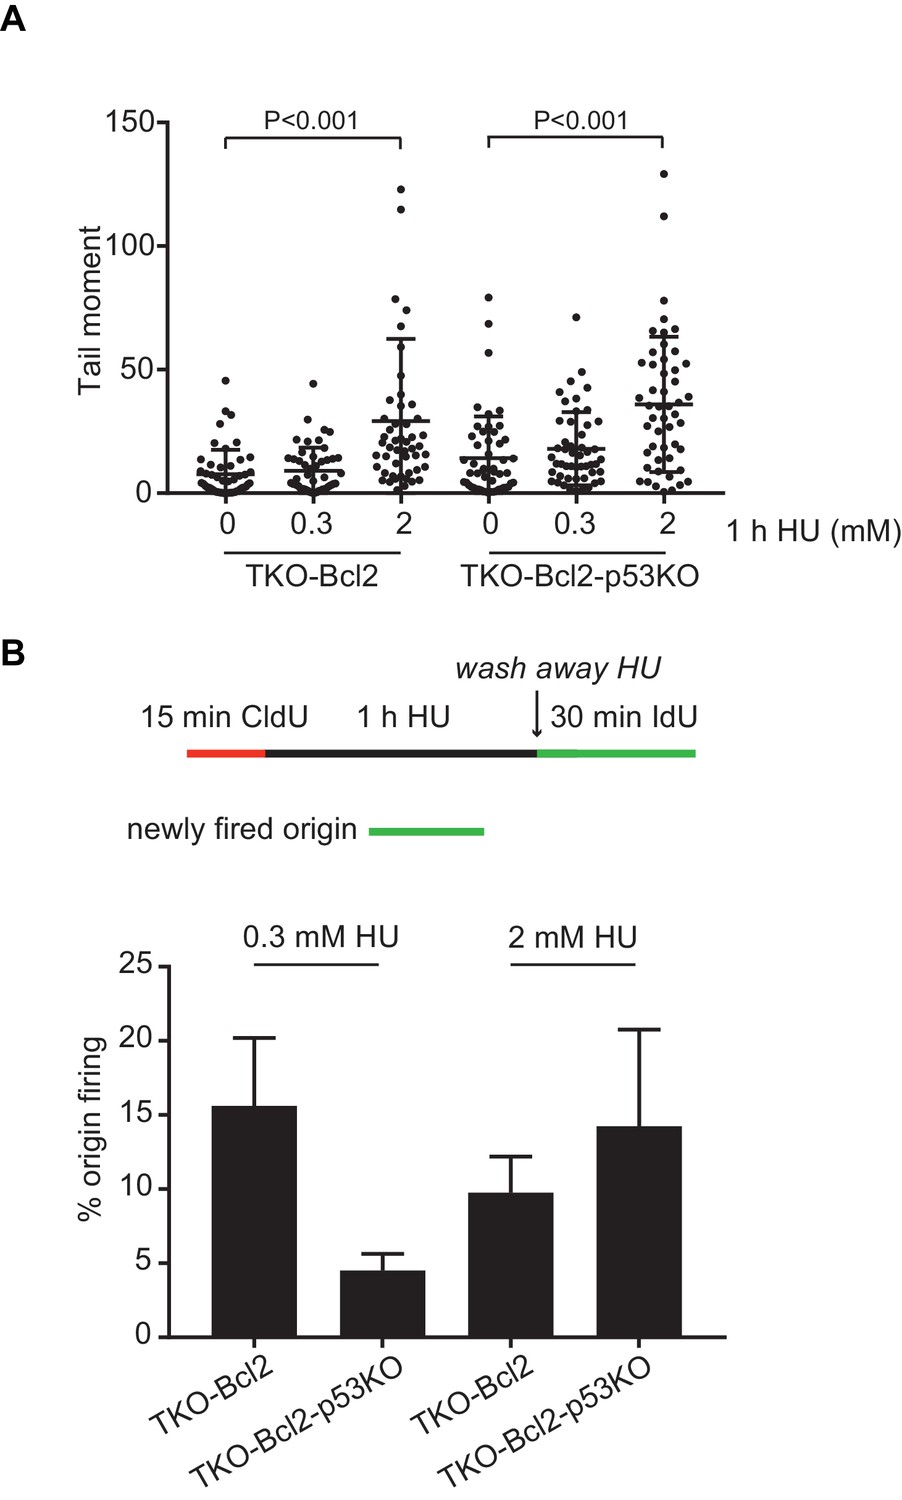
DNA replication stress induced by 0.3 and 2 mM Hydroxyurea.
(A) Tail moments obtained from TKO-Bcl2 and TKO-Bcl2-p53KO cultured in the absence or presence of 0.3 or 2 mM HU for 1 hr. Box plots represent interquartile ranges, horizontal bars denote the median and points are outliers. For each condition, more than 50 cells were analyzed using the CASP software. Significance is indicated (nonparametric Mann Whitney test). (B) Quantification of origin firing of TKO-Bcl2 and TKO-Bcl2-p53KO MEFs after 1 hr treatment with 0.3 or 2 mM HU. Origins (green only) are shown as percentage of stalled (red only) and restarted tracks (red-green or green-red-green). The experiment was performed in duplicate. Error bars show standard deviation.
Figure 6 with 1 supplement
Loss of p53 reduces DNA double-strand breaks in human cells.
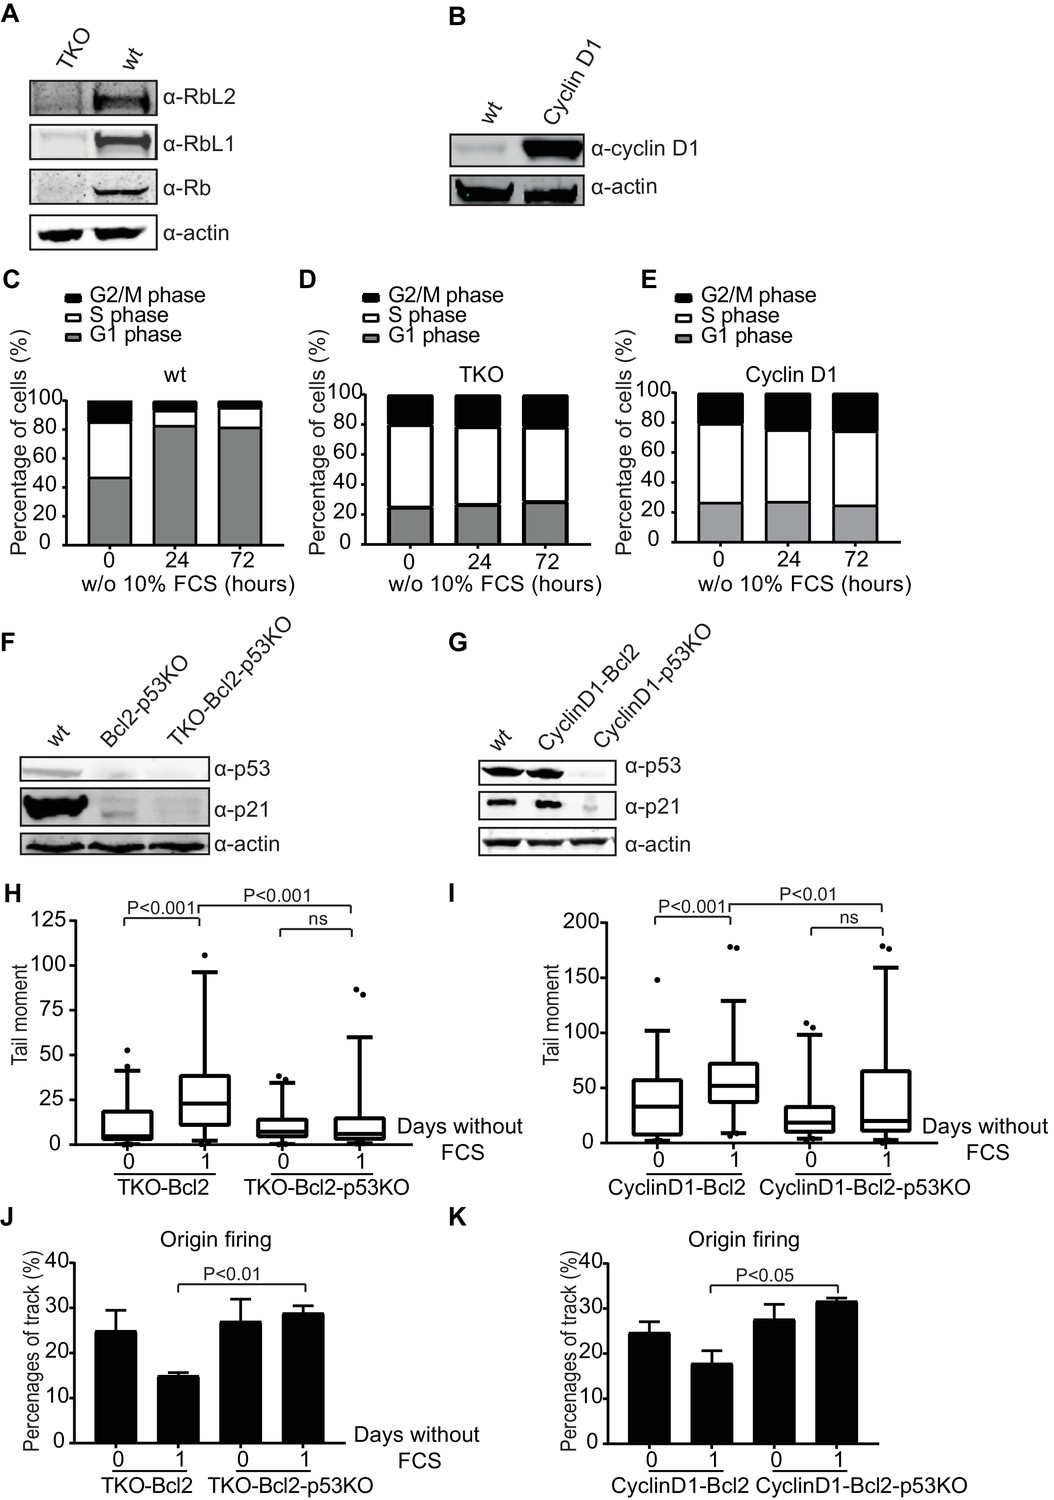
(A) Rb, Rbl1 and Rbl2 protein levels in wt and TKO RPE-1s. Anti-actin was used as a loading control. (B) Cyclin D1 protein levels in wt and CyclinD1 RPE-1s. Anti-actin was used as a loading control. (C, D, E) Cell cycle distribution based on propidium iodide content of wt (C), TKO (D) and CyclinD1 (E) RPE-1s in the absence of 10% FCS for the indicated hours. (F) p53 and p21Cip1 protein levels in wt, Bcl2-p53KO and TKO-Bcl2-p53KO RPE-1s. Anti-actin was used as a loading control. (G) p53 and p21Cip1 protein levels in wt, CyclinD1-Bcl2 and CyclinD1-Bcl2-p53KO RPE-1s. Anti-actin was used as a loading control. (H, I) Tail moments obtained from TKO-Bcl2, TKO-Bcl2-p53KO (H) and CyclinD1-Bcl2 and CyclinD1-Bcl2-p53KO (I) RPE1-s cultured in the presence or absence of 10% FCS (1 day). Box plots represent interquartile ranges, horizontal bars denote the median and points are outliers. For each condition, more than 50 cells were analyzed using the CASP software. Significance is indicated (1-way Anova nonparametric Kruskal-Wallis test). (J, K) Quantification of origin firing in TKO-Bcl2, TKO-Bcl2-p53KO (J) and CyclinD1-Bcl2 and CyclinD1-Bcl2-p53KO (K) RPE1-s cultured in the presence or absence of 10% FCS for 1 day. 1st label and 2nd label origins are shown as percentage of all labelled tracks (from two independent experiments). Significant differences between average values are indicated (Student’s t-test).
Figure 6—figure supplement 1
Response of RPE1 cells to mitogen starvation
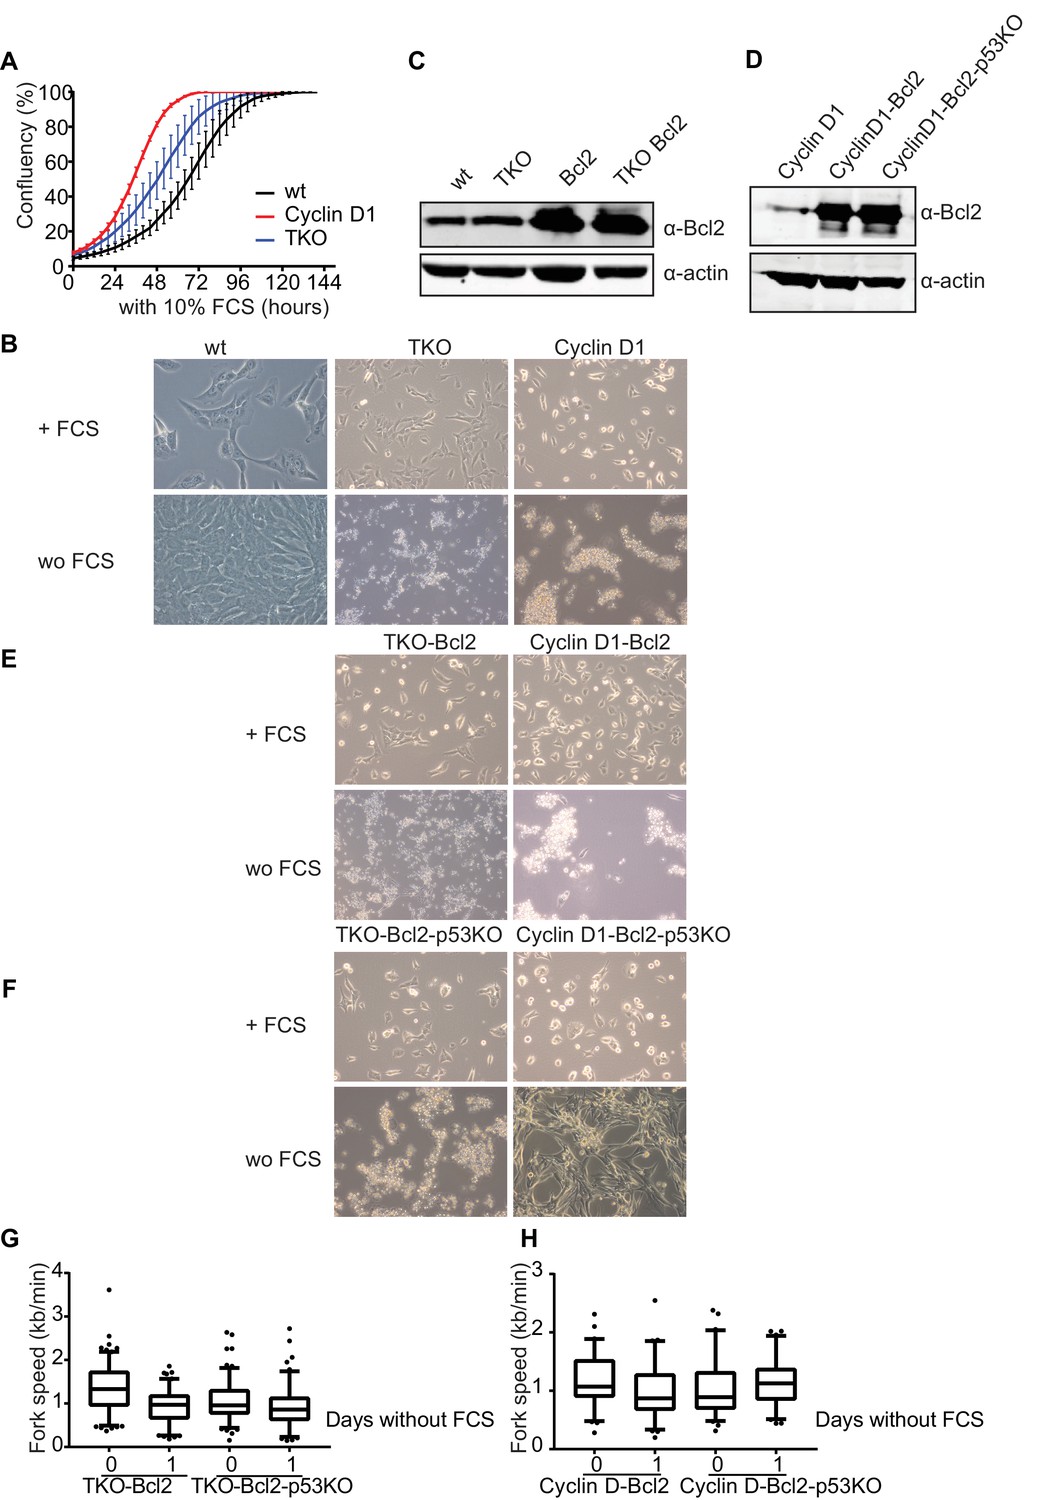
(A) Incucyte growth curves of wt (black), TKO (blue) en CyclinD1 RPE1-s (red) in mitogen proficient conditions. (B) Representative images of wt, TKO and CyclinD1 RPE-s in the presence of FCS and after 4 days of FCS deprivation. (C) Bcl2 protein levels of wt, TKO, wt-Bcl2 and TKO-Bcl2 RPE1-s. Anti-actin was used as loading control. (D) Bcl2 protein levels of CyclinD1, CyclinD1-Bcl2 and CyclinD1-Bcl2-p53KO RPE1-s. Anti-actin was used as loading control. (E) Representative images TKO-Bcl2 and CyclinD1-Bcl2 RPE-s in the presence of 10% FCS and after 4 days of 10% FCS deprivation. (F) Representative images of TKO-Bcl2-p53KO and CyclinD1-Bcl2-p53KO RPE1-s in the presence of FCS and after 4 days of 10% FCS deprivation.
Figure 7
p53 inactivation promotes tumor growth in vivo.
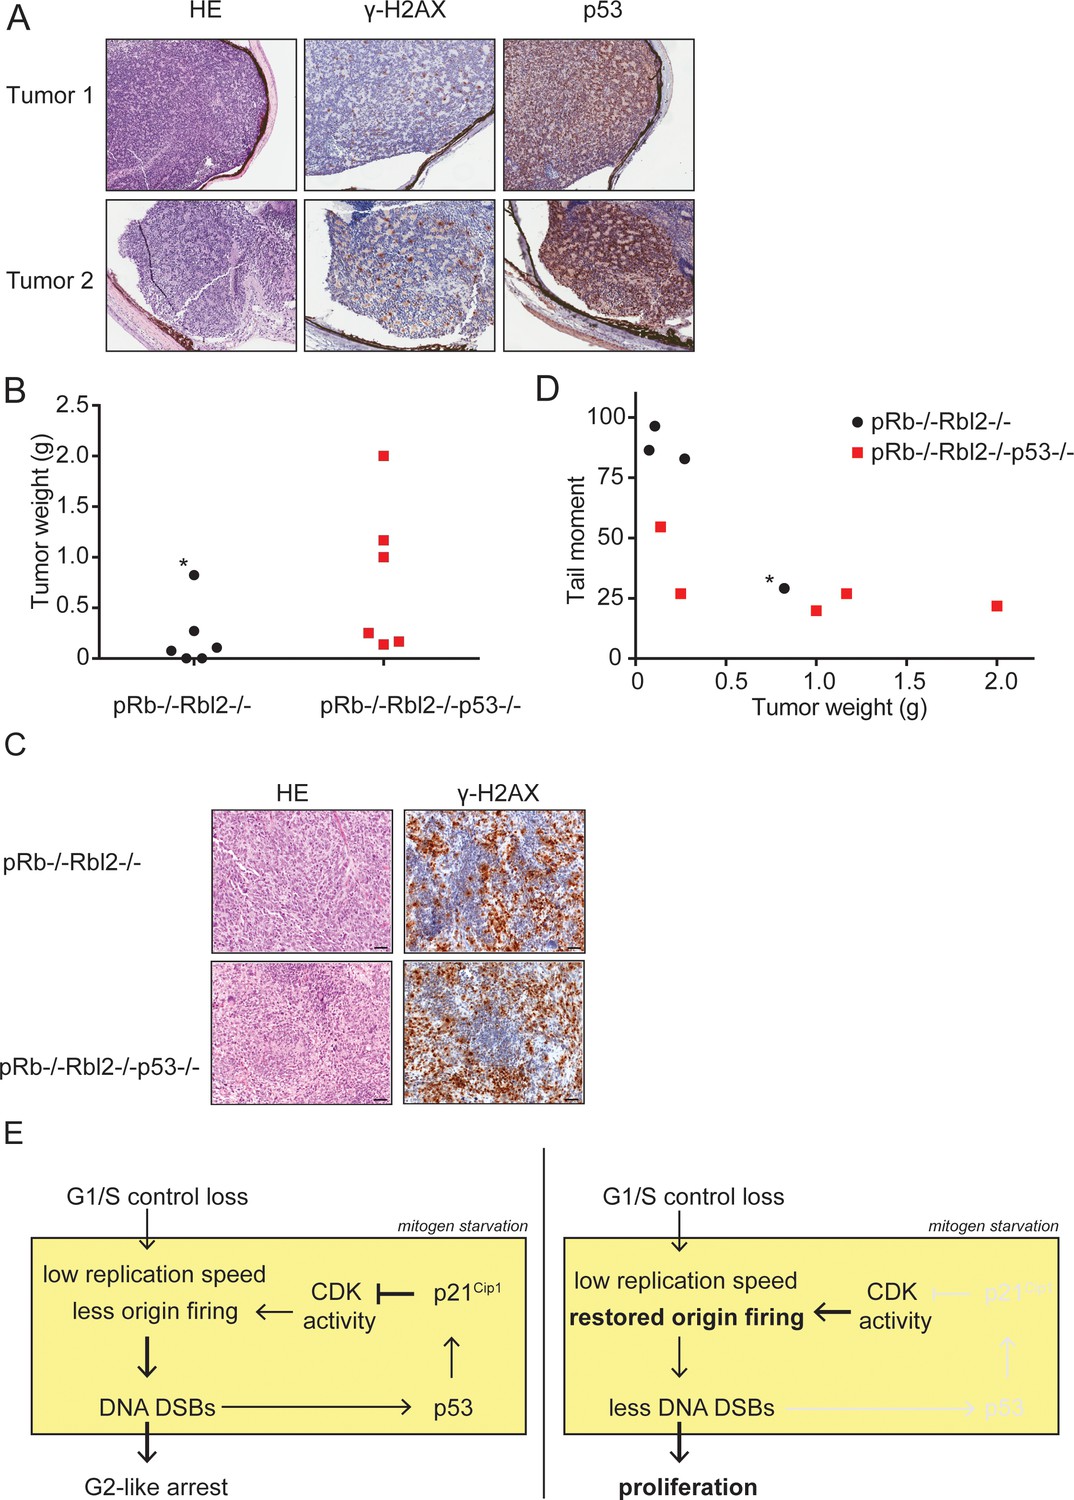
(A) Examples of HE and immunohistochemical stainings for γ-H2AX and p53 of two retinoblastomas from Rb-/-Rbl2-/- chimeric mice. (B) Tumor weight of Rb-/-Rbl2-/- (black) and Rb-/-Rbl2-/-p53-/- (red) teratomas 20 days after injection of ESCs in nude mice. Black dot marked with an asterisk (*) indicates the only tumor with high levels of infiltrating neutrophils. (C) Tail moments of Rb-/-Rbl2-/- (black) and Rb-/-Rbl2-/-p53-/- (red) teratomas plotted against the tumor weight. Spearman’s correlation coefficient between tail moment and tumor weight is −0.78. Black dot marked with an asterisk (*) indicates the only tumor with high levels of infiltrating neutrophils. One Rb-/-Rbl2-/-p53-/- (red) teratoma could not be analyzed for DNA DSBs due to the small tissue size. For each teratoma, more than 50 cells were analyzed using the CASP software. (D) Examples of HE and immunohistochemical staining for γ-H2AX of Rb-/-Rbl2-/- and Rb-/-Rbl2-/-p53-/- teratomas. Scale bar is 50 µm. (E) Schematic model for how p53 inactivation reduces DNA DSBs in mitogen-deprived cells lacking the G1/S checkpoint. Cells that lost the G1/S phase checkpoint suffer from replication stress leading to DNA DSBs. Activation of p53 and p21Cip1 inhibits CDK activity and thereby inhibits the firing of new origins leading to more DNA damage and establishment of the G2-like arrest (left panel). Inactivation of p53 and therefore its downstream protein p21Cip1 increases CDK activity and allows origins to fire. Restored levels of origin firing rescues stalled forks, causing less DNA DSB formation and enabling proliferation (right panel).
Tables
Key resources table
| Reagent type (species) or resource | Designation | Source or reference | Identifiers | Additional information |
|---|---|---|---|---|
| Cell line (mus musculus) male | TKO-Bcl2 mouse embryonic fibroblasts (MEFs) | PMID:16338659 | ||
| Cell line (mus musculus) male | TKO-Bcl2-p53KO MEFs | This paper | N/A | Knockout of p53 in TKO-Bcl2 MEFs, described in the materials and methods |
| Cell line (mus musculus) male | TKO-p53RNAi MEFs | PMID:16338659 | ||
| Cell line (mus musculus) male | TKO-p53KO MEFs | This paper | N/A | Knockout of p53 in TKO MEFs, described in the materials and methods |
| cell line (mus musculus) male | Rb-/-Rbl2-/- mESCs | PMID: 15574596 | ||
| Cell line (mus musculus) male | Rb-/-Rbl2-/-p53-/- mESCs | This paper | Knockout of p53 in Rb-/-Rbl2-/-, described in the materials and methods | |
| Cell line (homo sapiens) female | RPE-1 hTERT | ATCC | Cat# CRL-4000 | RRID:CVCL_4388 |
| Cell line (homo sapiens) female | TKO RPE-1s | This paper | N/A | Knockout of Rb, Rbl1 and Rbl2 in RPE-1-hTERT cells, described in material and methods |
| Cell line (homo sapiens) female | TKO-Bcl2 RPE-1s | This paper | N/A | Knockout of Rb, Rbl1, Rbl2 and overexpression of Bcl2 in RPE-1-hTERT cells, described in material and methods |
| Cell line (homo sapiens) female | TKO-Bcl2-p53KO RPE-1s | This paper | N/A | Knockout of Rb, Rbl1, Rbl2 and TP53 and overexpression of Bcl2 in RPE-1-hTERT cells, described in material and methods |
| Cell line (homo sapiens) female | CyclinD1 RPE-1s | This paper | N/A | Overexpression of non-degradable CyclinD1 (T286A) in RPE-1-hTERT cells, described in material and methods |
| Cell line (homo sapiens) female | CyclinD1-Bcl2 RPE-1s | This paper | N/A | Overexpression of non-degradable CyclinD1 (T286A) and Bcl2 in RPE-1-hTERT cells, described in material and methods |
| Cell line (homo sapiens) female | CyclinD1-Bcl2-p53KO RPE-1s | This paper | N/A | Knockout of TP53 and overexpression of non-degradable CyclinD1 (T286A) and Bcl2 in RPE-1-hTERT cells, described in material and methods |
| Antibody | Brdu (recognizing CldU) | Bioconnect | Cat# OBT0030G Clone BU1/75 | RRID: AB_609567 (1/500) |
| Antibody | BrdU (recognizing IdU) | Becton Dickinson | Cat# 347580 Clone B44 | RRID: AB_10015219 (1/750) |
| Antibody | mouse p53 | Abnova Corporation | Cat# MAB9657 Clone IMX25 | RRID: AB_10756365 (1/1000) |
| Antibody | mouse/ human p21 | Santa Cruz | Cat# sc-397 C19 | RRID: AB_632126 (1/500) |
| Antibody | p27 | BD Transduction Laboratory | Cat# 554069 | RRID: AB_395225 (1/2000) |
| Antibody | CDK4 | Santa Cruz | Cat# sc-260 C22 | RRID: AB_631219 (1/2000) |
| Antibody | Actin | Santa Cruz | Cat# sc-1616 | RRID:AB_630836 (1/1000) |
| Antibody | pChk1 Ser 317 | Bethyl | Cat# A304-673A | RRID: AB_2620868 (1/1000) |
| Antibody | Chk1 | Santa Cruz | Cat# sc-8408 G4 | RRID: AB_627257 (1/1000) |
| Antibody | Rb1 | Santa Cruz | Cat# sc-50 C15 | RRID: AB_632339 (1/500) |
| Antibody | Rbl1 | Santa Cruz | Cat# sc-318 C18 | RRID: AB_2175428 (1/1000) |
| Antibody | Rbl2 | Lab Vision | Cat# OP117 Clone AB1 | RRID: AB_145257 (1/1000) |
| Antibody | Cyclin D1 | Santa Cruz | Cat# sc-753 H296 | RRID: AB_2070433 (1/1000) |
| Antibody | human p53 | BD Bioscience | Cat# 554293 Clone DO-1 | RRID: AB_395348 (1/500) |
| Antibody | Bcl2 | Santa Cruz | Cat# sc-509 | RRID: AB_626733 (1/1000) |
| Chemical compound, drug | 2'-deoxyadenosine monohydrate (dA) | Jena Bioscience | N-DN-1001 | |
| Chemical compound, drug | 2'-deoxycytidine monohydrochloride (dC) | Jena Bioscience | N-DN-6352 | |
| Chemical compound, drug | 2'-deoxyguanosine monohydrate (dG) | Jena Bioscience | N-DN-1003 | |
| Chemical compound, drug | 2'-deoxythymidine (dT) | Jena Bioscience | N-DN-6354 | |
| Chemical compound, drug | Cell Player 96-well kinetic caspase-3/7 reagent | Essen Bioscience | Cat# 4440 | |
| Chemical compound, drug | CldU | Sigma | Cat# C6891-100mg | |
| Chemical compound, drug | IdU | Sigma | Cat# I7125-5g | |
| Chemical compound, drug | BrdU | Sigma | Cat# B5002-1G | |
| Chemical compound, drug | Hydroxyurea (HU) | Sigma | Cat# H8627 | |
| Chemical compound, drug | Propidium Iodide (PI) | Thermo fisher scientific | Cat# P3566 | |
| Chemical compound, drug | Puromycin | Sigma | Cat# P7255 | |
| Chemical compound, drug | Penincillin/ Streptomycin | Gibco/Life technologies | Cat# 15140122 | |
| Chemical compound, drug | Lipofectamine 2000 | Invitrogen | Cat# 11668030 | |
| Chemical compound, drug | Polybrene | Sigma | Cat# H9268 | |
| Chemical compound, drug | Fluor-gel with TES buffer | Electron Microscopy Science | Cat# 17985–30 | |
| Software, algorithm | GraphPad Prism 7 | GraphPad Software | https://www.graphpad.com/scientific-software/prism/ | |
| Software, algorithm | Adobe Photoshop CS6 | Adobe | https://www.adobe.com/products/photoshop.html | |
| Software, algorithm | Adobe Illustrator CS6 | Adobe | https://www.adobe.com/products/illustrator.html | |
| Software, algorithm | Image Studio Lite Ver. 4.0 | LI-COR Biosciences | https://www.licor.com/bio/products/software/image_studio_lite/ | |
| Software, algorithm | ImageJ | https://imagej.nih.gov/ij/download.html | ||
| Software, algorithm | FlowJo software version 7.6.1 | FlowJo, LCC | https://www.flowjo.com/solutions/flowjo/downloads | |
| Software, algorithm | Casplab | Casplab | http://casplab.com/download |
Additional files
-
Transparent reporting form
- https://doi.org/10.7554/eLife.37868.015
Download links
A two-part list of links to download the article, or parts of the article, in various formats.
Downloads (link to download the article as PDF)
Open citations (links to open the citations from this article in various online reference manager services)
Cite this article (links to download the citations from this article in formats compatible with various reference manager tools)
Loss of p53 suppresses replication-stress-induced DNA breakage in G1/S checkpoint deficient cells
eLife 7:e37868.
https://doi.org/10.7554/eLife.37868


