DET1-mediated degradation of a SAGA-like deubiquitination module controls H2Bub homeostasis
- Centro Nacional de Biotecnología, CNB-CSIC, Spain
- Ecole normale supérieure, CNRS, INSERM, Université PSL, France
- Université Paris-Sud, France
- Institut Curie PSL Research University, France
- Ghent University, Belgium
- VIB Center for Plant Systems Biology, Belgium
- VIB Center for Medical Biotechnology, Belgium
- Université Grenoble Alpes, Institut de Biologie Structurale, France
Figures
Figure 1 with 1 supplement
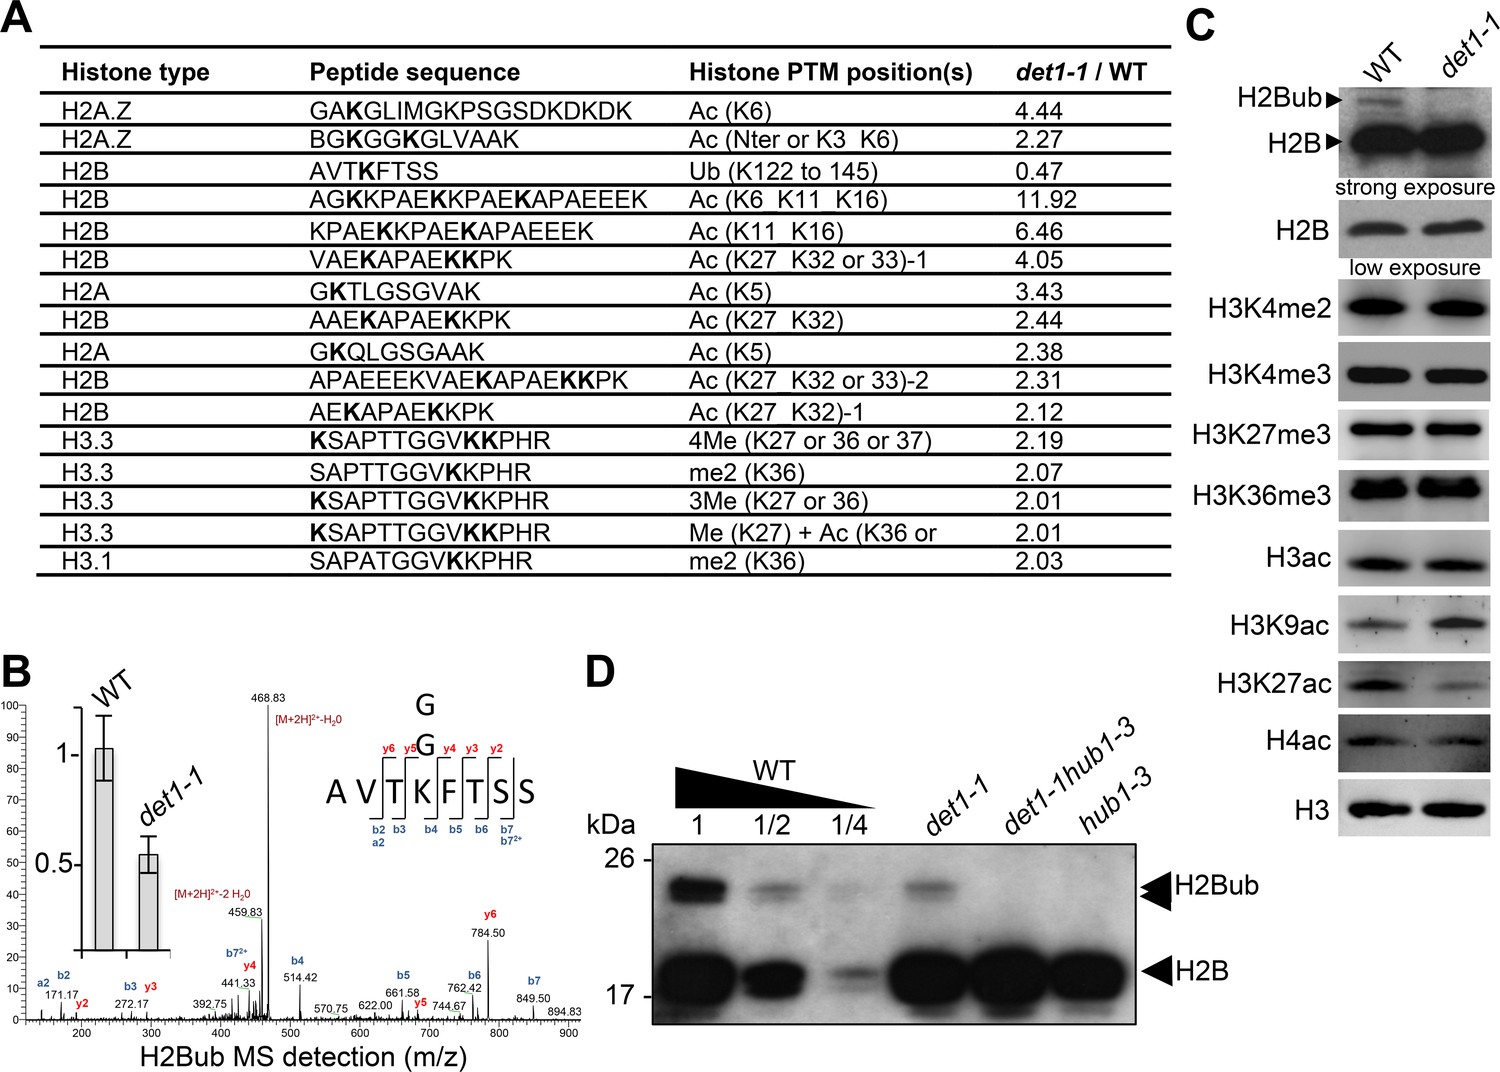
DET1 loss-of-function triggers a massive reduction of H2Bub.
(A) Mass spectrometry detection of differentially modified histones using non-modified histone peptides as internal references. Differentially modified residues are shown in bold. Several candidate residues are bolded when the precise position of the differentially modified residue could not be determined. Only significantly modified peptides from 3 biological replicates are shown (p-Val <0.001;>2 fold change). Histone isoforms were annotated according to Talbert et al. (2012). Ac, acetylation; Ub, ubiquitination; Me, methylation; xMe: x methylations on a unique or distinct residues; me1, monomethylation; me2, dimethylation; me3, trimethylation. (B) Representative MS/MS spectra of histone H2B monoubiquitination at a the conserved lysine residue in the AVTKubFTSS peptide known to be monoubiquitinated in plants (Bergmüller et al., 2007; Sridhar et al., 2007). The fragmentation spectrum is derived from a trypsin-digested position matching the HTB1/2/3/4/6/7/9/10/11 isoforms. The ubiquitinated peptide sequence and observed ions are indicated on top of spectra. Singly and doubly charged a, b and y ions, as well as ions corresponding to neutral losses of water and NH3 groups; M, parent ion mass are shown. The inset shows the relative abundance of the monoubiquitinated AVTKFTSS peptide in wild-type (arbitrarily set to 1) and det1-1 mutant plants. Intensity is calculated as the normalized average integrated MS peak area of the modified peptide from three independent biological replicates for each plant line. Data are represented as mean with 5% confidence interval. More details are given in the Experimental Procedures. (C) Immunoblot analysis of chromatin extracts from wild-type and det1-1 seedlings performed with the indicated antibodies. (D) Immunoblot analysis of H2Bub in det1-1 mutant seedlings, performed as in (C). Identity of the H2Bub band is confirmed by co-migration of hub1-3 mutant chromatin extracts. In (C–D), the anti-H2B antibody allows detecting simultaneously core histone H2B (18 kDa) and monoubiquitinated (~24 kDa) H2B forms.
-
Figure 1—source data 1
Detailed identification of differentially modified histone peptides in wild-type and det1-1 samples.
- https://doi.org/10.7554/eLife.37892.004
Figure 1—figure supplement 1
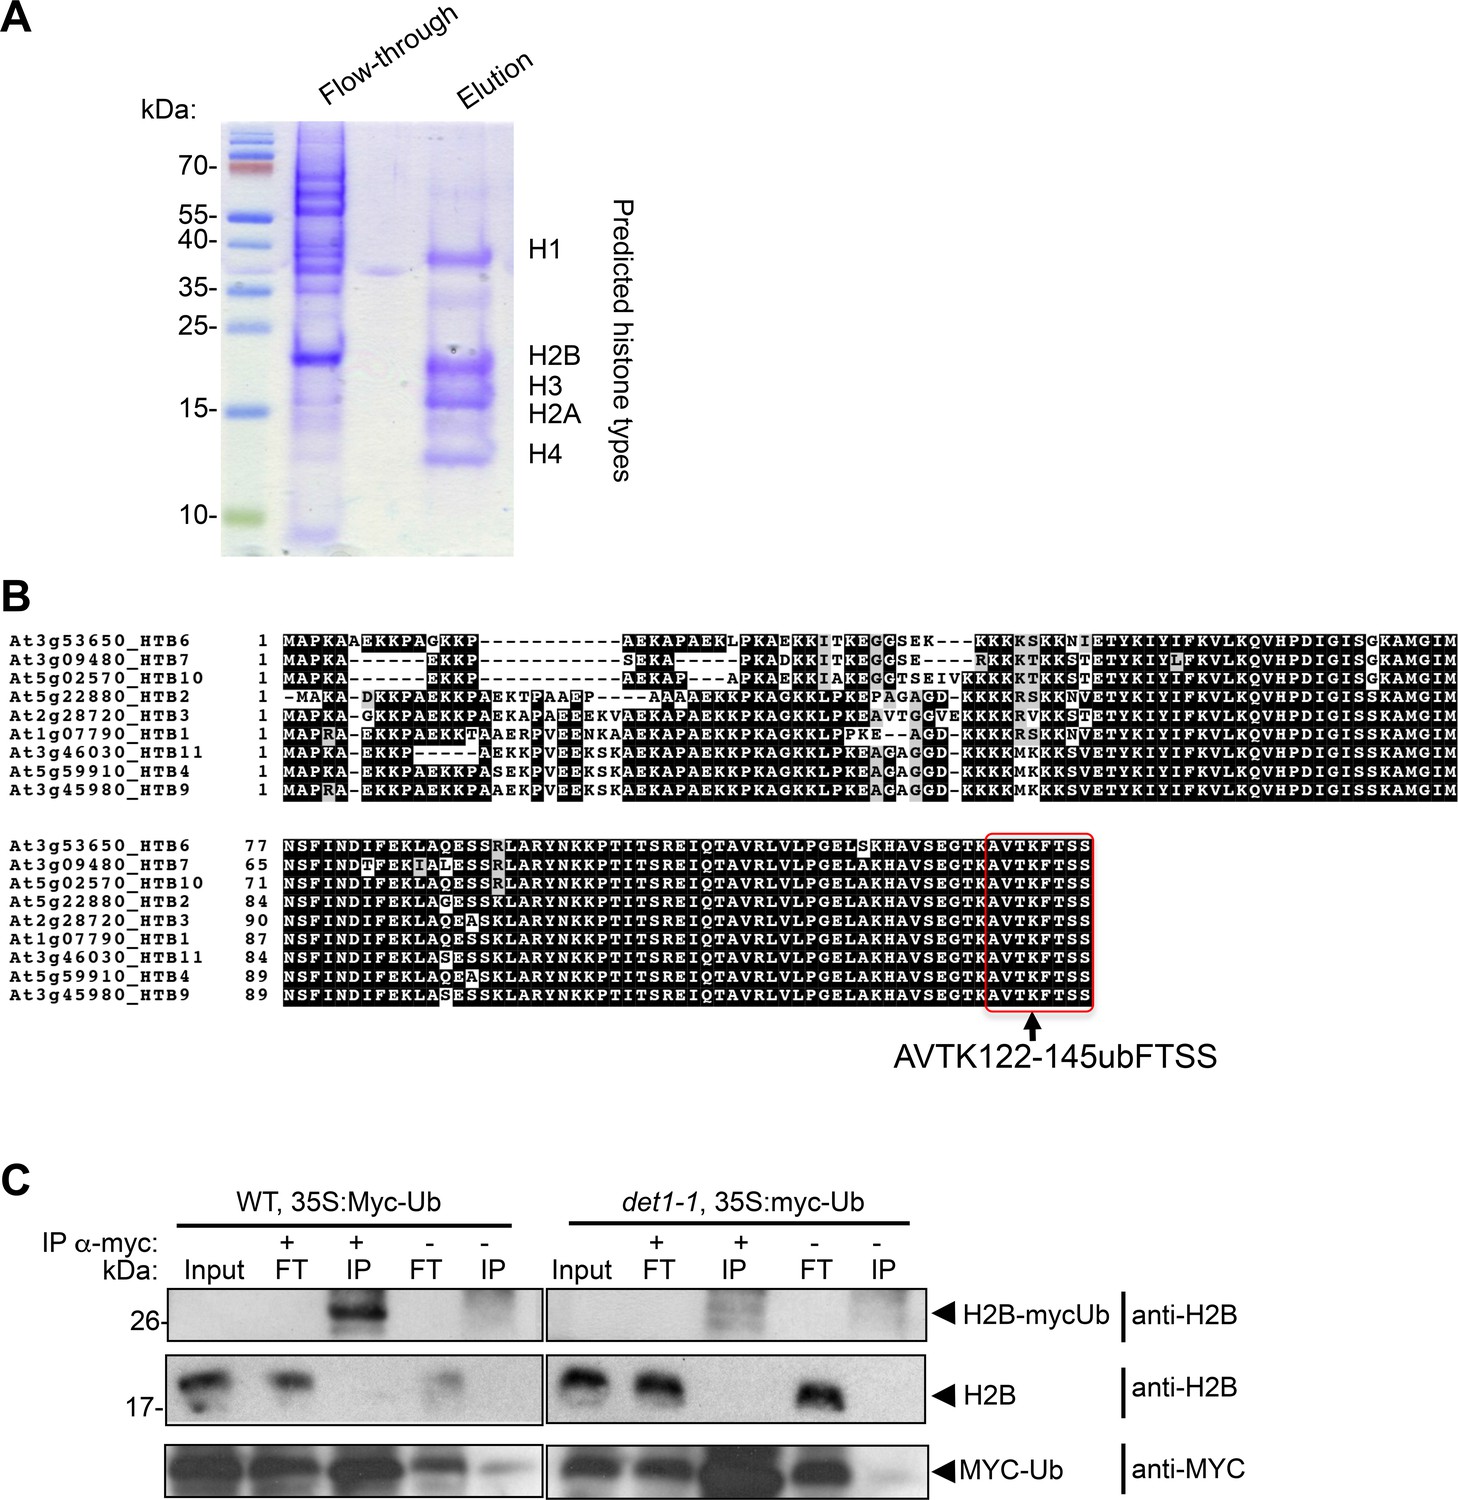
Mass spectrometry analysis of histone PTM defects in det1-1 mutant plants.
(A) SDS-PAGE and Coomassie brilliant blue staining control of histones purified from wild-type seedlings. The blots presents a typical purification in which histones are released upon elution from the Histone Purification Mini kit columns (Active Motif) as described in the Methods and Materials section, whereas most other nuclear proteins flow through the column. Prediction of the corresponding histone types on the blot was performed based on their migration in a LiDS-based SDS-PAGE. (B) Position of the monoubiquitinated H2B lysine detected in MS analyses in AVTKubFTSS peptides. This conserved position was previously found to be ubiquitinated in Arabidopsis (Bergmüller et al., 2007; Sridhar et al., 2007). Identity of this post-translational modification was unambiguously determined by substituting iodoacetamide with chloroacetamide in order to avoid any artefactual assignment (see Supplementary Methods). (C) Immuno-purification of MYC-ubiquitin tagged proteins demonstrates low levels of H2Bub in det1-1 plant extracts. Whole-seedling extracts prepared from the indicated genotypes were used to perform an anti-MYC immunopurification of ubiquitinated proteins before immmunoblot analysis with the indicated antibodies. A 35S::MYC-ubiquitin transgene was first introgressed in a wild-type plant and crossed in a det1-1 background to ensure similar positioning and expression of the transgene (see Methods and materials).
Figure 2 with 1 supplement
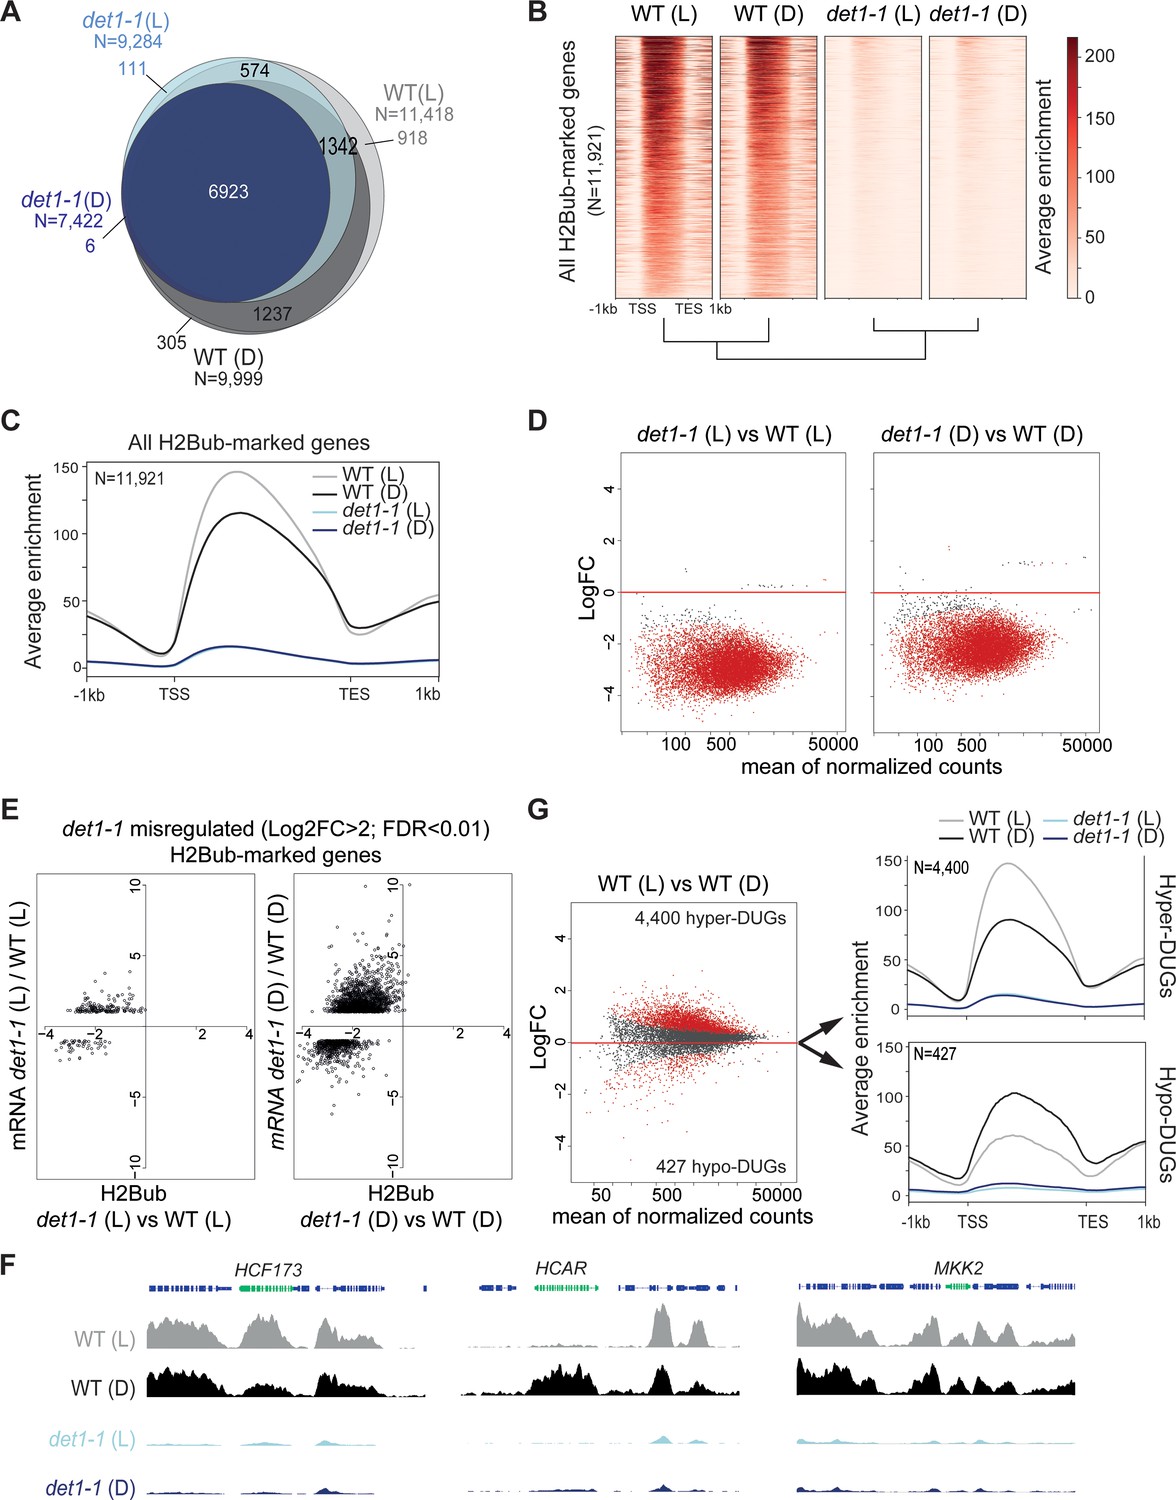
Light and DET1 massively influence H2Bub enrichment over protein-coding genes.
(A) Number of H2Bub-marked genes in 5-day-old wild-type (WT) and det1-1 seedlings grown under light (L) or dark (D) conditions. A gene was considered as being marked when overlapping a H2Bub peak in each of the two biological replicates. (B) Heatmap showing dramatically low H2Bub levels over H2Bub-marked genes in det1-1 seedlings. Genes are ranked from top to down according to H2Bub level in the WT (L) sample. (C) Metagene plot of H2Bub distribution over the coding regions of the 11,921 H2Bub-marked genes in the four sample types. (D) Identification of differentially ubiquitinated genes (DUGs) by Rx-normalized DESeq2 analysis (FDR < 0.01) shows that det1-1 mutation triggers low H2Bub levels over almost all genes. Dots represent the full set of genes displaying a H2Bub domain (according to MACS2 peak detection, see Materials and methods) in at least one sample type. Red dots correspond to differentially ubiquitinated genes (DUGs; FDR < 0.01). (E) In both dark and light conditions, massive misregulation of gene expression occurred in a globally hypo-ubiquitinated H2B landscape in det1-1 plants. Scatter plots show the correspondence between H2Bub and gene expression changes between WT and det1-1 plants on det1-1 misregulated genes in light (left) and dark (right) conditions. The x-axis shows Log2 fold-changes (FC) of H2Bub levels as determined by Rx-normalized DESeq2 analysis (FDR < 0.01). The y-axis shows expression Log2 fold changes of as determined by DESeq2 (>2 fold variation, FDR < 0.01). Only genes bearing a significant H2Bub domain according to MACS2 peak detection are shown. (F) Genome-browser snapshots showing H2Bub profiles in WT and det1-1 seedlings grown in light or dark conditions. MAP KINASE KINASE 2 (MKK2) is invariably expressed and marked by H2Bub under dark and light conditions. HIGH CHLOROPHYLL FLUORESCENCE (HCF173) is a hyper-DUG (Log2FC = 1.3) induced by light (Log2FC = 3.7) that was previously shown to require HUB activity for optimal inducibility by light (Bourbousse et al., 2012). In contrast, 7-HYDROXYMETHYL CHLOROPHYLL A (HCAR) is a hypo-DUG (Log2FC = −3.4) repressed by light (Log2FC = −0.7). (G) Similar analyses as in (C) and (D) showing a tendency towards higher H2Bub enrichment in light than in dark condition in wild-type plants. The 4400 hyper-DUGs and 427 hypo-DUGs in WT (L) versus WT (D) samples and their corresponding H2Bub meta-profile are shown. In (C) to (G) H2Bub levels were scaled according to ChIP-Rx normalization factors calculated for each sample type to adjust for quantitative IP/Input variations in H2Bub enrichment over the genome. In all analyses, each sample type is the mean of two independent biological replicates.
-
Figure 2—source data 1
Gene lists summarizing ChIP-Rx analysis of H2Bub levels in WT and det1-1 seedlings grown under dark or light conditions.
- https://doi.org/10.7554/eLife.37892.007
-
Figure 2—source data 2
RNA-seq identification of genes differentially expressed in WT, det1-1, ubp22-1 and det1-1ubp22-1 mutant lines grown under dark or light conditions using DESeq2.
- https://doi.org/10.7554/eLife.37892.008
-
Figure 2—source code 1
ChIP differential analyses.
- https://doi.org/10.7554/eLife.37892.009
-
Figure 2—source code 2
RNA-seq differential analyses.
- https://doi.org/10.7554/eLife.37892.010
Figure 2—figure supplement 1
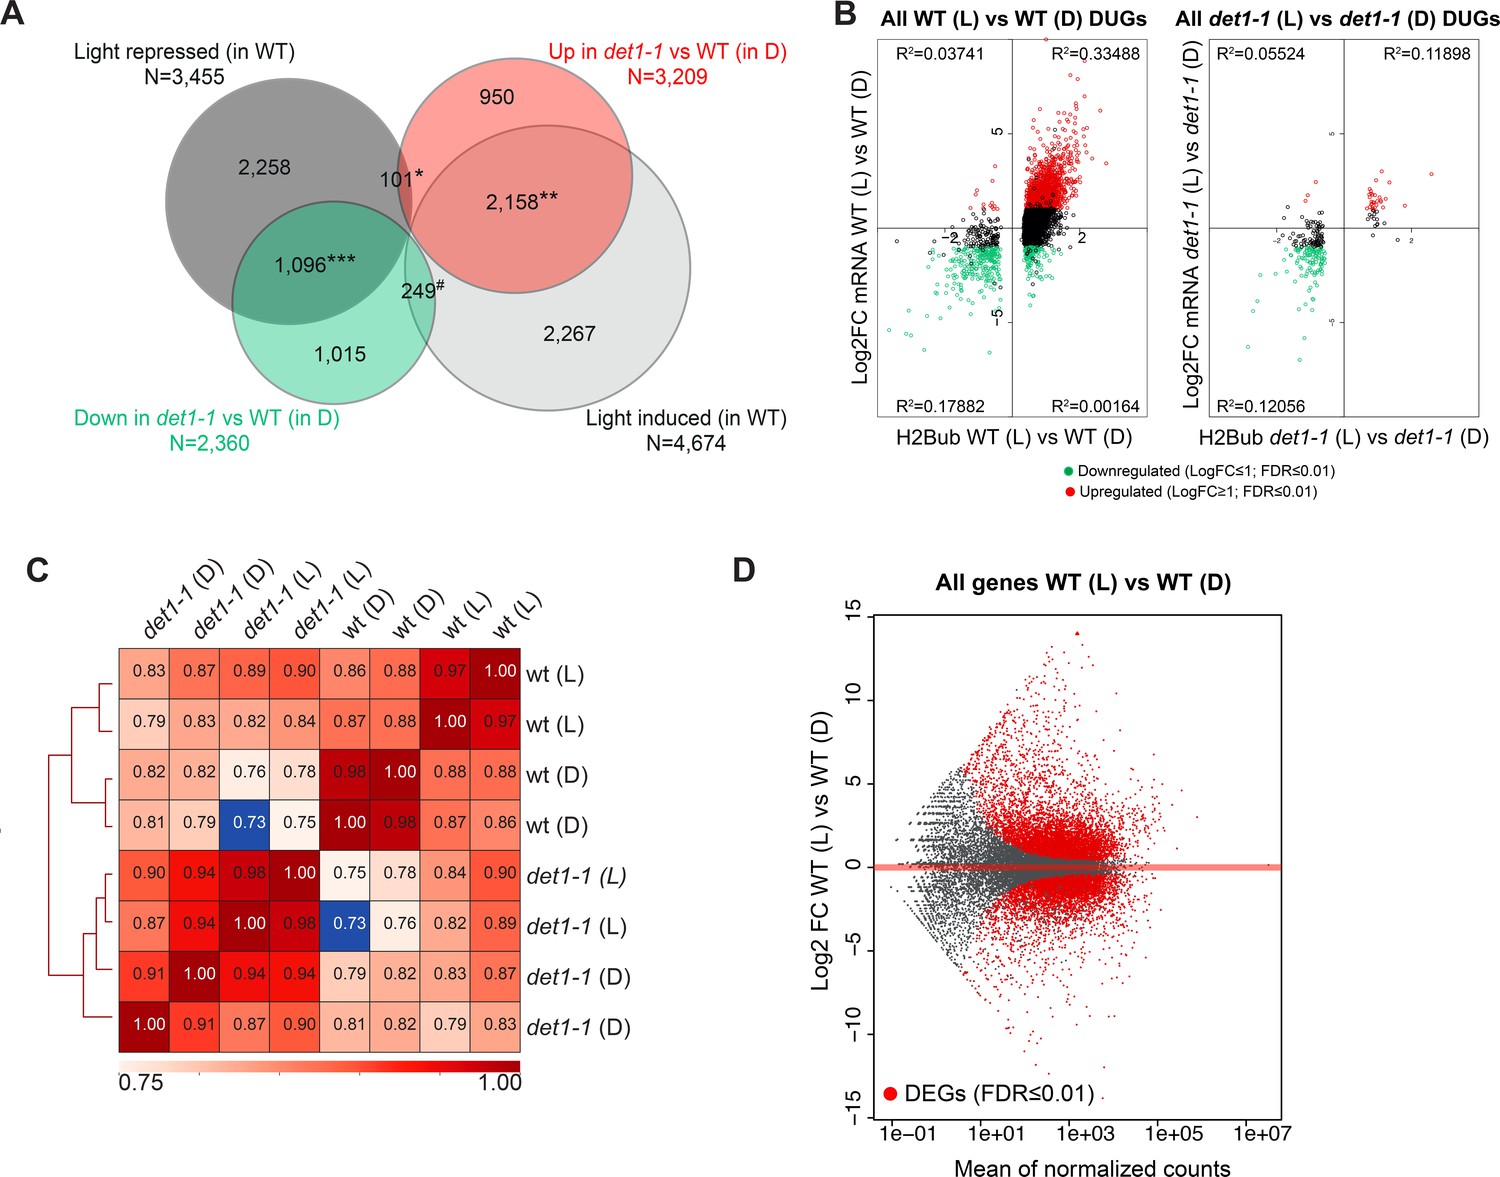
Light and DET1 massively influence H2Bub enrichment over protein-coding genes.
(A) The det1-1 mutation has a broad effect on gene expression and largely mimics the effect of light on the transcriptome of dark-grown seedlings. The majority of changes in gene expression induced by light exposure of the WT no longer occurred in det1-1 plants, often because of their constitutive expression in darkness in det1-1 seedlings. Venn diagrams represent 2-fold misregulated genes in the indicated samples (FDR < 0.01). *Representation factor: 0.3 (p-Val < 9.171e-81); **Representation factor: 4.1 (p-Val < 0.0e + 00); ***Representation factor: 3.8 (p-Val < 0.0e + 00); #Representation factor: 0.6 (p-Val < 2.254e-17). (B) Small variations in H2Bub levels correlating with gene expression can still be detected in det1-1 plants. The scatter-plot represents H2Bub and transcript level variations of DUGs in light (L) compared to dark (D) conditions in WT and det1-1 plants. The x-axis shows Log2 fold-changes (FC) of H2Bub levels as determined by DESeq2 analysis upon scaling according to ChIP-Rx normalization factors (FDR < 0.01). The y-axis shows Log2 FC of transcript levels as determined by DESeq2. Red and green colored dots represent the up- and down-regulated genes, respectively, between light and dark conditions (Log2 FC > 1, FDR < 0.01). Only expressed genes bearing a significant H2Bub domain according to MACS2 peak detection are shown. (C) Correlation analysis of read counts in all replicates confirmed a dual effect of both light and det1-1 mutation on global H2Bub dynamics. The heatmap represents Spearman correlations in read counts over all positions of the genome for each ChIP-seq replicate that was computed using Multibigwig Summary and plotCorrelation from deepTools. The analysis shows diverging distributions between WT and det1-1 genotypes, as well as a sub-partitioning of WT samples according to the light condition. (D) Differential analysis of transcript levels between dark- and light-grown wild-type seedlings showed similar amplitude of up- and downregulation. MA-plot representation of expressed genes in the two conditions that allows visualizing differentially (DEGs; FDR < 0.01; red dots).
Figure 3 with 1 supplement
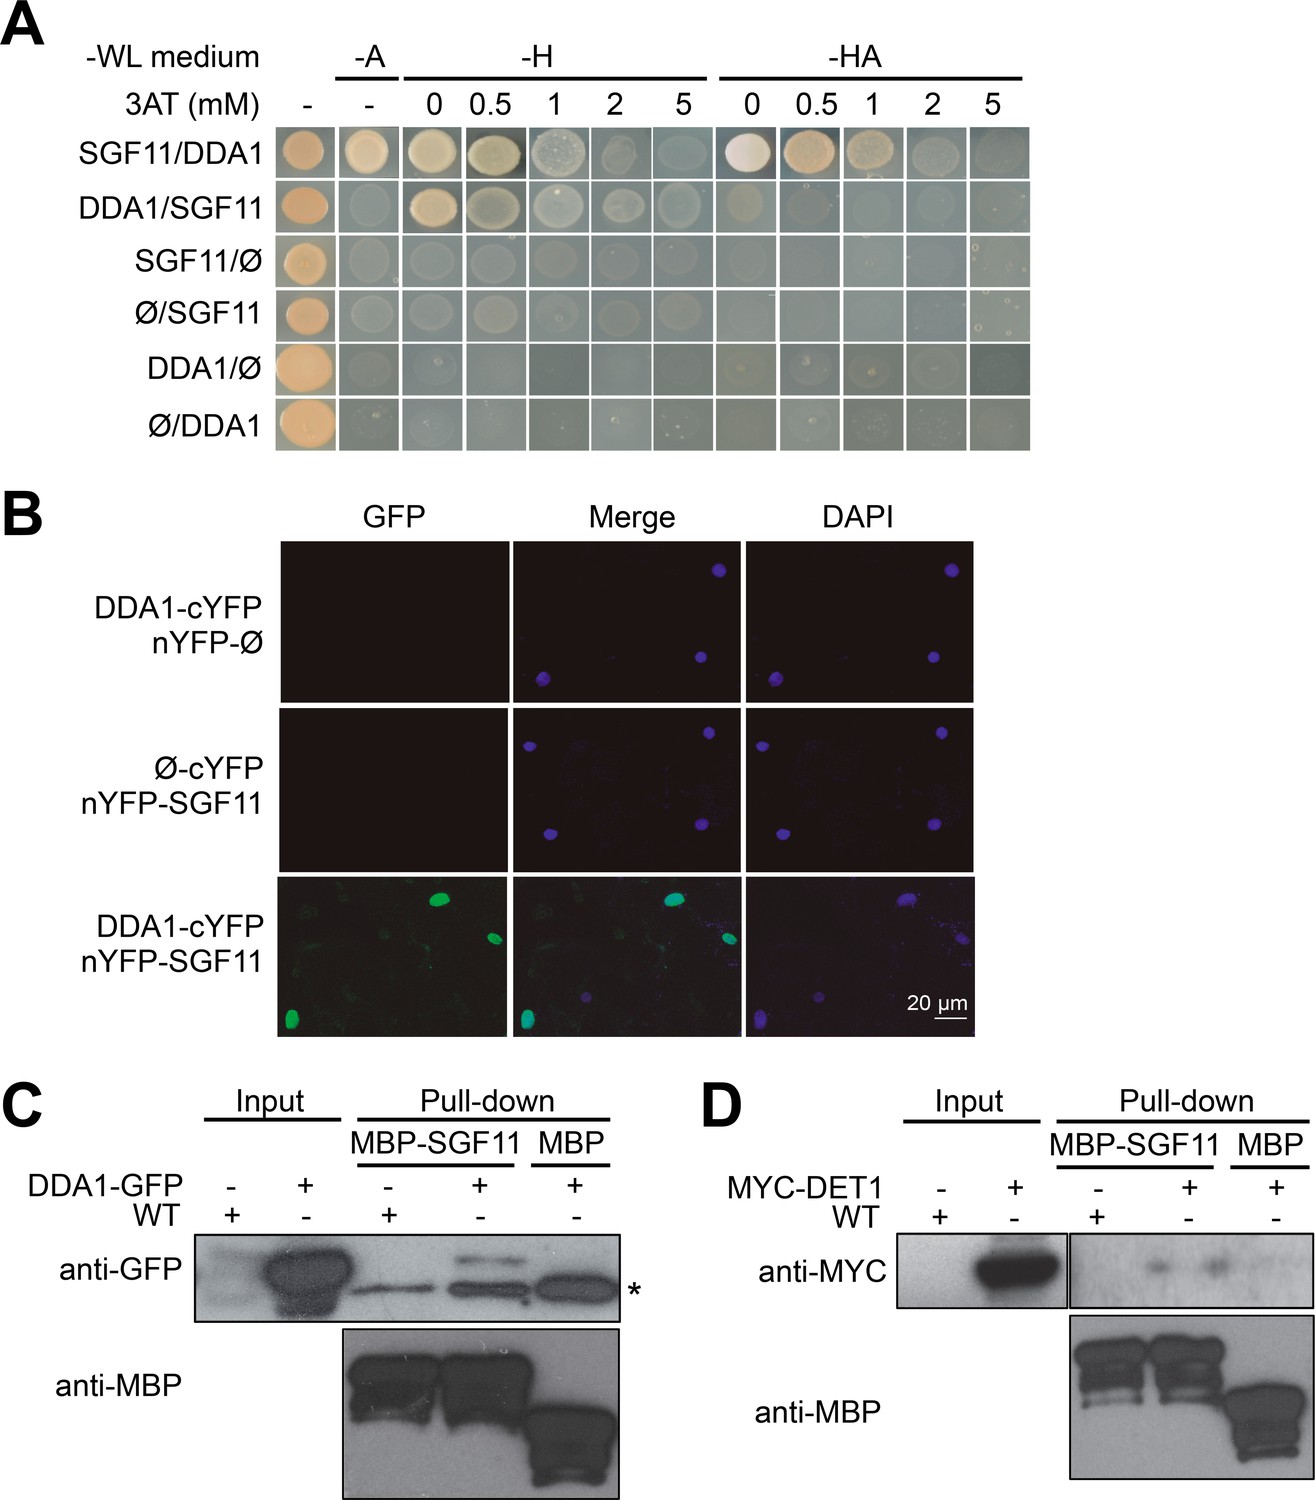
DDA1 C3D subunit physically associates with SGF11.
(A) Yeast-two-hybrid validation of DDA1-SFG11 interaction identified by Y2H screen. (B) BiFC analysis of DDA1 physical interaction with SGF11 in planta. Live fluorescence imaging 72 hr after dual transfection of Nicotiana leaves by plasmids expressing the indicated translational fusions. Merged images of GFP (left) and DAPI (right) channels are shown (middle). (C–D) DDA1 and DET1 associate with the SGF11 in plant extracts. Pull-down assays were performed using total protein extracts prepared from 7-d-old seedlings expressing DDA1-GFP (C) or MYC-DET1 (D) protein fusions with MBP-SGF11. Protein extracts (Input; 2% of the total amount used) and pull-down proteins were subjected to immunoblot analysis with anti-GFP, anti-MYC and anti-MBP to detect the corresponding fusion proteins. In (C), an asterisk indicates the position of an anti-GFP cross-reacting signal.
Figure 3—figure supplement 1
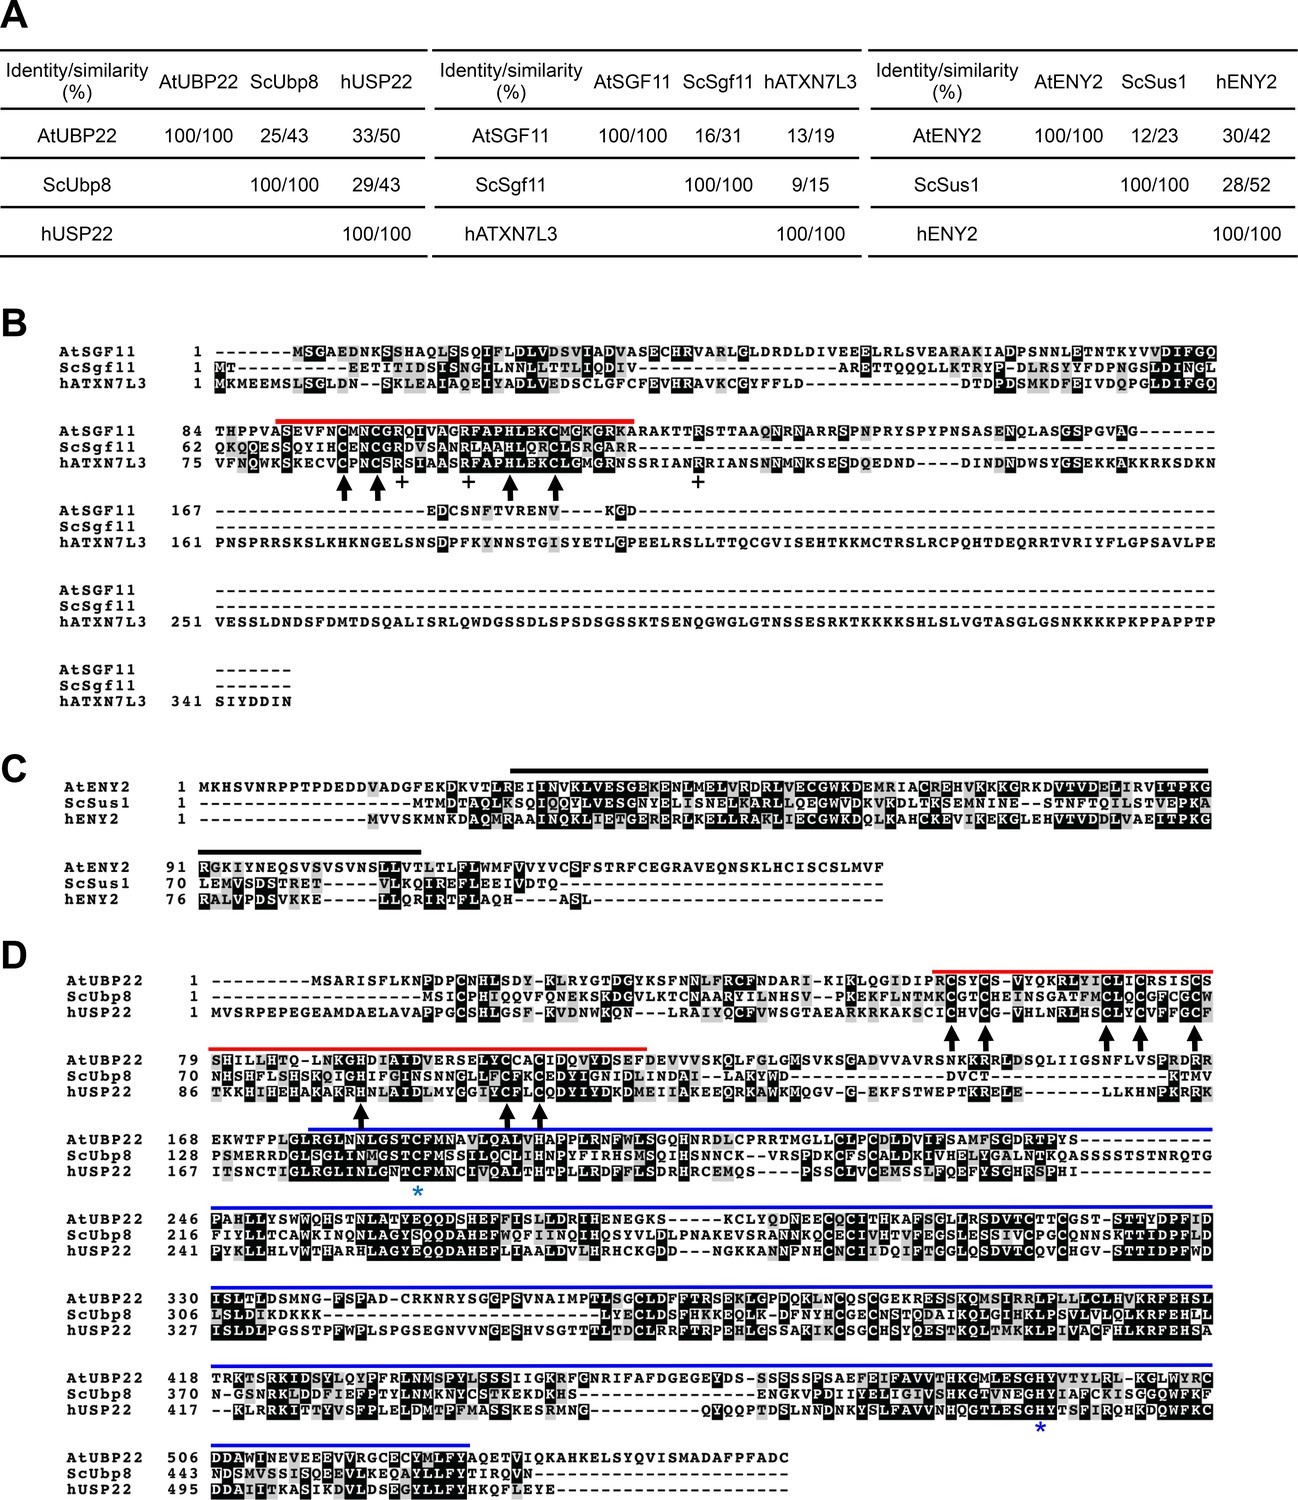
Amino-acid sequence alignments of Arabidopsis, S.cerevisiae and human SGF11, ENY2/SUS and UBP22/Ubp8/USP22 proteins.
(A) Identity and similarity matrix between each protein obtained after EMBOSS Needle using Needleman-Wunsch alignment algorithm (Li et al., 2015). (B–D) Clustal Omega protein sequence alignments colored with Boxshade. Identical and similar residues are given a black or grey background, respectively. Red lines, ZN-finger domains. Blue line, UBP domain. Black lines, ENY2-like domain. Black arrows, conserved ZN-finger residues. Blue stars, conserved catalytic UBP residues. AtUBP22 is At5g10790; AtSGF11 is AT5G58575; AtENY2 is AT3G27100.
Figure 4 with 2 supplements
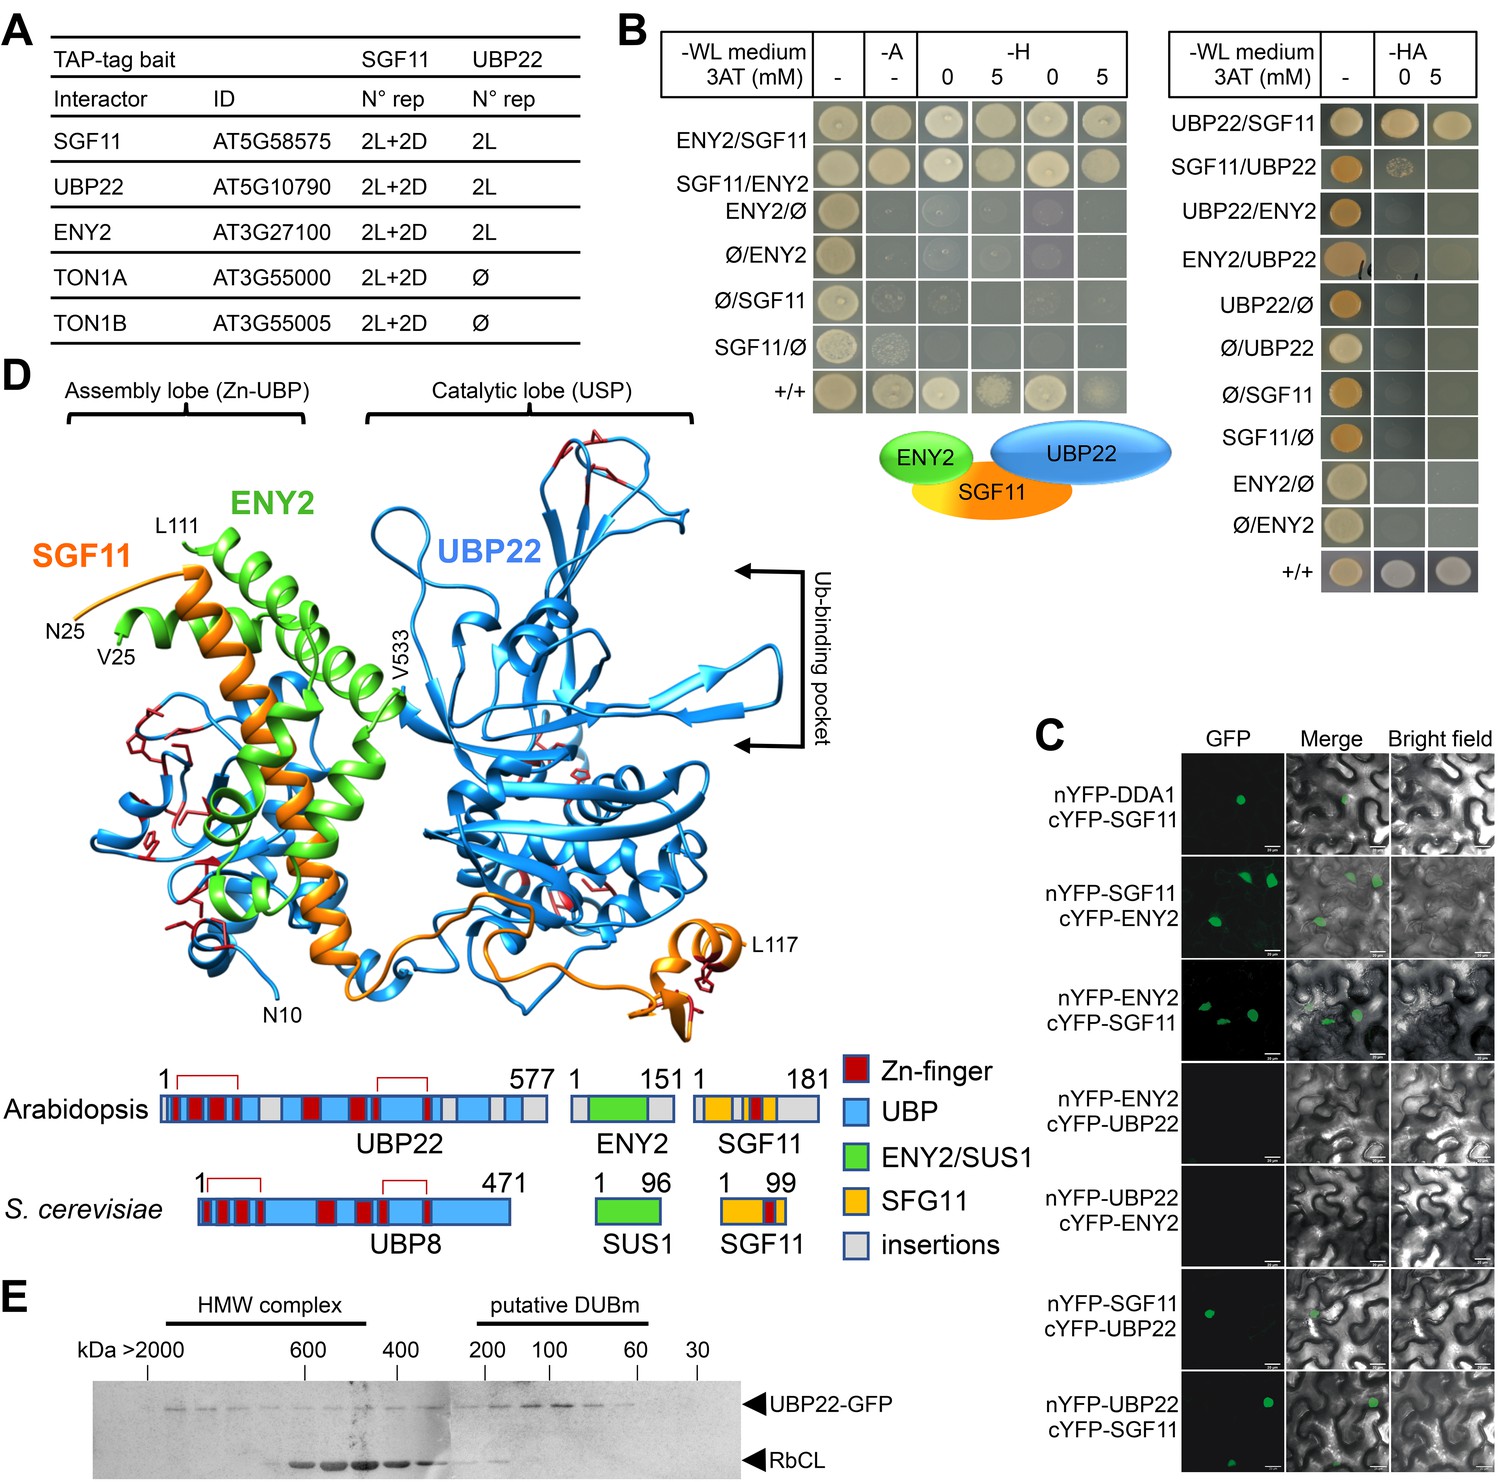
SGF11 physically associates with ENY2 and UBP22 to form an Ubp8-like DUBm.
(A). TAP identification of UBP22 and ENY2 as SGF11-associated proteins. The table summarizes the whole set of detected proteins in each assay, including two independent replicates of dark (D) or light (L) grown cells using SGF11 as bait, and two independent biological replicates of light-grown cells when using UBP22 as a bait. (B) Yeast two-hybrid analysis of physical association between SGF11, UBP22 and ENY2 showing dual association of SGF11 with the two other DUBm components. (C) BiFC analysis of SGF11 interaction with UBP22 and ENY2 in planta. Merged images of GFP (left) and bright field (right) channels are shown (middle). Ø, empty vector. (D) Top, modeled structure of the Arabidopsis UBP22-SGF11-ENY2 complex. Bottom, representation of domain similarities in the Arabidopsis and S. cerevisiae proteins (colored as indicated, gray areas reveal insertions that could not be modeled). The position of predicted Zn-finger domains in UBP22 and SGF11 is indicated in dark red in both panels. Red brackets above the schematized sequences link domains involved in the same Zn-finger. (E) Size-exclusion chromatography analysis of UBP22-GFP complex size in protein extracts from UBP22::UBP22-GFP Arabidopsis seedlings. Fractions were analyzed by anti-GFP immunoblot. Highly abundant Ribulose bisphosphate carboxylase Large Chain (RbCL) bands were also non-specifically detected. The size of molecular-weight standard eluted in the same conditions is shown.
-
Figure 4—source data 1
Detailed TAP protein identification.
- https://doi.org/10.7554/eLife.37892.016
-
Figure 4—source data 2
pdb of the modeled At-UBP-ENY2-SGF11 complex structure.
- https://doi.org/10.7554/eLife.37892.017
Figure 4—figure supplement 1
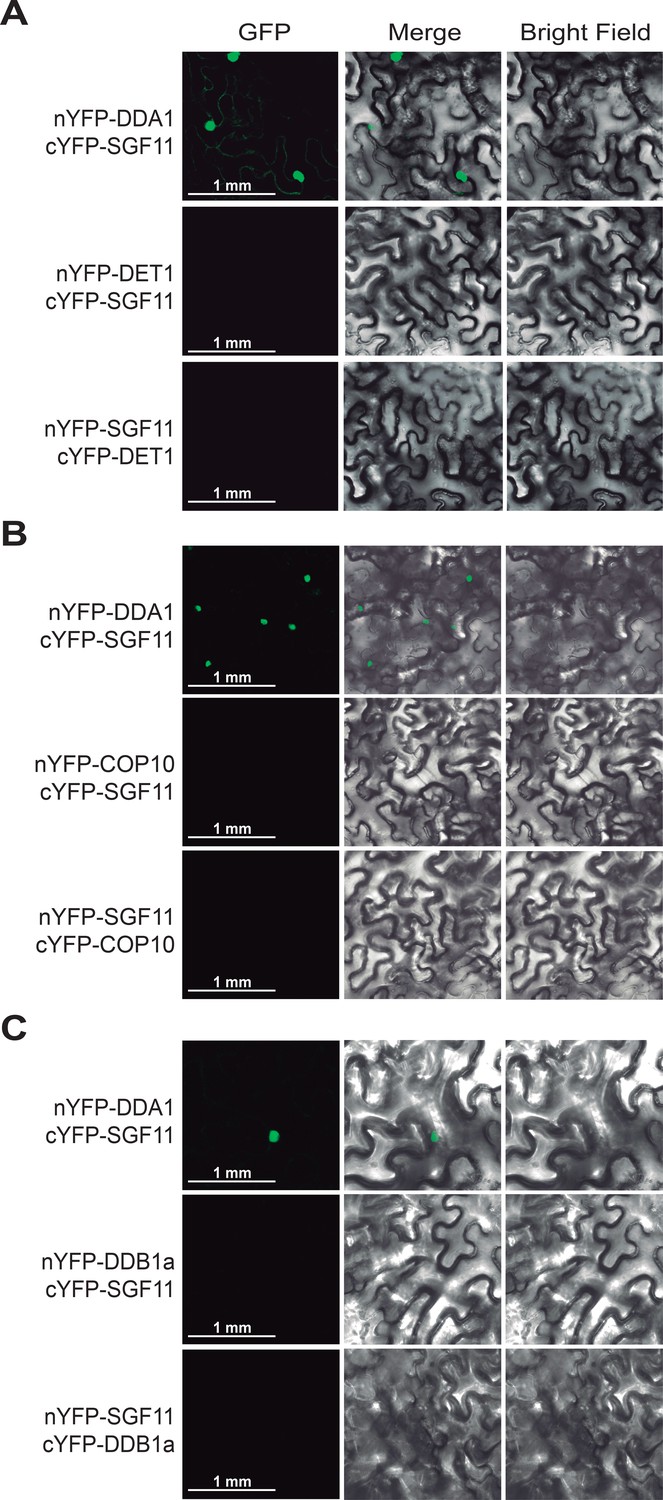
SGF11 in vivo association with the C3D complex occurs through direct interaction with DDA1.
BiFC analysis of protein-protein interactions between SGF11 and the C3D protein component DET1 (A), COP10 (B) and DDB1a (C). Live fluorescence imaging of Nicotiana leaves was performed 72 hr after dual transfection of plasmids expressing the indicated translational fusions. Merged images of GFP (left) and bright field (right) channels are shown (middle).
Figure 4—figure supplement 2
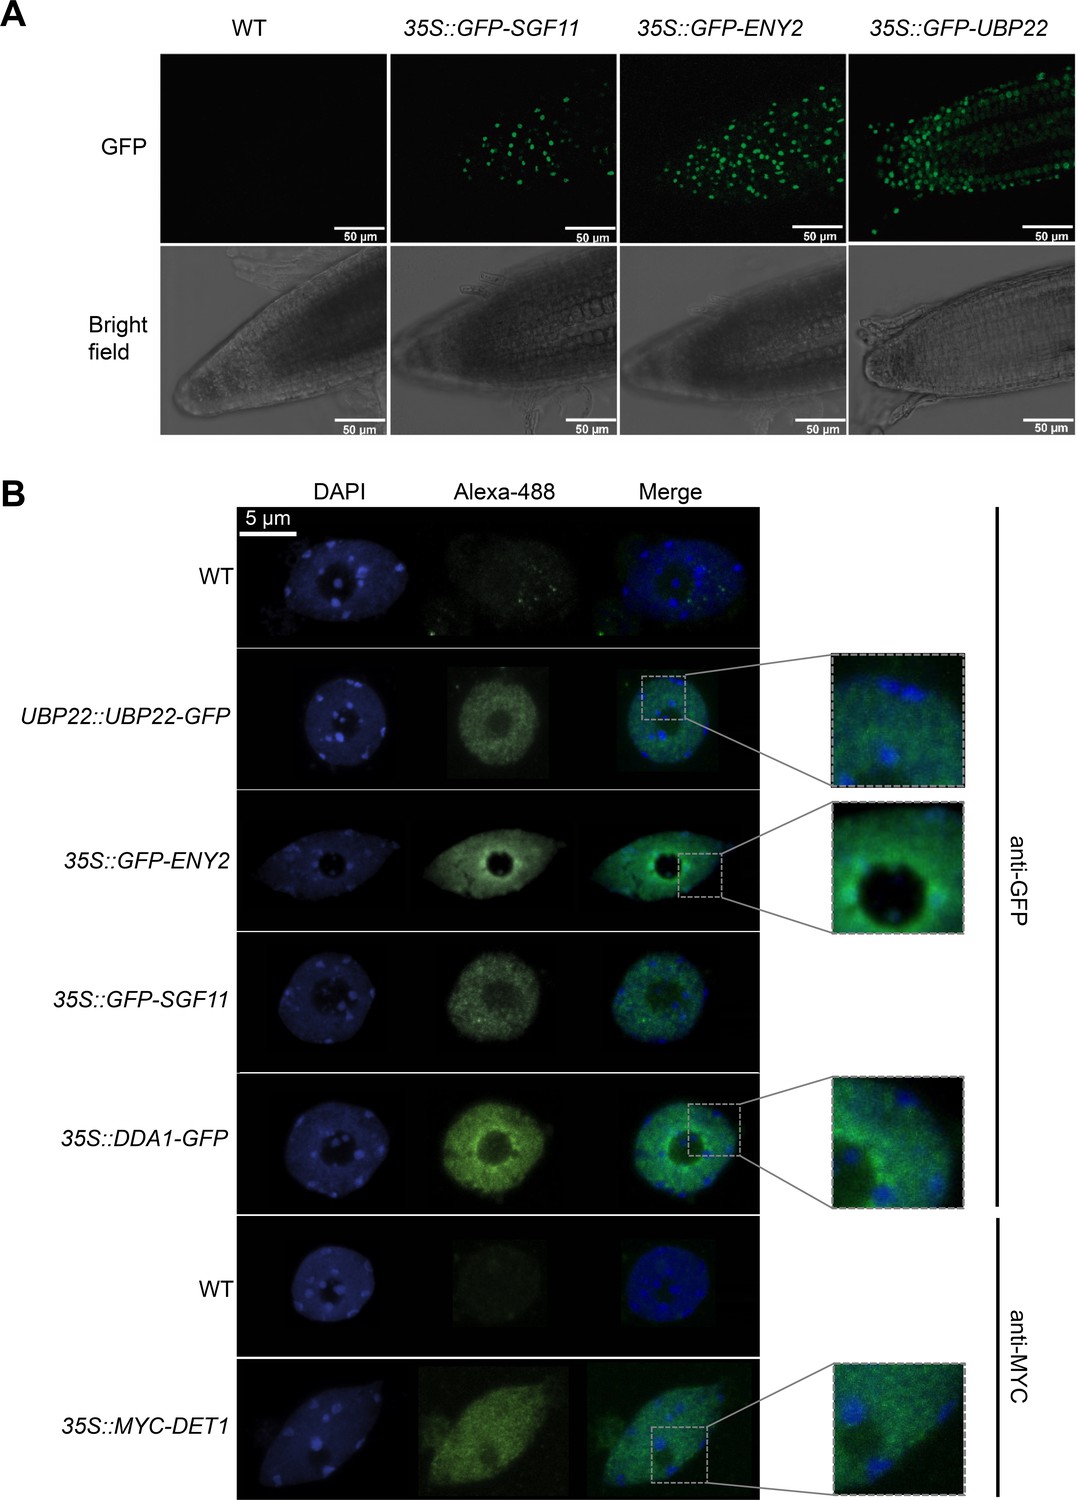
DET1, DDA1 and the UBP22 DUBm subunits are enriched in euchromatin whereas ENY2 is also found in heterochromatic foci.
(A) Live imaging of root tips from 5-day-old seedlings showing the subcellular localization of GFP-tagged SGF11, ENY2 and UBP22 stably expressed in Arabidopsis. (B) Subnuclear localization of the indicated fusion proteins. In contrast to UBP22, SGF11, DDA1 and DET1 that displays a classical euchromatic distribution, GFP-ENY2 signals also frequently overlap with peri-nucleolar and peripheral heterochromatic structures. Representative confocal images of anti-GFP or anti-MYC immunodetection on isolated nuclei isolated from 5-day-old seedling cotyledons are shown. Insets show zoomed fluorescent signals.
Figure 5 with 1 supplement
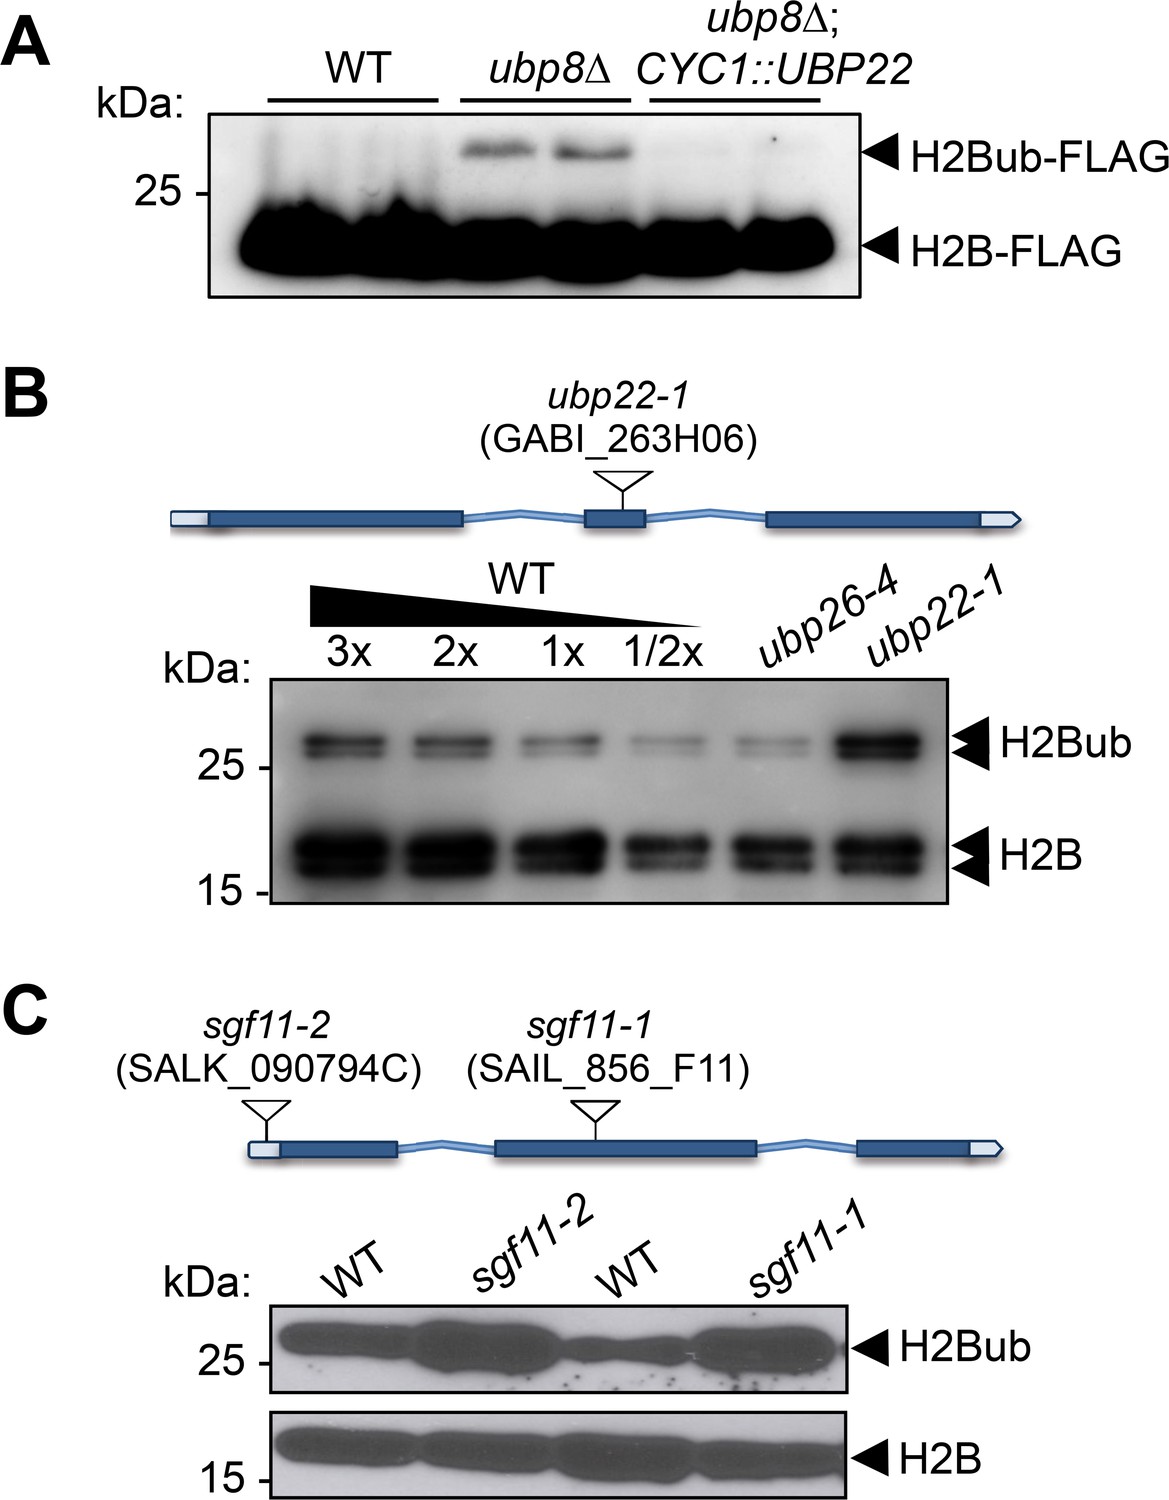
UBP22 is a functional homolog of the S.cerevisiae Ubp8 required for histone H2B deubiquitination in Arabidopsis.
(A) Complementation of a S. cerevisiae ubp8Δ mutant line (Henry et al., 2003) by expression of the Arabidopsis UBP22 CDS under the Cyc1 promoter. For each line, FLAG-tagged histone H2B was detected by immunoblot analysis of whole cell extracts from two different yeast transformed colonies. (B) Anti-H2B immunoblot analyses of H2Bub in ubp22-1 and ubp26-4 mutant seedlings indicate that UBP22 has a more prevalent role than UBP26 in H2Bub removal. Core histone H2B (18 kDa) forms and a doublet corresponding to monoubiquitinated H2B forms (~26 kDa) are detected in chromatin-enriched wild-type extracts. (C) Similarly to ubp22-1, SGF11 loss of function triggers a large increase in H2Bub level. In (B) and (C), the position and ID of the different T-DNAs are depicted on the gene models.
-
Figure 5—source data 1
original blot of data in (B).
- https://doi.org/10.7554/eLife.37892.020
Figure 5—figure supplement 1
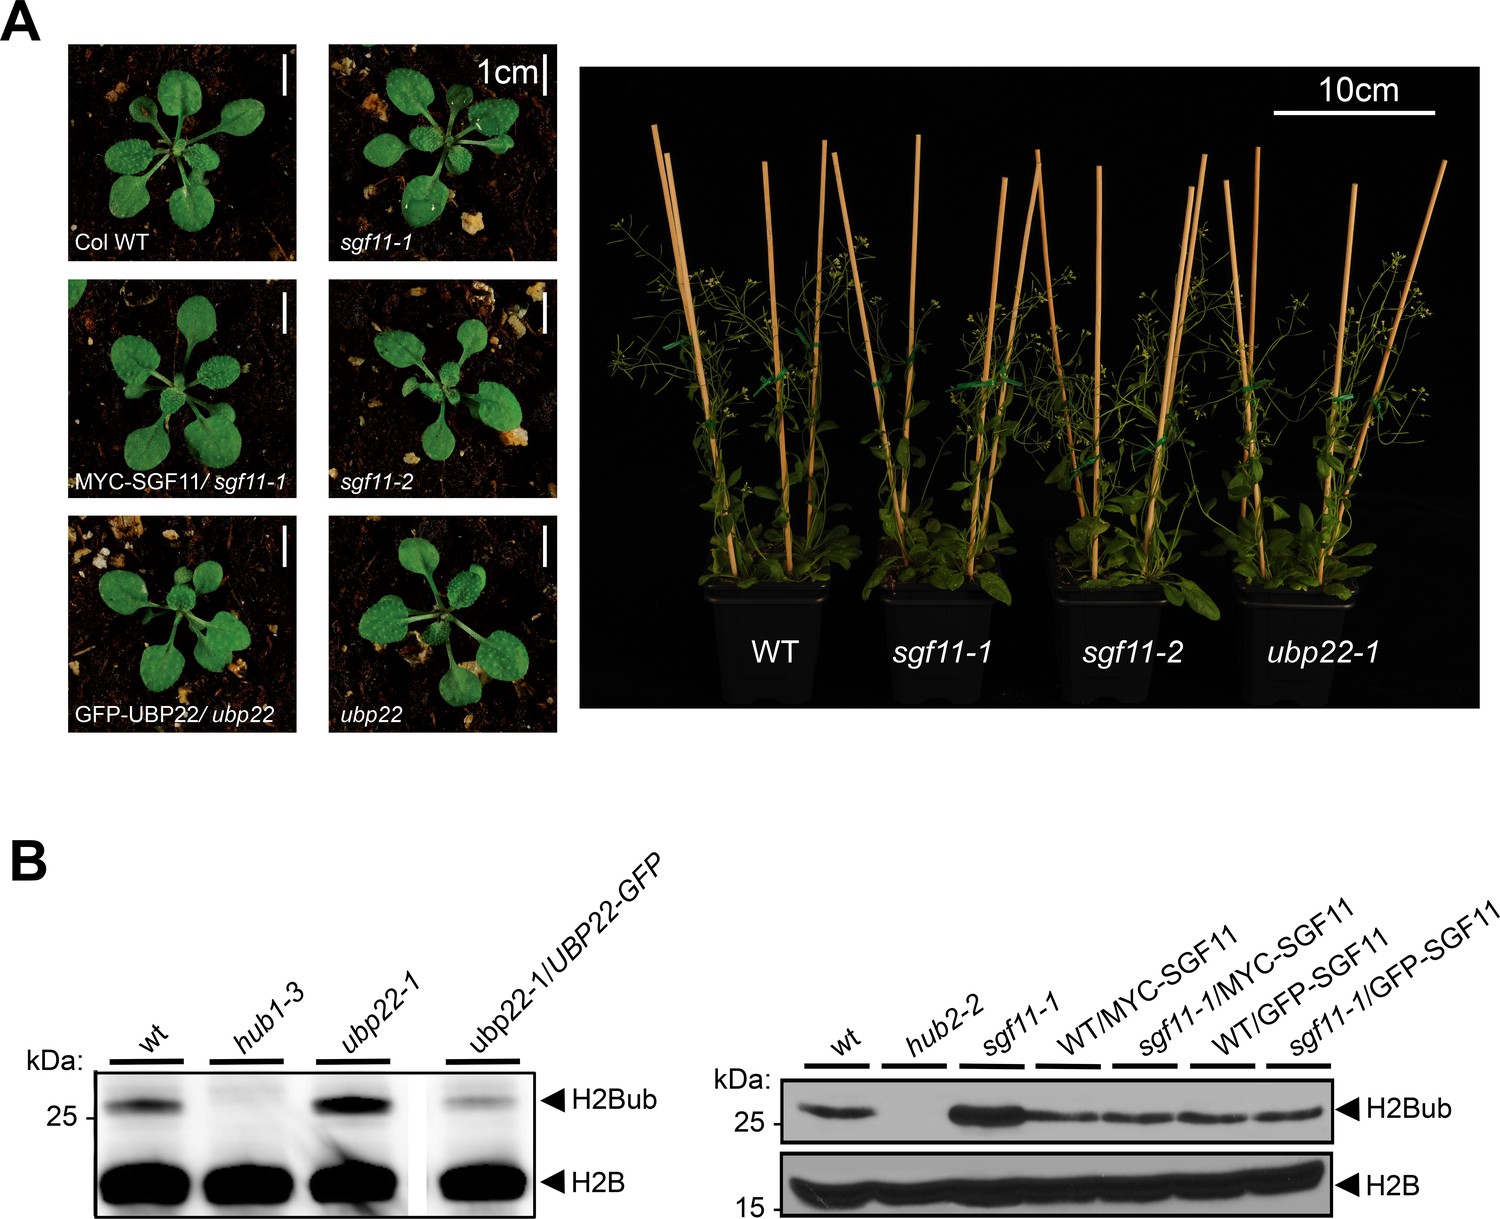
Functional analysis of the ubp22-1, sgf11-1 and sgf11-2 mutant lines.
(A) Homozygous ubp22-1, sgf11-1 and sgf11-2 plant lines display no obvious developmental phenotype under standard laboratory growth conditions. Representative phenotype of seedling and adult plants bearing SGF11 or UBP22 loss-of-function are shown. (B) H2Bub over-accumulation in the ubp22-1 and sgf11-1 line is suppressed by stable re-introduction of a functional UBP22 or SGF11 coding sequence, respectively. Immunoblots of light-grown seedlings protein extracts were performed using the indicated antibodies.
Figure 6
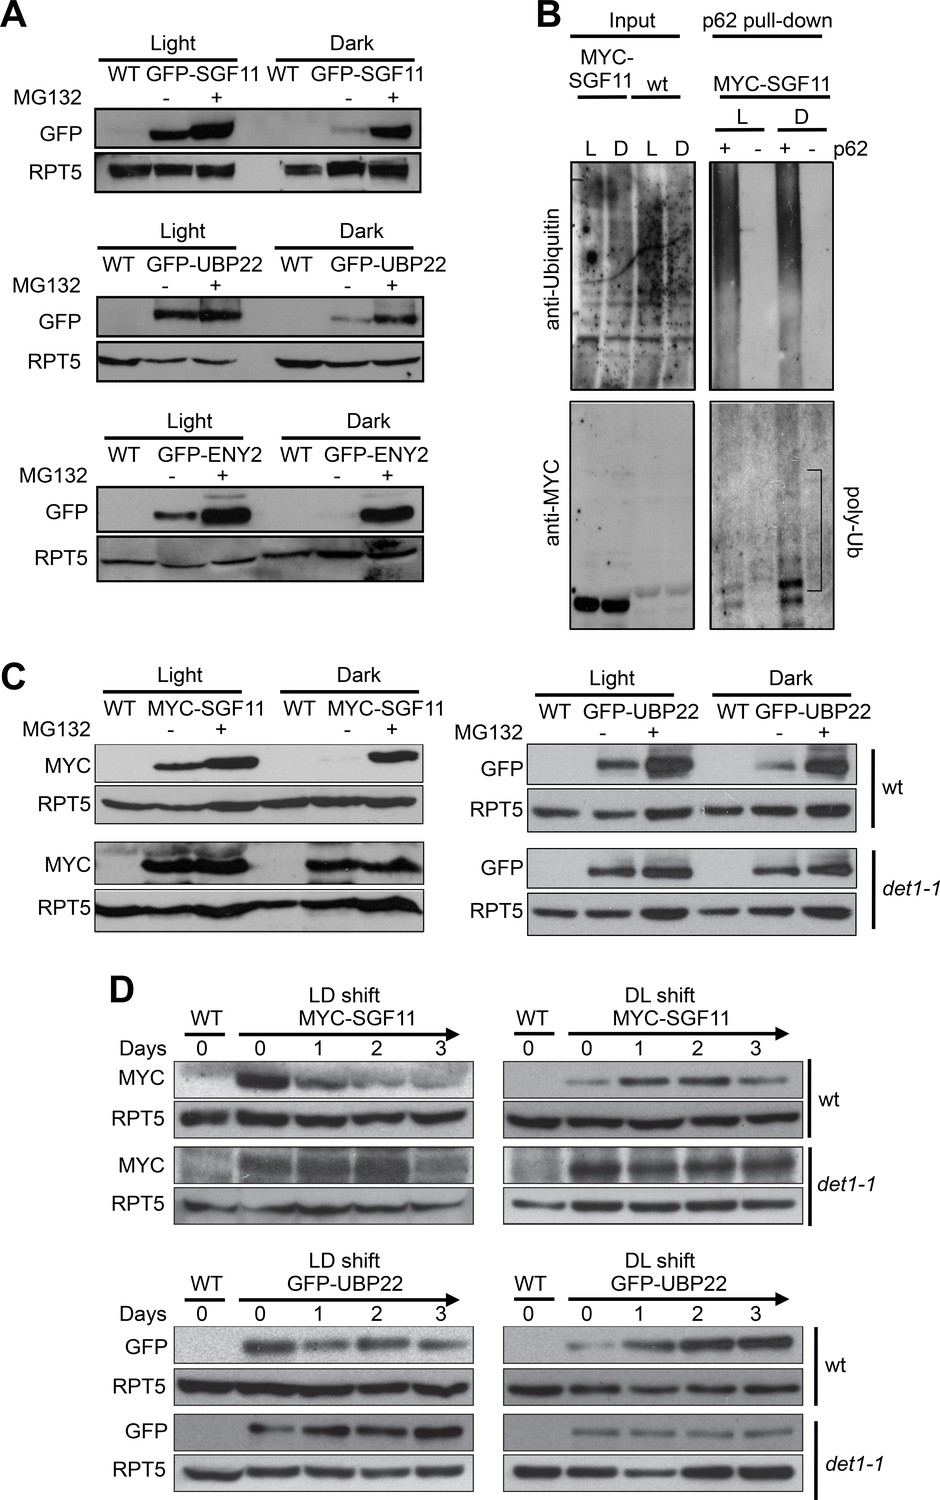
Light signaling controls the proteolytic degradation of the UBP22, SGF11 and ENY2 DUBm subunits.
(A). UBP22, SGF11 and ENY2 DUBm components are degraded by the proteasome preferentially in darkness. Immunoblot analysis of GFP-tagged DUBm proteins in seedlings grown under continuous light or dark conditions. Prior to plant harvesting, seedlings were treated (+) or not (-) with 50 µM MG132 for 12 hr. (B) SGF11 is poly-ubiquitinated in vivo. MYC-SGF11 protein extracts from light (L)- and dark (D)-grown seedlings, treated (+) or not (-) with 50 µM MG132 for 12 hr, were incubated with p62 resin or with agarose resin as negative control. Ubiquitinated proteins are detected using anti-Ubiquitin antibody. Anti-MYC allows detection of MYC-SGF11 and its polyubiquitinated isoforms. Polyubiquitinated MYC-SGF11 signals are indicated (poly-Ub). (C) DET1 promotes the degradation of SGF11 and UBP22 preferentially in darkness. Analysis of the abundance of MYC-SGF11 and GFP-UBP22 proteins in wild-type and det1-1 seedlings grown under dark or light conditions. Prior to plant harvesting, seedlings were treated (+) or not (-) with 50 µM MG132 for 12 hr. (D) DET1 promotes UBP22 and SGF11 protein degradation upon a light-to-dark shift. In (A-D), immunoblots were performed on whole-cell protein extracts from seedlings grown under the indicated conditions.
Figure 7
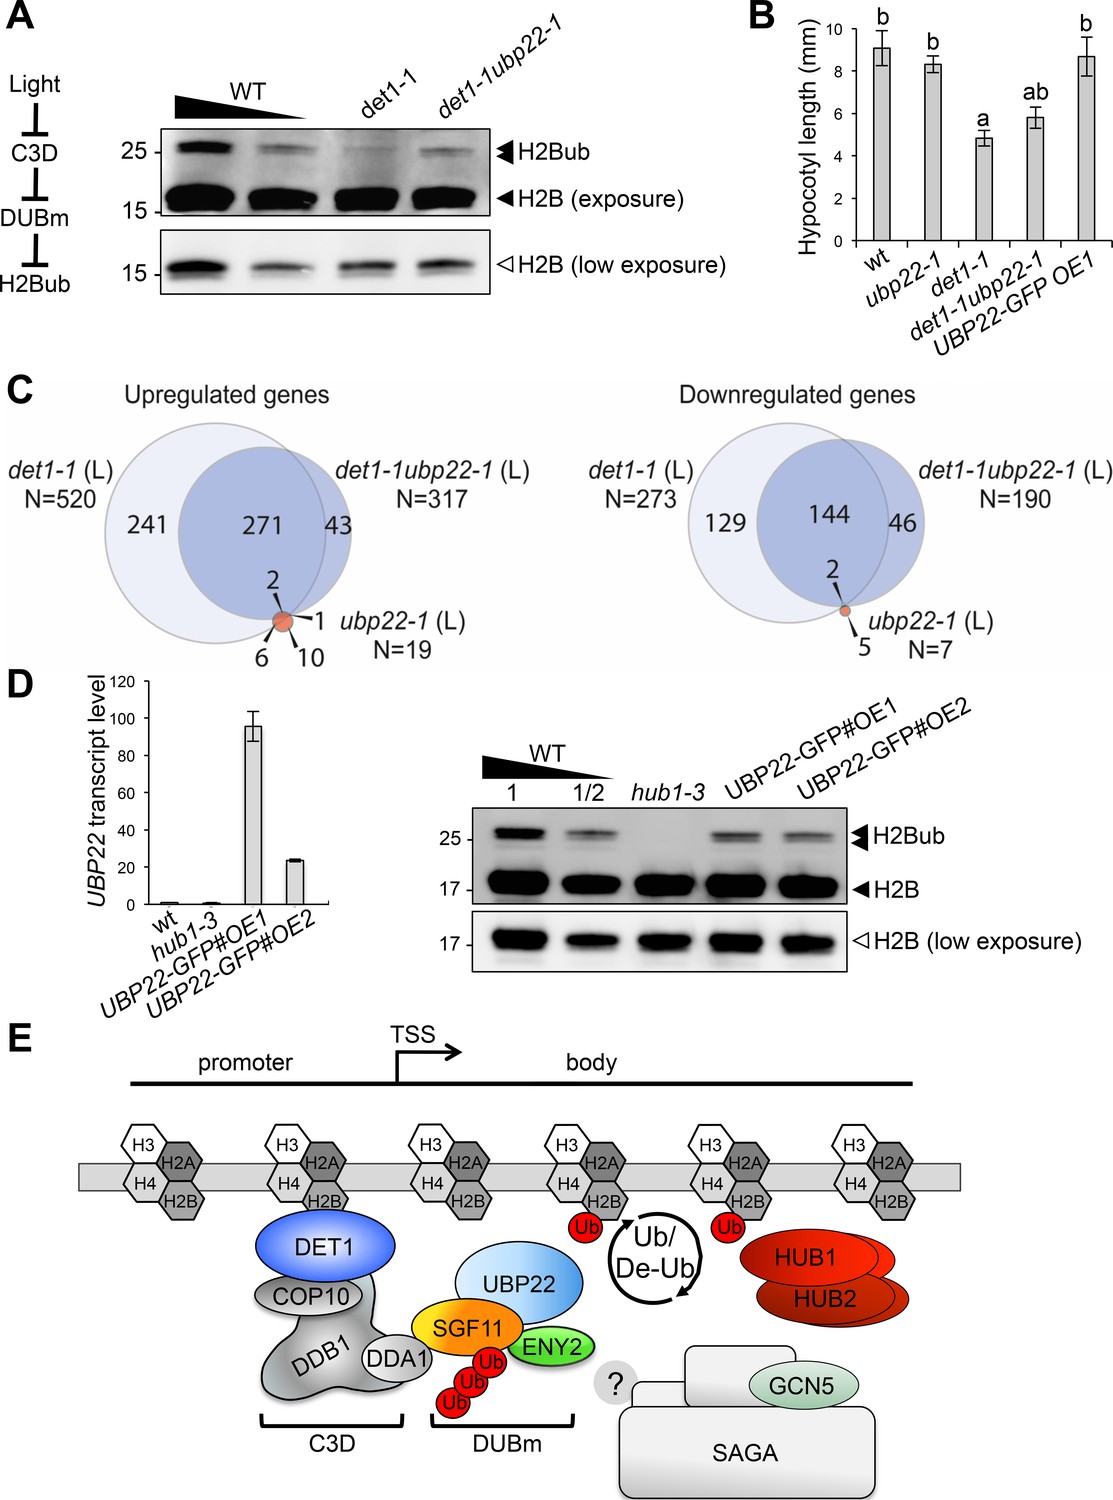
DET1 controls histone H2B monoubiquitination levels by opposing DUBm activity.
(A) UBP22 loss of function largely suppresses the loss of H2Bub in det1-1 seedlings. Histone H2B (18 kDa) and its monoubiquitinated H2B (~26 kDa) forms are detected with an anti-H2B antibody in immunoblot analysis of chromatin extracts from seedlings with the indicated genotypes. A scheme for the regulatory effects of light, C3D and DUBm on H2B ubiquitination homeostasis is depicted. (B) Partial suppression of det1-1 constitutive photomorphogenic phenotype by UBP22 loss-of-function. Columns represent average hypocotyl length of 5-day-old dark-grown seedlings with the indicated genotypes. Error bars represent standard deviation (N ≥ 20). Letters above bars indicate statistically distinct groups (p<0.01, one-way Anova with Tukey-HSD) with respect to wild-type Col-0 (a) or to det1-1 seedlings (b). (C) RNA-seq analysis of light-grown seedlings show that det1-1 defects in gene expression are partially suppressed after introgression of the ubp22-1 mutation, while UBP22 loss-of-function per se only marginally affects gene expression in wild-type plants. The number of genes correspond to a Log2FC > 1 and a FDR < 0.01. (D) UBP22 overexpression decreases histone H2Bub global level. Left panel, RT-qPCR measurement of UBP22 transcript levels in overexpression lines #OE1 and #OE2 relative to the wild-type level (arbitrarily set to 1). Right panel, immunodetection of H2Bub levels in chromatin extracts from light-grown seedlings of the indicated genotypes. (E) Proposed model depicting the C3D complex activity in regulating histone H2Bub homeostasis through ubiquitin-mediated control of the DUBm stability. UBP22 is a Ubp8 homolog acting with SGF11 and ENY2 in H2Bub deubiquitination, possibly promoting transcription under optimal growth conditions. The C3D complex DDA1 subunit targets SGF11 for degradation, favoring degradation of the DUBm. DET1 affinity for non-acetylated histone H2B (Benvenuto et al., 2002) may favor this degradation nearby H2Bub-rich regions. DET1 may further influence histone H2B acetylation status via an unknown mechanism, possibly involving the DUBm/SAGA activities or independent pathways. In the absence of Sgf73 homolog in plants, the DUBm may act independently from SAGA.
Tables
Key resources table
| Reagent type (species) or resource | Designation | Source or reference | Identifiers | Additional information |
|---|---|---|---|---|
| Genetic reagent (Arabidopsis thaliana) | det1-1 | Chory et al., 1989 | det1-1 | Col-0; EMS mutation |
| Genetic reagent (Arabidopsis thaliana) | hub1-3 | Fleury et al., 2007 | GABI_276D08 | Col-0; from NASC collection |
| Genetic reagent (Arabidopsis thaliana) | hub2-2 | Liu et al., 2007 | SALK_071289 | Col-0; from NASC collection |
| Genetic reagent (Arabidopsis thaliana) | ubp26-4 | Sridhar et al., 2007 | SALK_024392 | Col-0; from NASC collection |
| Genetic reagent (Arabidopsis thaliana) | ubp22-1 | This study; see Materials and methods | GABI_263H06 | Col-0; from NASC collection |
| Genetic reagent (Arabidopsis thaliana) | sgf11-1 | This study and Pfab et al., 2018 | SAIL_856_F11 | Col-0; from NASC collection |
| Genetic reagent (Arabidopsis thaliana) | sgf11-2 | This study; see Materials and methods | SALK_090794C | Col-0; from NASC collection |
| Genetic reagent (Arabidopsis thaliana) | wt/35S::MYC-UBIQUITIN | Dubin et al., 2008 | 35S::MYC-UBIQUITIN | Col-0 |
| Genetic reagent (Arabidopsis thaliana) | wt/35S::MYC-DET1 | Castells et al., 2011 | 35S::MYC-DET1 | Col-0 |
| Genetic reagent (Arabidopsis thaliana) | wt/35S::DDA1-GFP | Irigoyen et al., 2014 | 35S::DDA1-GFP | Col-0 |
| Genetic reagent (Arabidopsis thaliana) | wt/35S::GFP-UBP22 | This study; see Materials and methods | 35S::UBP22-GFP | Col-0 |
| Genetic reagent (Arabidopsis thaliana) | wt/UBP22::UBP22-GFP#OE2 | This study; see Materials and methods | UBP22-GFP#OE1 | Col-0 |
| Genetic reagent (Arabidopsis thaliana) | wt/UBP22::UBP22-GFP#OE2 | This study; see Materials and methods | UBP22-GFP#OE2 | Col-0 |
| Genetic reagent (Arabidopsis thaliana) | Complemented ubp22-1 | This study; see Materials and methods | ubp22-1/UBP22:UBP22-GFP | Col-0 |
| Genetic reagent (Arabidopsis thaliana) | wt/35S::GFP-SGF11 | This study; see Materials and methods | sgf11-2/35S::GFP-SGF11 | Col-0 |
| Genetic reagent (Arabidopsis thaliana) | wt/35S::MYC-SGF11 | This study; see Materials and methods | sgf11-2/35S::MYC-SGF11 | Col-0 |
| Genetic reagent (Arabidopsis thaliana) | wt/35S:GFP-ENY2 | This study; see Materials and methods | 35S:GFP-ENY2 | Col-0 |
| Strain, strain background (S. cerevisae) | ubp8∆ mutant line | Gardner et al., 2005 | UCC6392 | ubp8::KanMX |
| Strain, strain background (S. cerevisae) | Complemented ubp8∆ mutant line | This study | CYC1::UBP22 Ubp8::KanMX | |
| Antibody | Anti-GFP-HRP | Milteny Biotec #130-091-833 | Immunoblots (1:2,000) | |
| Antibody | anti-FLAG M2 | Sigma-Aldrich #F3165 | Immunoblots (1:2,000) | |
| Antibody | anti-HA-HRP | Roche #3F10 | Immunoblots, dilution 1:1000 | |
| Antibody | anti-human H2B | Millipore #07–371 | Immunoblots (1:2,000) | |
| Antibody | anti-rice H2B | Bourbousse et al., 2012 | Immunoblots (1:2,000) | |
| Antibody | anti-H2Bub | Medimabs #MM-0029 | Immunoblots (1:1,000) | |
| Antibody | anti-H3K4me2 | Millipore #07–030 | Immunoblots (1:10,000) | |
| Antibody | anti-H3K4me3 | Millipore #05–745 | Immunoblots (1:10,000) | |
| Antibody | anti-H3K27me3 | Millipore #07–449 | Immunoblots (1:10,000) | |
| Antibody | anti-H3K36me3 | Millipore #07–353 | Immunoblots (1:10,000) | |
| Antibody | anti-H3ac | Millipore #06–599 | Immunoblots (1:10,000) | |
| Antibody | anti-H3K9ac | Millipore #06–942 | Immunoblots (1:10,000) | |
| Antibody | anti-H3K27ac | Millipore #07–360 | Immunoblots (1:10,000) | |
| Antibody | anti-H4ac | Millipore #06–598 | Immunoblots (1:10,000) | |
| Antibody | anti-H3 | Millipore #05–499 | Immunoblots (1:10,000) | |
| Antibody | anti-RPT5 | Enzo Life Sciences # BML-PW8245 | Immunoblots (1:10,000) | |
| Antibody | anti-Ubiquitin | Enzo Life Sciences # BML-PW0930 | Immunoblots (1:1,000) | |
| Antibody | anti-MYC | Millipore #05–724 | Cytology (1:200) | |
| Antibody | anti-GFP | ThermoFisher Scientific #A11122 | Cytology (1:200) | |
| Antibody | Alexa-488 coupled anti-mouse | ThermoFisher Scientific #A11001 | Cytology (1:200) | |
| Antibody | Alexa-488 coupled anti-rabbit | ThermoFisher Scientific #A11008 | Cytology (1:200) | |
| Antibody | anti-H2Bub | Medimabs #MM-0029-P | ChIP-seq (1:600) | |
| Gene (Arabidopsis thaliana) | UBP22 | At5G10790 | ||
| Gene (Arabidopsis thaliana) | UBP26 | At3G49600 | ||
| Gene (Arabidopsis thaliana) | SGF11 | AT5G58575 | ||
| Gene (Arabidopsis thaliana) | ENY2 | AT3G27100 | ||
| Gene (Arabidopsis thaliana) | DDB1a | AT4G05420 | ||
| Gene (Arabidopsis thaliana) | HUB1 | At2G44950 | ||
| Gene (Arabidopsis thaliana) | DET1 | AT4G10180 | ||
| Gene (Arabidopsis thaliana) | DDA1 | AT5G41560 | ||
| Gene (Arabidopsis thaliana) | HCF173 | AT1G16720 | ||
| Gene (Arabidopsis thaliana) | HCAR | AT1G04620 | ||
| Gene (Arabidopsis thaliana) | MKK2 | AT4G29810 | ||
| Gene (Arabidopsis thaliana) | COP10 | AT3G13550 | ||
| Recombinant DNA reagent | pUBP22::UBP22-GFP (plasmid) | This study, see Materials and methods | Progenitors: PCR UBP22; Gateway vector pB7FWG,0 | |
| Recombinant DNA reagent | p35S::GFP-UBP22 (plasmid) | This study, see Materials and methods | Progenitors: PCR UBP22; Gateway vector pB7GWF2 | |
| Recombinant DNA reagent | p35S::GFP-SGF11 (plasmid) | This study, see Materials and methods | Progenitors: PCR SGF11; Gateway vector pDONR207 | |
| Recombinant DNA reagent | p35S::GFP-ENY2 (plasmid) | This study, see Materials and methods | Progenitors: PCR ENY2; Gateway vector pDONR207 |
Download links
A two-part list of links to download the article, or parts of the article, in various formats.
Downloads (link to download the article as PDF)
Open citations (links to open the citations from this article in various online reference manager services)
Cite this article (links to download the citations from this article in formats compatible with various reference manager tools)
DET1-mediated degradation of a SAGA-like deubiquitination module controls H2Bub homeostasis
eLife 7:e37892.
https://doi.org/10.7554/eLife.37892


