An NAD+-dependent novel transcription factor controls stage conversion in Entamoeba
- Stanford University School of Medicine, United States
Figures
Figure 1 with 2 supplements
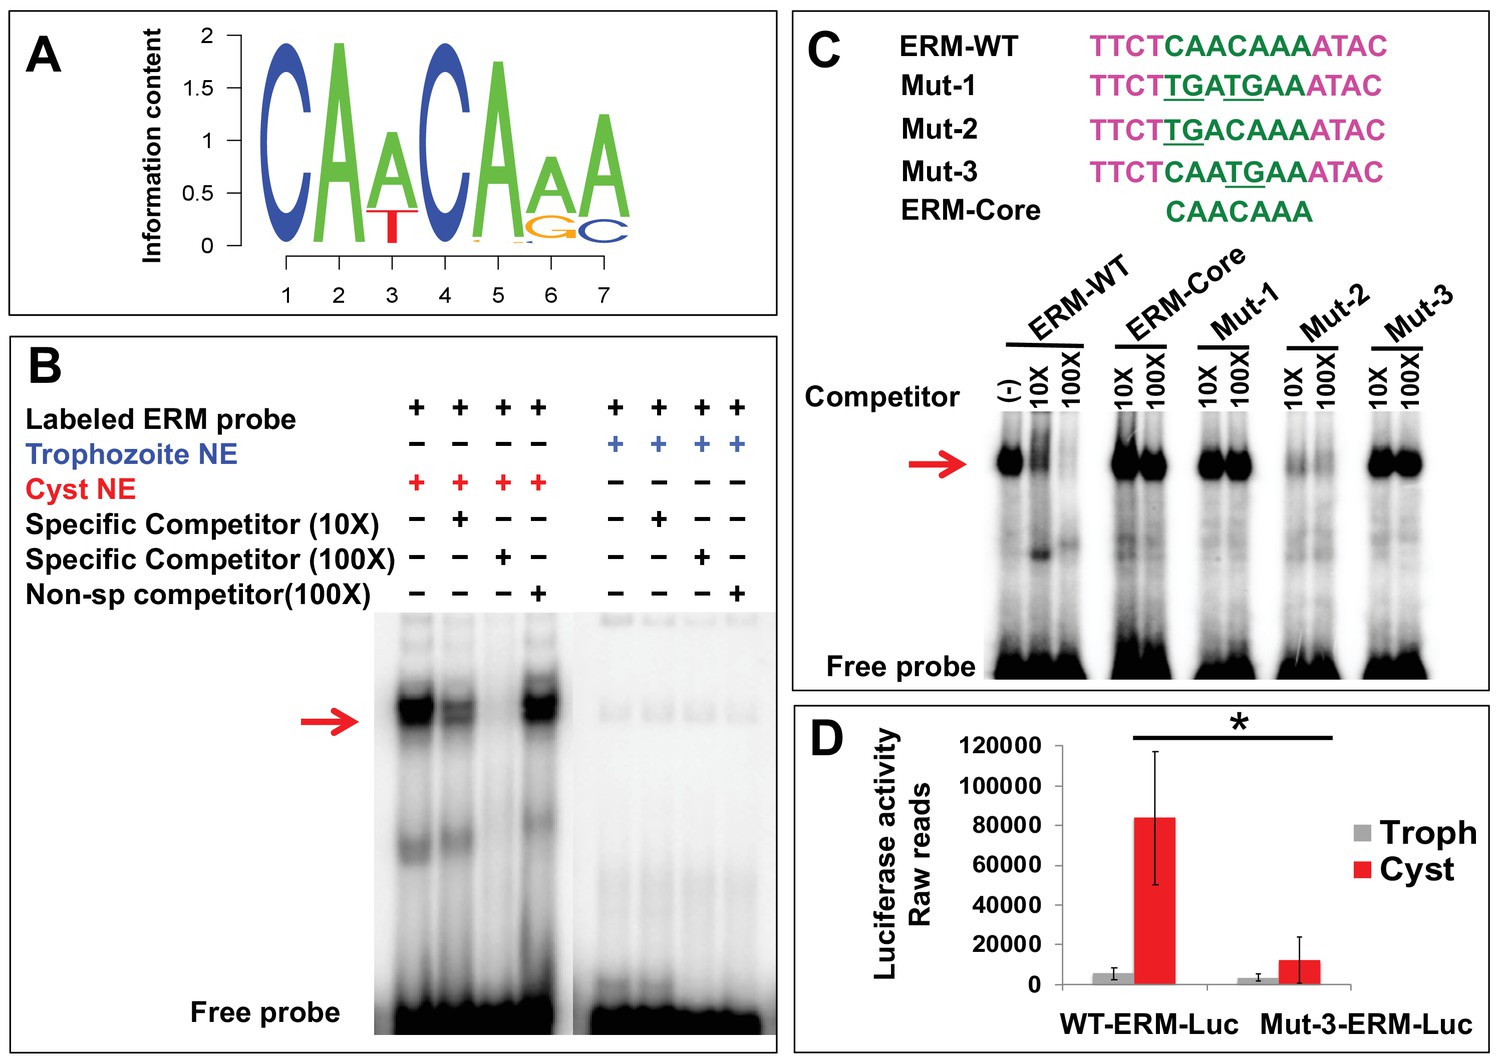
Encystation regulatory motif (ERM) specifically binds cyst nuclear protein and identification of crucial residues important for promoter activity.
(A) Sequence logo of ERM, which is enriched in the promoter of cyst-specific genes. The seven-nucleotide motif information content is shown. (B) Representative EMSA results are shown in the presence and absence of different components marked as ‘+' and ‘−' respectively. Radiolabeled ERM probe was used in each reaction. Unlabeled ERM probe at 10X and 100X was used as a specific competitor and non-specific cold competitor was used at 100X as indicated. The red arrow indicates the major specific band in the gel shift assay; free probe is at the bottom. (C) Sequences of three mutants (Mut-1, 2 and 3) generated by changing the conserved CAs to TG (underlined) and ERM-core, without nonspecific flanking region are shown. Competition assays using cyst nuclear protein were performed using 10X and 100X of cold competitor against radiolabeled ERM-WT probe. The red arrow indicates the major bands that exhibit specific binding. (D) Data represents the raw luciferase readings in Trophozoites (Troph) and Cysts in WT-ERM-promoter construct and Mut-3-ERM-promoter construct having luciferase as a reporter gene. Data are mean ±s.d. (n = 3) Student’s t-test; *p<0.05.
-
Figure 1—source data 1
List of genes specifically upregulated during 24 hr of encystation.
616 genes were identified which coordinately upregulated at 24 hr of Encystation. Gene ID and normalized expression from different time points of development are listed (Excel file).
- https://doi.org/10.7554/eLife.37912.005
-
Figure 1—source data 2
List of oligonucleotides used in electrophoretic mobility shift assay (EMSA), cloning and RT-PCR.
All the primers used in this study for EMSA, cloning and RT-PCR are listed with gene ID (Excel file).
- https://doi.org/10.7554/eLife.37912.006
-
Figure 1—source data 3
List of genes having ERM (CAACAAA) in the promoter.
A total of 131 genes were identified which have CAACAAA motif in the promoter regions (Excel file).
- https://doi.org/10.7554/eLife.37912.007
Figure 1—figure supplement 1
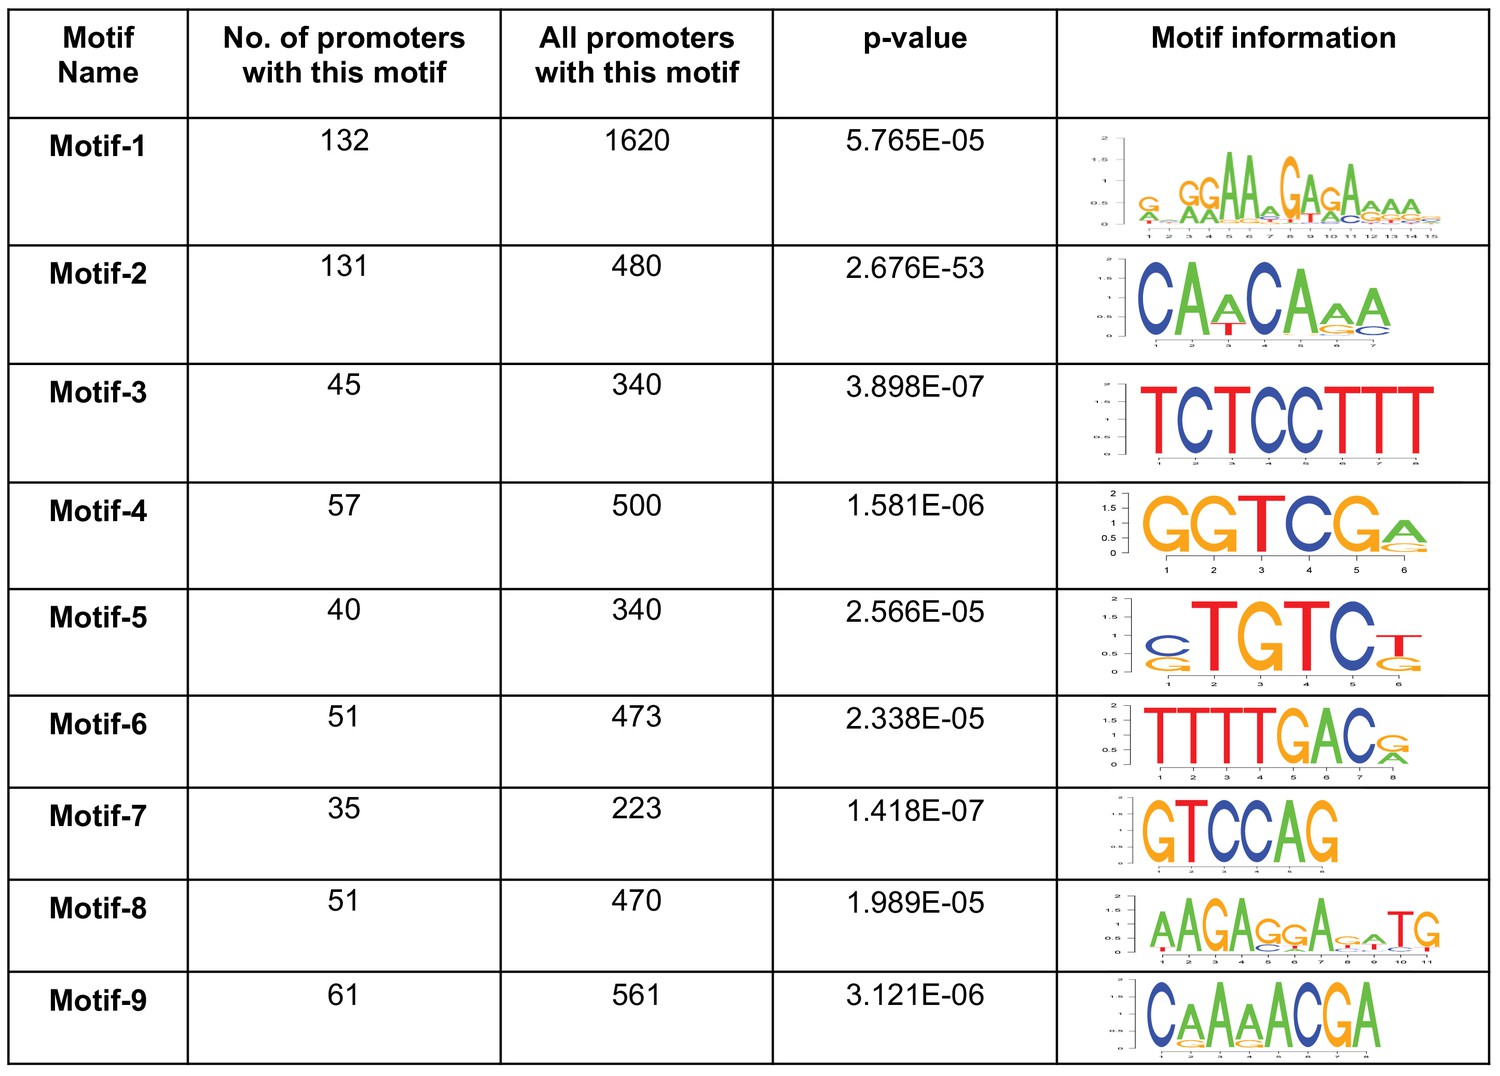
Motifs enriched in the promoters of genes that upregulated during 24 hr of encystation.
Nine motifs (Motif 1 – 9) were identified which enriched in the promoters of cyst-specific genes compare to all promoter databases in E. invadens. Motif name, number of occurrences within cyst-specific genes, number of occurrences in all promoters, p-values and motif information Logos are listed.
Figure 1—figure supplement 2
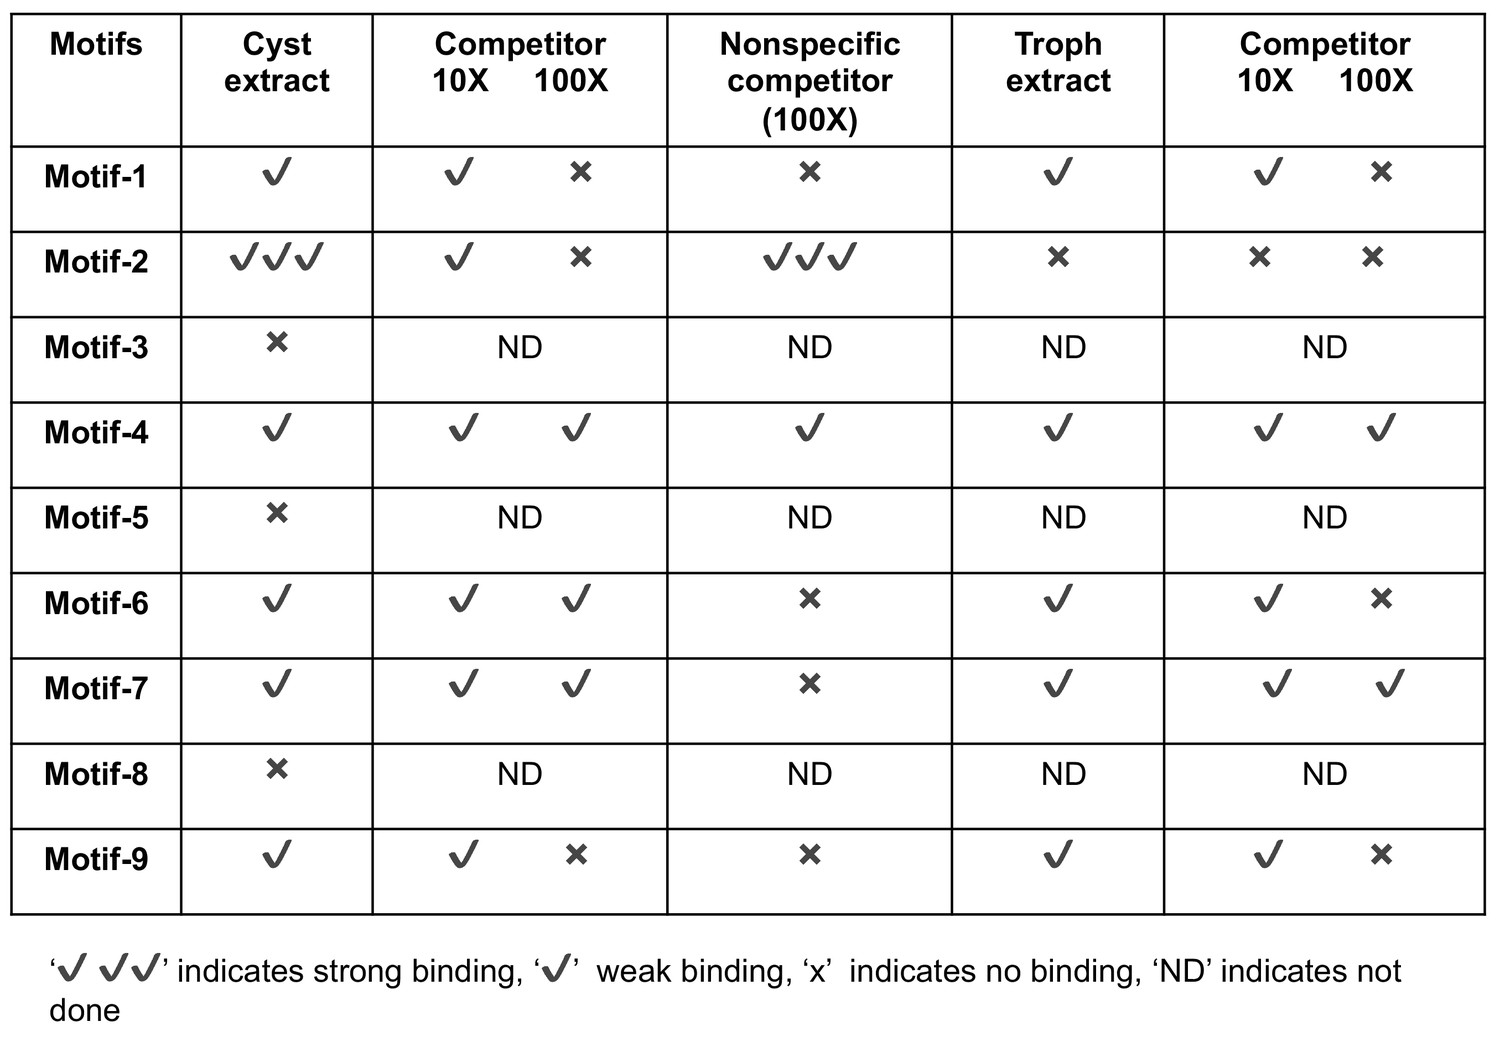
Summary of screening results of the motifs by electrophoretic mobility shift assay (EMSA).
EMSA by using radiolabeled oligonucleotides for all nine motifs with nuclear extract from both trophozoites and cysts (24 hr). Each unlabeled oligonucleotide at 10X and 100X was used as a specific competitor and one non-specific cold competitor was used at 100X. ‘✔' indicates weak binding and 'X' indicates no binding. ‘✔ ✔ ✔' indicates strong binding.
Figure 2 with 2 supplements
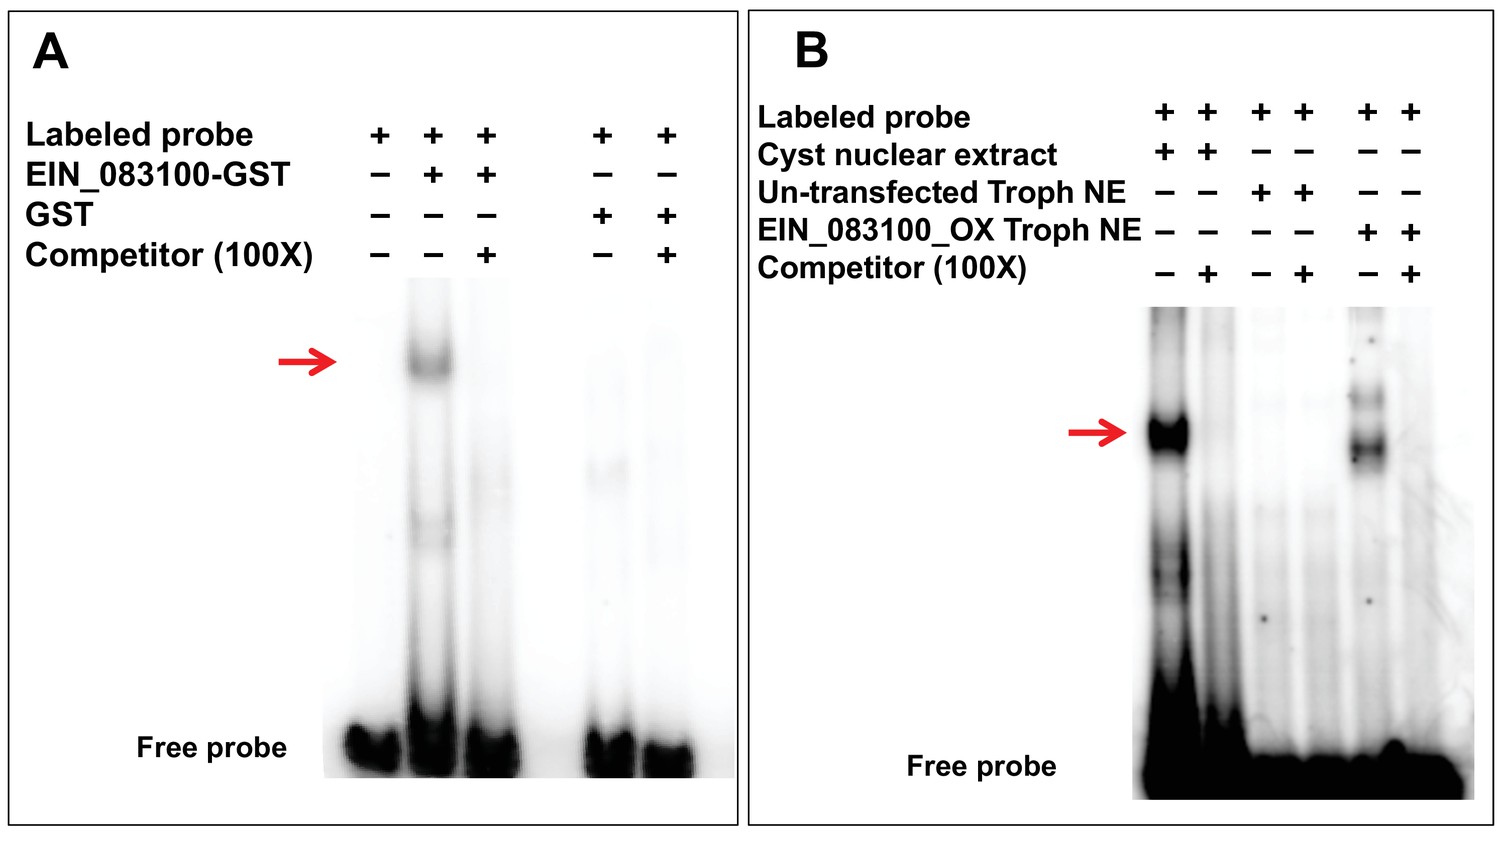
Confirmation of ERM-binding protein (ERM-BP).
(A) EMSA results with purified GST tagged ERM-BP and radiolabeled ERM probe. Unlabeled ERM oligonucleotides in 100X excess were used as a specific competitor and GST as control protein. The red arrow indicates the major shifted band that exhibits specific binding. (B) EMSA results with radiolabeled ERM and nuclear extracts from both cysts/trophozoites from control cells and nuclear extracts from myc-tagged ERM-BP_OX trophozoites. Unlabeled ERM oligonucleotide in excess at 100X was used as a specific competitor. The red arrow indicates the major band that exhibits specific binding.
-
Figure 2—source data 1
All proteins identified from three independent mass-spec experiments.
Mass spectrometry was performed on three paired samples (ERM-WT and ERM-core). In one experiment, ERM-WT with trophozoite nuclear extract was used as a second control. The cut-off criteria: minimum protein, 95%; minimum number of peptides, 1; minimum peptide, 95% were used for analysis. All the proteins identified are listed with Gene ID, spectral count and fold change (Excel file).
- https://doi.org/10.7554/eLife.37912.012
Figure 2—figure supplement 1
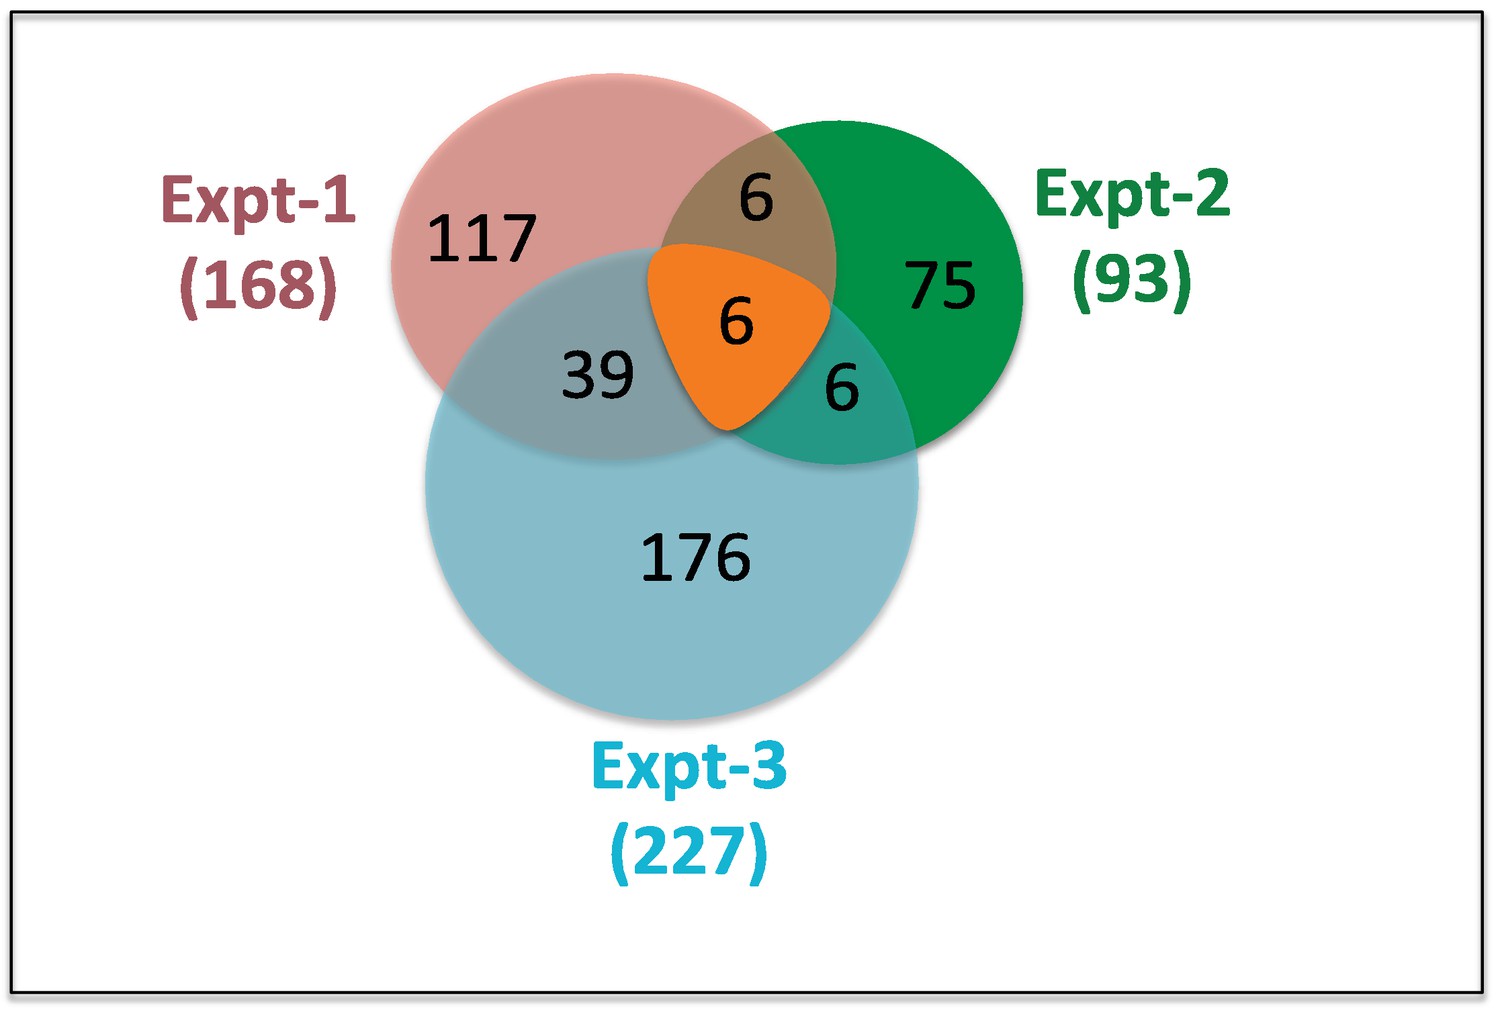
Summary of mass-spec results.
LC-MS data analysis from three independent experiments is shown. In parenthesis the numbers proteins (168, 93 and 227), which were enriched or exclusively present in ERM-WT compare to ERM-core. Only six proteins met these criteria in all three experiments.
Figure 2—figure supplement 2
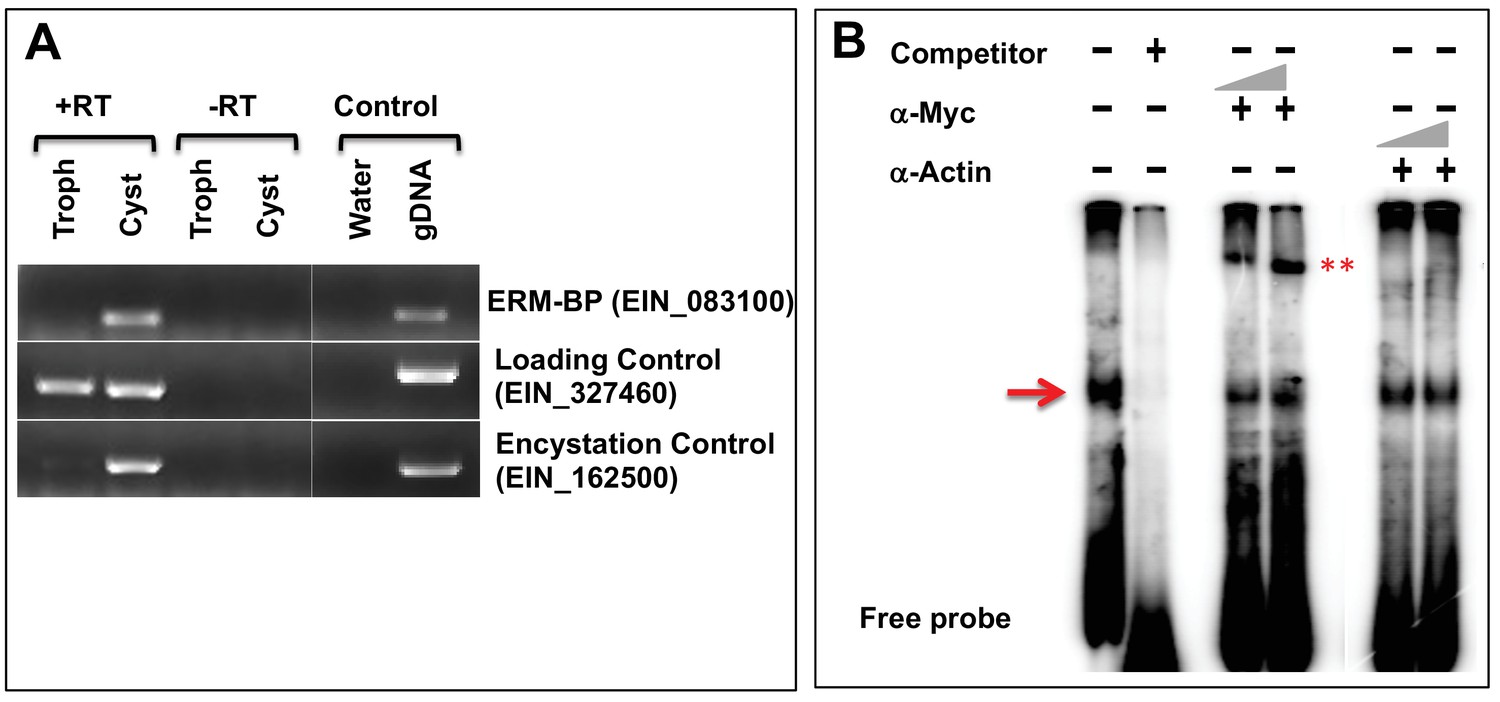
Stage-specific expression of ERM-BP and confirmation by gel super-shift assay.
(A) RT-PCR to detect the expression of ERM-BP (EIN_083100) transcript level in E. invadens (IP1) trophozoites (Troph) and cysts (24 hr) with a loading control (EIN_327460) and an encystation control (EIN_162500). (B) Gel super-shift assay using radiolabeled ERM; nuclear extracts from myc-tagged ERM-BP_OX with rabbit polyclonal α-myc and α-actin antibodies at 1 or 2 μg. The red arrow indicates major bands that exhibit specific binding to ERM. *** indicates super-shifted bands due to complex formation with α-myc antibody.
Figure 3
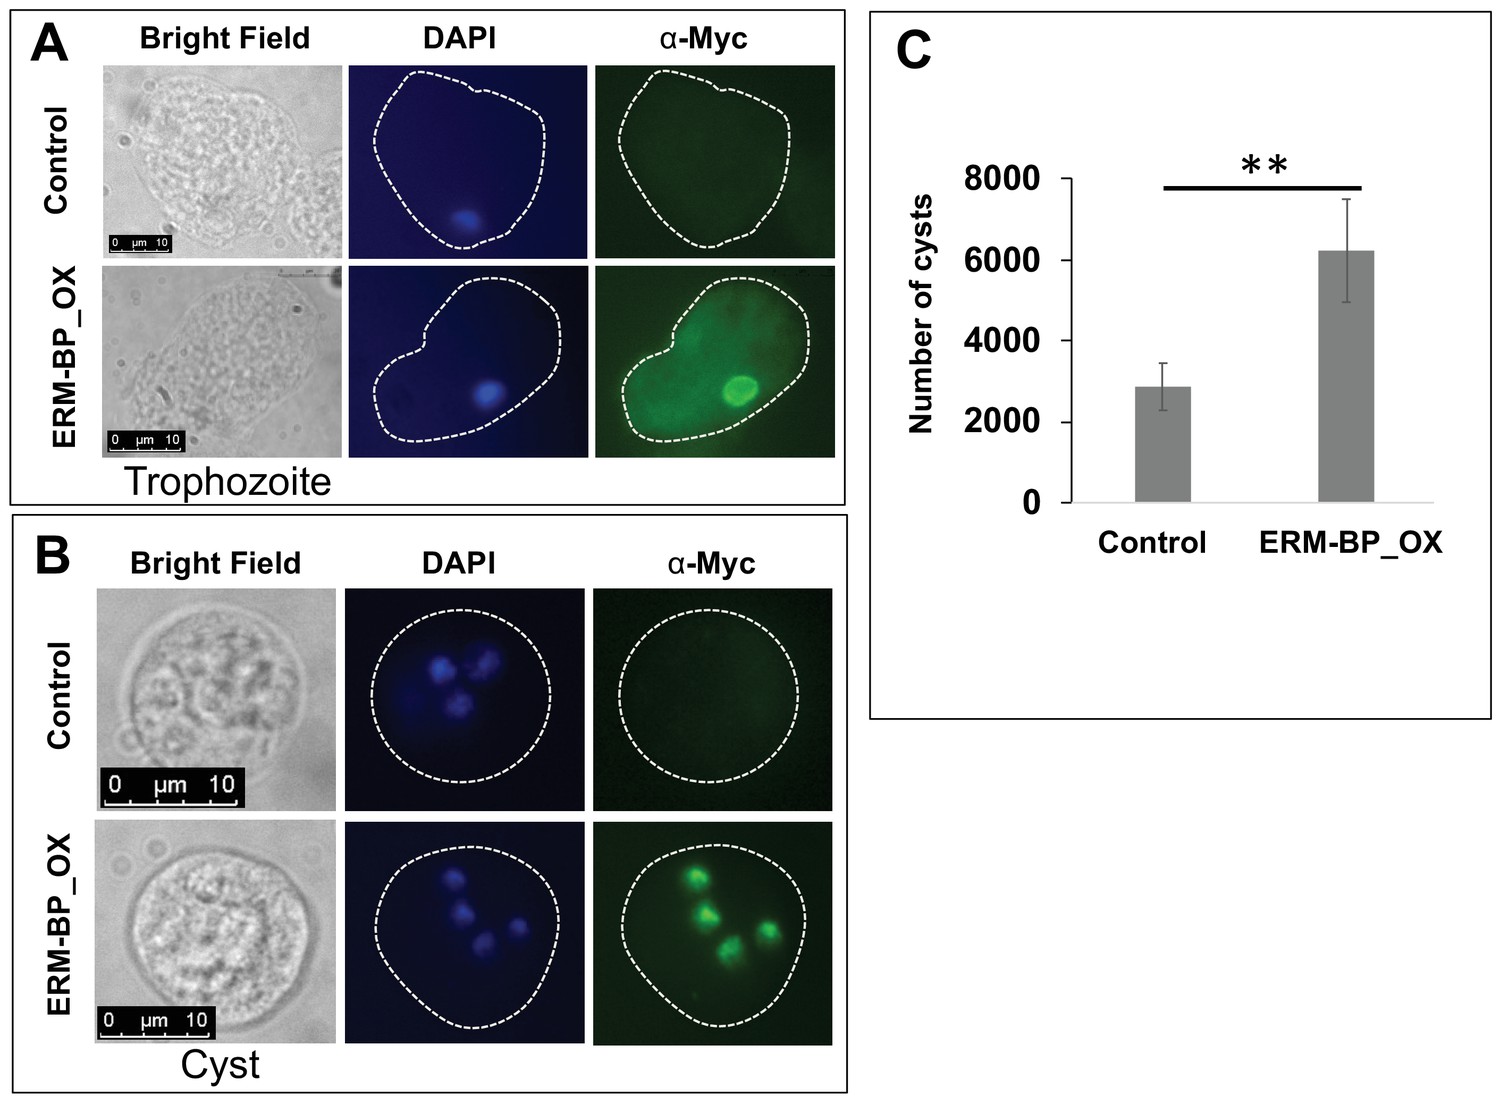
Myc-tagged ERM-BP is localized to nucleus and overexpression enhances encystation.
Immunostaining with α-myc antibody in (A) trophozoites, and (B) 24 hr cyst was performed in ERM-BP_OX and control cells (Green). DNA was stained with DAPI (Blue). Scale bar for trophozoites and cysts are 10 μm. (C) Data represents the number of cysts in ERM-BP_OX and control cell lines after 72 hr of encystation. The number of cysts in control parasites was compared to that of ERM-BP_OX as determined by calcofluor staining and analyzed by ImageXpress (equipped with a laser and image-based acquisition) in a 96-well format. A minimum of eight wells per parasite line per experiment were analyzed, and biological replicate experiments were performed on three independent days. Data are mean ±s.e. (n = 3) Student’s t-test; **p<0.001.
Figure 4 with 2 supplements
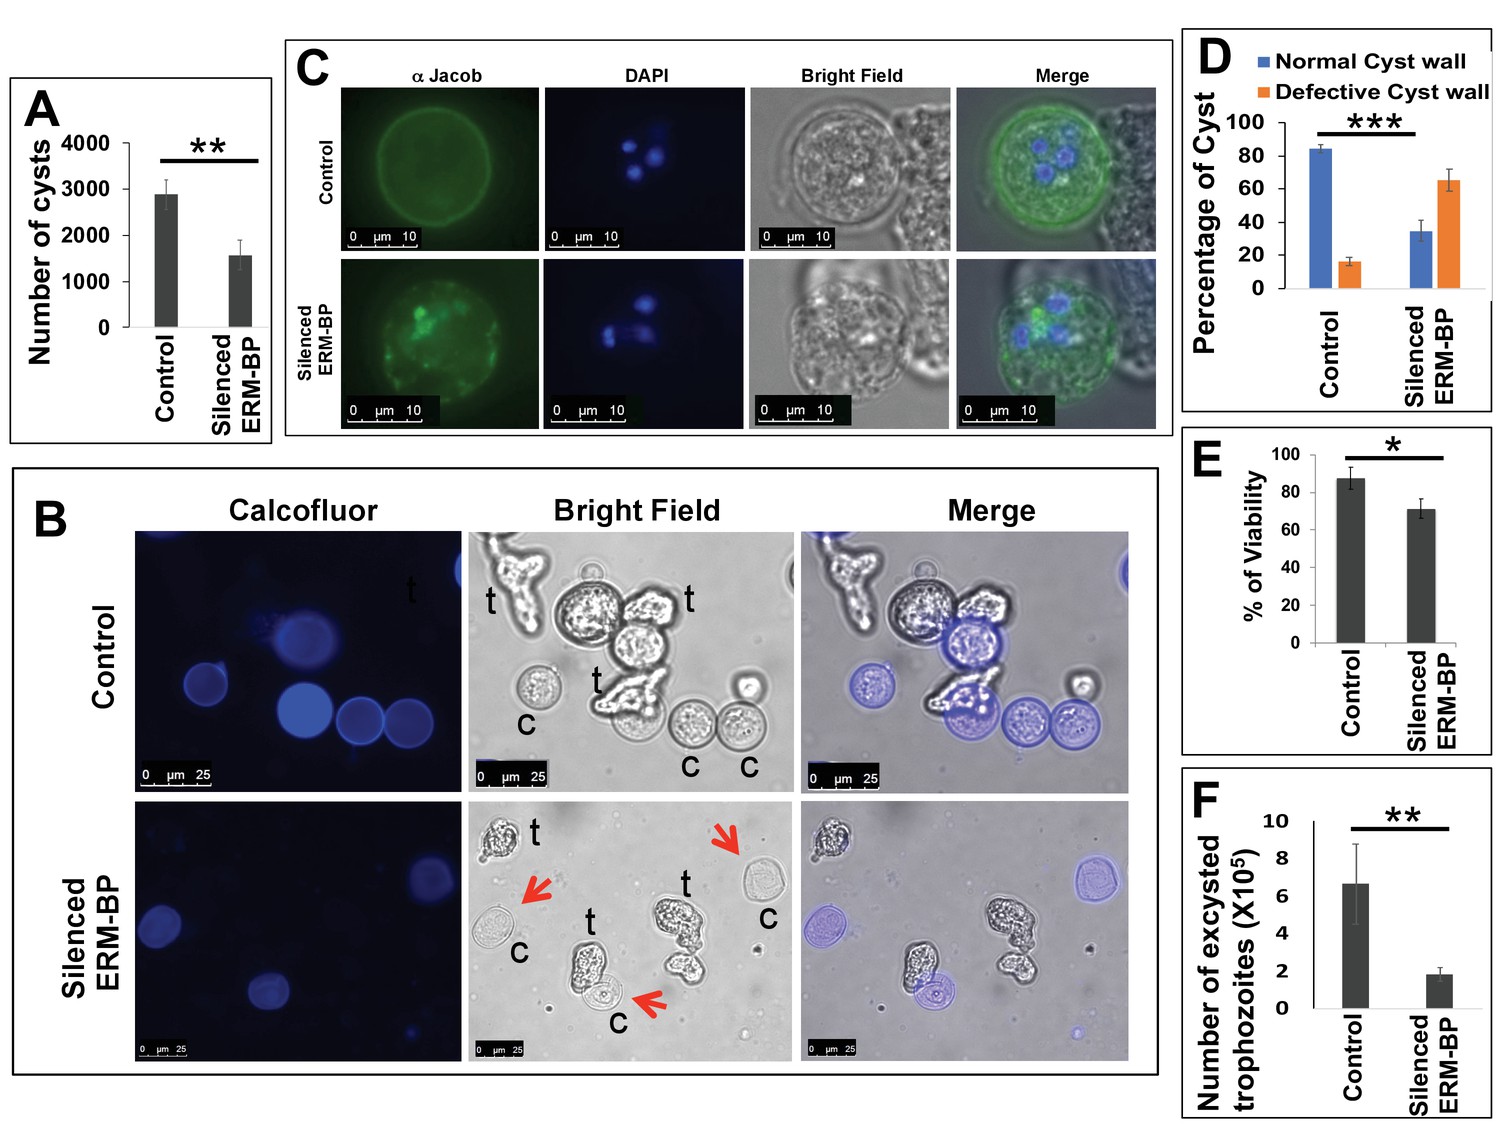
Silencing ERM-BP decreases encystation and leads to formation of ghost like cysts.
(A) Data represents the number of cysts in control and silenced-ERM-BP cell lines after 72 hr of encystation. The number of cysts in control parasites was compared to silenced ERM-BP by calcofluor staining and analyzed by ImageXpress (equipped with a laser and image-based acquisition) in a 96-well format. A minimum of eight wells per parasite line per experiment were analyzed, and biological replicate experiments were performed on three independent days. Data are mean ± s.e. (n = 3) Student’s t-test; **p<0.01. (B) Control and silenced-ERM-BP cells were encysted for 72 hr and cells were stained with calcofluor white (Blue) and imaged. Red arrows point to ghost like cysts; trophozoites are marked as ‘t’ and cysts as ‘c’. Scale bar, 25 μm. (C) Control and silenced-ERM-BP cysts (72 hr) were stained with anti-Jacob antibody followed by Alexa-488 conjugated secondary antibody (Green) and DNA was stained with DAPI (Blue). Scale bar 10 μm. (D) Percentage of cysts with defective cyst wall are determined by staining with anti-Jacob antibody in the control and ERM-BP silenced cell lines. Data are mean ±s.d. (n = 3) Student’s t-test; ***p<0.002. (E) Percent viability of 72 hr encysted silenced-ERM-BP and control cells was determined by FDA fluorescence. Data are mean ±s.d. (n = 3) Student’s t-test; *p<0.05. (F) The number of excysted trophozoites in silenced-ERM-BP and control cell lines. Data are mean ±s.d. (n = 3) Student’s t-test; **p<0.01.
Figure 4—figure supplement 1
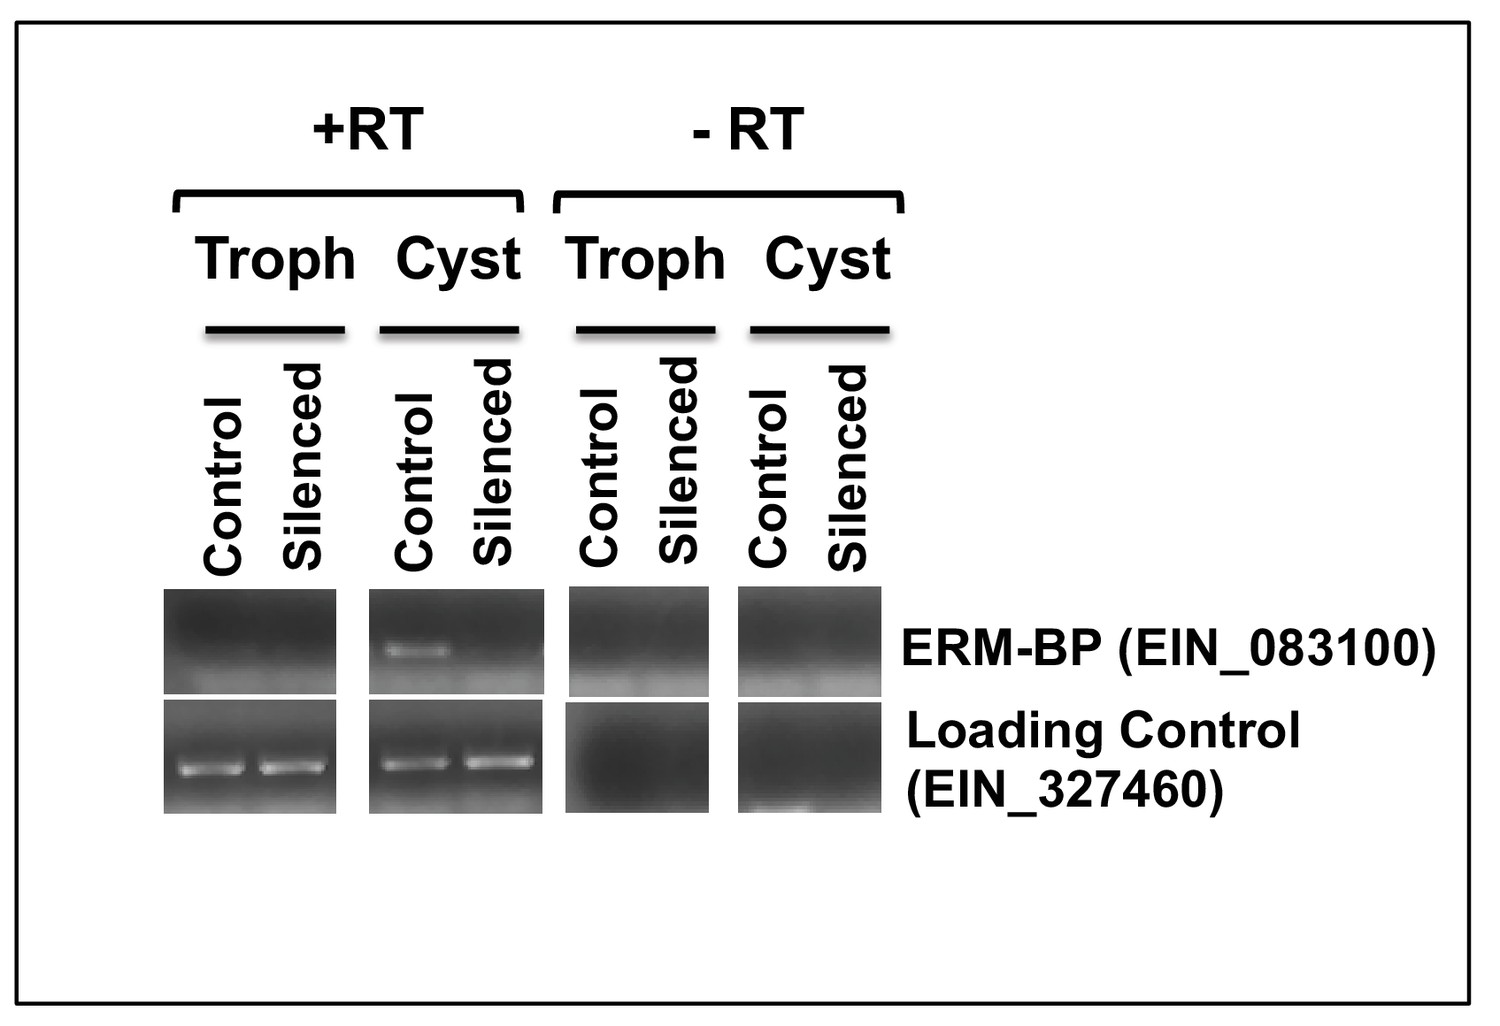
ERM-BP silencing using an RNAi-Trigger approach.
RT-PCR was performed to detect ERM-BP (EIN_083100) transcript level in control and silenced-ERM-BP cell lines (maintained at G418, 80 μg ml-1) from both trophozoites and 24 hr cyst with a loading control (EIN_327460).
Figure 4—figure supplement 2
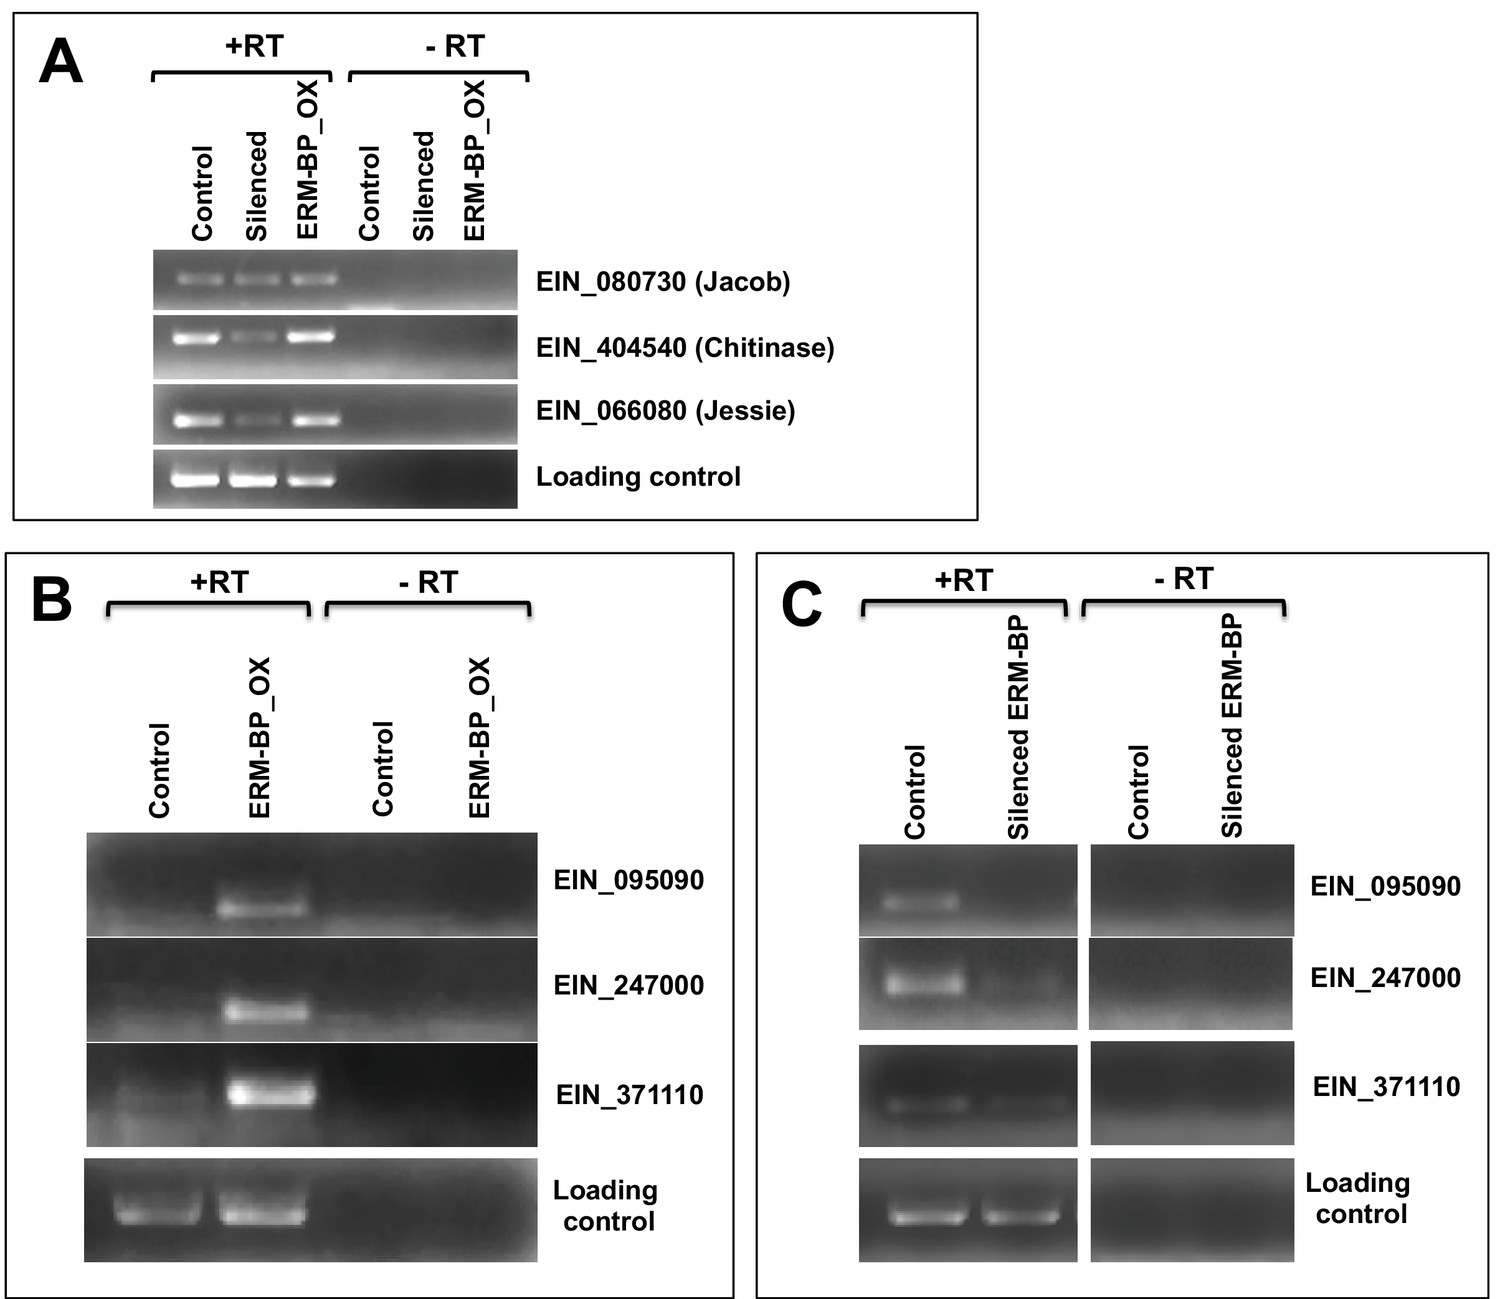
ERM-BP regulates the expression of target genes.
(A) RT-PCR was performed to detect the expression of cyst-wall-specific genes (e.g. Jacob, Chitinase and Jessie) in control, silenced-ERM-BP and ERM-BP_OX cell lines. (B) RT-PCR in control trophozoites and ERM-BP_OX trophozoites were performed for three target genes (EIN_095090, EIN_247000 and EIN_371110) having ERM in their promoter. (C) RT-PCR in control cysts and silenced ERM-BP cysts were done for same target genes (EIN_095090, EIN_247000 and EIN_371110).
Figure 5 with 2 supplements
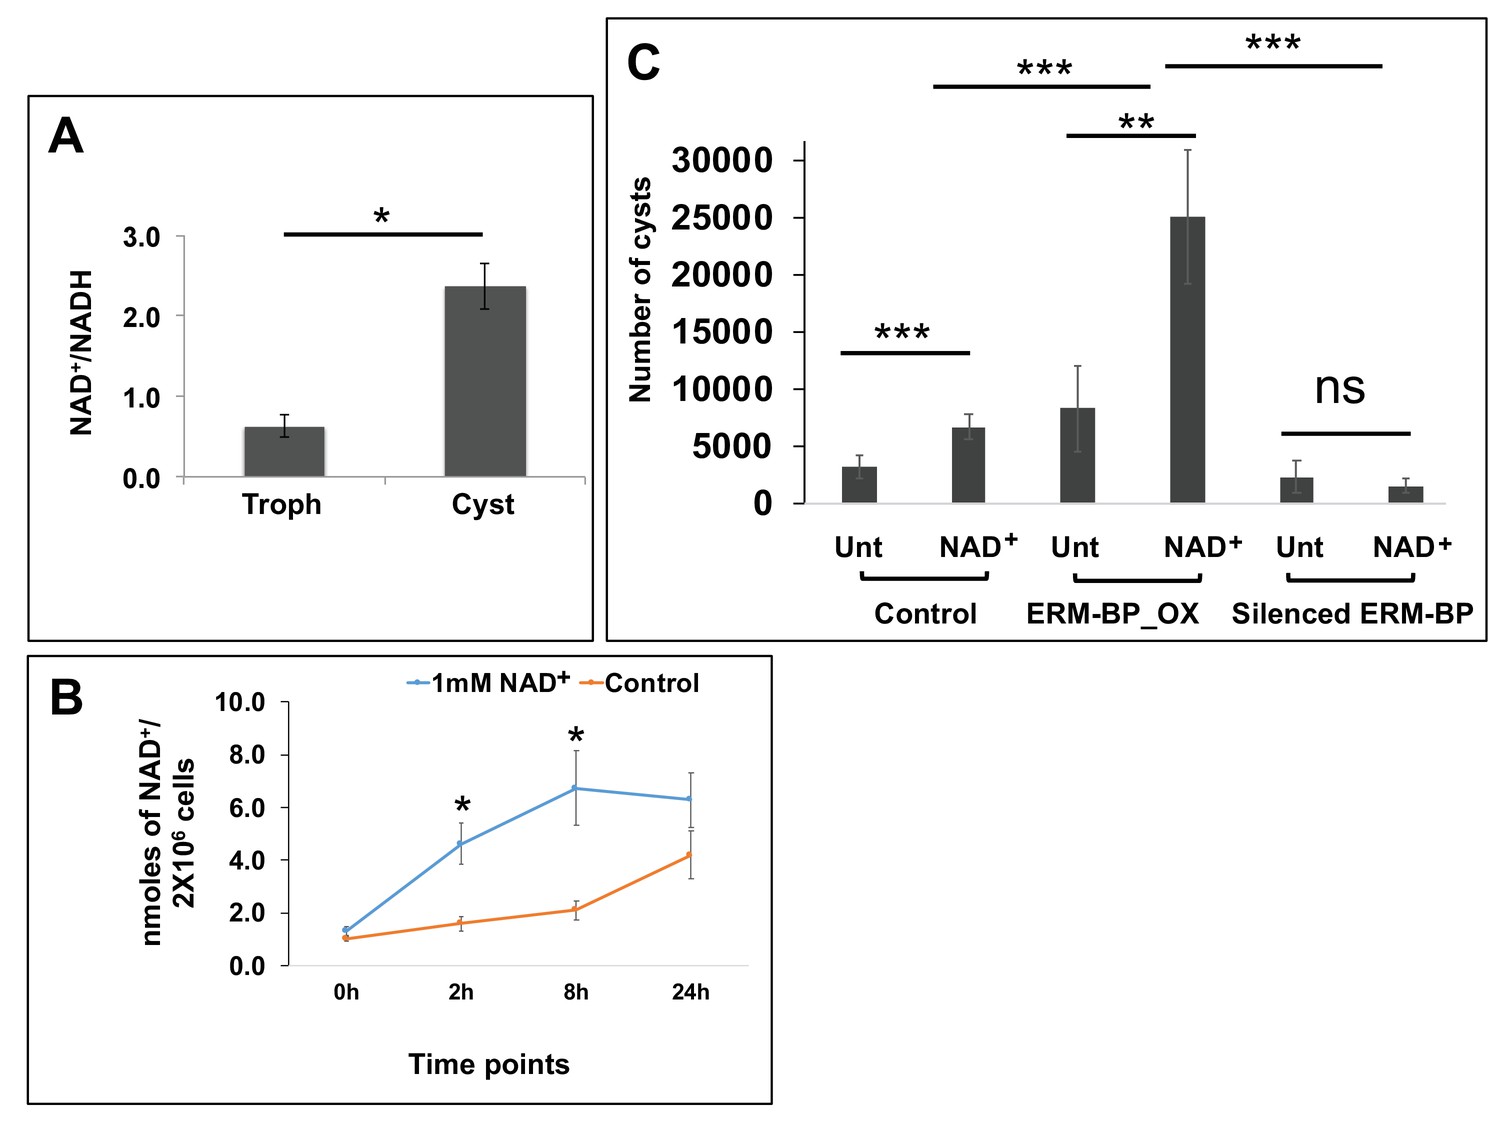
Intracellular NAD+/NADH is elevated during encystation and NAD+ facilitates encystation.
(A) Measurement of intracellular NAD+/NADH in trophozoites (Troph) and 72 hr of cysts. Data are mean ±s.d. (n = 3) Student’s t-test; *p<0.05. (B) Intracellular NAD+ was detected from Entamoeba cells treated with 1 mM of NAD+ or untreated control at different time points. Data represents mean ±s.d. (n = 3) Student’s t-test; *p<0.05. (C) The number of cysts in 1 mM NAD+ treated (NAD+) or untreated (Unt) Control, ERM-BP_OX and Silenced ERM-BP cells are shown. Data are mean ±s.d. (n = 3) Student’s t-test; **p<0.01, ***p<0.001.
Figure 5—figure supplement 1
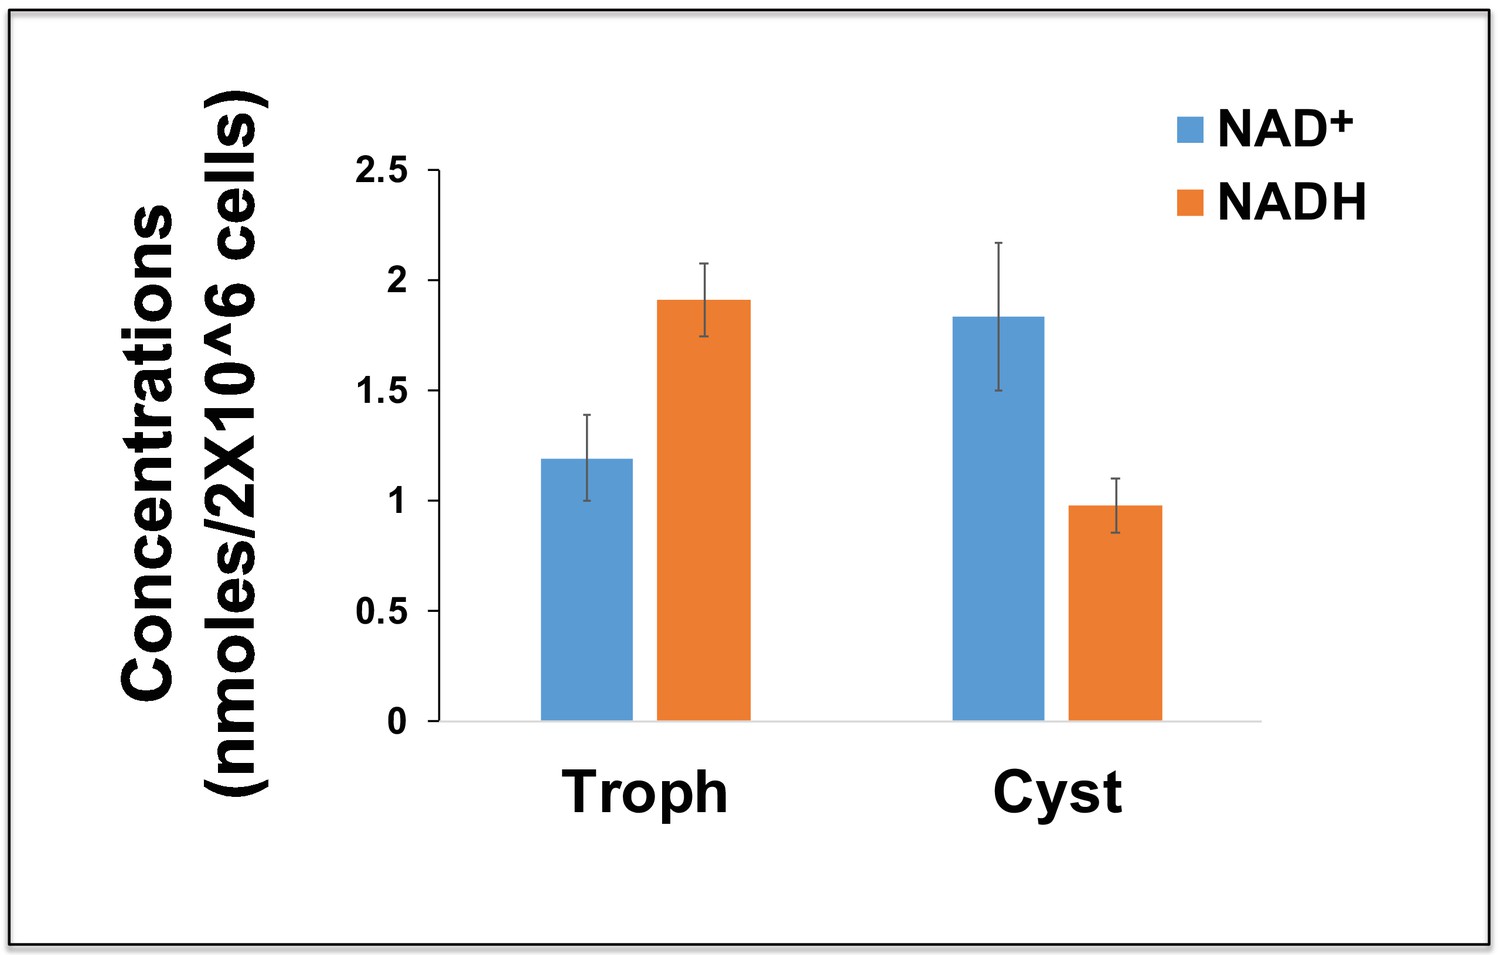
Intracellular NAD+ and NADH in trophozoites and sarkosyl resistant cysts.
The graph represents the actual concentrations of NAD+ and NADH in trophozoites (Trophs) and sarkosyl-resistant cysts in nmoles, per 2 × 10⁶ cells. Data are mean ±s.d. (n = 3) Student’s t-test; *p<0.05.
Figure 5—figure supplement 2
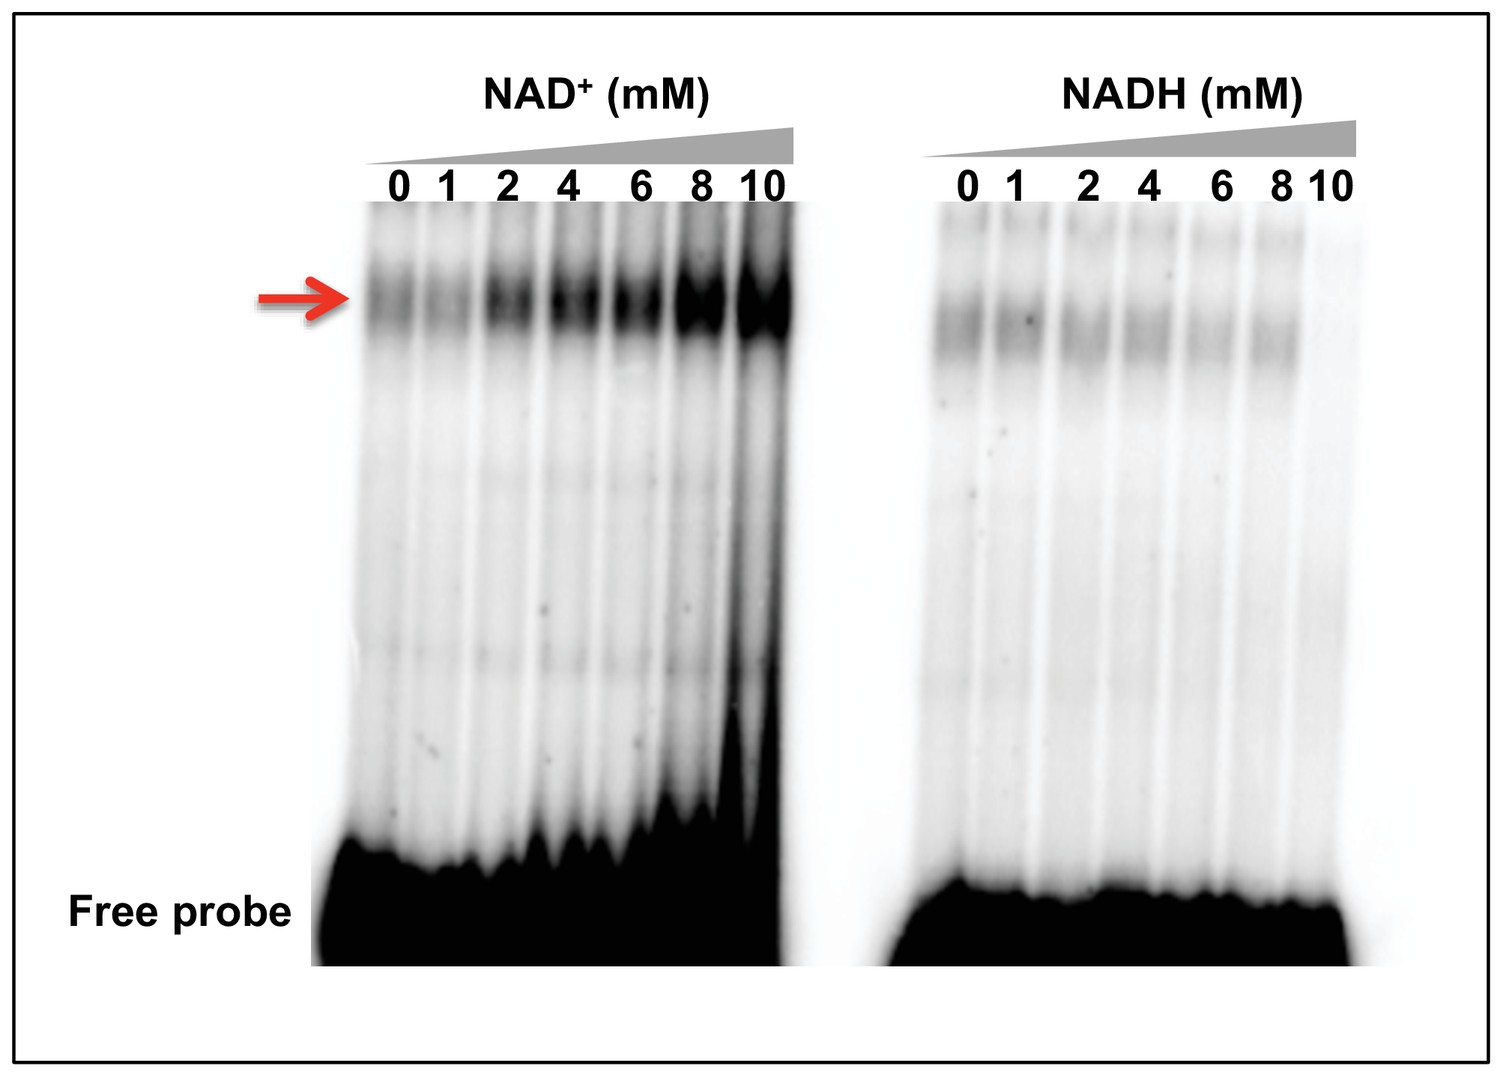
NAD+ but not NADH facilitates DNA binding.
Representative EMSA results with recombinant ERM-BP and radiolabeled ERM in presence of different concentrations of NAD+ or NADH (0, 1, 2, 4, 6, 8 and 10 mM). Gel shifted bands are shown by red arrow.
Figure 6 with 3 supplements
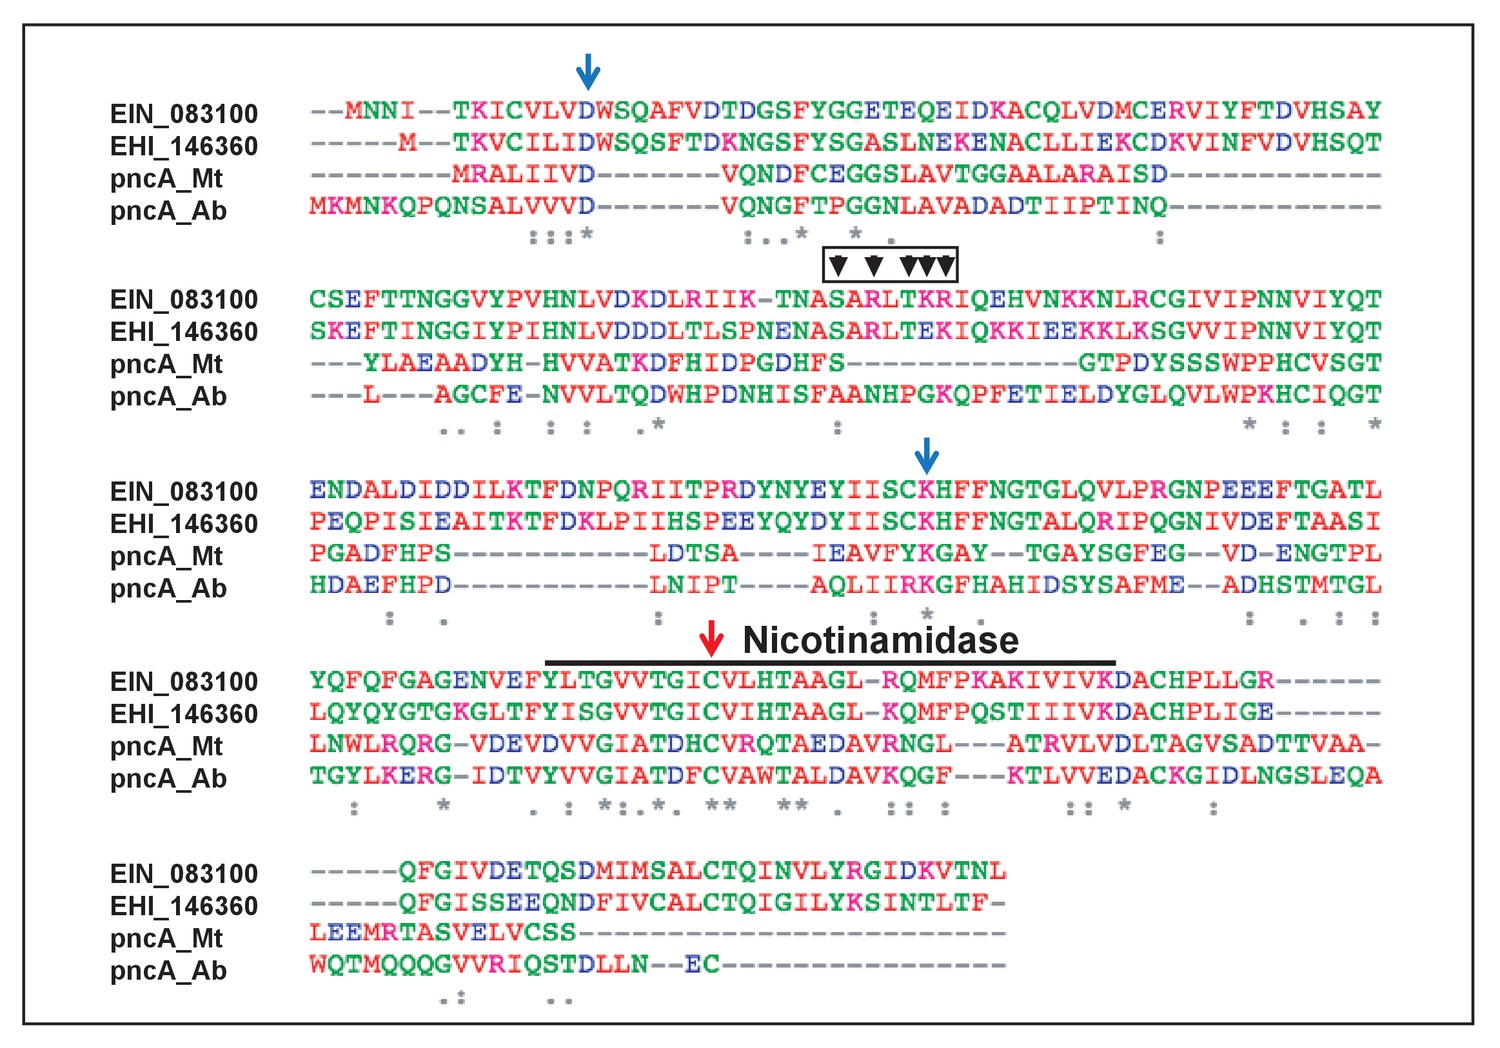
Protein sequence alignment and residues in ERM-BP important for NAM binding and catalytic activity.
Protein sequence alignment of ERM-BP from two Entamoeba species (E. invadens- EIN_083100 and E. histolytica- EHI_146360) and bacterial nicotinamidase (pncA) from Mycobacterium tuberculosis (Mt) and Acinetobacter baumanii (Ab) are shown. The nicotinamidase domain is underlined and the key residues involved in nicotinamide (NAM) binding and catalysis are shown by arrows. Mutants are generated by changing each relevant residue into an Alanine. The mutants are D12A, K150A, and C198A. The predicted DNA-binding region and residues are shown by arrowheads with a red box as five amino acids cluster (SARLTKR) except subscripts-A and L. An ERM-BP-DBM was generated by changing all five predicted amino acids into Alanine using the Gibson assembly method.
Figure 6—figure supplement 1
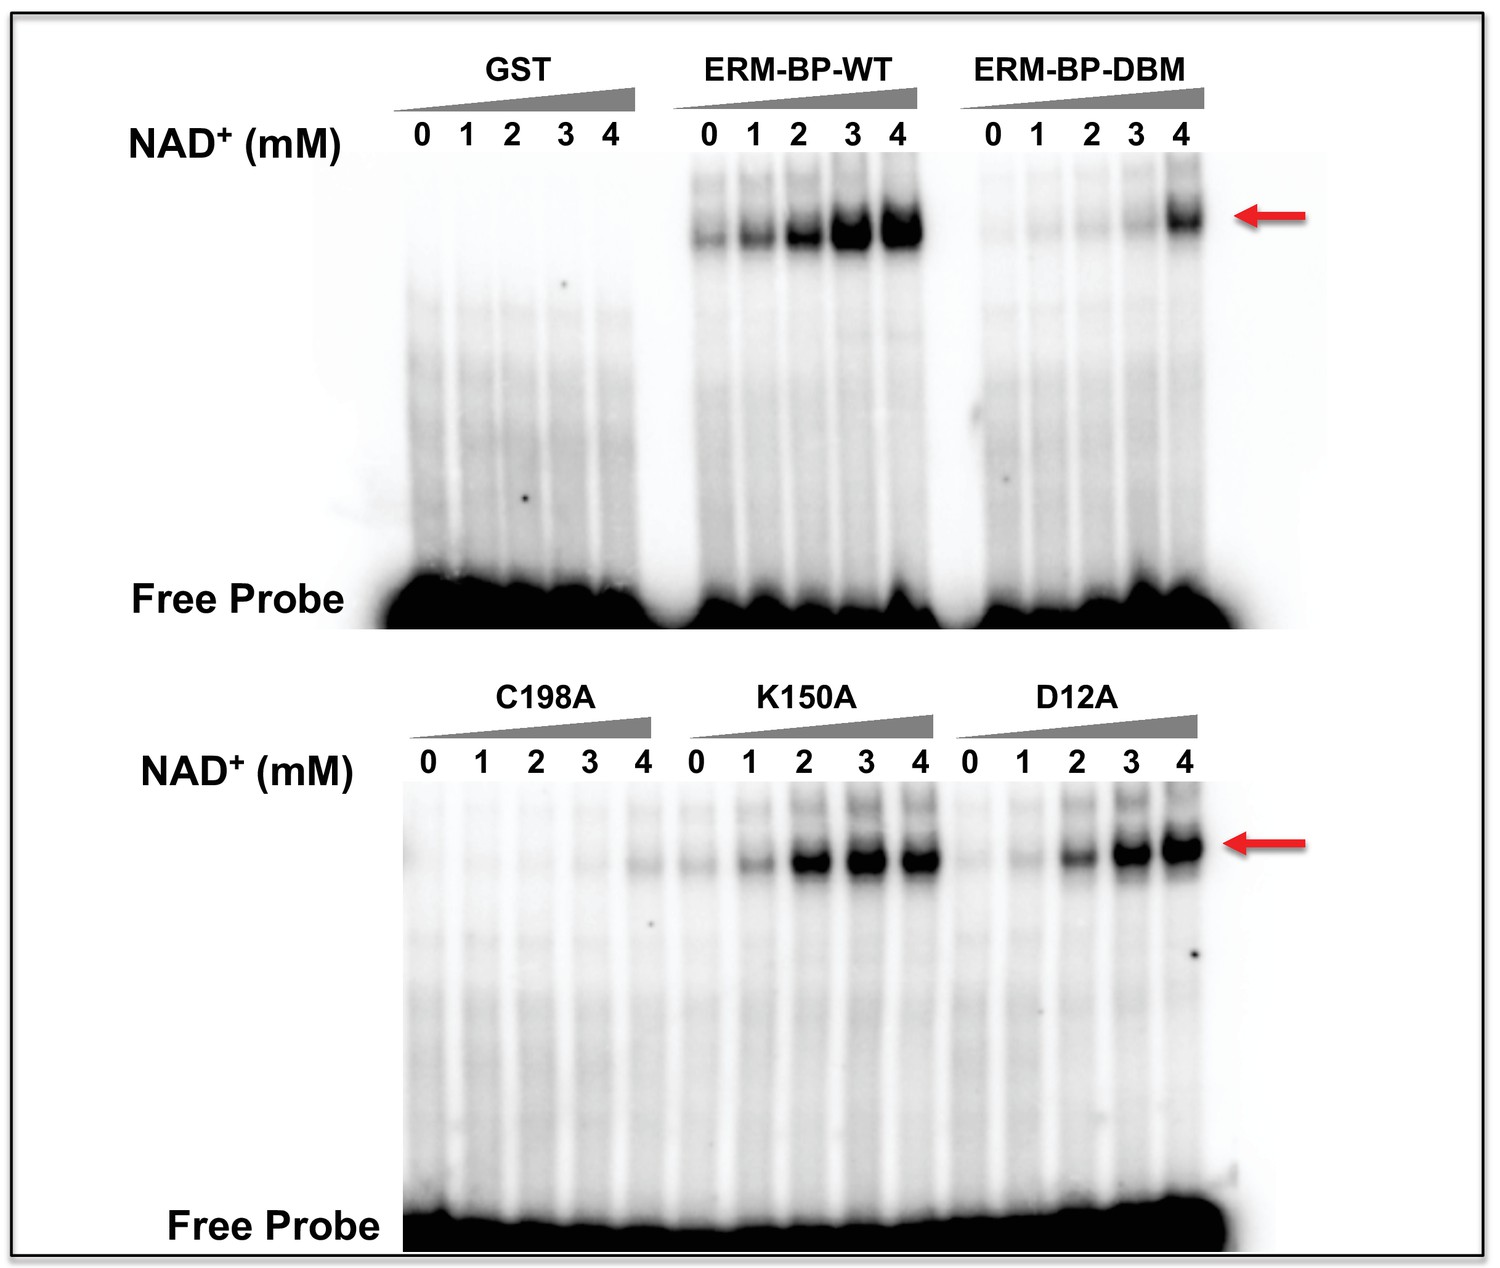
EMSA with recombinant proteins in the presence of varying concentrations of NAD+.
Representative EMSA results by using recombinant ERM-BP-WT and mutant proteins (ERM-BP-DBM, C198A, K150A and D12A) with radiolabeled ERM in presence of different concentrations of NAD+ (0, 1, 2, 3 and 4 mM). EMSA shifted bands are shown by red arrows and free probes at the bottom. GST was used as negative control.
Figure 6—figure supplement 2
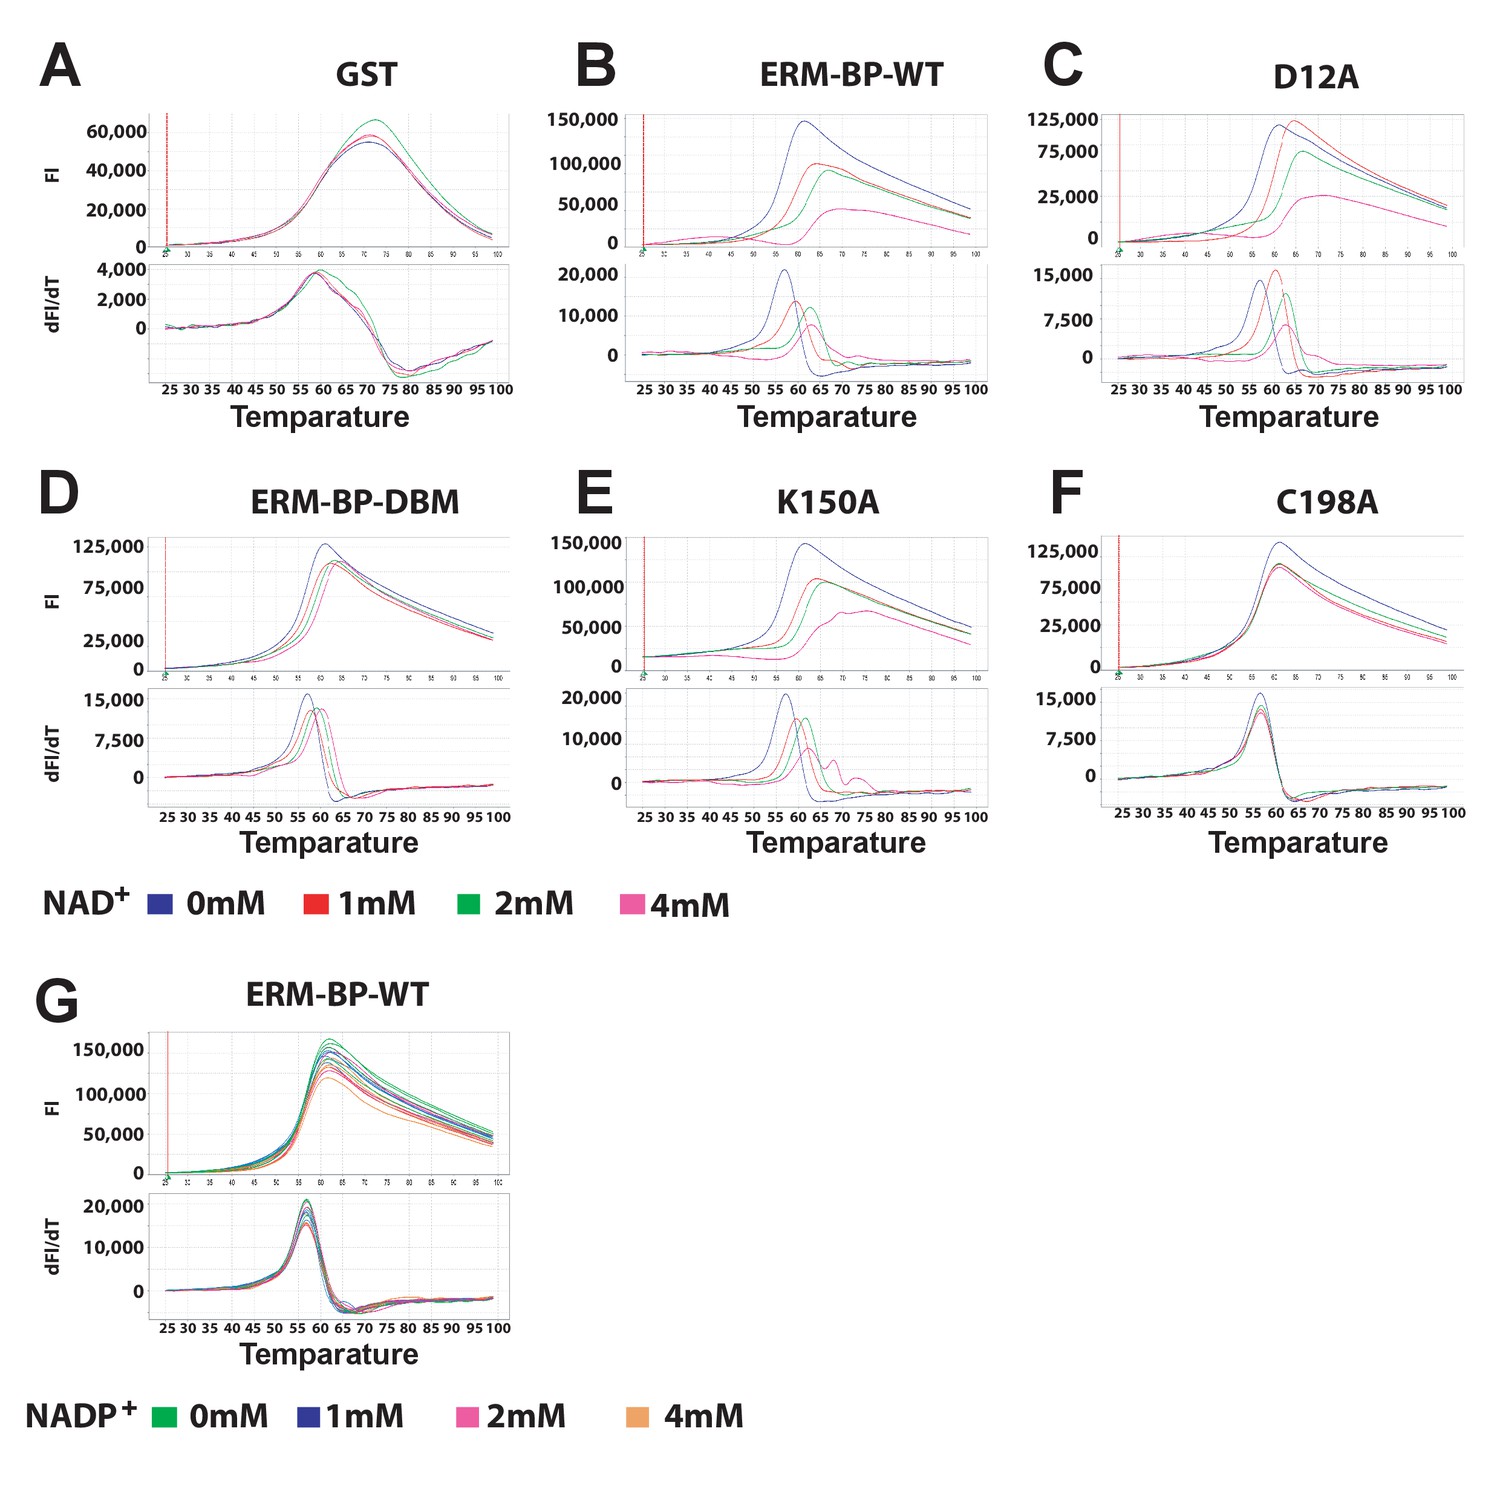
Thermal stability of ERM-BP-WT and mutants in presence of different concentrations of NAD+.
The fluorescence intensity (FI) at varying temperatures (upper panel) and derivative melt curves calculated by differences in FI at each temperature (lower panel) are shown. Peak temperature in the lower panel of graph dFl/dT is considered as Tm. The recombinant proteins are (A) GST, (B) ERM-BP-WT, (C) D12A, (D) ERM-BP-DBM, (E) K12A and (F) C198A. Different concentrations of NAD+ were used as indicated as 0 mM (blue), 1 mM (red), 2 mM (green) and 4 mM (pink). Experiments were done in quadruplicate for each NAD+ concentration for each protein and in three independent experiments. Representative thermal shift assay is shown from one experiment. (G) Thermal stability assay of ERM-BP-WT with different amounts of NADP as indicated 0 mM (green), 1 mM (blue), 2 mM (pink) and 4 mM (orange) in quadruplicate for each NADP concentration.
Figure 6—figure supplement 3

Enzymatic activity of ERM-BP-WT and mutants.
The graph represents percentage of nicotinamide turn over into nicotinic acid by ERM-BP-WT and mutant recombinant proteins. Bacterial PncA was used as positive control and GST as a negative control. Data are mean ±s.d. (n = 3). The catalytic activities of the wild type (WT) ERM-BP and mutant recombinant proteins were determined by HPLC analysis. Bacterial nicotinamidase (PncA) was used as positive control with 100% conversion; GST was a negative control with 0% conversion. LC-traces are shown as a representative example from one experiment out of three independent experiments.
Figure 7

Proposed model for the role of ERM-BP in encystation.
The transcription factor ERM-BP binds to NAD+ and undergoes a conformational change, which facilitates the binding to the CAACAAA motif in the promoter of cyst-specific genes. ERM-BP also catalyzes nicotinamide (NAM) into nicotinic acid (NA), which may act as a second messenger and might have role in encystation. Another possibility is that nicotinic acid may be converted back to NAD+ via a salvage pathway and can then bind to ERM-BP and regulate encystation. Together these functions of ERM-BP control the encystation process in Entamoeba.
Tables
Table 1
Summary of proteins identified by LC-MS and confirmation.
Six proteins were identified in all three experiments as enriched in the ERM-WT sample and shown here with Gene ID and annotations. All six proteins were expressed in bacteria and the only recombinant protein (EIN_083100) bind to ERM. Three proteins were expressed in E. invadens and their localization in the parasite is summarized. ‘*’ indicates the genes which are stage specifically expressed and upregulated during encystation and ‘ND’ indicates ‘not done’.
| No | Gene ID | Proteins | Recombinant protein bind to ERM | Overexpression in Amoeba | Localization |
|---|---|---|---|---|---|
| 1 | EIN_212680 | WD-repeat protein | No | Yes | Cytoplasm |
| 2 | EIN_192460 | hypothetical | No | ND | |
| 3 | EIN_224750 | Protein-tyrosine phosphatase | No | ND | |
| 4 | EIN_224120 | Hypothetical | No | Yes | Cytoplasm |
| *5 | EIN_083100 | Hypothetical | Yes | Yes | Nucleus/ Cytoplasm |
| *6 | EIN_024000 | Hypothetical | No | ND |
Table 2
DNA binding, NAD+ binding and catalytic activity of ERM-BP-WT and ERM-BP mutants.
Wild type (WT) and mutant ERM-BP proteins were analyzed by three approaches. DNA binding was determined by EMSA analysis with increasing concentration of NAD+. Protein thermal shift assay was performed to determine NAD+ binding and melting temperature (Tm) in the presence of varying concentration of NAD+ is shown. Nicotinamidase activity was determined by measuring conversion of nicotinamide to nicotinic acid by HPLC.
| Proteins | DNA Binding (EMSA) NAD+ (mM)# | NAD+ Binding (Tm) NAD+ (mM)§ | Nicotinamidase activity (% conversion)¶ | |||||
|---|---|---|---|---|---|---|---|---|
| 0 | 1 | 4 | 0 | 1 | 4 | P-values (0-4) | ||
| 1. GST† | - | - | - | 52 ± 7.0 | 53 ± 7.0 | 51 ± 7.0 | 0.6549 | no conversion |
| 2. ERM-BP-WT‡ | ++ | +++ | ++++ | 57 ± 0.3 | 60 ± 0.7 | 62 ± 1.3 | 1.1E-08 | 52 ± 0.6 |
| 3. D12A‡ | +/- | ++ | +++ | 57 ± 1.0 | 59 ± 1.0 | 62 ± 1.0 | 1.5E-08 | no conversion |
| 4. ERM-BP-DBM‡ | - | - | ++ | 57 ± 0.3 | 58 ± 0.8 | 61 ± 1.0 | 9.9E-09 | 50 ± 2.1 |
| 5. K150A‡ | +/- | ++ | +++ | 58 ± 1.7 | 59 ± 1.0 | 62 ± 11 | 3.7E-05 | no conversion |
| 6. C198A† | - | - | -/+ | 57 ± 0.3 | 57 ± 0.4 | 57 ± 0.5 | 0.3796 | no conversion |
-
# EMSA (Electrophoretic mobility shift assay) with varying amounts of NAD+ (0, 1, 4 mM): ‘++++' indicates strong binding, ‘+++' and ‘++' indicate moderate, ‘+/-' indicates weak binding and '-'“indicates no binding. § NAD+ binding was monitored by protein thermal shift assay with varying amounts of NAD+ (0, 1, 4 mM). The Tm (melting temperature) is shown as mean ±s.d. (n = 3) Student’s t-test; p-values are shown between NAD+ 0 mM and 4 mM concentrations. ¶ The turnover of nicotinamide to nicotinic acid by ERM-BP-WT and mutant recombinant proteins are shown as percentage conversion mean ±s.d. (n = 3). ‡ Indicates having significant effects in DNA /NAD+ binding and catalytic activity, † Indicates not having significant effects in DNA/NAD+ binding and catalytic activity.
Table 3
Summary of DNA binding, NAD binding and enzymatic activity of wild type and mutant versions of ERM-BP are shown.
DNA binding, NAD+ binding and enzymatic activity of ERM-BP-WT and ERM-BP mutants are summarized. ‘+' indicates binding or having enzymatic activity and '-' indicates no binding or no activity.
| Proteins | DNA Binding | NAD+ binding | Enzymatic activity |
|---|---|---|---|
| ERM-BP-WT | + | + | + |
| D12A | + | + | - |
| ERM-BP-DBM | - | + | + |
| K150A | + | + | - |
| C198A | - | - | - |
Additional files
-
Transparent reporting form
- https://doi.org/10.7554/eLife.37912.027
Download links
A two-part list of links to download the article, or parts of the article, in various formats.
Downloads (link to download the article as PDF)
Open citations (links to open the citations from this article in various online reference manager services)
Cite this article (links to download the citations from this article in formats compatible with various reference manager tools)
An NAD+-dependent novel transcription factor controls stage conversion in Entamoeba
eLife 7:e37912.
https://doi.org/10.7554/eLife.37912


