Anisotropic growth is achieved through the additive mechanical effect of material anisotropy and elastic asymmetry
- University of California, Los Angeles, United States
- University of Cambridge, United Kingdom
- Lund University, Sweden
Figures
Figure 1 with 1 supplement
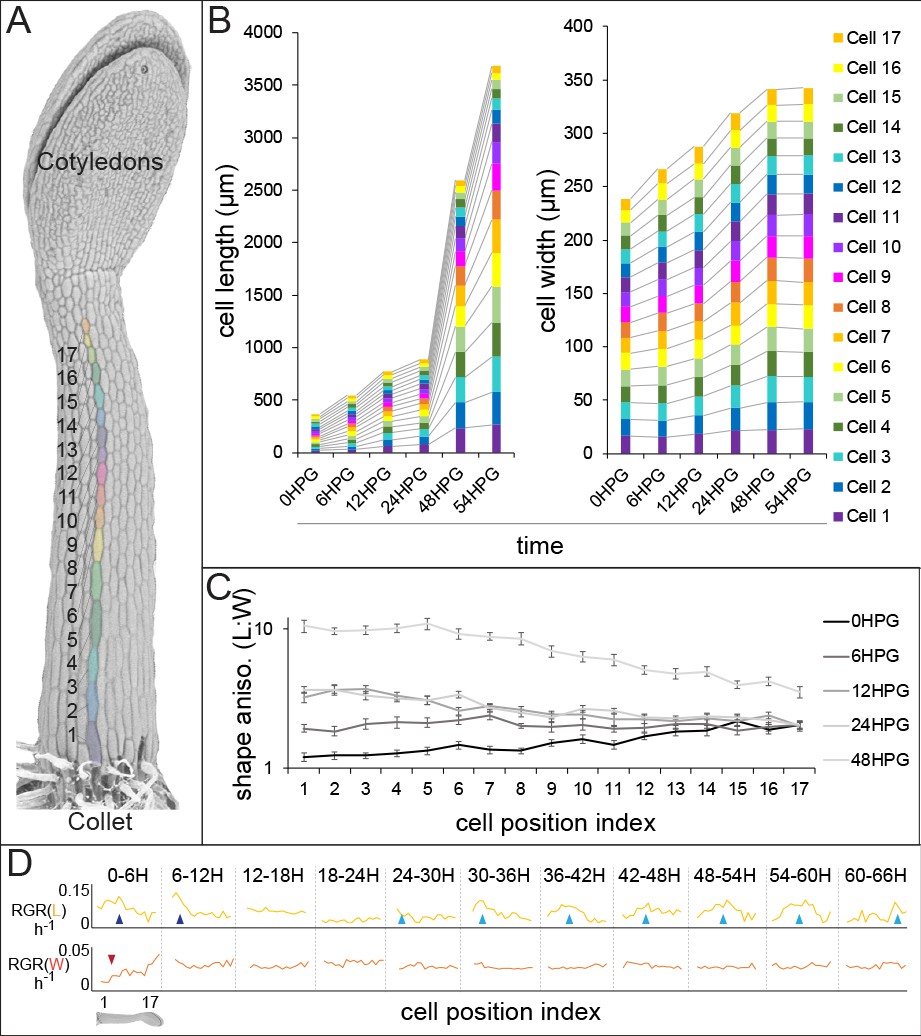
Hypocotyl epidermal cells exhibit a wave of growth in length and not in width.
(A) A scanning electron micrograph of a 24HPG etiolated hypocotyl showing cell indices in a non-dividing cell file, numbered from the collet to the cotyledons. (B) Cell length and width by cell position index displayed from 0-54HPG. (C) Cell shape anisotropy (length:width) by cell index from 0-48HPG. (D) Relative growth rates (RGR) for length and width of cells by index from 0-66HPG, in 6H windows. Data in B-D were collected from 20 hypocotyls per time point imaged by confocal microscopy, from at least two non-dividing files per hypocotyl. The data in B are presented without error bars to make visualization possible; standard errors can be found in Figure 1—figure supplement 1. RGR values and standard errors can be found in Supplementary file 1. Blue arrowheads point to early-pulse growth adjacent to the collet, red arrowheads to early growth suppression, light blue arrowheads trace the maximal RGR(L) and proxy the acropetal wave.
Figure 1—figure supplement 1
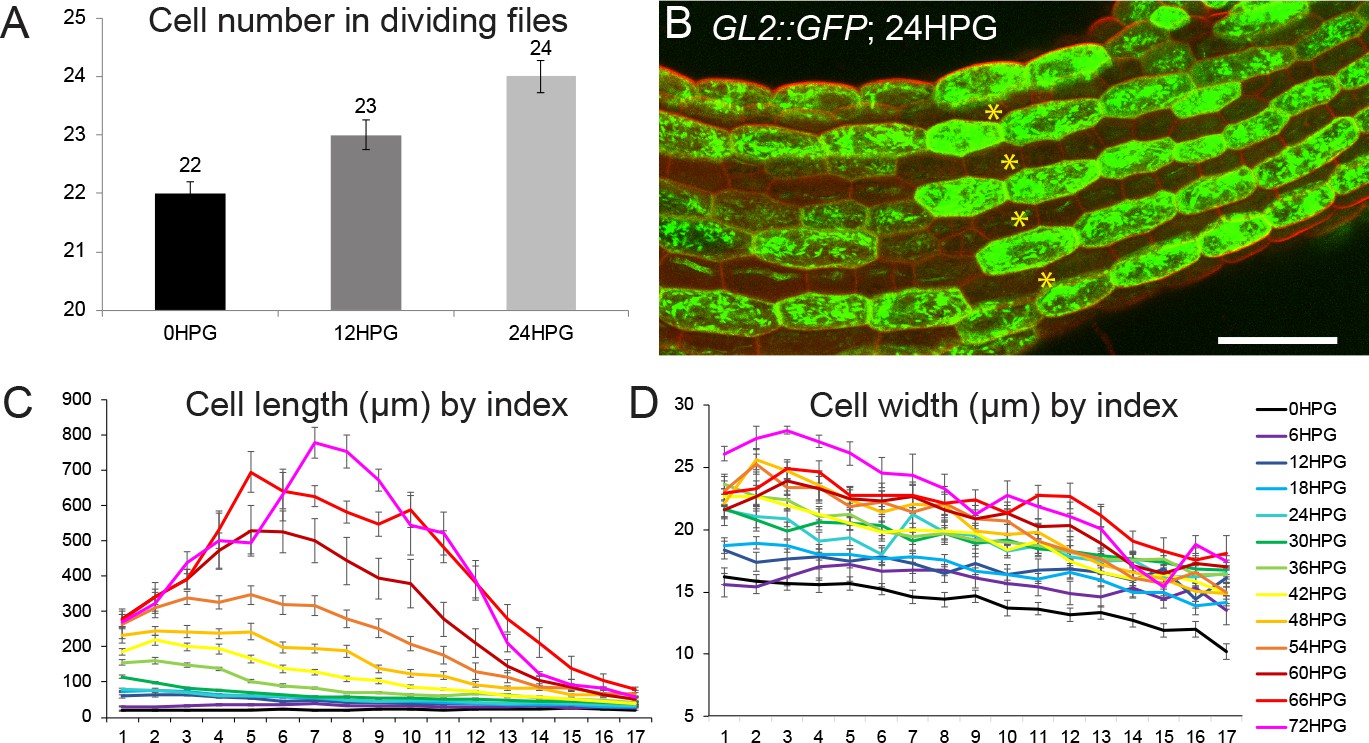
Characterization of dividing and non-dividing cell files and growth in non-dividing files.
(A) cell number in dividing cell files from 0HPG to 24HPG. (B) GL2::GFP expression at 24HPG marking non-dividing cells. Dividing cell files are marked with asterisks. Scale bar = 50 µm. (C) Cell length by position index from 0HPG to 72HPG, including standard error of the means. (D) Cell width by position index from 0HPG to 72HPG, including standard error of the means.
Figure 2 with 1 supplement
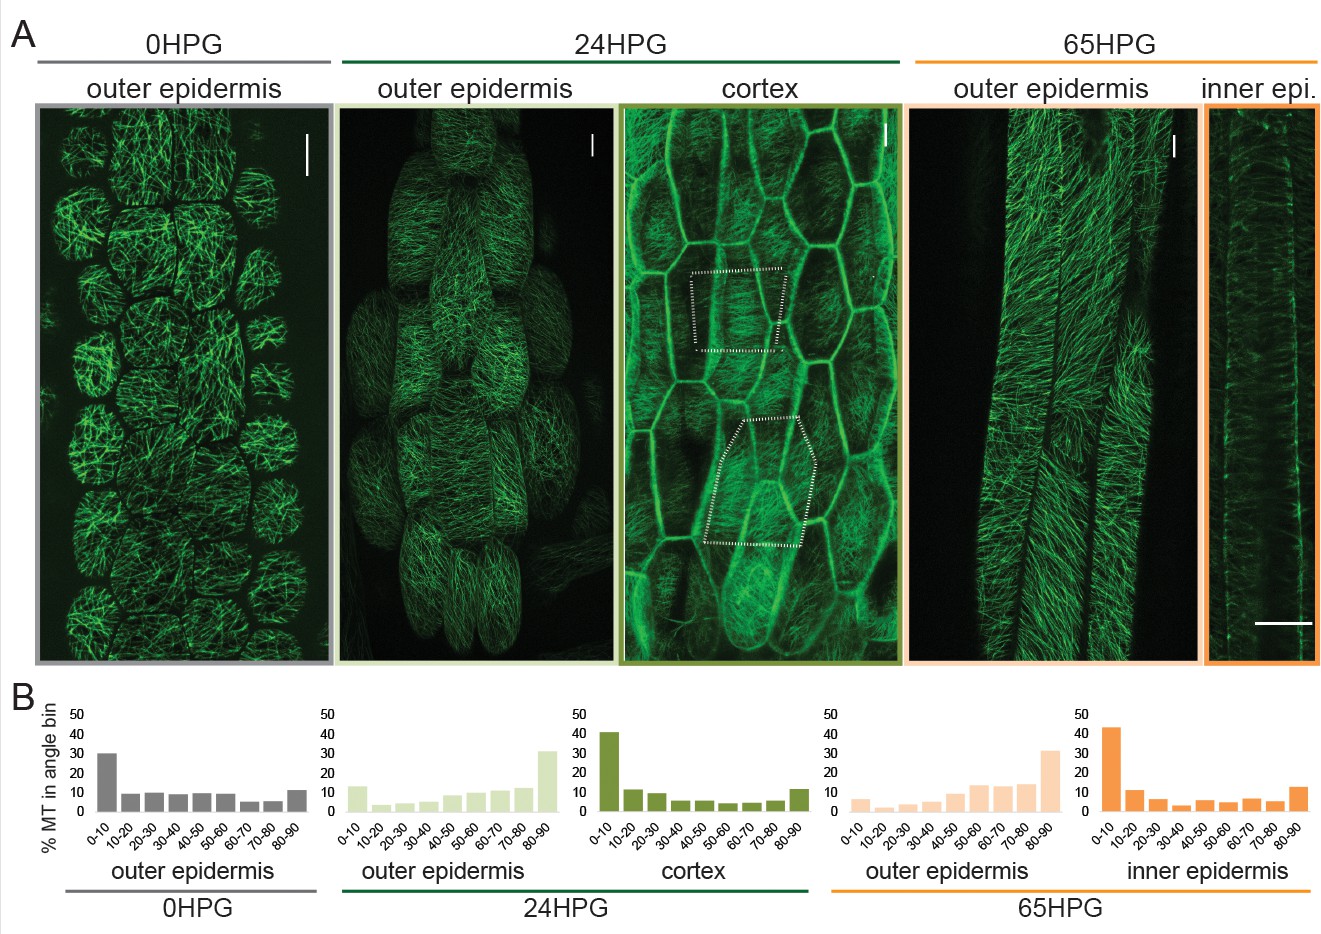
Microtubule alignment is weakly transversely aligned early in hypocotyl growth.
(A) Representative images of microtubule organization as visualized with 35S::GFP-MAP4 at 0HPG, 24HPG and 65HPG. Scale bars = 10 µm. Location of images reported as: outer or inner epidermal face, or cortex. Dotted outlines in cortex image indicate cortex cell outlines. (B) Frequency distribution of microtubule angle grouped in 10 degree intervals from 0HPG to 65HPG using MicroFilament Analyzer (MFA); sample numbers were: 0HPG: n = 65 cells (from 5 hypocotyls); 24HPG: n = 30 (from 9 hypocotyls); 65HPG: n = 13 (from 6 hypocotyls). For 24HPG cortex analysis, n = 36 (from 5 hypocotyls). Examples of MTs at 24HPG outer epidermal faces visualized with 35S::GFP-TUA6, 35S::GFP-EB1 and CESA3::CESA3-GFP are found in Figure 2—figure supplement 1.
Figure 2—figure supplement 1
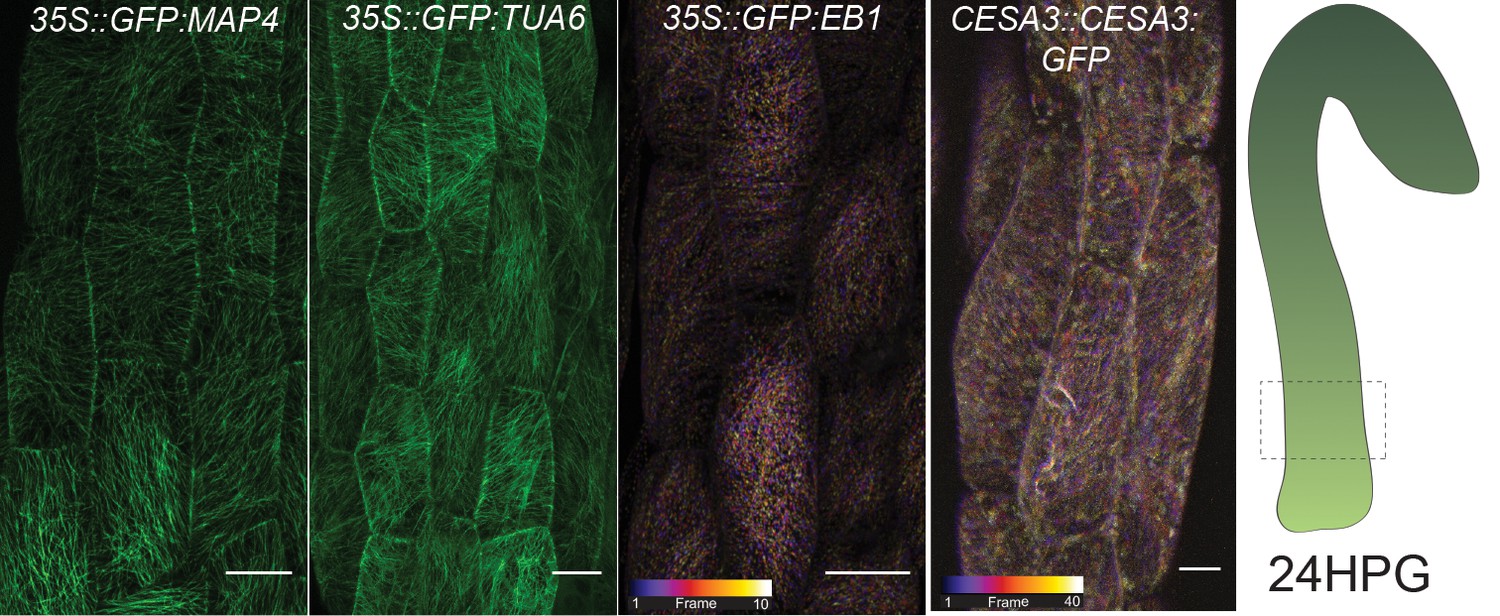
A wider selection of MT markers and CESA3 used for verification.
(A) Microtubule markers and a cellulose synthase marker imaged from bottom cells at 24HPG; outer epidermal face. The markers show similar patterns in microtubule alignment, that is little alignment, to the GFP-MAP4 images in Figure 2. Both EB1 and CESA images are temporal color-coded projections of an xytz acquisition at the base of the hypocotyl with 10 stacks over 4 min 41 s for EB1 and 40 stacks over 9 min 49 s for CESA3; these are dynamic markers. Scale bars = 10 µm.
Figure 3 with 1 supplement
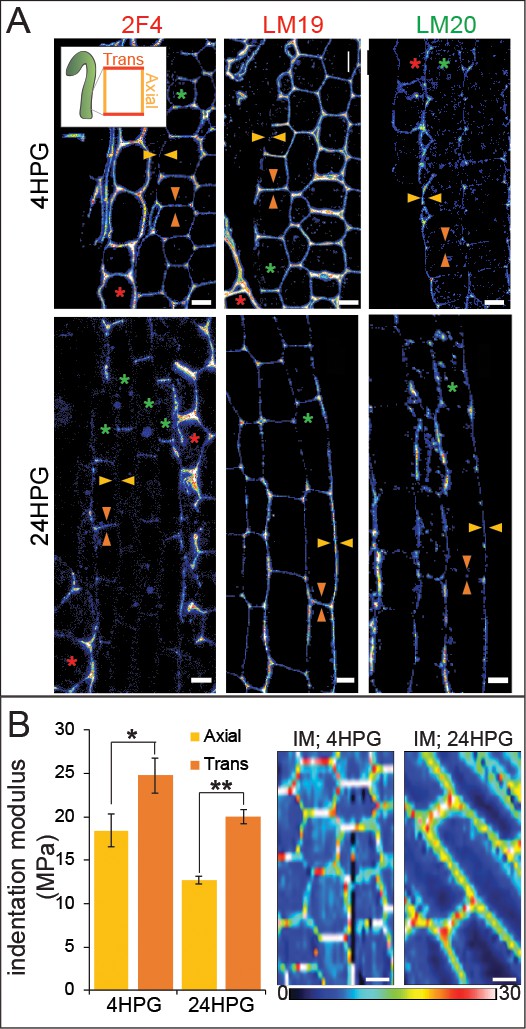
Changes in pectin chemistry underlie cell-level elastic asymmetry from the time of germination.
(A) Representative longitudinal immunolocalization images of pectin methylation state as determined by LM19 (low degree of methylation) and LM20 (high degree of methylation) antibodies at 4HPG and 24HPG. Transverse and axial walls are indicated by orange and gold arrowheads, respectively (inset). Endosperm cells indicated by red asterisk, epidermal cell files by green asterisks. Negative controls for immunolocalizations can be found in Figure 3—figure supplement 1. (B) Representative maps of indentation moduli (IM; MPa) from base cells with representative graph of axial vs transverse IM for hypocotyls, at 4HPG and 24HPG (all replicate data can be found in Figure 3—figure supplement 1); Wilcoxan rank-sum test for significance: single asterisk, p<0.005; double asterisk, p<0.001. Scale bars = 10 µm.
Figure 3—figure supplement 1
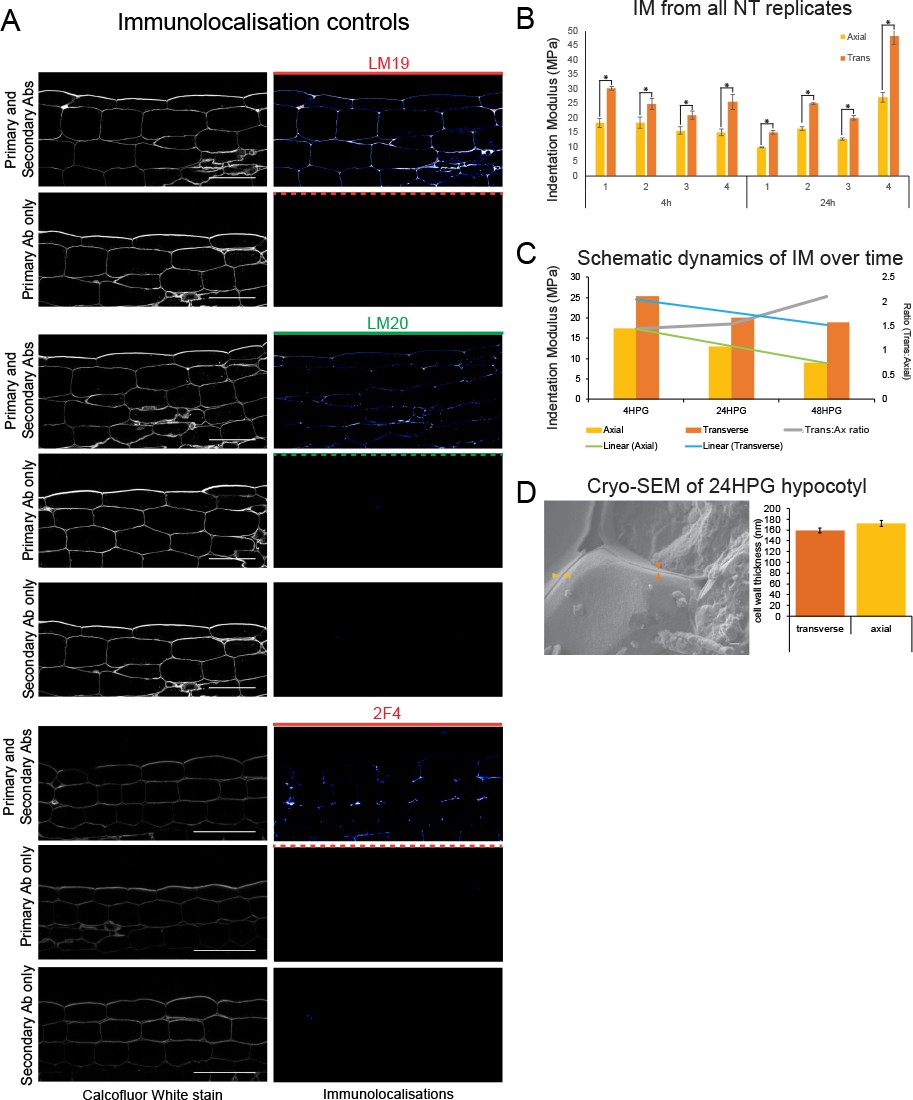
Immunolocalization controls, IM replicates, cryo-SEM.
(A) Longitudinal sections stained with calcofluor white (cell walls) and reacted with various combinations of primary and secondary antibodies. Confocal exposure was kept consistent within each set. Scale bars = 50 µm. (B) Individual sample IMs for 4HPG and 24HPG. (C) Schematic of IM dynamics in time for 4-24-48HPG on axial and transverse walls, with trend lines and ratio (trans:axial) over plots. (D) Cryo-SEM of basal cells in a 24HPG hypocotyl. Orange arrowhead indicates a transverse wall, gold an axial. Cell wall thickness from cryo-SEM data. Scale bar = 1000 nm.
Figure 4 with 1 supplement
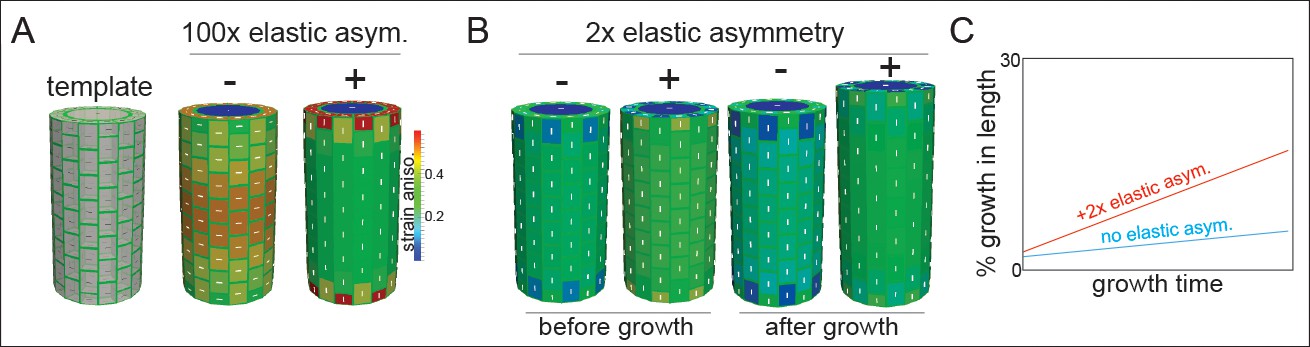
Microtubule alignment and cell elastic asymmetry additively regulate anisotropic growth in silico.
(A) Template for finite element method simulation of a growing hypocotyl epidermis, alongside predicted strain anisotropy (growth) with no anisotropic information and with or without 100x elastic asymmetry added. White lines indicate the maximal stress direction. (B) Pre-growth and after-growth simulation results for a case with material anisotropy information provided by the internal epidermal face. The magnitude of anisotropy is enhanced by the addition of 2-fold elastic asymmetry, resulting in increased growth of the template. (C) Simulation output as percent growth in time from the simulation in (B) showing the increased relative growth achieved by addition of 2-fold elastic asymmetry. Simulation result from simulated internal tissue (cortex) anisotropy can be found in Figure 4—figure supplement 1 alongside results of sensitivity analyses for both simulations.
Figure 4—figure supplement 1
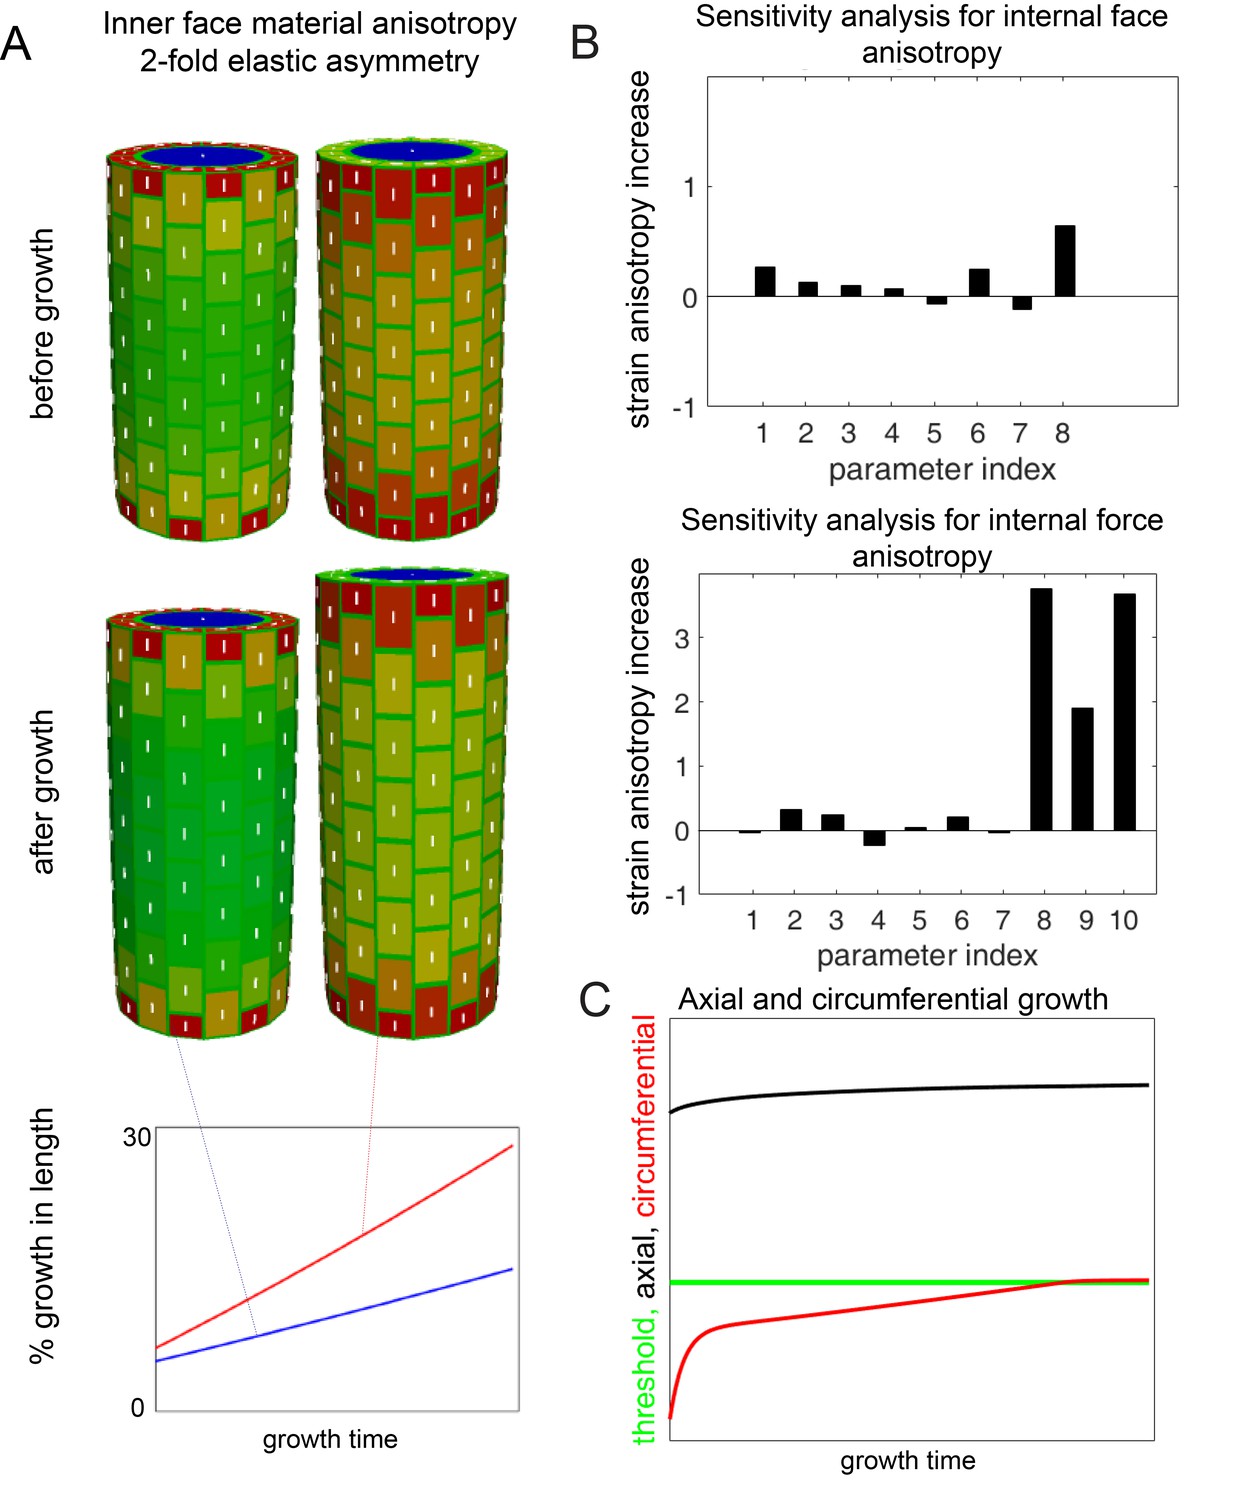
Secondary simulation and sensetivity analyses.
(A) Simulation output before and after growth when an internal force anisotropy is imposed as a proxy for internal tissue anisotropy. Addition of 2X elastic asymmetry enhances the anisotropy (axial growth) over time. (B) Sensitivity analysis for simulation from Figure 4 (proscribed internal wall anisotropy) and the internal force anisotropy simulation in A. The following parameters were varied: (1) depth of L1 layer (anticlinal walls), (2) transverse anticlinal cell wall density, (3) overall stiffness of inner periclinal walls, (4) overall stiffness of outer periclinal walls, (5) overall stiffness of anticlinal walls, (6) asymmetry of anticlinal walls, (7) pressure. In the analysis of internal wall anisotropy we also included (8) mechanical anisotropy of inner periclinal walls. In the analysis of internal force anisotropy we included (8) anisotropy of internal force, (9) anisotropy of internal force when circumferential E is constant, and (10) anisotropy of internal force when axial E is constant. Parameters were varied 10%, and the relative change in strain anisotropy is reported. (C) Axial and circumferential growth from the simulation in Figure 4. The threshold allowing circumferential growth was eventually surpassed if the outer epidermal wall was not given material anisotropy after some initial growth.
Figure 5 with 1 supplement
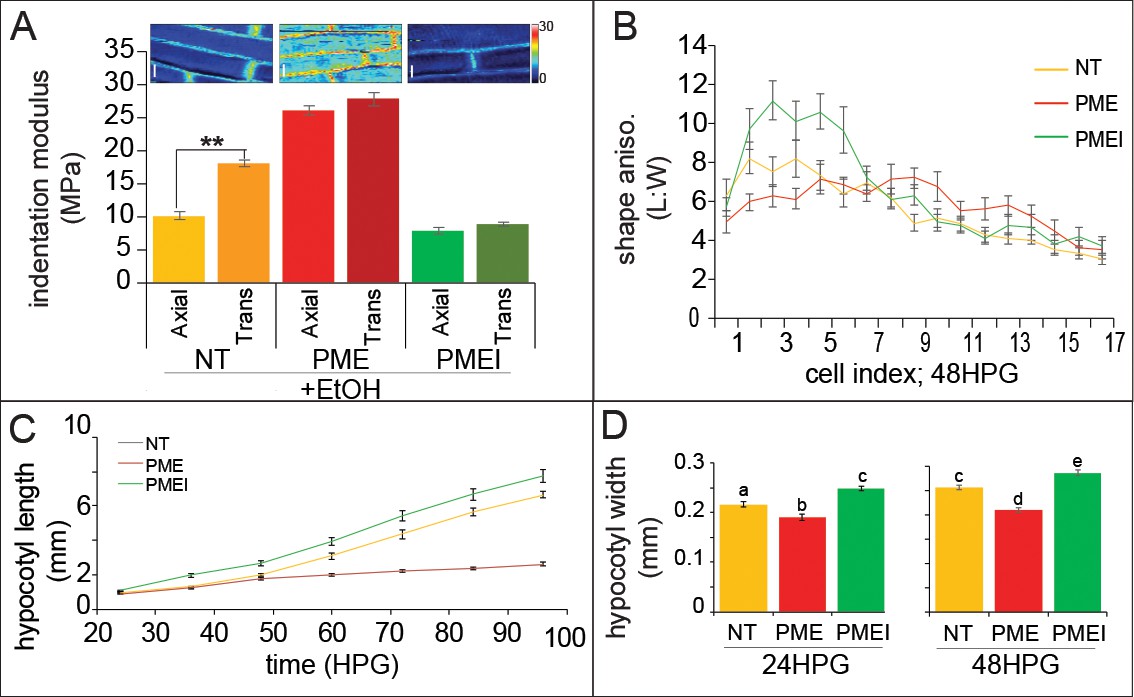
Ectopic alteration of pectin biochemistry alters cell anisotropy and hypocotyl elongation.
(A) Indentation modulus (IM) for ethanol treated non-transgenic (NT, gold), alcA::PME5 (PME, red) and alcA::PMEI3 (PMEI, green) basal hypocotyl cells at 48HPG split into axial and transverse walls; Wilcoxan rank-sum test for significance: double asterisk, p<0.001. Full data set can be found in Figure 5—figure supplement 1. Scale bars = 10 µm. (B) Shape anisotropy (length:width) of cells by position index in NT, PME and PMEI induced seedlings after 48H. See Figure 1 for position indexing. Induction controls and cell level length and width measurements can be found in Figure 5—figure supplement 1. (C) Hypocotyl length at discrete time points, extracted from infrared imaging of hypocotyl growth over time, for induced NT, PME, and PMEI seedlings. At p<0.05 (t-test) all data points in (C) are significantly different except PME and NT at 36HPG and 48HPG. (D) Hypocotyl width of induced NT, PME and PMEI seedlings at 24HPG and 48HPG. a,b,c indicate statistical similarity based on pairwise t-tests (p<0.001).
Figure 5—figure supplement 1
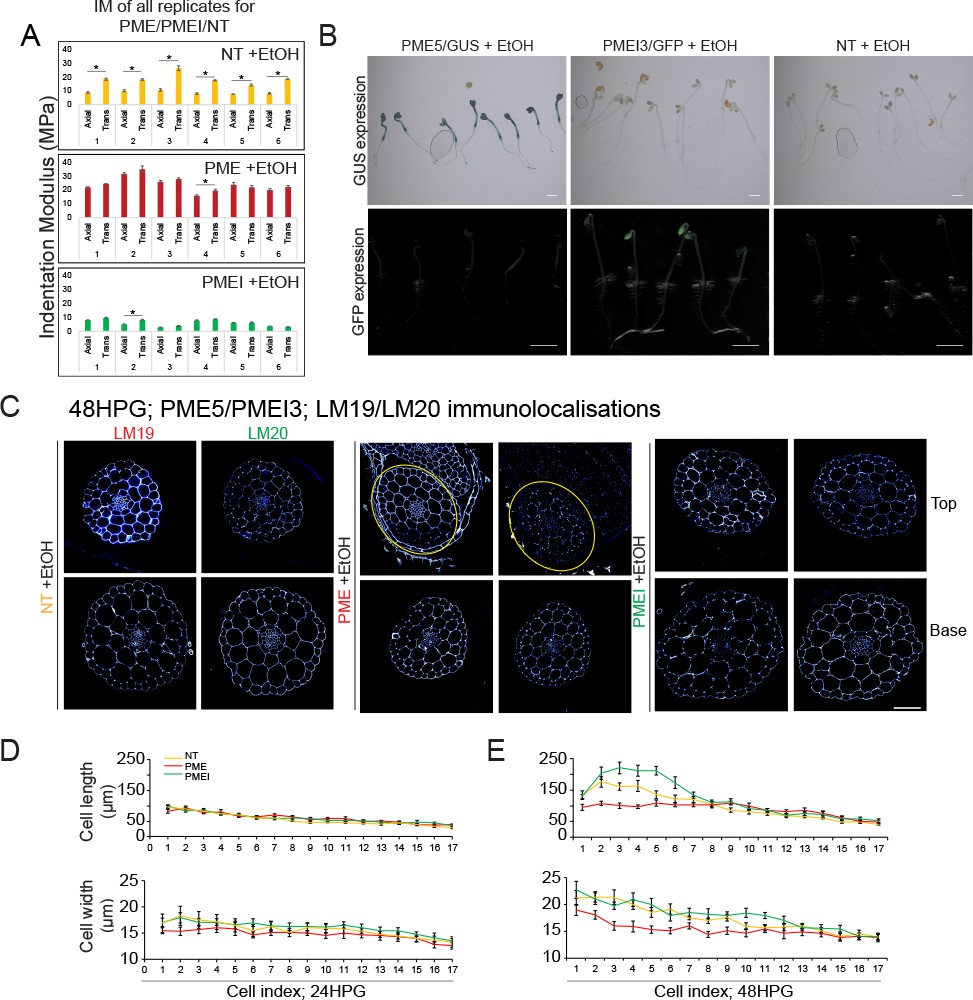
IM, immunolocalizations and induction verification.
(A) IM for all hypocotyls tested with EtOH treatment: NT, PME5, and PMEI3 at 48HPG in basal dark-grown hypocotyl cells. All differences (*) are significant to p<0.001 by Mann-Whitney. (B) Ethanol induction of PME5 and PMEI3 generated 100% penetrance. GUS staining of ethanol treated PME, PMEI, and NT seedlings after germination and induction with ethanol. All the PME seedlings show GUS signal. GFP imaging of ethanol treated PME, PMEI and NT. All the PMEI seedlings show GFP signal. Scale bars = 1000 µm. (C) Transverse immunolocalizations 24HPG after induction in non-transgenic, PME, and PMEI seedlings. Representative immunolocalizations at top and bottom cells of 24HPG hypocotyl with LM19 (low DM) and LM19 (high DM) antibodies. Yellow circles indicate hypocotyl tissue. Scale bar = 50 µm. Cell length and width by cell index position after 24HPG (D) and 48HPG (E).
Figure 6 with 1 supplement
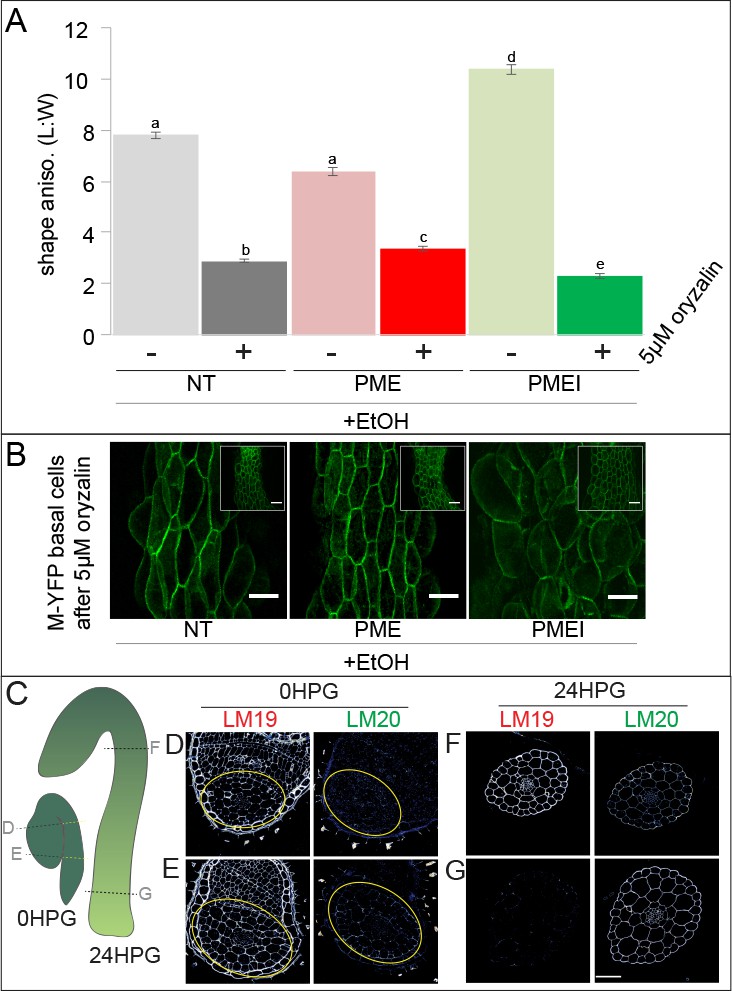
Pectin biochemistry contributes to wall mechanical strength and its changes correlate with the acropetal wave.
(A) Shape anisotropy (length/width) of cells at the bottom of treated and control hypocotyls. Error bars represent the standard error of the mean. All seedlings were treated with the inducer (ethanol; EtOH). Scale bars = 100 µm. a,b,c,d,e indicate similarity based on pairwise t-tests (p<0.005). (B) Representative images of basal cells from NT, PME5 and PMEI3 induced hypocotyls expressing the Myr-YFP membrane marker grown for 48 hr on media containing 5 μM oryzalin. (C) Diagrammatic representation of 0HPG and 24HPG hypocotyls showing the relative positions of transverse sections in D-G. (D–G) Representative immunolocalizations on transverse sections of 0HPG and 24HPG hypocotyls for de-methylated and methylated pectin (LM19 and LM20 respectively). Yellow lines (C) and circles (D,E) demark the hypocotyl where sections included cotyledons. Scale bar = 50 µm. 2F4 immunolocalization at 24HPG may be found in Figure 6—figure supplement 1.
Figure 6—figure supplement 1
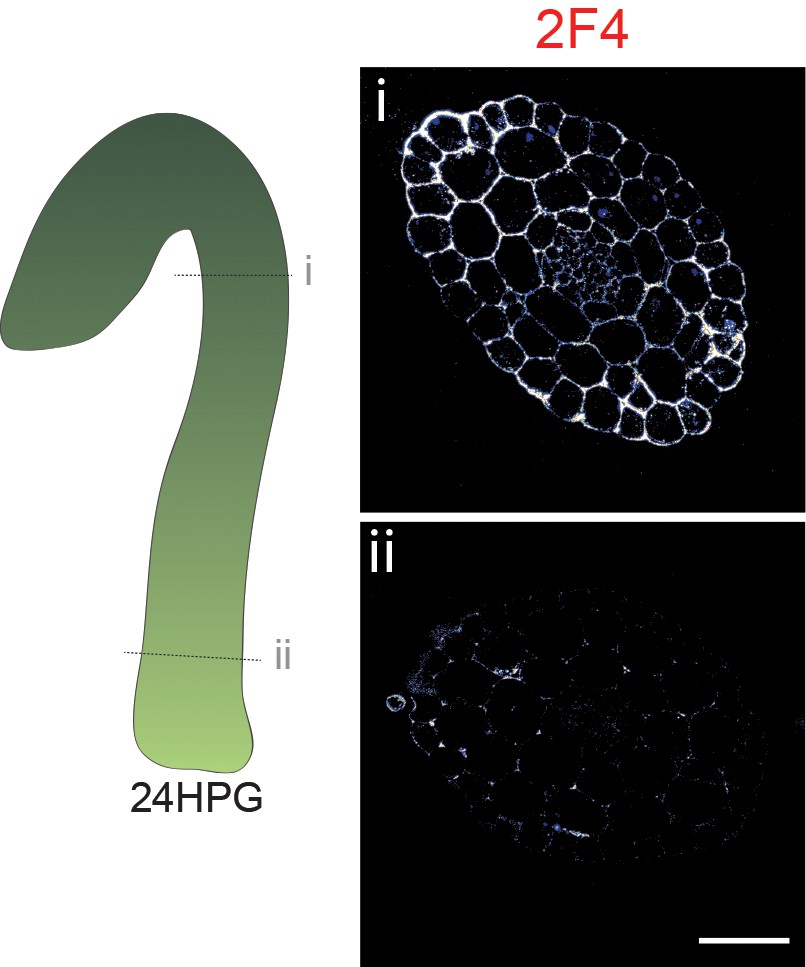
2F4 immunolocalization at 24HPG.
Representative immunolocalizations on transverse sections of 24HPG dark-grown hypocotyl apical (i) and basal (ii) areas.
Tables
Key resources table
| Reagent type (species) or resource | Designation | Source or reference | Identifiers | Additional information |
|---|---|---|---|---|
| Biological sample (Arabidopsis thaliana) | PMEI3 | PMID19097903 | ||
| Biological sample (Arabidopsis thaliana) | PME5 | PMID19097903 | ||
| Biological sample (Arabidopsis thaliana) | GL2::GFP | Nottingham Arabidopsis Stock Center (NASC) | ID_NASC: N66491 | |
| Biological sample (Arabidopsis thaliana) | 35S::GFP-MAP4 | PMID 9811799 | ||
| Biological sample (Arabidopsis thaliana) | 35S::GFP-TUA6 | doi:10.1007/BF01279267 | ||
| Biological sample (Arabidopsis thaliana) | 35S::GFP-EB1 | PMID 14557818;14614826 | ||
| Biological sample (Arabidopsis thaliana) | CESA3::CESA3-GFP | PMID 17878303 | ||
| Biological sample (Arabidopsis thaliana) | Ubq::MYR-YFP | PMID 27212401 | ||
| Antibody | LM19 | Plant Probes, UK | ID_PlantProbes: LM19; RRID: AB_2734788 | 1/200 dilution |
| Antibody | LM20 | Plant Probes, UK | ID_PlantProbes: LM20; RRID: AB_2734789 | 1/200 dilution |
| Antibody | 2 F-4 | other | 2 F-4: P. van Custems (gift); 1/100 dilution | |
| Antibody | DyLight 488 goat anti-rat | Cambridge Bioscience/ Bethyl, UK | ID_CamBioSci:A110-100D2; RRID: AB_10630108 | 1/400 dilution |
| Antibody | Goat Anti-Mouse IgG (H + L) Antibody Alexa Fluor 488 | Invitrogen, UK | ID_Invitgrogen:A11017; RRID: AB_143160 | 1/200 dilution |
| Chemical compound, drug | oryzalin | SIGMA | ID_SIGMA: 36182 | |
| Software | MatLab2016a | MathWorks, Inc., USA | RRID:SCR_001622 | |
| Software | R3.4.1 | other | RRID:SCR_001905 | R3.4.1: https://www.r-project.org/ |
| Software | JPK SPM Data Processing software, v. spm 5.0.69 | JPK Instruments, DE | ||
| Software | MicroFilament Analyzer | PMID 23656865 | RRID:SCR_016411 | |
| Software | ImageJ/Fiji | PMID 22743772 | RRID:SCR_003070 |
Appendix 1—table 1
Model parameters for simulations in Figure 4 and Figure 4—figure supplement 1.
https://doi.org/10.7554/eLife.38161.018| Model parameters for simulations in Figure 4 and Figure 4—figure supplement 1 (S4). | Simulation | |||||
|---|---|---|---|---|---|---|
| Model parameter | 4A- | 4A+ | 4B1 | 4B2 | S4A- | S4A+ |
| Young's Modulus, inner wall (hoop/trans; Yref) | 1 | 1 | 6 | 1 | 1 | 1 |
| Young's Modulus, inner wall (axial; Yref) | 1 | 1 | 1 | 1 | 1 | 1 |
| Material anisotropy, inner wall | 0 | 0 | 0.83 | 0.83 | 0 | 0 |
| Young's Modulus, outer wall (Yref) | 1.3 | 1.3 | 1.3 | 1.3 | 1.3 | 1.3 |
| Young's Modulus, axial anticlinal wall (Yref) | 1 | 0.1 | 1 | 0.5 | 1 | 0.5 |
| Young's Modulus, transverse anticlinal wall (Yref) | 1 | 10 | 1 | 1 | 1 | 1 |
| Isometric presssure (Pref) | 1 | 1 | 1 | 1 | 1 | 1 |
| Extra axial pressure (Pref) | 0 | 0 | 0 | 0 | 0.6 | 0.6 |
| Pressure anisotropy | 0 | 0 | 0 | 0 | 0.38 | 0.38 |
| Yref = 50 MPa; Pref = 0.2 MPa | ||||||
Additional files
-
Supplementary file 1
Relative growth rates (RGR) in length and width for cells by position index along the hypocotyl length, calculated across 6H windows.
Propagated standard error of the mean (SEM) values are also provided. Values were calculated from the cell length and width data in Figure 1.
- https://doi.org/10.7554/eLife.38161.015
-
Transparent reporting form
- https://doi.org/10.7554/eLife.38161.016
Download links
A two-part list of links to download the article, or parts of the article, in various formats.
Downloads (link to download the article as PDF)
Open citations (links to open the citations from this article in various online reference manager services)
Cite this article (links to download the citations from this article in formats compatible with various reference manager tools)
Anisotropic growth is achieved through the additive mechanical effect of material anisotropy and elastic asymmetry
eLife 7:e38161.
https://doi.org/10.7554/eLife.38161


