Characterization of developmental and molecular factors underlying release heterogeneity at Drosophila synapses
- Massachusetts Institute of Technology, United States
Figures
Figure 1
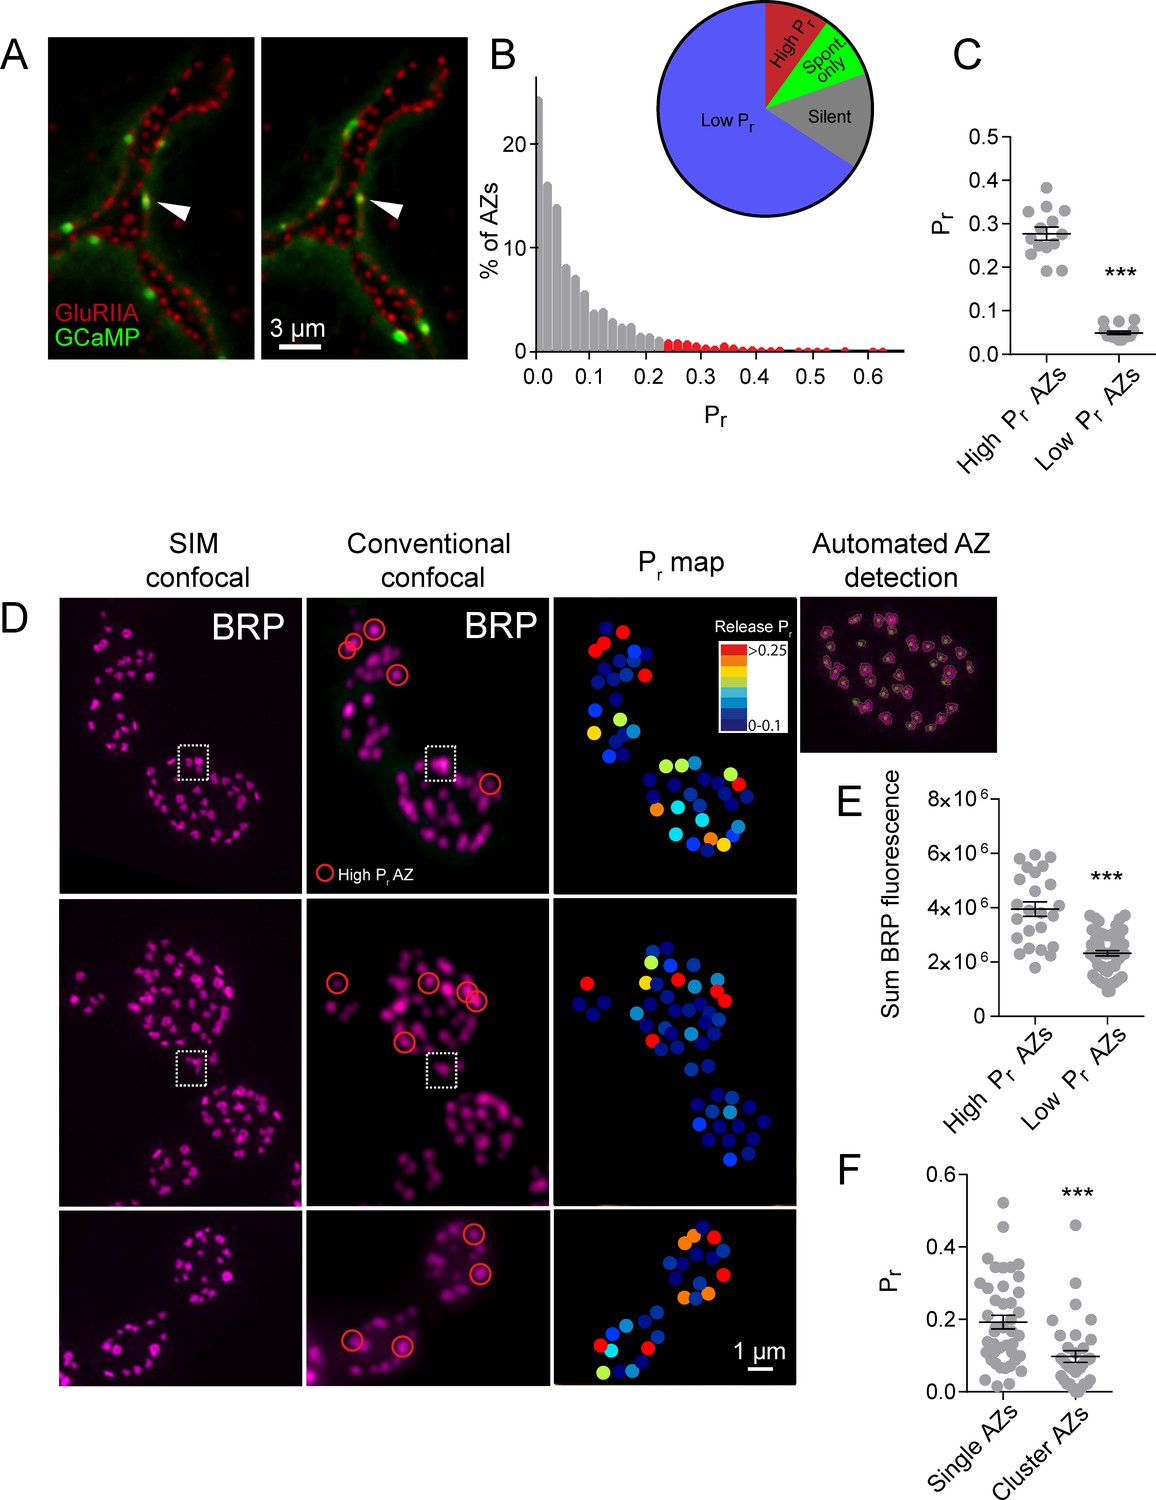
High Pr sites correspond to single AZs with elevated levels of BRP.
(A) Representative images of consecutive evoked release events (green flashes) visualized by expressing myrGCaMP6s in muscle 4. The position of each AZ was determined by expressing GluRIIA-RFP to label the corresponding PSD. Evoked release triggers fusion across different sets of AZs during each stimulus, but a subpopulation of AZs respond more frequently (arrow). (B) Histogram of the distribution of AZ Pr for a 0.3 Hz 5 min stimulation paradigm. AZs classified as high Pr (>2 standard deviations above the mean) are shown in red. The percentage of AZs that were low Pr (65.8%), high Pr (9.9%), spontaneous-only (9.7%) and silent (14.6%) is displayed in the inset. (C) Average Pr determined for each individual experiment for the AZ population categorized based on low and high activity sites (>2 standard deviations above the mean). Each point represents the average for all AZs (classified as either high or low Pr) from a single animal. (D) Individual BRP puncta for three NMJs from three different animals imaged with high resolution structured illumination microscopy (SIM, left panel) or confocal microscopy (middle panel). The right panel displays the heat map for evoked Pr from the same NMJs determined by GCaMP6s imaging prior to fixation. Representative high Pr sites are circled with red in the middle panels. Representative example of a large BRP puncta that would be classified as a single AZ using conventional light microscopy but resolved into multiple clustered AZs using SIM analysis is boxed with the dotted white line. The far right top panel displays the results from the automated detection algorithm that outlines individual AZs. (E) AZs were separated into high and low Pr based on their activity and the sum fluorescence intensity of the corresponding BRP puncta is shown. (F) AZs with high BRP intensity (two standard deviations above average) were preselected from conventional confocal images and identified on corresponding SIM images. In cases where the BRP signal was resolvable into more than one AZ by SIM microscopy, it was assigned to the AZ cluster group. In cases where the BRP signal mapped to a single BRP puncta by SIM imaging, it was assigned to the single AZ group. Pr is plotted for each group. Student’s t-test was used for statistical analysis (***=p ≤ 0.001). Error bars represent SEM.
Figure 2
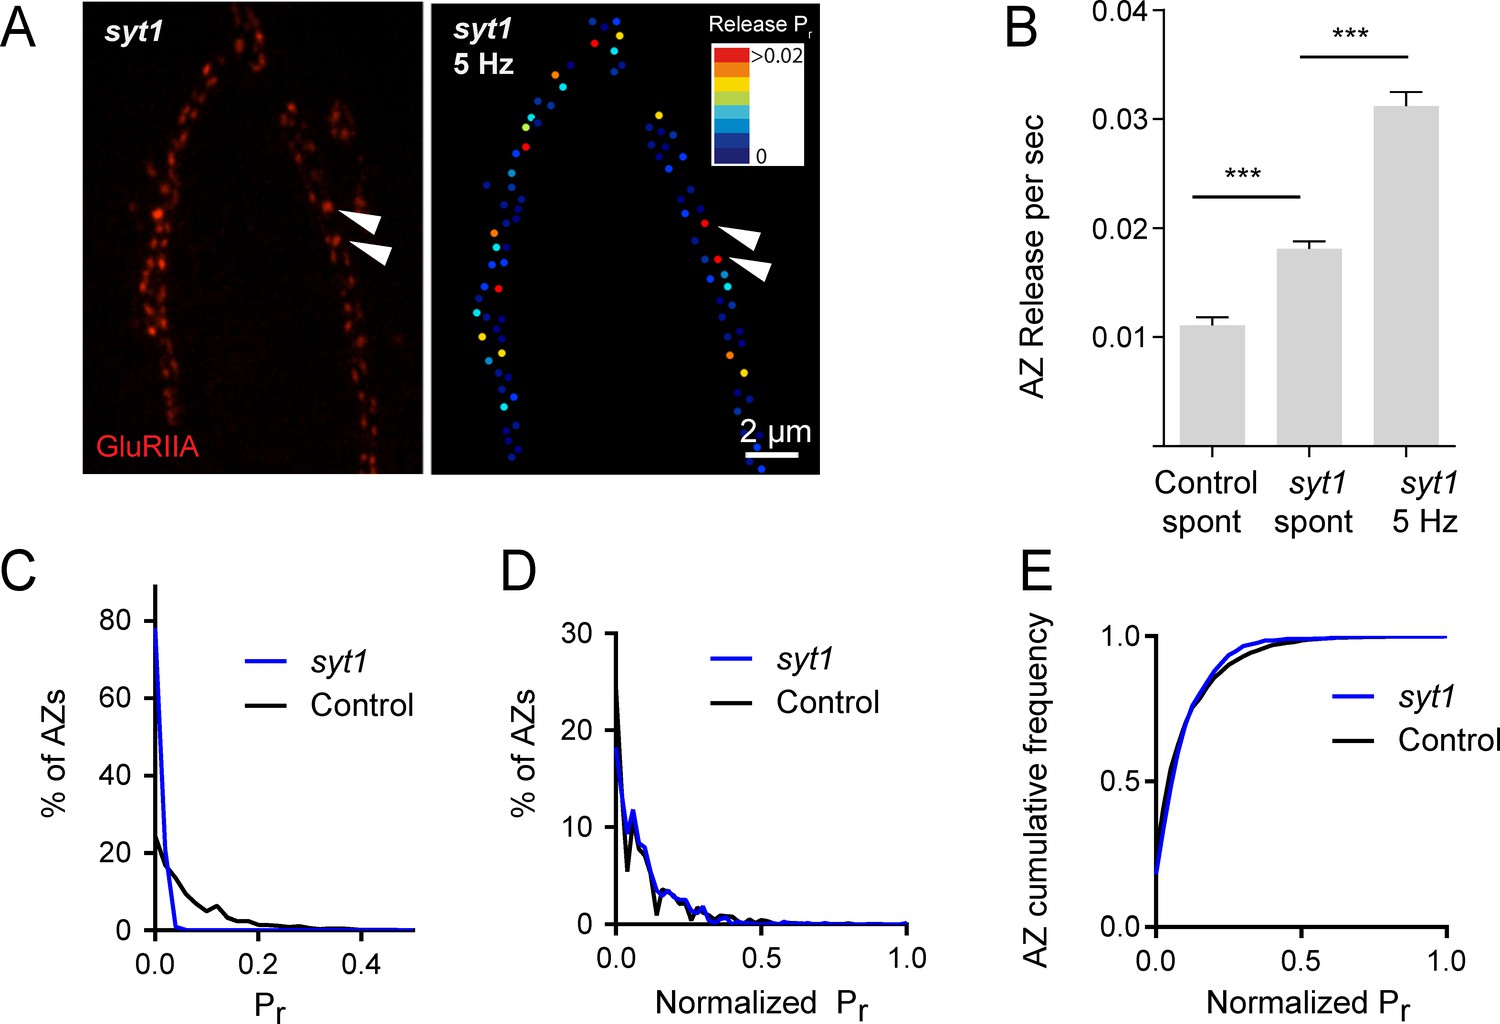
Pr variability remains in syt1 null mutants.
(A) The left panel displays the distribution of GluRIIA in syt1 nulls (left panel) at the muscle 4 NMJ. The corresponding Pr heatmap is shown on the right. The arrows denote several high Pr sites opposed by bright GluRIIA positive PSDs. (B) AZ release events per second for spontaneous release and evoked by 5 Hz stimulation are shown for syt1 nulls mutants, and for spontaneous release in controls. (C) Frequency distribution of Pr is shown for syt1 nulls and controls. (D) Plot of normalized Pr frequency distribution (from 0 to 1 (max)) for syt1 nulls and controls. (E) Cumulative frequency distribution for normalized release rates for syt1 nulls and controls is shown. One-way ANOVA followed by Dunnett’s multiple comparisons test used for statistical analysis (***=p ≤ 0.001). Error bars represent SEM.
Figure 3
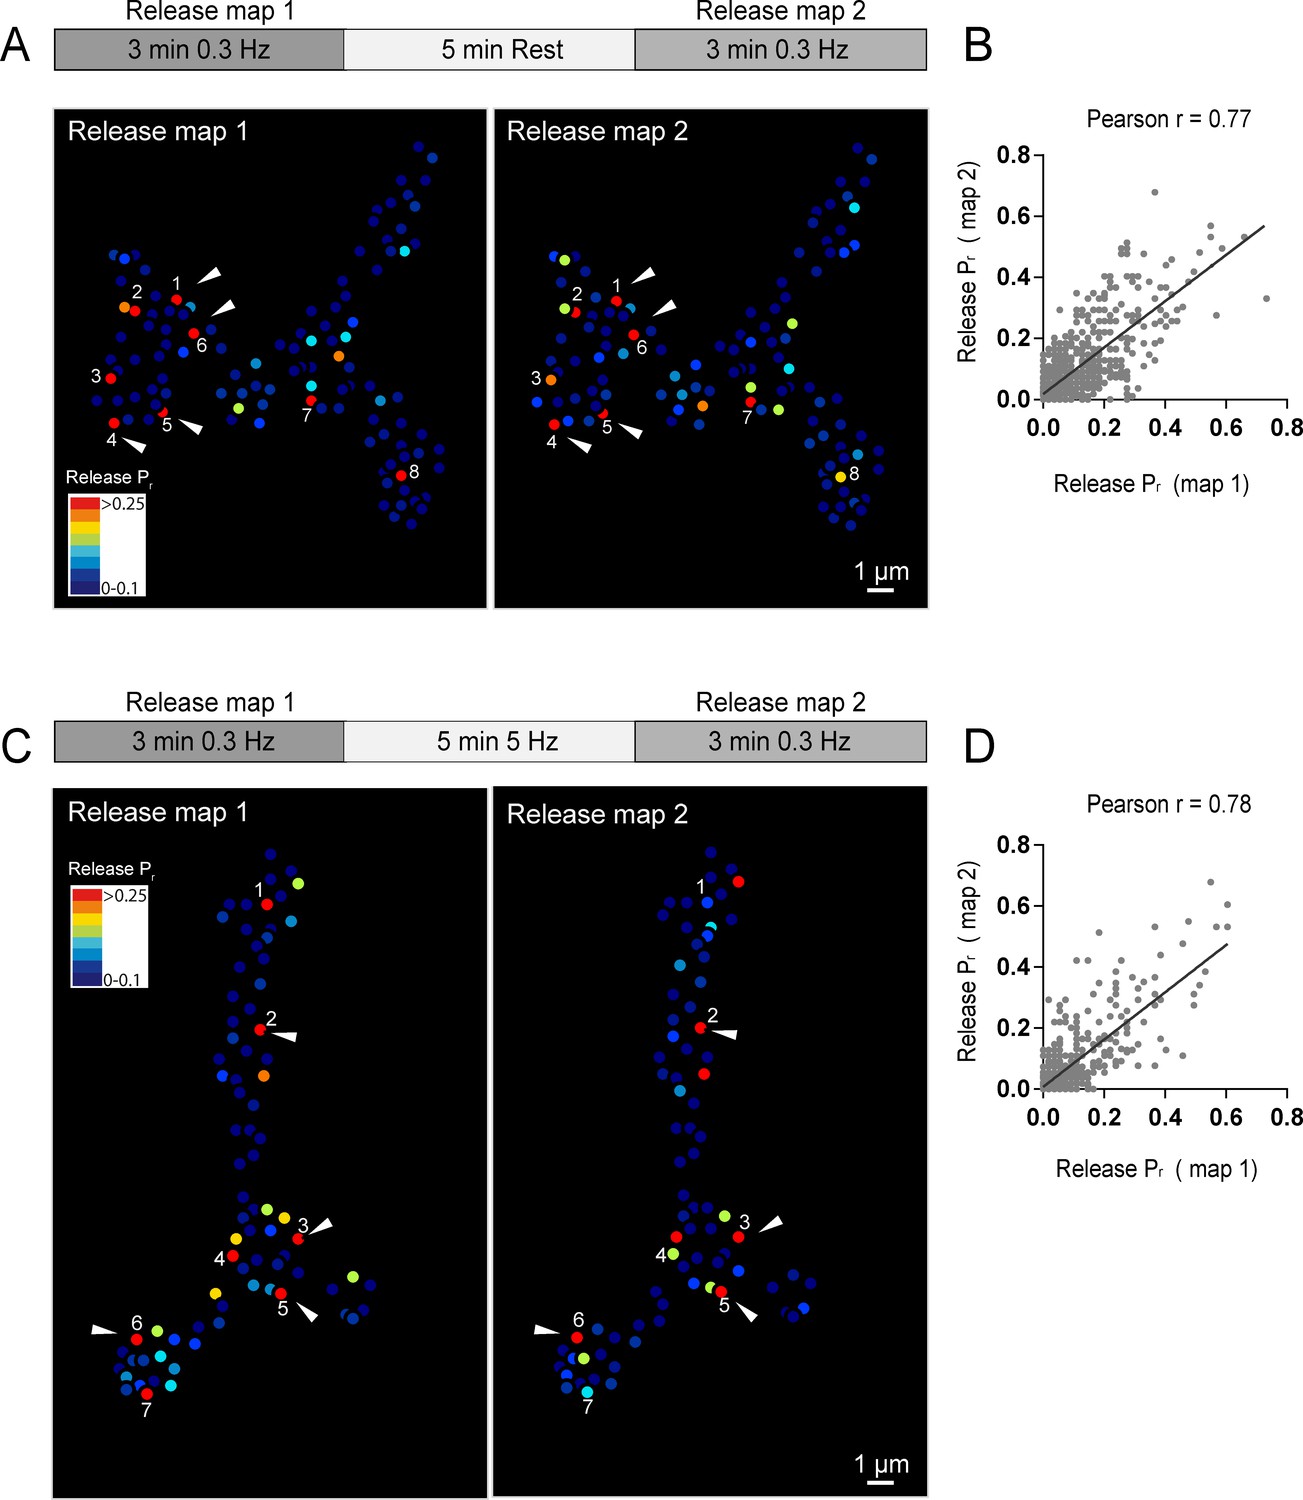
Stability of release maps at the NMJ.
(A) Pr heatmaps for the same muscle 4 NMJ were generated for two individual imaging sessions, separated by a 5 min resting period. High Pr AZs were numbered and re-identified in each heatmap. Representative high Pr AZs that sustain release rates during the second imaging session are noted with arrows. (B) Correlation of AZ Pr between two imaging sessions separated by a 5 min resting period. (C) Pr heatmaps for the same NMJ separated by a 5 min 5 Hz stimulation. Representative high Pr AZs that did not change activity levels are noted with arrows. (D) Correlation of AZ Pr between two imaging sessions separated by a 5 min 5 Hz stimulation period.
Figure 4 with 1 supplement
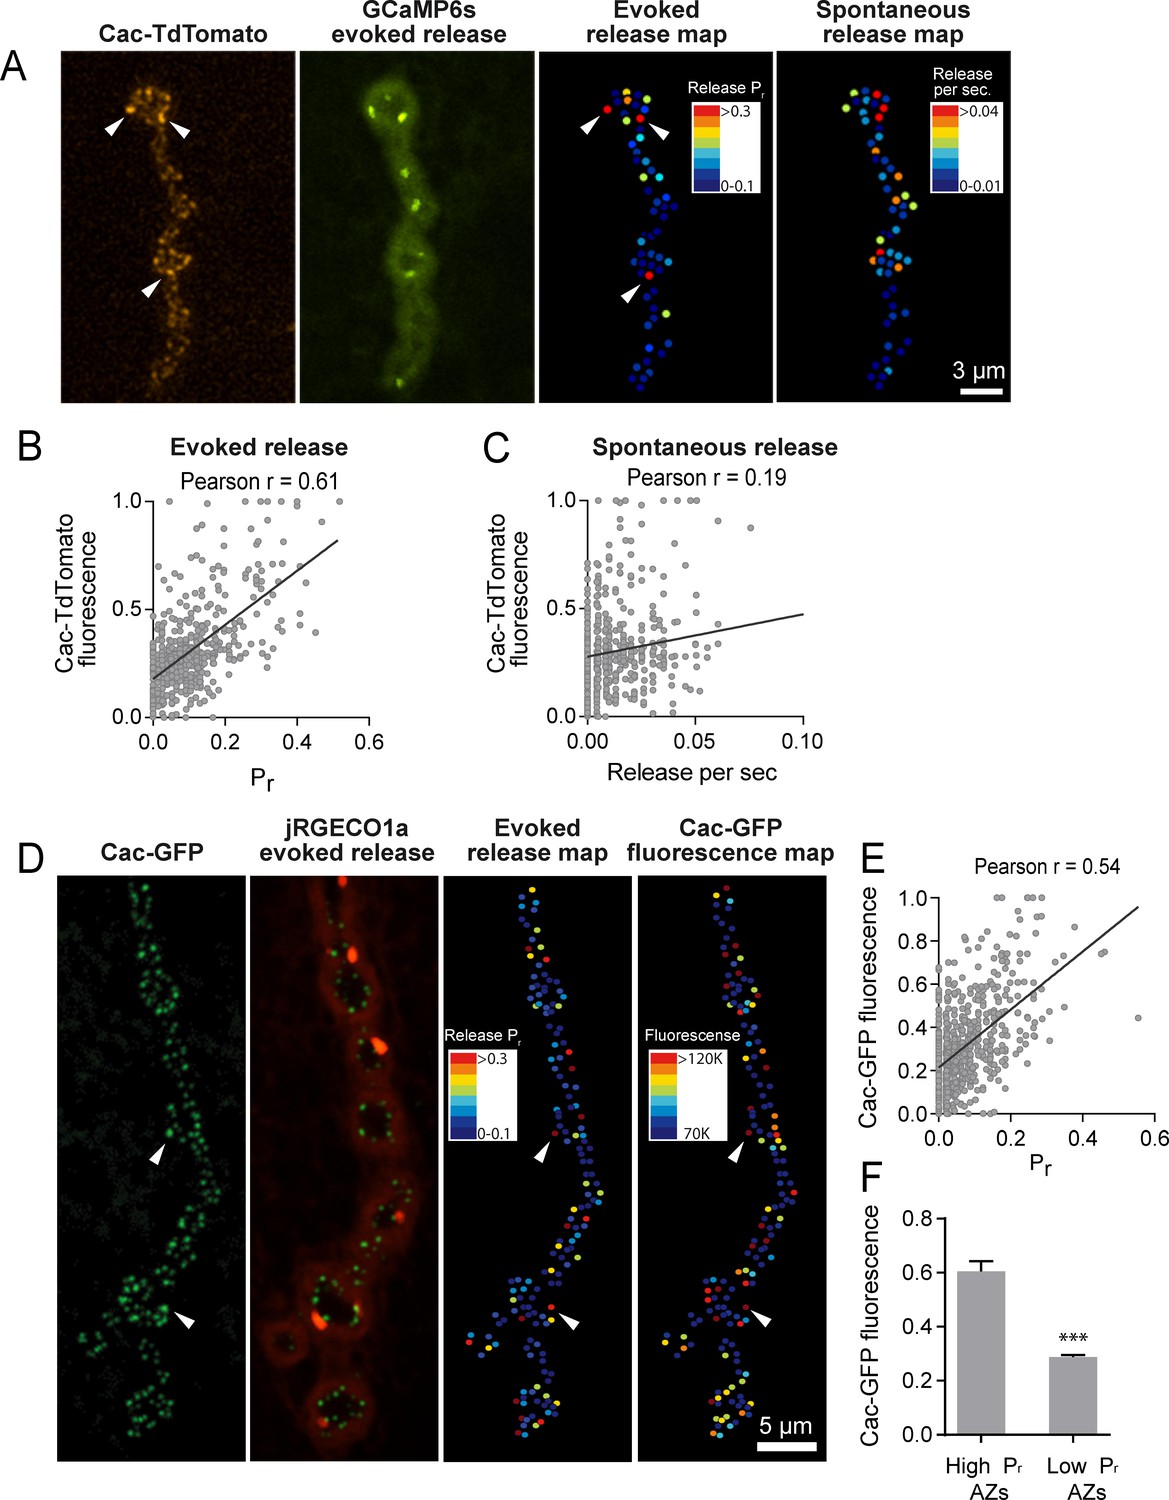
Pr correlates with Cac channel abundance at AZs.
(A) Representative images showing heterogeneous distribution of Cac-TdTomato at the NMJ of muscle 4 (left panel). Evoked release was visualized at the same NMJ using myrGCaMP6s (second panel) and AZ release maps were generated for evoked (third panel) and spontaneous fusion (right panel). Several high Pr AZs with bright Cac density are noted (arrows). (B) Correlation between AZ Pr and Cac-TdTomato fluorescence intensity. (C). Correlation between AZ spontaneous release rate per second and Cac-TdTomato fluorescence intensity. (D) Representative images showing heterogeneous distribution of Cac-GFP at the NMJ (left panel). Evoked release visualized at the same NMJ by myr-jRGECO1a is shown in the second panel. The Pr heatmap for evoked release is shown in the third panel. A heatmap distribution of Cac-GFP fluorescence intensities, based on same two standard deviation criteria as color-coding of Pr, is shown in the right panel. The arrows denote several higher Pr sites that correlated with bright Cac-GFP puncta. (E) Correlation between AZ Pr and Cac-GFP fluorescence intensity for evoked release. (F) Cac-GFP fluorescence for AZs functionally classified as either low or high Pr (>2 standard deviations above mean) by quantal imaging with myr-jRGECO1a. Student’s t-test was used for statistical analysis (***=p ≤ 0.001). Error bars represent SEM.
Figure 4—figure supplement 1
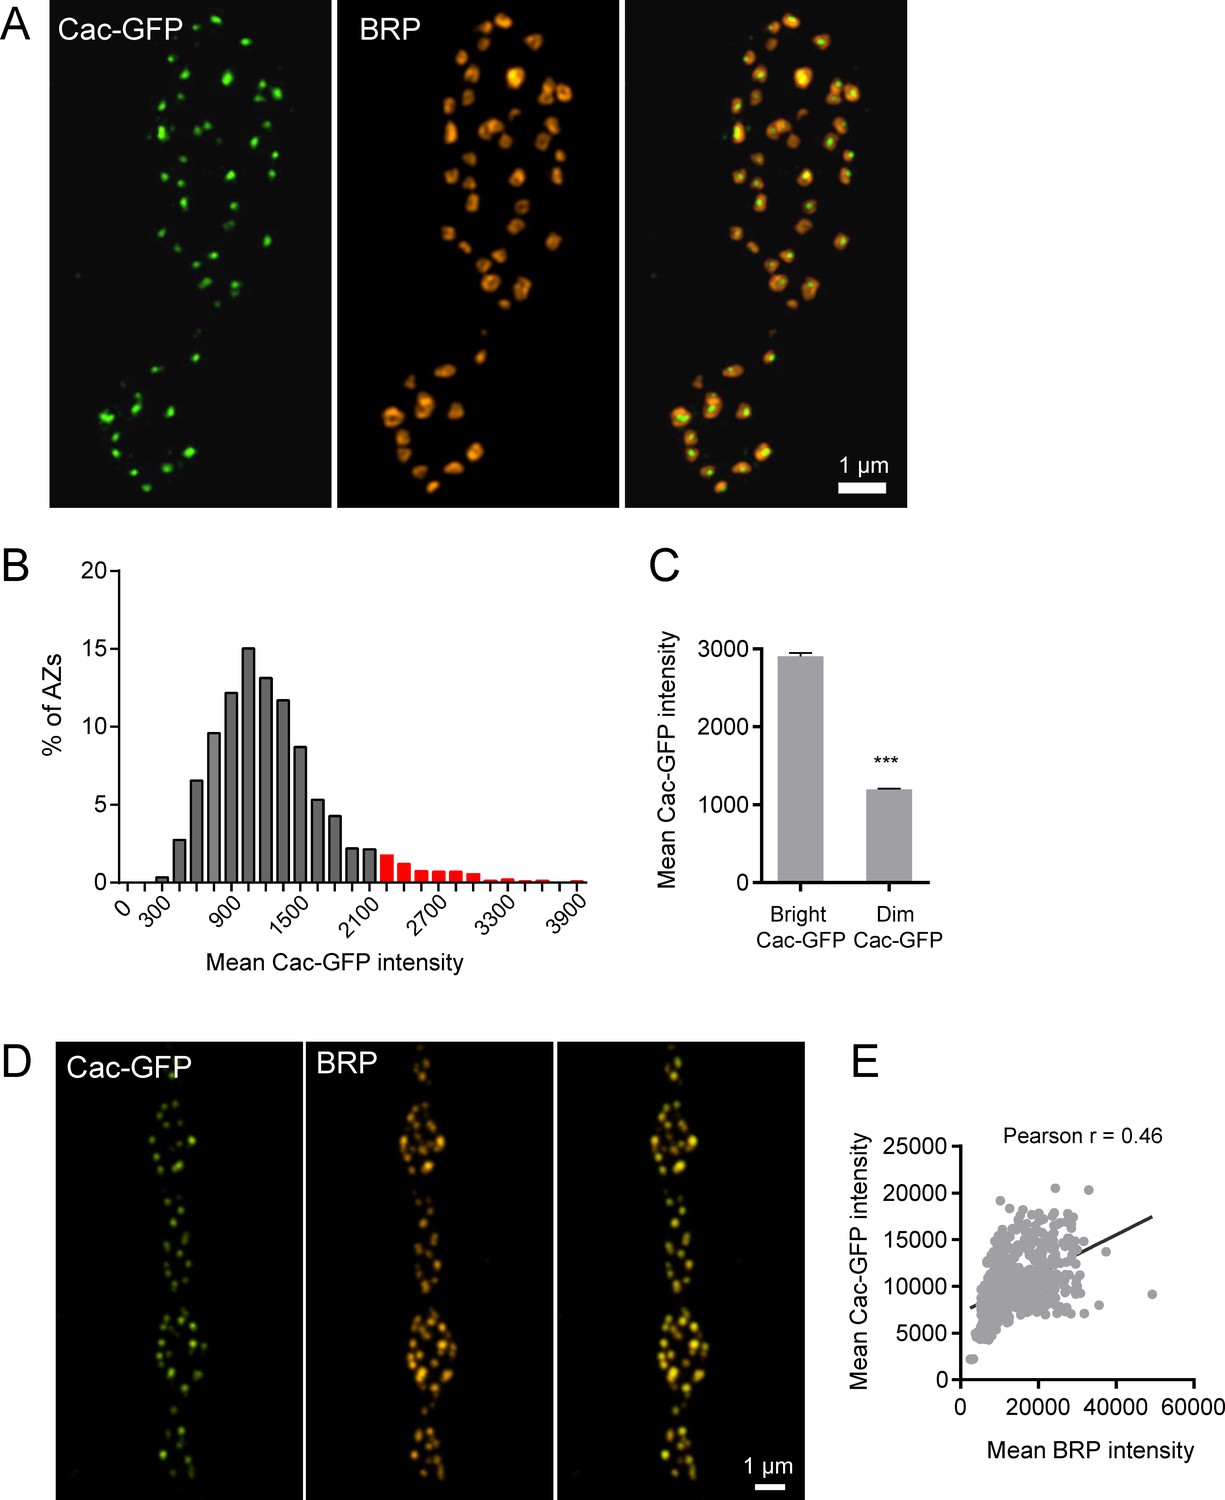
Cac-GFP distribution at AZs analyzed by SIM microscopy.
(A) Representative Cac-GFP and BRP puncta at AZs for two synaptic boutons imaged using SIM microscopy. (B) Histogram of the distribution of mean Cac-GFP fluorescence intensity across the AZ population. Red corresponds to the Cac-GFP containing AZ population with fluorescence intensity two standard deviations above the mean. (C) Mean fluorescence intensity of Cac-GFP for bright (fluorescence greater than two standard deviations above the average) versus dim AZs. Student’s t-test was used for statistical analysis (***=p ≤ 0.001). Error bars represent SEM. (D) Representative images of Cac-GFP and BRP (stained using anti-BRP antibody) in fixed tissue, imaged using conventional light microscopy. (E) Correlation between mean Cac-GFP fluorescence intensity and mean BRP fluorescence intensity imaged using conventional light microscopy.
Figure 5 with 1 supplement
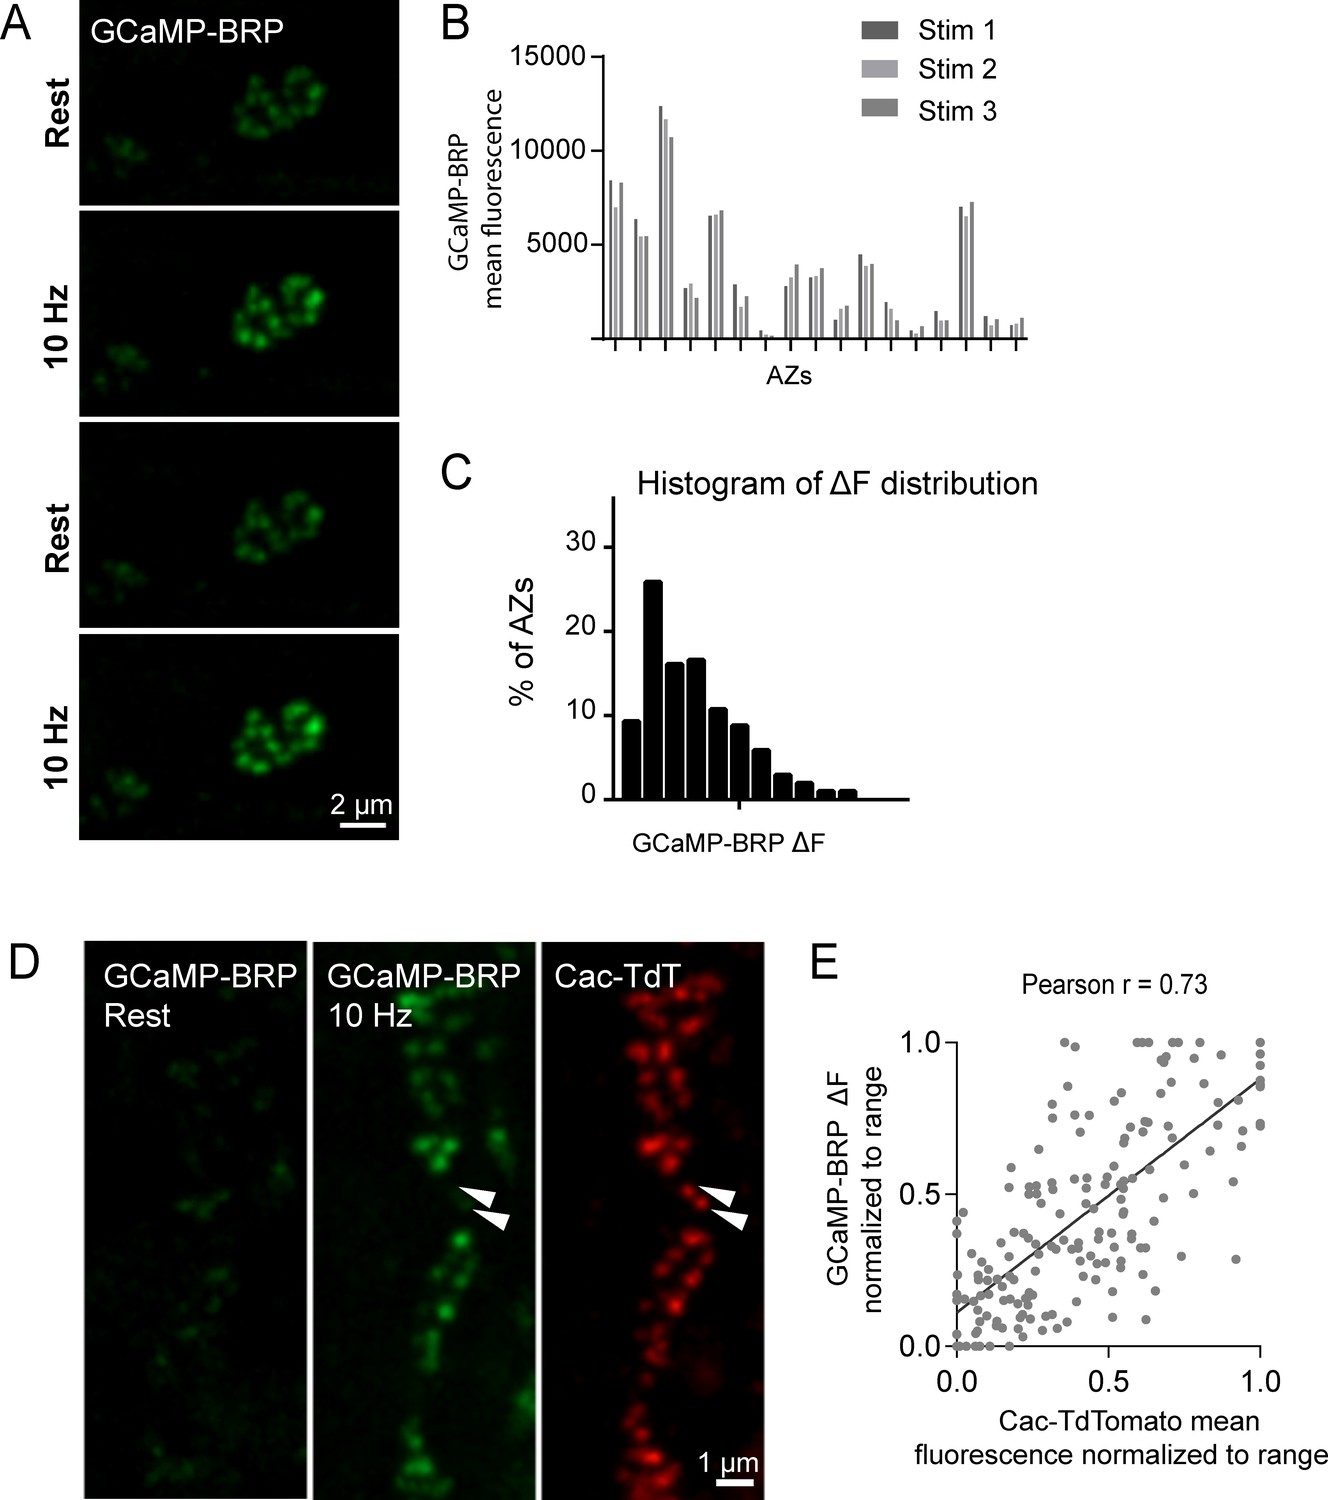
GCaMP-BRP detects relative Ca2+ influx at single AZs and is correlated with Cac channel abundance.
(A) Representative images of the same muscle 4 NMJ bouton showing CCaMP6m-BRP fluorescence at rest and following 10 Hz stimulation for two consecutive rounds. (B) The AZ fluorescence intensity was plotted for three independent rounds of stimulation for BRP-GCaMP6m. Fluorescence changes per AZ remain stable for the same AZ during multiple rounds of stimulation. (C) Histogram of the distribution of relative fluorescence intensities (ΔF) across AZs for BRP-GCaMP6m. (D) Representative images showing GCaMP6m-BRP fluorescence before (left panel) and during stimulation (middle panel). The corresponding distribution of Cac channels labeled by Cac-TdTomato is shown for the same NMJ (right panel). Examples of rare Cac-positive AZs that showed no corresponding Ca2+ influx are indicated (arrows). (E) Correlation between GCaMP6m-BRP ΔF during stimulation and Cac-TdTomato fluorescence intensity at individual AZs.
Figure 5—figure supplement 1
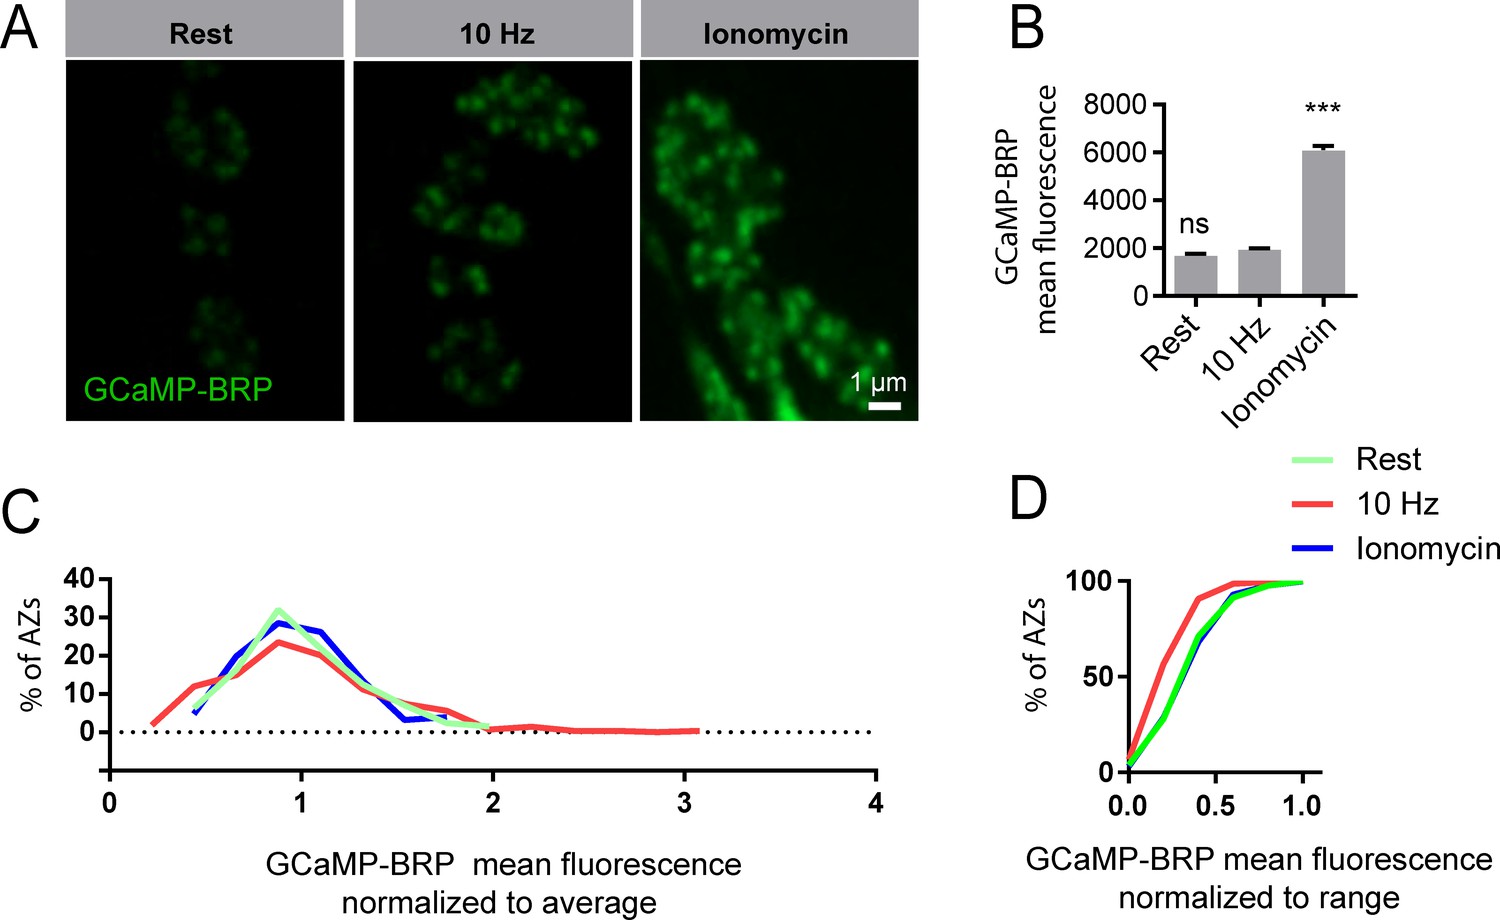
Properties of GCaMP-BRP during stimulation and ionomyocin application.
(A) Representative images of GCaMP6s-BRPshort fluorescence in 1.3 mM Ca2+ at rest (no stimulation), during 10 Hz stimulation, and upon 200 nM ionomycin application. (B) GCaMP-BRPshort mean fluorescence at rest, during 10 Hz stimulation, and after ionomycin application. One-way ANOVA followed by Dunnett’s multiple comparisons test was used for statistical analysis (***=p ≤ 0.001). Error bars represent SEM. (C, D) Distribution of mean AZ fluorescence intensity normalized to average (C) and cumulative frequency distribution of mean AZ fluorescence normalized to range (D) of GCaMP6s-BRPshort at rest (green), during 10 Hz stimulation (red) and following ionomycin application (blue).
Figure 6 with 1 supplement

Pr correlates with the relative levels of Ca2+ influx at AZs.
(A) Two representative muscle 4 NMJs with AZ Pr heatmaps obtained following myr-jRGECO1a mapping during stimulation (left panel). GCaMP6m-BRPshort fluorescence levels of the same NMJ at rest (second panel) and during stimulation (third panel) are shown. Heatmaps of GCaMP6m-BRPshort ΔF during stimulation are displayed in the right panel. Several representative high Pr AZs that experienced the strongest Ca2+ influx detected by GCaMP6m-BRPshort are noted (arrows). (B) Correlation between GCaMP6m-BRPshort ΔF (during 10 Hz stimulation) and AZ Pr (during 1 Hz stimulation) is shown across all experiments. (C) Representative correlation between GCaMP6m-BRP ΔF and AZ release rate per minute for evoked (red) and spontaneous (green) fusion for a representative single NMJ.
Figure 6—figure supplement 1
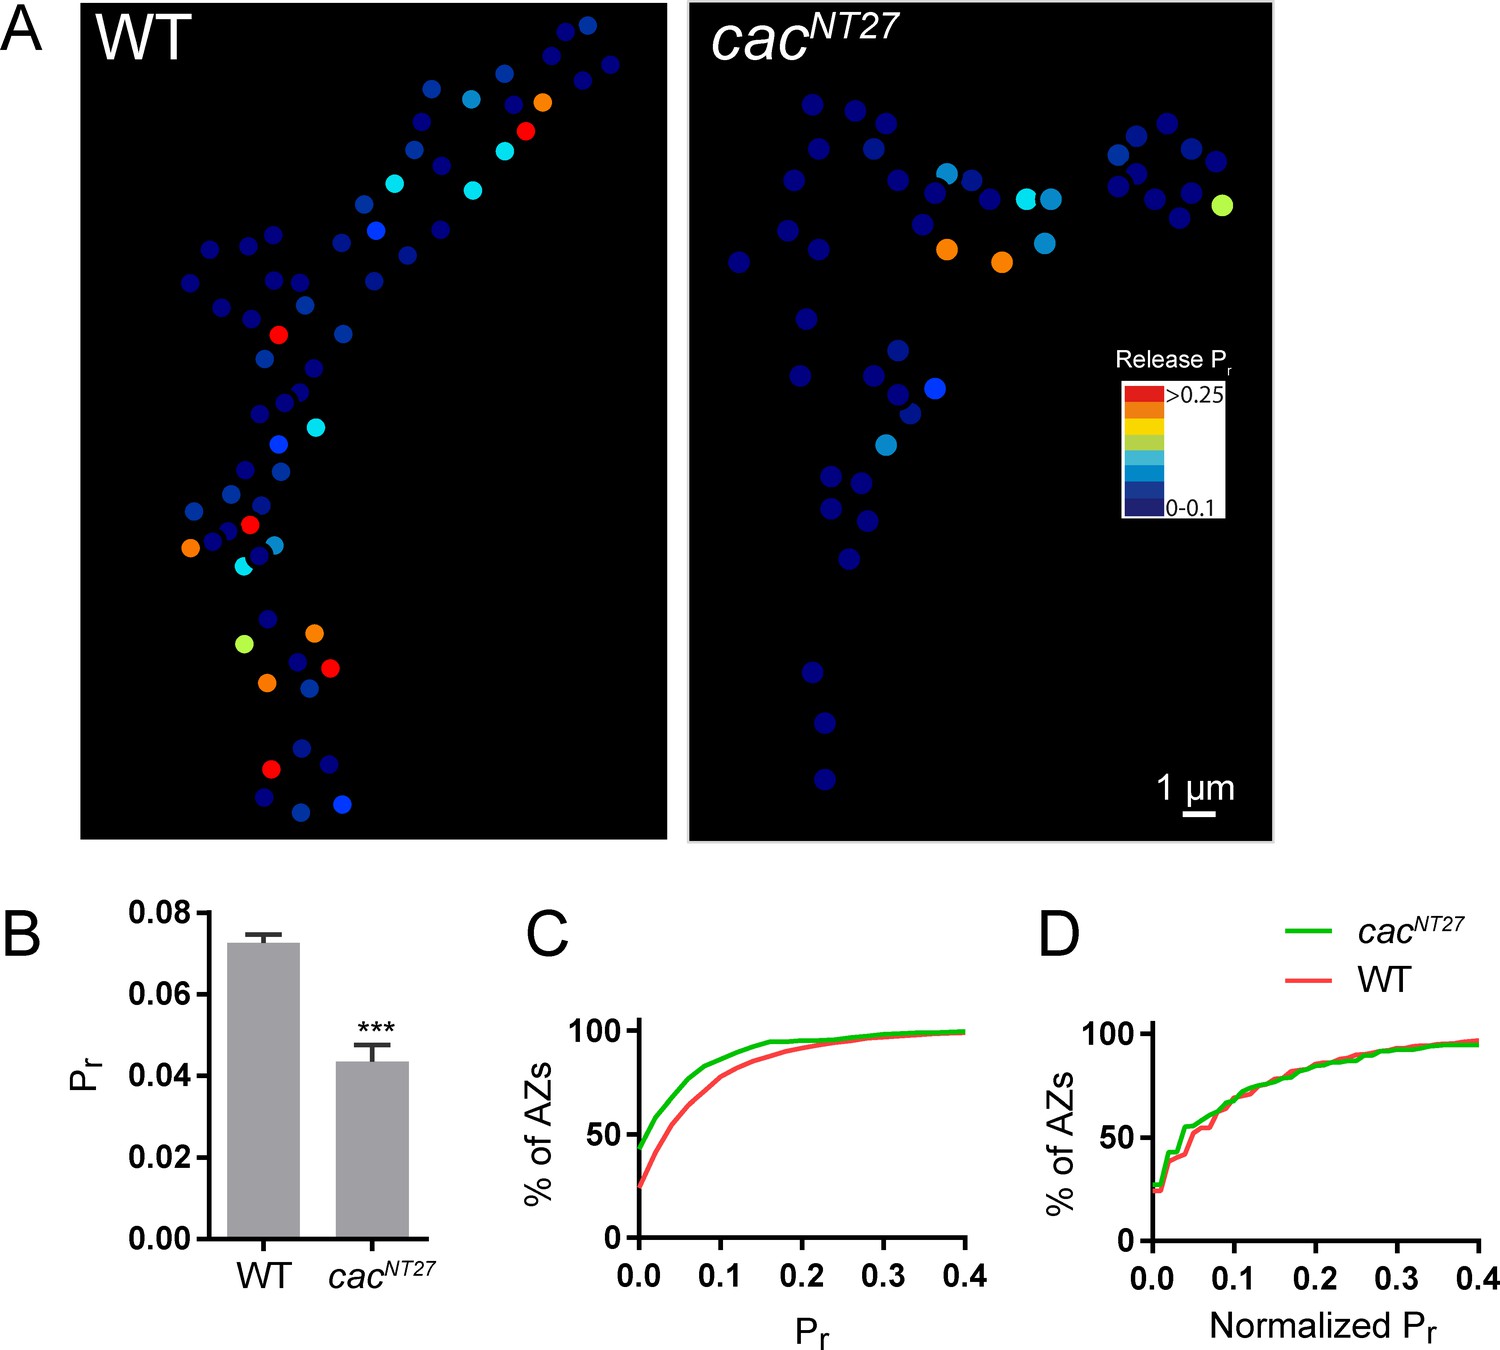
Release probability mapping in the cacNT27 mutant.
(A) Evoked Pr heatmaps for muscle 4 NMJs were generated in control (left) and cacNT27 (right) third instar larvae. (B) Average Pr in control and cacNT27 NMJs. Student’s t-test was used for statistical analysis (***=p ≤ 0.001). Error bars represent SEM. (C) Cumulative frequency distribution of Pr for control and cacNT27 AZs. (D) Cumulative frequency distribution of Pr, normalized from 0 to max Pr for control and cacNT27 NMJs.
Figure 7 with 3 supplements
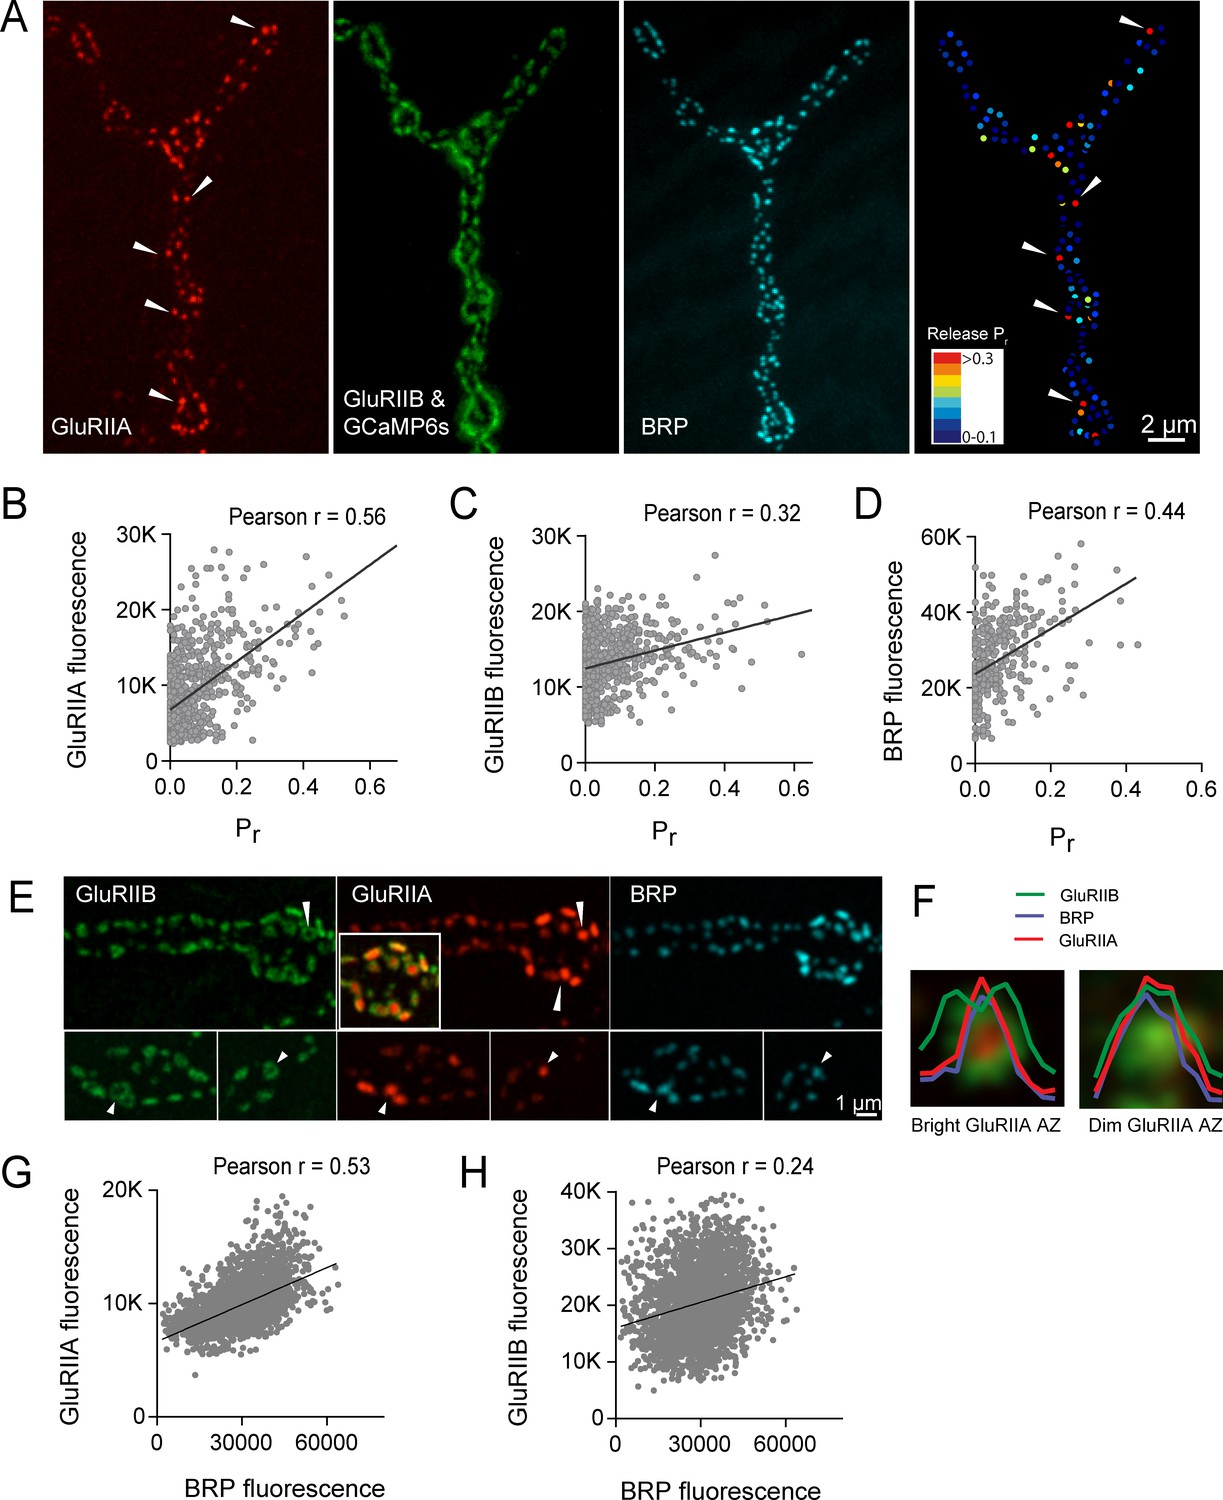
High Pr AZs have elevated PSD GluRIIA levels and display a distinct pattern of glutamate receptor clustering.
(A) Representative image showing the heterogeneous distribution of GluRIIA-RFP (left panel) at a third instar muscle 4 NMJ. More uniform GluRIIB-GFP PSD puncta can also be observed over the much dimmer myrGCaMP6s (second panel). BRP distribution (third panel) and Pr heatmaps (right panel) for the same NMJ are shown. Several bright GluRIIA fields (intensity two standard deviations above average) are marked with white arrows. The correlation between AZ Pr and GluRIIA-RFP (B), GluRIIB (C) and BRP (D) fluorescence intensity is plotted. (E) Representative images showing distribution of GluRIIA, GluRIIB and BRP, without co-expression of myrGCaMP6s. Synapses containing bright GluRIIA puncta have GluRIIB predominantly localized to the periphery of the PSD (arrows), surrounding a GluRIIA core. These AZs have higher BRP intensities as well. (F) Average fluorescence line profiles showing GluRIIA, GluRIIB and BRP normalized to fluorescence range across average PSDs, separated into two groups according to their GluRIIA brightness, with ‘bright’ PSDs based on their GluRIIA intensity (two standard deviations above average). The peripheral distribution of GluRIIB around central GluRIIA cores was most obvious for bright GluRIIA-positive PSDs that were shown to be more active during stimulation. Correlation between GluRIIA-RFP (G) or GluRIIB-GFP (H) with BRP intensity at individual AZs.
Figure 7—figure supplement 1
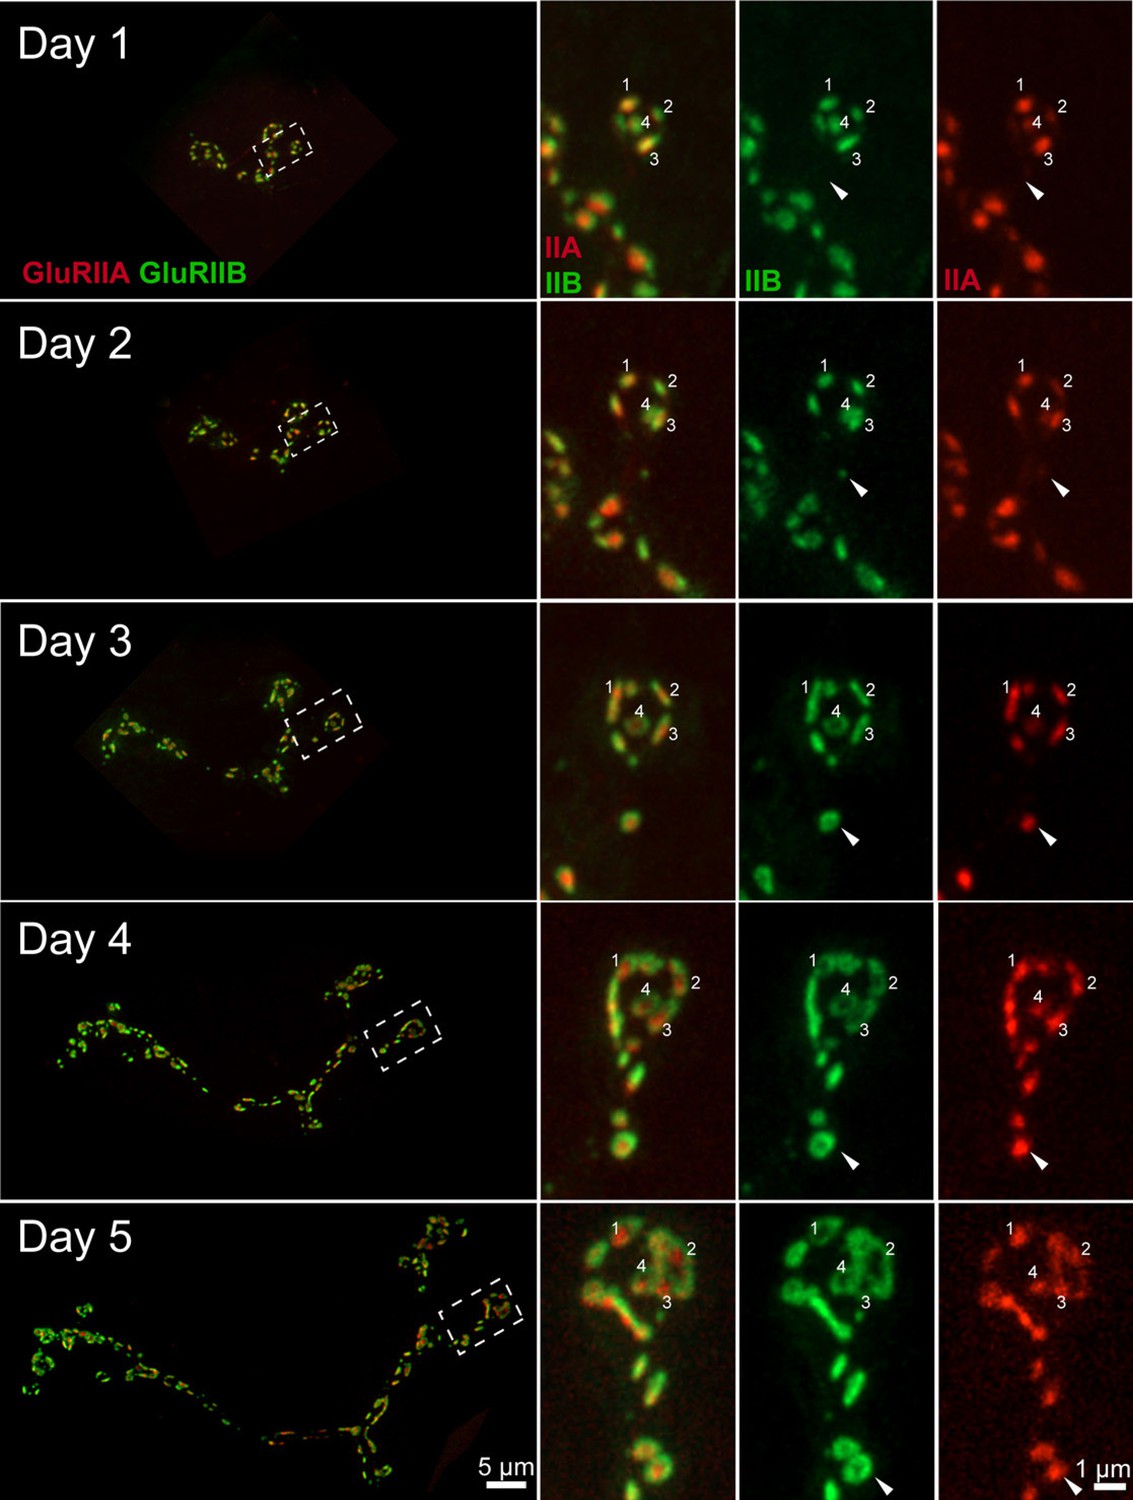
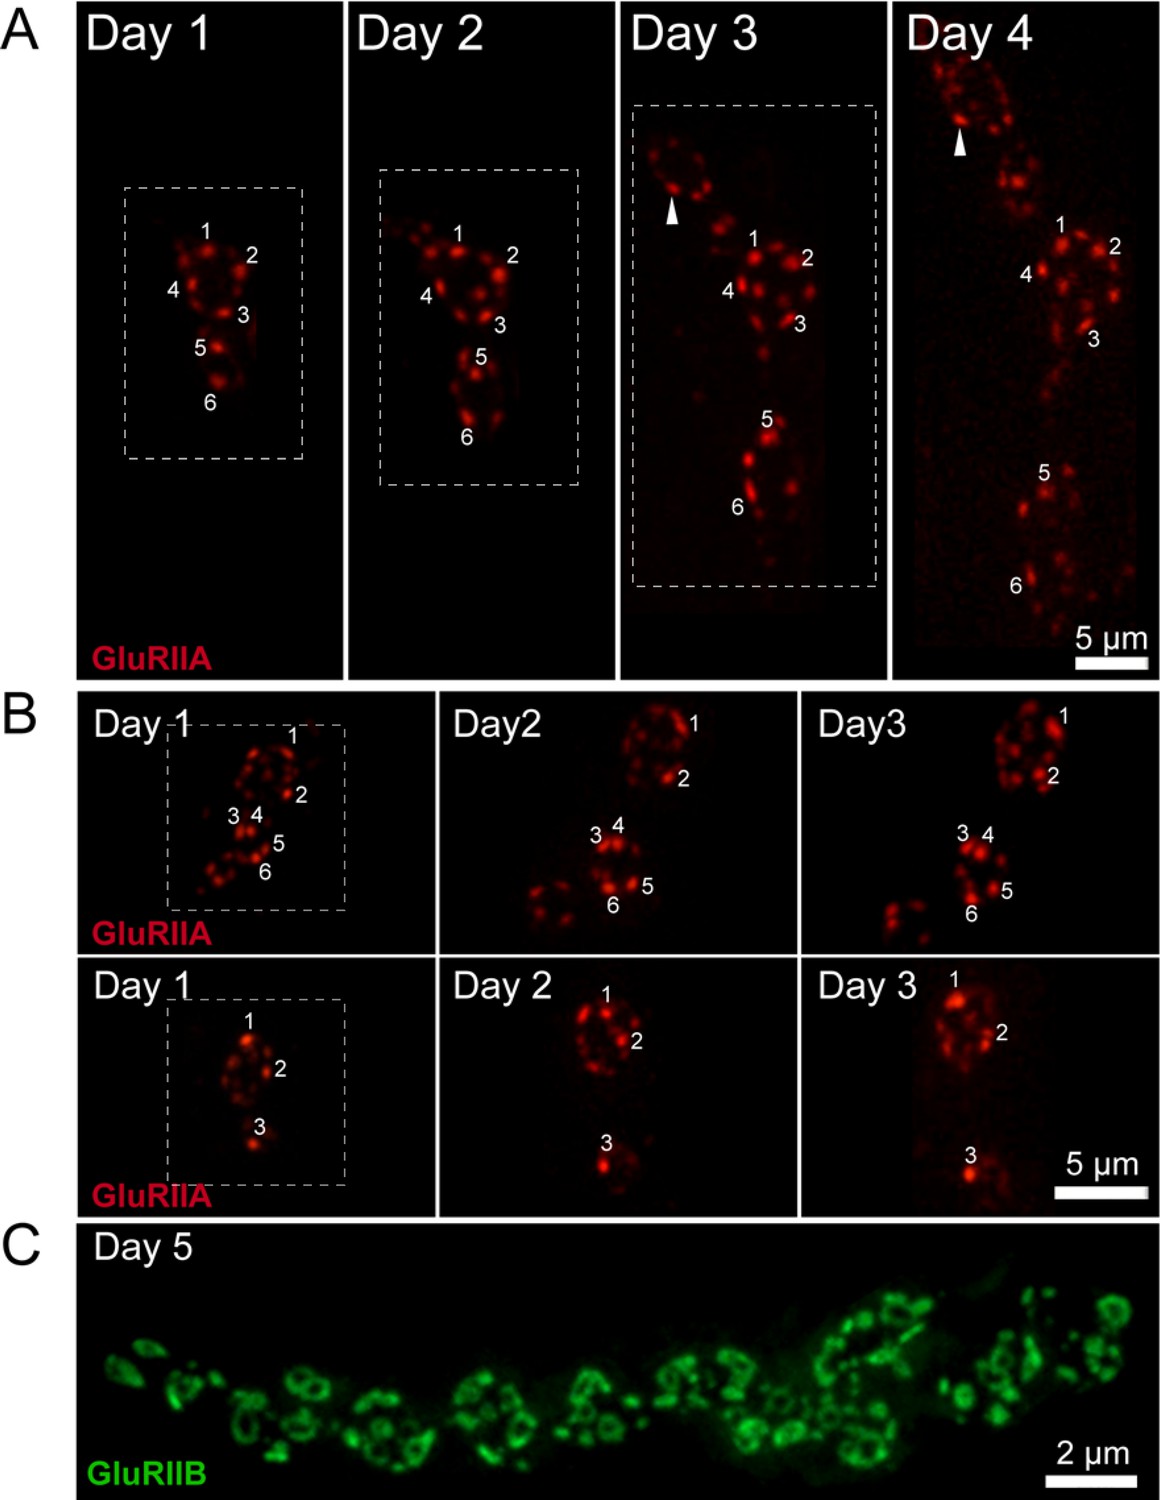
Consecutive imaging of NMJ growth at muscle 26 over a 5 day period imaged through the cuticle of an anesthetized larva during development.
The entire NMJ is shown on the left panel. A smaller area (dashed box) is magnified and shown in the right panels. The merged image of GluRIIA and GluRIIB is shown in the middle, with individual GluRIIB and GluRIIA channels on the right. Several PSDs are numbered for tracking across imaging sessions. New PSDs appearing on day 2 (arrow) form the GluRIIB donut by day 4. On day 5, a larger number of PSDs display the characteristic GluRIIB peripheral segregation around a GluRIIA core, including those identified on the 1 st day of imaging (numbered).
Figure 7—figure supplement 2
Synapse development along early GluRIIA positive NMJ extensions.
(A) Two representative muscle 26 NMJs visualized during live imaging in early first instar larvae expressing GluRIIA-RFP and GluRIIB-GFP. The arrows denote GluRIIA-RFP positive extensions from the main arbor that are devoid of detectable PSDs or GluRIIB at this stage of development (large arrow). These extensions disappear during imaging from later larval stages, but some go on to develop fully formed synaptic boutons with many PSDs by day 2 and 3. Smaller arrows denote the same PSD at each day for orientation.
Figure 7—figure supplement 3
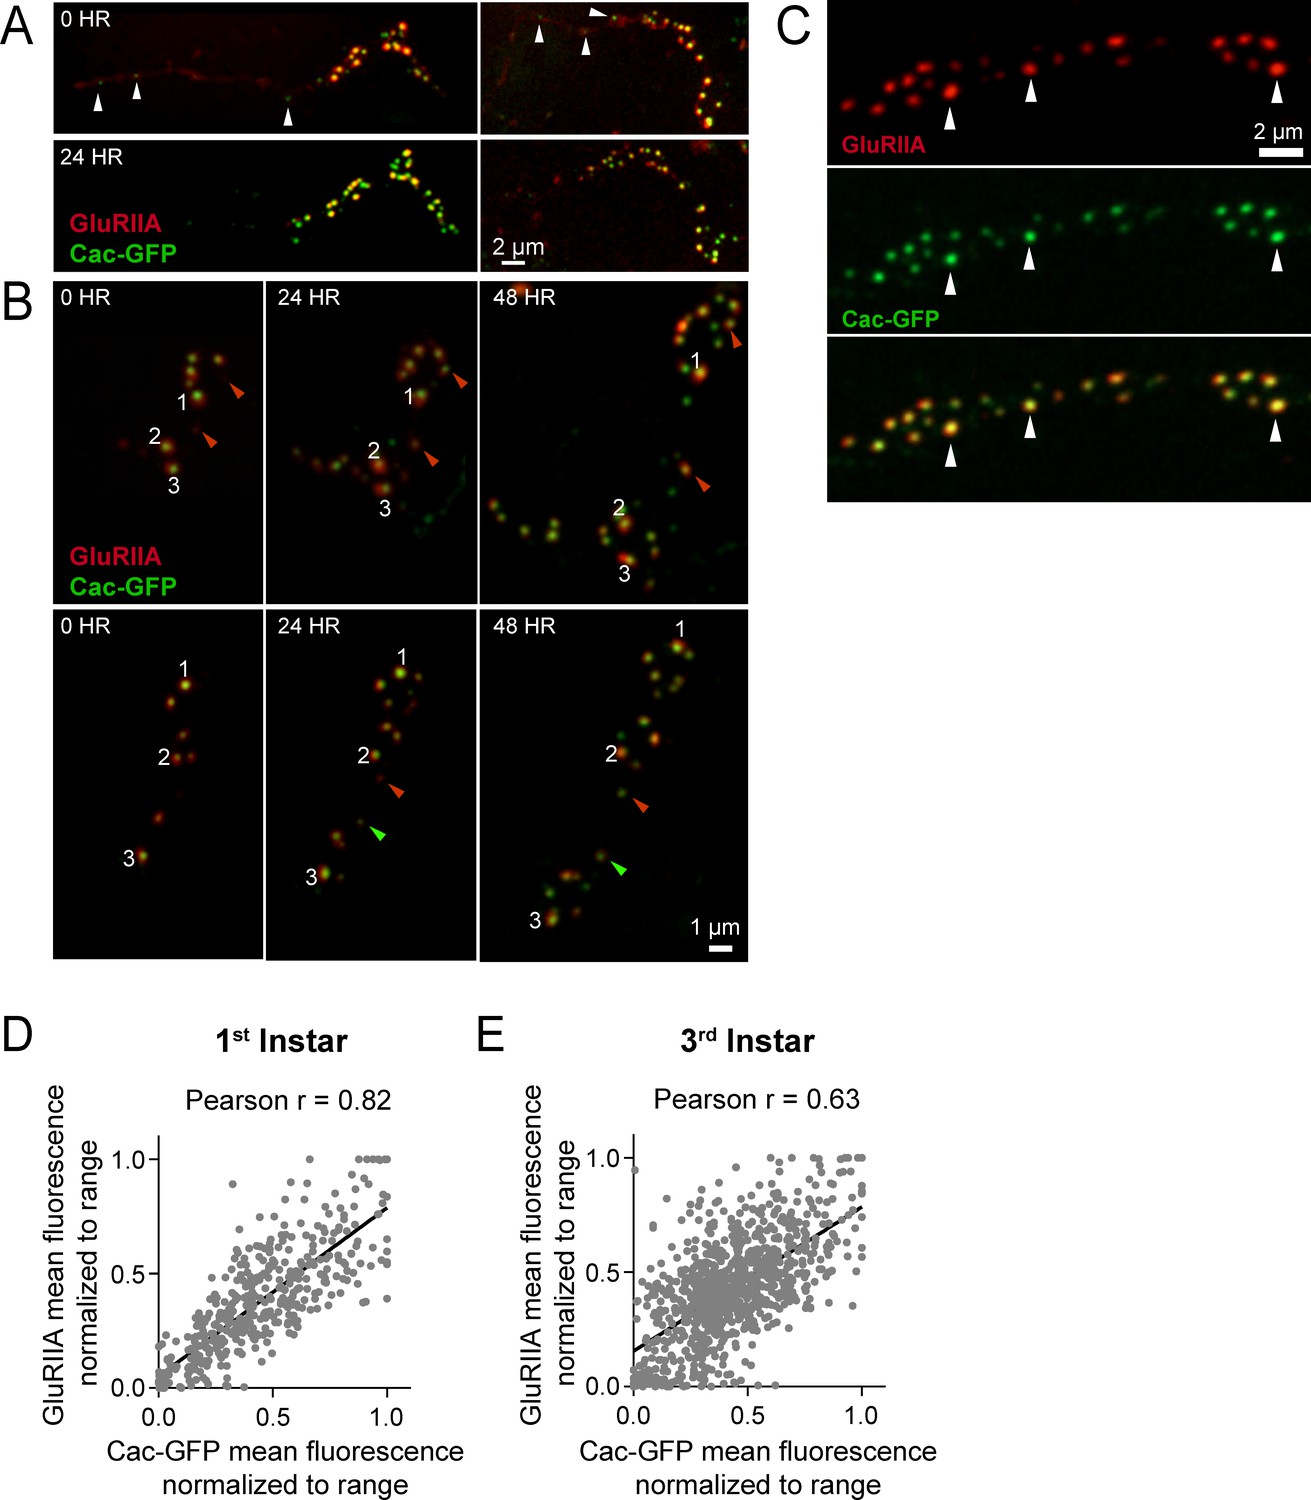
Correlation between GluRIIA-RFP and Cac-GFP fluorescence intensities throughout larval development.
(A) Live imaging of NMJs on muscle 26 in early first instar larvae expressing GluRIIA-RFP and Cac-GFP. Long projections of GluRIIA can be seen in day 1; white arrows mark Cac-GFP puncta that have formed within these projections. (B) Representative Cac-GFP (green) and GluRIIA-RFP (red) synaptic puncta at a muscle 26 NMJ imaged through the cuticle of an anesthetized animal during early larval development. Red arrows mark the emergence of new AZs that first accumulate GluRIIA (day 1) and later begin to accumulate Cac-GFP and mature in size and brightness (days 2 and 3). Green arrows mark the emergence of new AZs that accumulate Cac-GFP before GluRIIA. Numbers denote AZs with bright GluRIIA and Cac-GFP on day 1. (C) Arrows denote AZs with bright Cac-GFP opposed to PSDs with high levels of GluRIIA. (D, E) Correlation between GluRIIA-RFP and Cac-GFP fluorescence at individual AZs in the first instar (D) and third instar (E) stages.
Figure 8 with 1 supplement

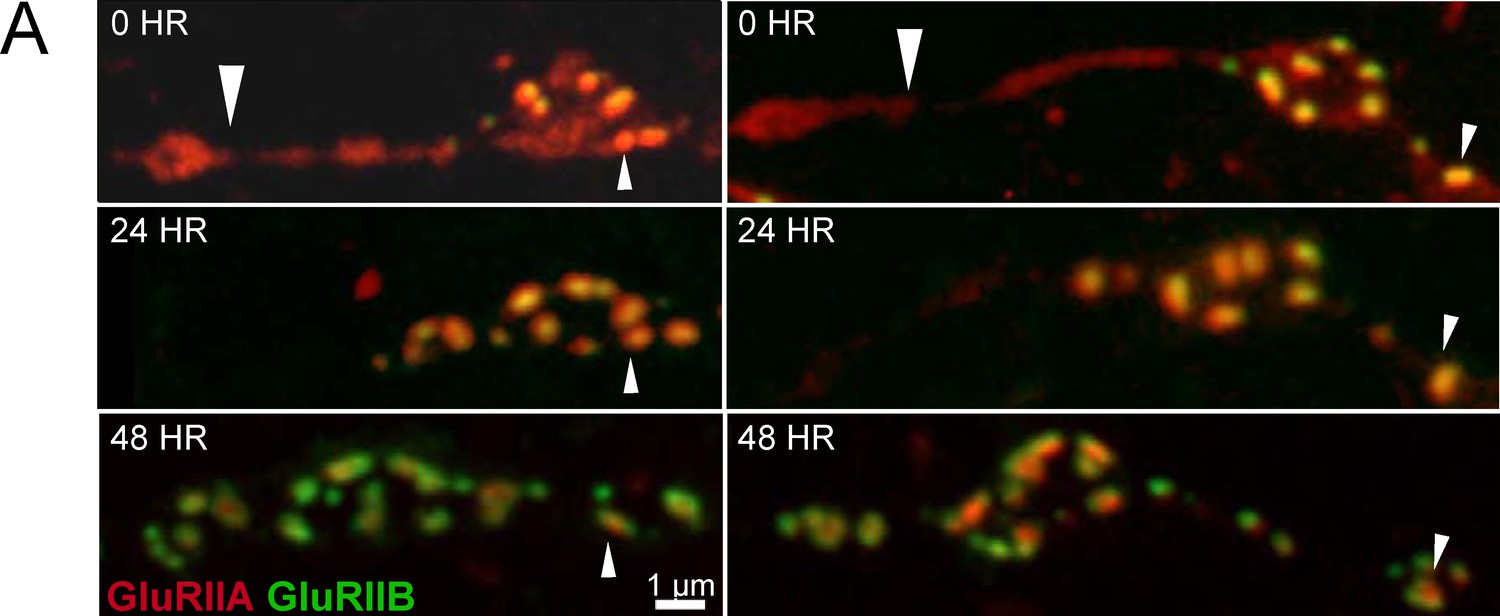
Glutamate receptor segregation during PSD development.
(A) Representative serial time points of NMJ development visualized by repeated imaging through the cuticle of an anesthetized larvae at the indicated time points beginning at the early first instar stage. Two of the five brightest PSDs present during the first imaging session are labeled and are the first to develop the peripheral GluRIIB segregation pattern 36 hr later. GluRIIB labeling alone is shown in the bottom panel. The right panels show GluRIIB fluorescence and normalized GluRIIA and GluRIIB fluorescent line profiles for the indicated PSDs at the initial imaging session (0 hr) and 36 hr later. (B) Serial images of an NMJ with a larger number of AZs present at the first instar stage. After 36 hr of development, the peripheral segregation of GluRIIB around GluRIIA was first observed in some of the PSDs that were present during the initial imaging session (numbered). The right panels show GluRIIB fluorescence and normalized GluRIIA and GluRIIB fluorescent line profiles for the indicated PSDs at the initial imaging session (0 hr) and 36 hr later. The dashed box surrounds the actual imaged segment of the NMJ in each panel.
Figure 8—figure supplement 1
GluRIIA fluorescence intensity increases over time in a rate proportional to PSD birthdate.
Representative serial images of muscle 26 NMJs visualized through the cuticle of two anesthetized larvae during development (A, B). The dashed box surrounds the actual imaged segment of the NMJ in each panel. The brightest GluRIIA puncta are numbered and followed through the imaging period. The brightest GluRIIA puncta observed on day one were among the brightest puncta on later days. Rarely, formation of new PSDs that showed a faster rate of GluRIIA accumulation were observed (arrow). (C) By day 5 of larval development, many PSDs show the donut-like GluRIIB distribution, though the number of smaller GluRIIB puncta also increase due to new AZ addition.
Figure 9 with 1 supplement
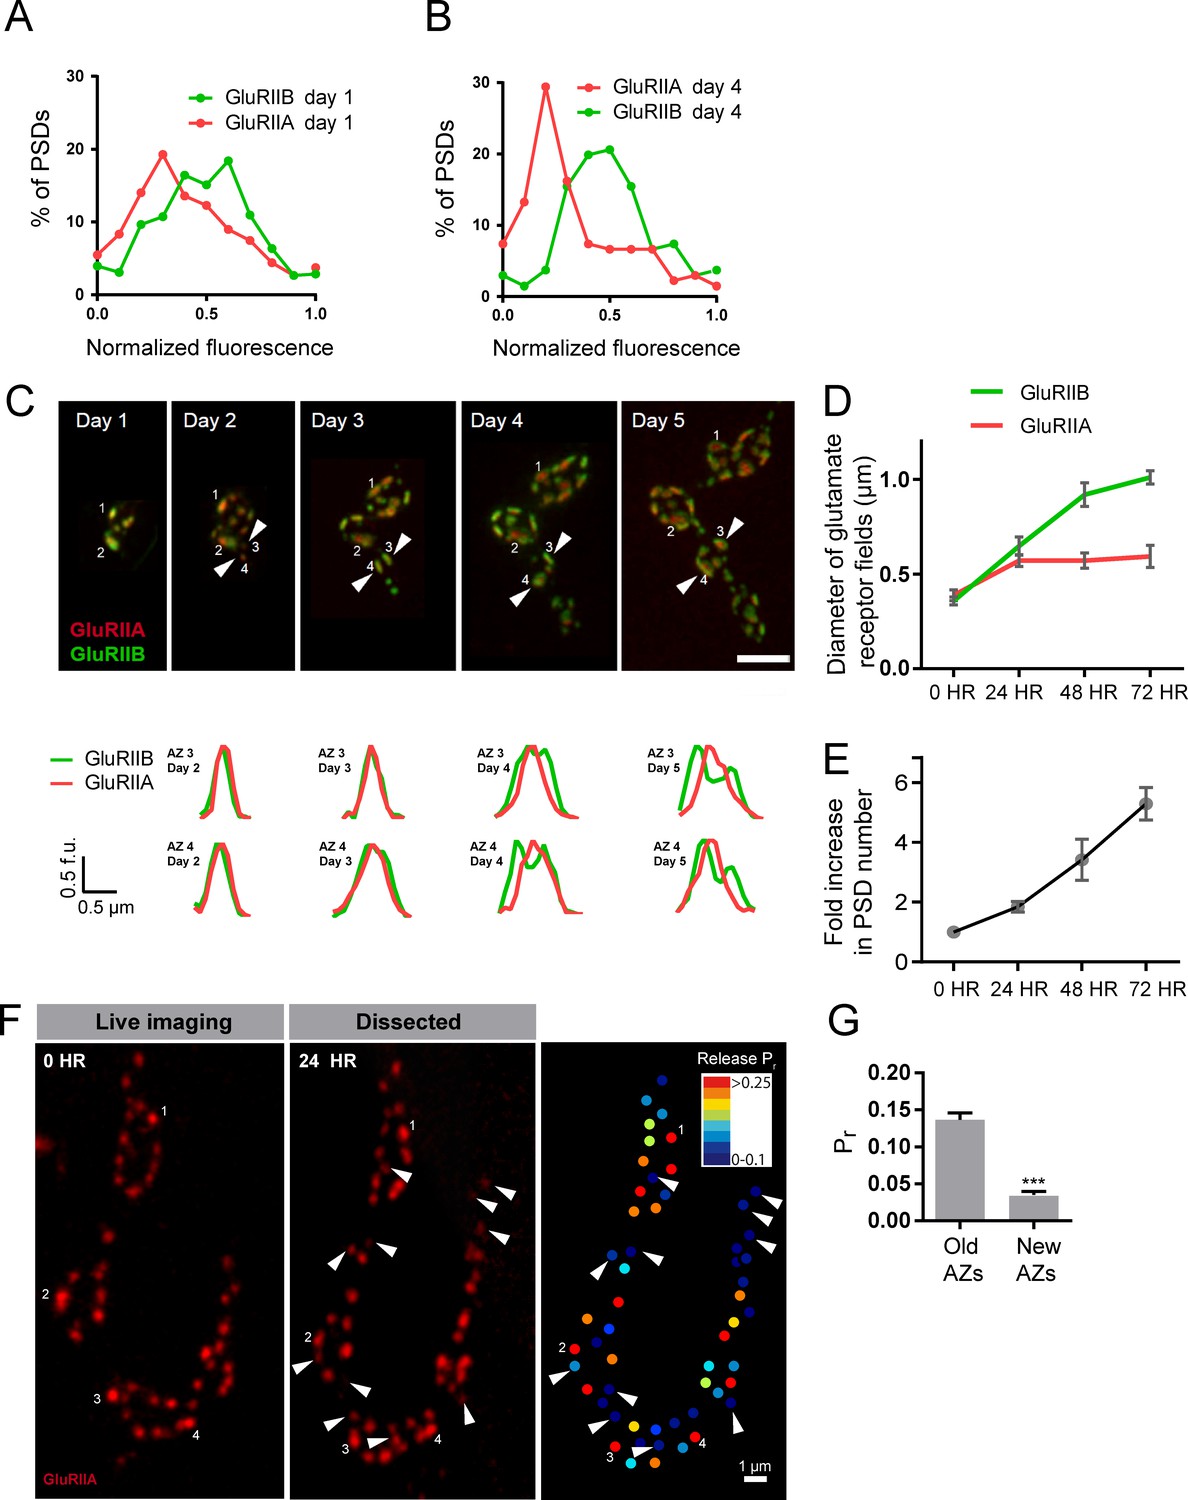
Rate of acquisition of glutamate receptor segregation during development.
Histograms of the distribution of normalized GluRIIA and GluRIIB fluorescence at the first instar (day 1) (A) and third instar (day 4) (B) stages for muscle 26 imaged through the cuticle of anesthetized larvae. For each data set, GluRIIA and GluRIIB fluorescence is presented from dimmest (0) to brightest (1). GluRIIA shows a more skewed distribution of fluorescence at day 4, consistent with its accumulation at high Pr AZs. (C) Representative muscle 26 NMJ image sequence showing appearance and maturation of two new synapses (#3 and 4) that were not present in the initial imaging session. Several preexisting synapses (#1 and 2) that developed the typical GluRIIB donut structure later in development are also labeled. The dashed box surrounds the actual imaged segment of the NMJ. New GluRIIA and GluRIIB clusters appear initially as small puncta (day 2, arrows) that become brighter on day 3. By day four they begin to display the donut like GluRIIB profile. At day 5, GluRIIB distribution to the periphery around a bright GluRIIA PSD representative of high Pr sites becomes prominent. The bottom panels show normalized GluRIIA and GluRIIB fluorescent line profiles for the newly identified PSDs (#3, 4) throughout the 5 day imaging series. (D) Diameter of glutamate receptor fields during the first 72 hr of PSD development. Error bars represent SEM. (E) Changes in AZ number during larval maturation at muscle 26 presented as a ratio of AZs observed during the first day of imaging (day 1). (F) Representative serial time points of GluRIIA-RFP in vivo imaging over 24 hr (left two panels). Newly formed PSDs are marked with white arrows; these displayed uniformly low Pr during release mapping (right panel). Several older PSDs with bright GluRIIA intensity are denoted with white numbers. (G) Average Pr of old AZs (those present in the 0 hr time point initial imaging session) and new AZs (AZs under 24 hr old that were first seen at the 24 hr time point). Student’s t-test was used for statistical analysis (***=p ≤ 0.001). Error bars represent SEM.
Figure 9—figure supplement 1

Comparison of evoked Pr at muscle 4 and muscle 26.
(A) Representative evoked Pr map in second instar larvae, muscle 4. (B) Average evoked Pr for second instar muscle 4, third instar muscle 4, and third instar muscle 26. Student’s t-test was used for statistical analysis (***=p ≤ 0.001). Error bars represent SEM. (C) Histogram and (D) cumulative frequency distribution of evoked Pr in second instar muscle 4, third instar muscle 4, and third instar muscle 26.
Figure 10 with 1 supplement
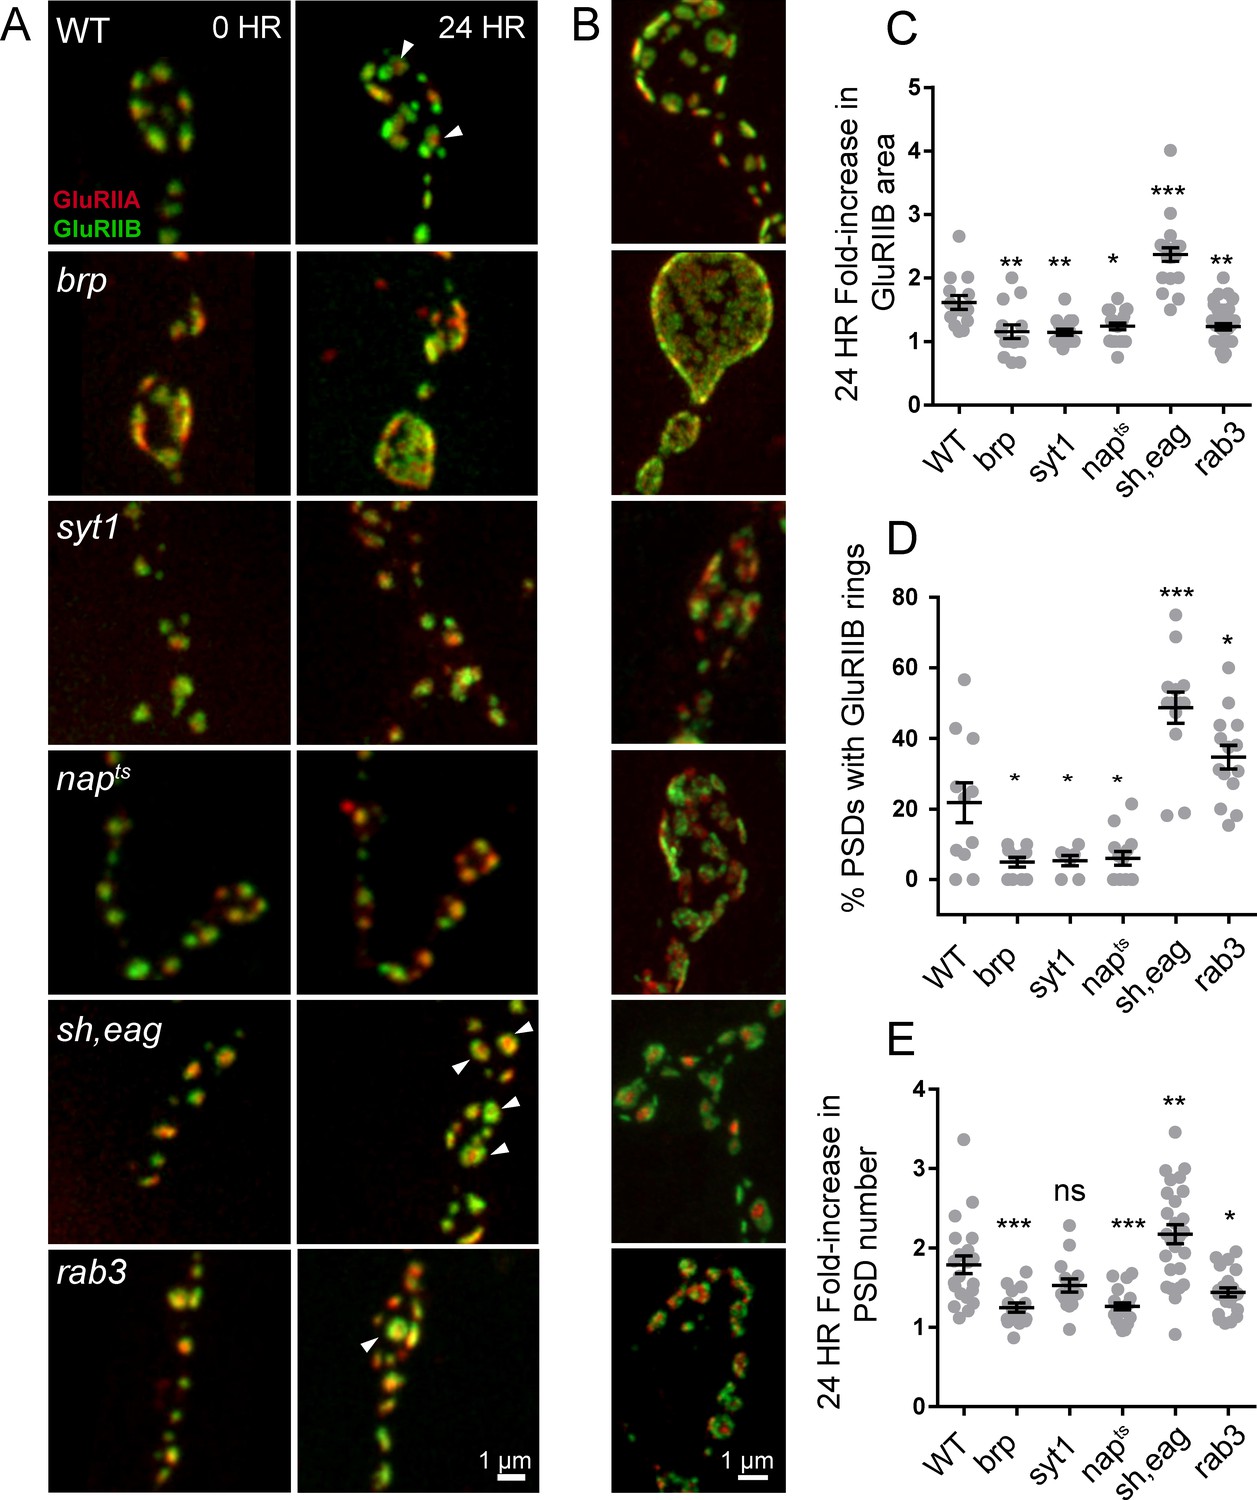
Glutamate receptor field maturation in mutants with altered presynaptic activity.
(A) Representative NMJs on muscle 26 for each genotype imaged intravitally over 24 hr; the 0 hr timepoint (left column) corresponds to imaging during the early first instar stage. White arrows (24 hr) denote PSDs that have acquired GluRIIA/IIB segregation at this time point. (B) Representative third instar PSDs. (C) Fold-increase in GluRIIB area over 24 hr in newly formed PSDs. (D) Percent of PSD fields with GluRIIB rings at the second instar stage. A PSD was considered to have a GluRIIB ring if the line profile through the GluRIIB field had a central dip in fluorescence intensity of greater than 10%. (E) Fold increase in PSD number, defined by the number of GluRIIB puncta, over 24 hr of imaging beginning in the first instar stage. (C–E) Each point represents the average from one NMJ. One way ANOVA followed by Dunnett’s multiple comparisons test was used for statistical analysis (*=p ≤ 0.05, **=p ≤ 0.01, ***=p ≤ 0.001). Error bars represent SEM.
Figure 10—figure supplement 1
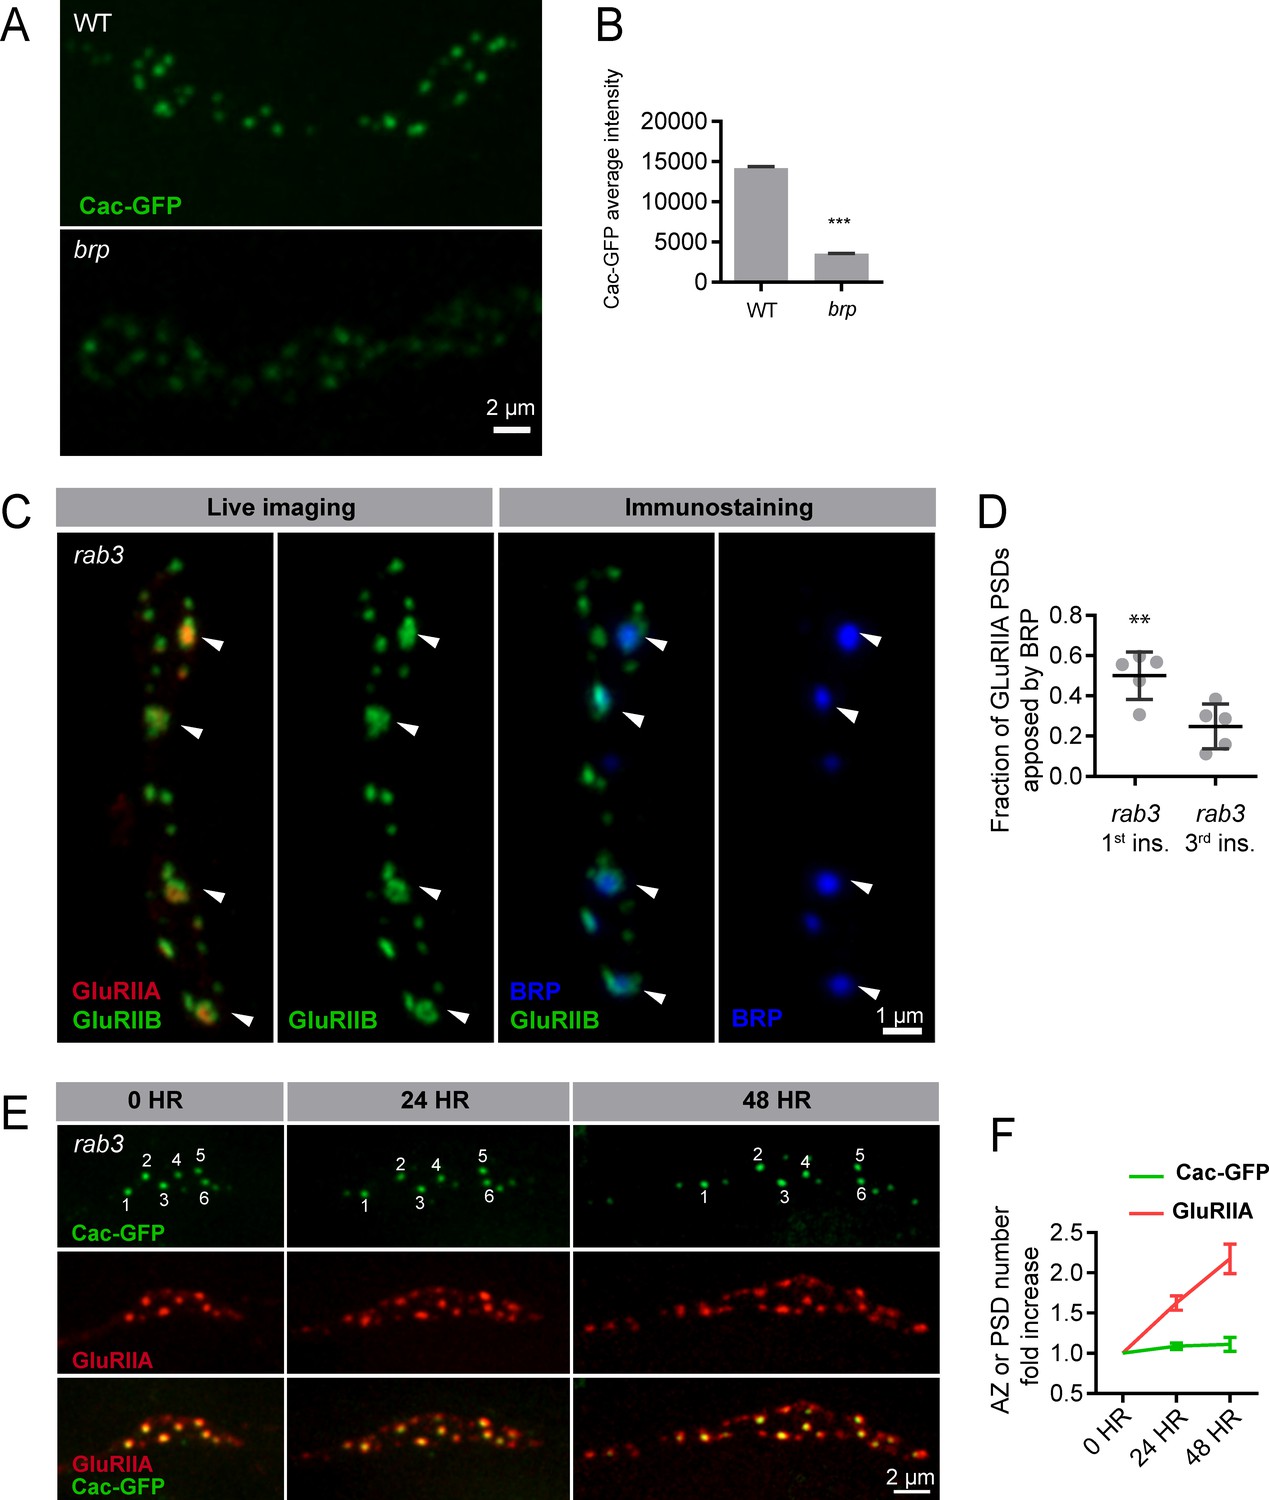
Synapse development in Rab3 mutants.
(A) Representative images of UAS-Cac-GFP driven in neurons using elav-Gal4 in control and brp69/def backgrounds. (B) Cac-GFP average intensity per AZ in control and brp69/def backgrounds. (C) Muscle 26 of rab3 first instar animals expressing GluRIIA-RFP and GluRIIB-GFP imaged live (left two panels) and then fixed and immunostained for BRP (blue; right two panels). Arrows denote release sites with mature glutamate receptor fields; these sites are enriched in BRP. (D) Fraction of GluRIIA PSDs apposed by AZs containing BRP in first instar vs. third instar rab3 larvae. (E) Rab3 animals expressing UAS-Cac-GFP and GluRIIA-RFP followed intravitally over 48 hr of development, beginning in the first instar stage (day 1). Numbers (top row) mark AZs enriched in Cac-GFP on day 1, showing these AZs remain stably enriched for Cac-GFP throughout the 48 hr imaged. (F) Fold increase in number of GluRIIA puncta (red) and Cac-GFP puncta (green) every 24 hr. Student’s t-test was used for statistical analysis (***=p ≤ 0.001). Error bars represent SEM.
Figure 11

Model depicting the acquisition of release heterogeneity over three days of NMJ development.
(A) Presynaptically, Ca2+ channels (yellow) and BRP (blue) are added over time to increase release probability. Postsynaptically, GluRIIA and GluRIIB are added during maturation and eventually segregate at high releasing sites. (B) The number of AZs roughly doubles every 24 hr, with all new AZs having low release probability (blue dot). AZs increase in release probability over time and eventually reach high Pr status (red dot).
Videos
Video 1
Representative movie showing evoked and spontaneous GCaMP6s events (green) in larvae expressing GluRIIA-RFP (red) that were stimulated at 0.3 Hz.
https://doi.org/10.7554/eLife.38268.003
Video 2
Representative movie showing spontaneous GCaMP6s events in syt1 mutants expressing GluRIIA-RFP (red), followed by GCaMP6s events observed during 5 Hz stimulation.
https://doi.org/10.7554/eLife.38268.006
Video 3
Representative movie showing evoked and spontaneous jRGECO events (red) in larvae expressing Cac-GFP (green).
https://doi.org/10.7554/eLife.38268.010
Video 4
Representative movie showing evoked release events in larvae expressing GluRIIA-RFP (red), GluRIIB-GFP (bright green), and postsynaptic LexAop-myrGCaMP6s.
https://doi.org/10.7554/eLife.38268.019Additional files
-
Transparent reporting form
- https://doi.org/10.7554/eLife.38268.027
Download links
A two-part list of links to download the article, or parts of the article, in various formats.
Downloads (link to download the article as PDF)
Open citations (links to open the citations from this article in various online reference manager services)
Cite this article (links to download the citations from this article in formats compatible with various reference manager tools)
Characterization of developmental and molecular factors underlying release heterogeneity at Drosophila synapses
eLife 7:e38268.
https://doi.org/10.7554/eLife.38268


