Range, routing and kinetics of rod signaling in primate retina
- University of Washington, United States
Figures
Figure 1
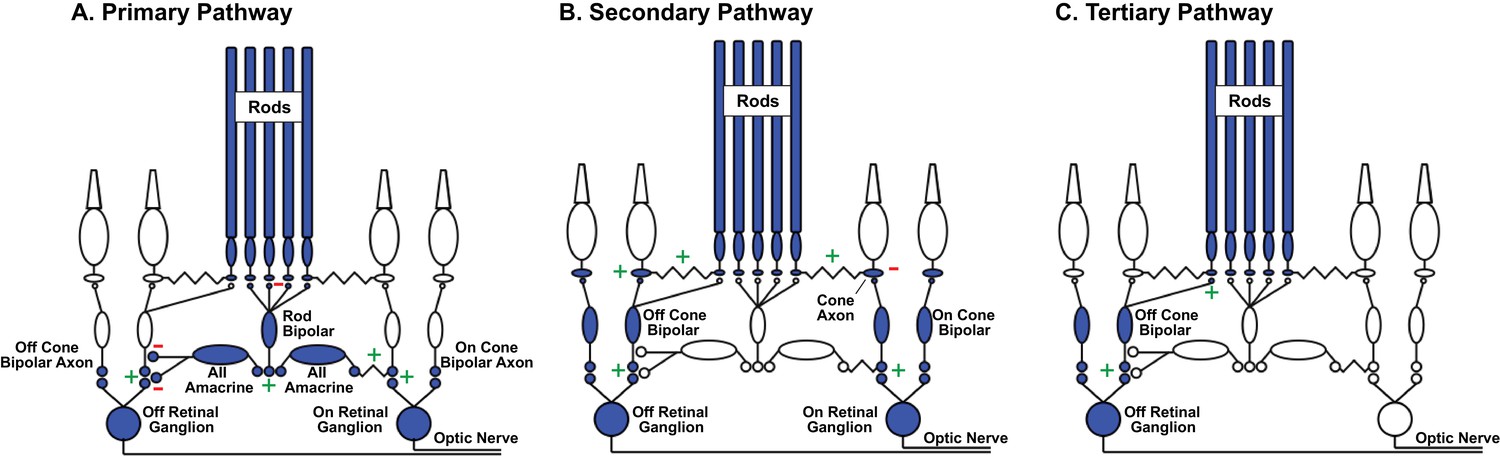
Rod signal routing in the mammalian retina.
(A) In the primary pathway, rod signals are routed through dedicated rod bipolar cells to AII amacrine cells. AII amacrine cells in turn transmit ‘On’ signals to On cone bipolar cells through dendro-axonal gap junctions and ‘Off’ signals to Off cone bipolar cells through glycinergic synapses. Cone bipolar signals are subsequently transmitted to retinal ganglion cells. (B) In the secondary pathway, rod transmit signals via gap junctions to cone axons, and hence the associated cone circuitry (Kolb, 1977; Schneeweis and Schnapf, 1995; Deans et al., 2002; Hornstein et al., 2005). (C) In the tertiary pathway, rods transmit signals directly to Off cone bipolar cell dendrites (Soucy et al., 1998; Hack et al., 1999; Tsukamoto et al., 2001). Plus and minus signs represent sign-conserving and sign-inverting synapses.
Figure 2
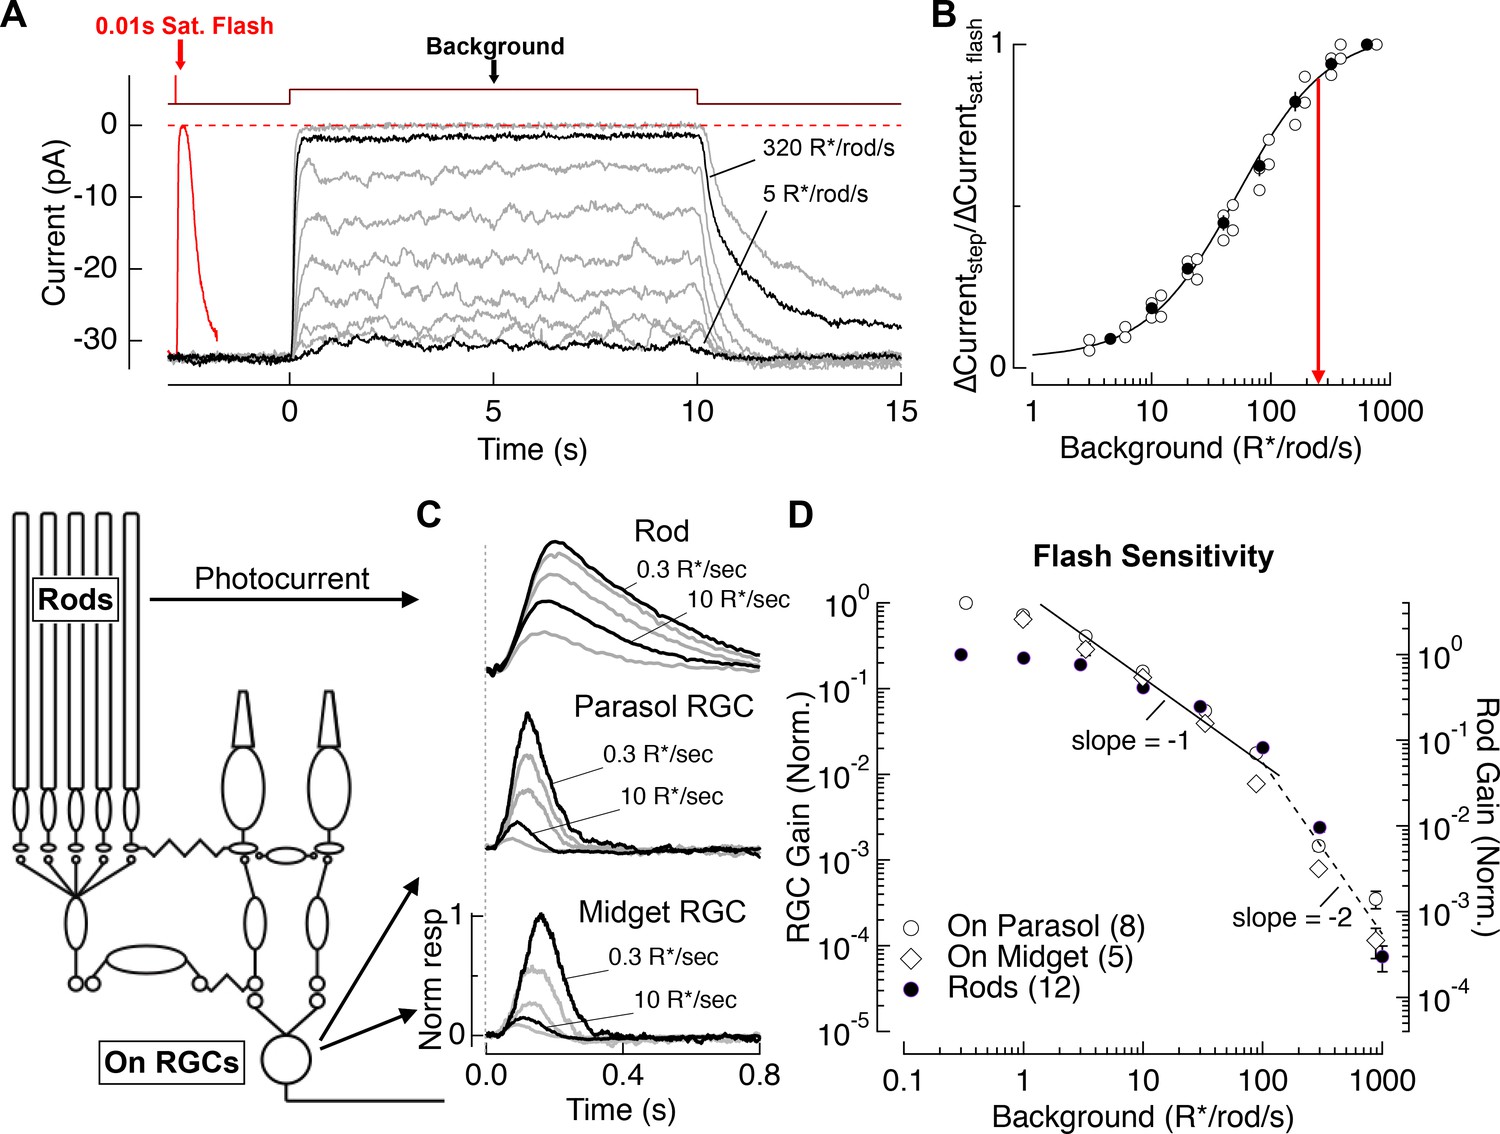
Evaluation of the range of rod signaling in phototransduction and in the retinal output.
(A) Direct recordings of photocurrent from rod outer segments (primate). Comparison of the responses to a short-wavelength saturating flash and a family of 10 s light steps or ‘backgrounds.’ (B) Current suppression, relative to saturation, plotted as a function of background luminance. Red arrow (250 R*/rod/s) indicates 90% saturation. (C) Gain of rod signals probed with short wavelength flashes on a range of rod adapting backgrounds in rod photoreceptors (top), On parasol RGCs (middle) and On Midget RGCs (bottom; traces are mean responses scaled by the flash strength in R*/rod, see Materials and methods). Gain is normalized to that measured at 0.3 R*/rod/s. (D) Population data for rod gain measurements in rod photoreceptors and ganglion cells. The solid line shows Weber behavior, and the dashed line highlights the steep drop in gain associated with rod saturation. Gain is normalized to that measured at 0.3 R*/rod/s.
-
Figure 2—source data 1
Excel spreadsheet with data for Figure 2B and D.
- https://doi.org/10.7554/eLife.38281.004
-
Figure 2—source data 2
Matlab .mat file with data traces from Figure 2A.
- https://doi.org/10.7554/eLife.38281.005
-
Figure 2—source data 3
Matlab .mat file with data traces from Figure 2C.
- https://doi.org/10.7554/eLife.38281.006
Figure 3 with 3 supplements
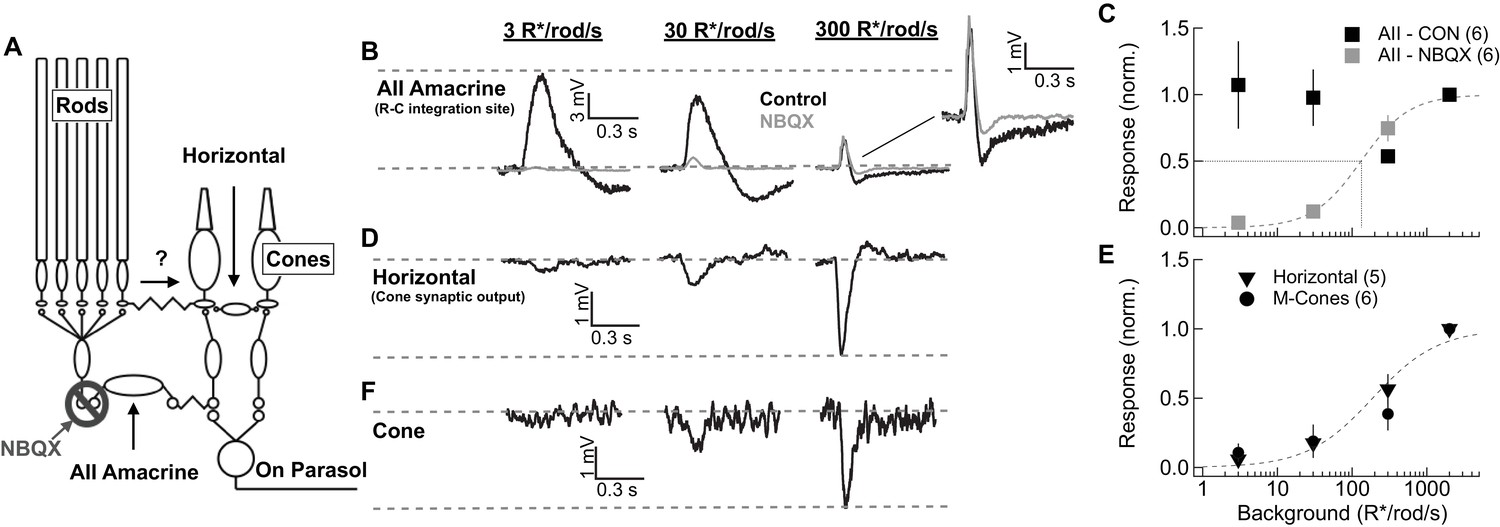
Comparison of rod signal strength in cells of the primary and secondary rod pathways (primate).
(A) Schematic of the primary and secondary rod pathways and action of the pharmacological manipulation used in the AII amacrine recordings. (B,D,F) Responses to short wavelength 600% contrast flashes across a range of rod backgrounds in AII amacrine cells, H1 horizontal cells, and M-cones. (B) Voltage responses of a current-clamped AII amacrine cell before (black) and during exposure to NBQX (10 µM). (C) Population data for AII amacrine recordings with and without NBQX. Responses are normalized by the response amplitude measured at 2000R*/rod/s. (D) Voltage responses of a current-clamped H1 horizontal cell. (E) Population data for H1 horizontal and M-cone recordings. Responses are normalized by the response amplitude measured at 2000 R*/rod/s. (F) Voltage responses of a M-cone recorded in the perforated-patch configuration.
-
Figure 3—source data 1
Excel spreadsheet with data for Figure 3C and E.
- https://doi.org/10.7554/eLife.38281.011
Figure 3—figure supplement 1
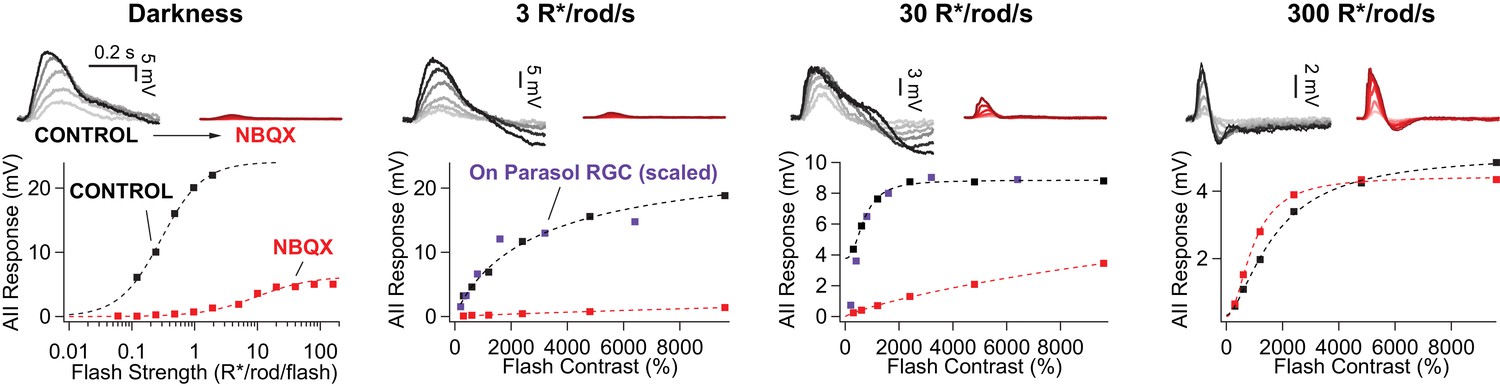
Rod signals in AII amacrine cells are blocked by NBQX (10 µM) at low light levels.
Example current-clamp recording of scotopic and mesopic signaling in an AII amacrine cell. Flash responses in darkness were largely eliminated by bath application of NBQX. NBQX-insensitive responses emerged as flash strength was further increased. In the presence of dim (3 R*/rod/s) and moderate (30 R*/rod/s) backgrounds, stimuli that produce sub-saturating responses in the RGCs (scaled) are almost entirely blocked by NBQX in AII amacrines. At a background of 300 R*/rod/s (i.e. above rod saturation) flash responses in AIIs are largely insensitive to NBQX application.
Figure 3—figure supplement 2
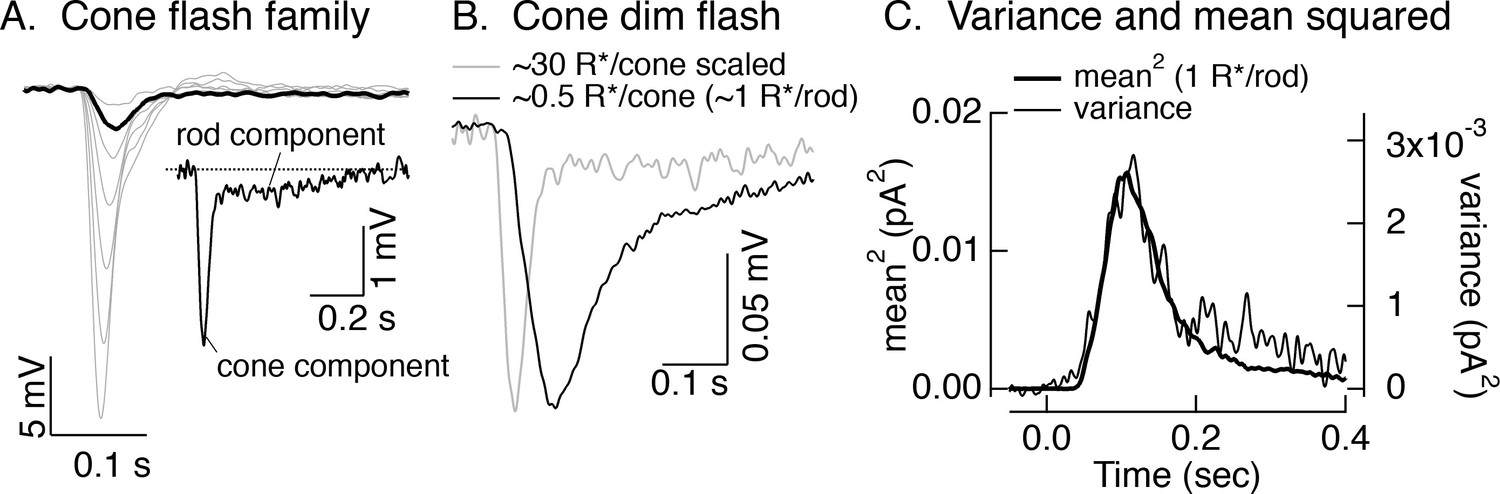
Rod responses measured in cones.
(A) Responses of a L cone to a family of brief 405 nm flashes producing from 15 to 1000 R*/cone. Inset shows an example of the rapid response originating in the cone outer segment and the long ‘tail’ associated with the response originating in the rod outer segment and conveyed to cones through rod-cone gap junctions (see Schneeweis and Schnapf, 1995). (B) Average response of the same cell as in A to a flash producing ~1 R*/rod (black). For comparison, the gray trace shows the scaled response from the inset in A. (C) Mean response squared and time-dependent variance (corrected for variance without a flash) for the same cell as A and B. Assuming the variance is dominated by Poisson fluctuations in photon absorption, the ratio between the mean response squared and the variance provides an estimate of the mean number of absorbed photons contributing to the response. In this cell, that corresponds to a single photon response of 0.022 mV. For six cells, the mean was 0.046 ± 0.007 (mean ± SEM), consistent with previous work (Hornstein et al., 2005).
Figure 3—figure supplement 3
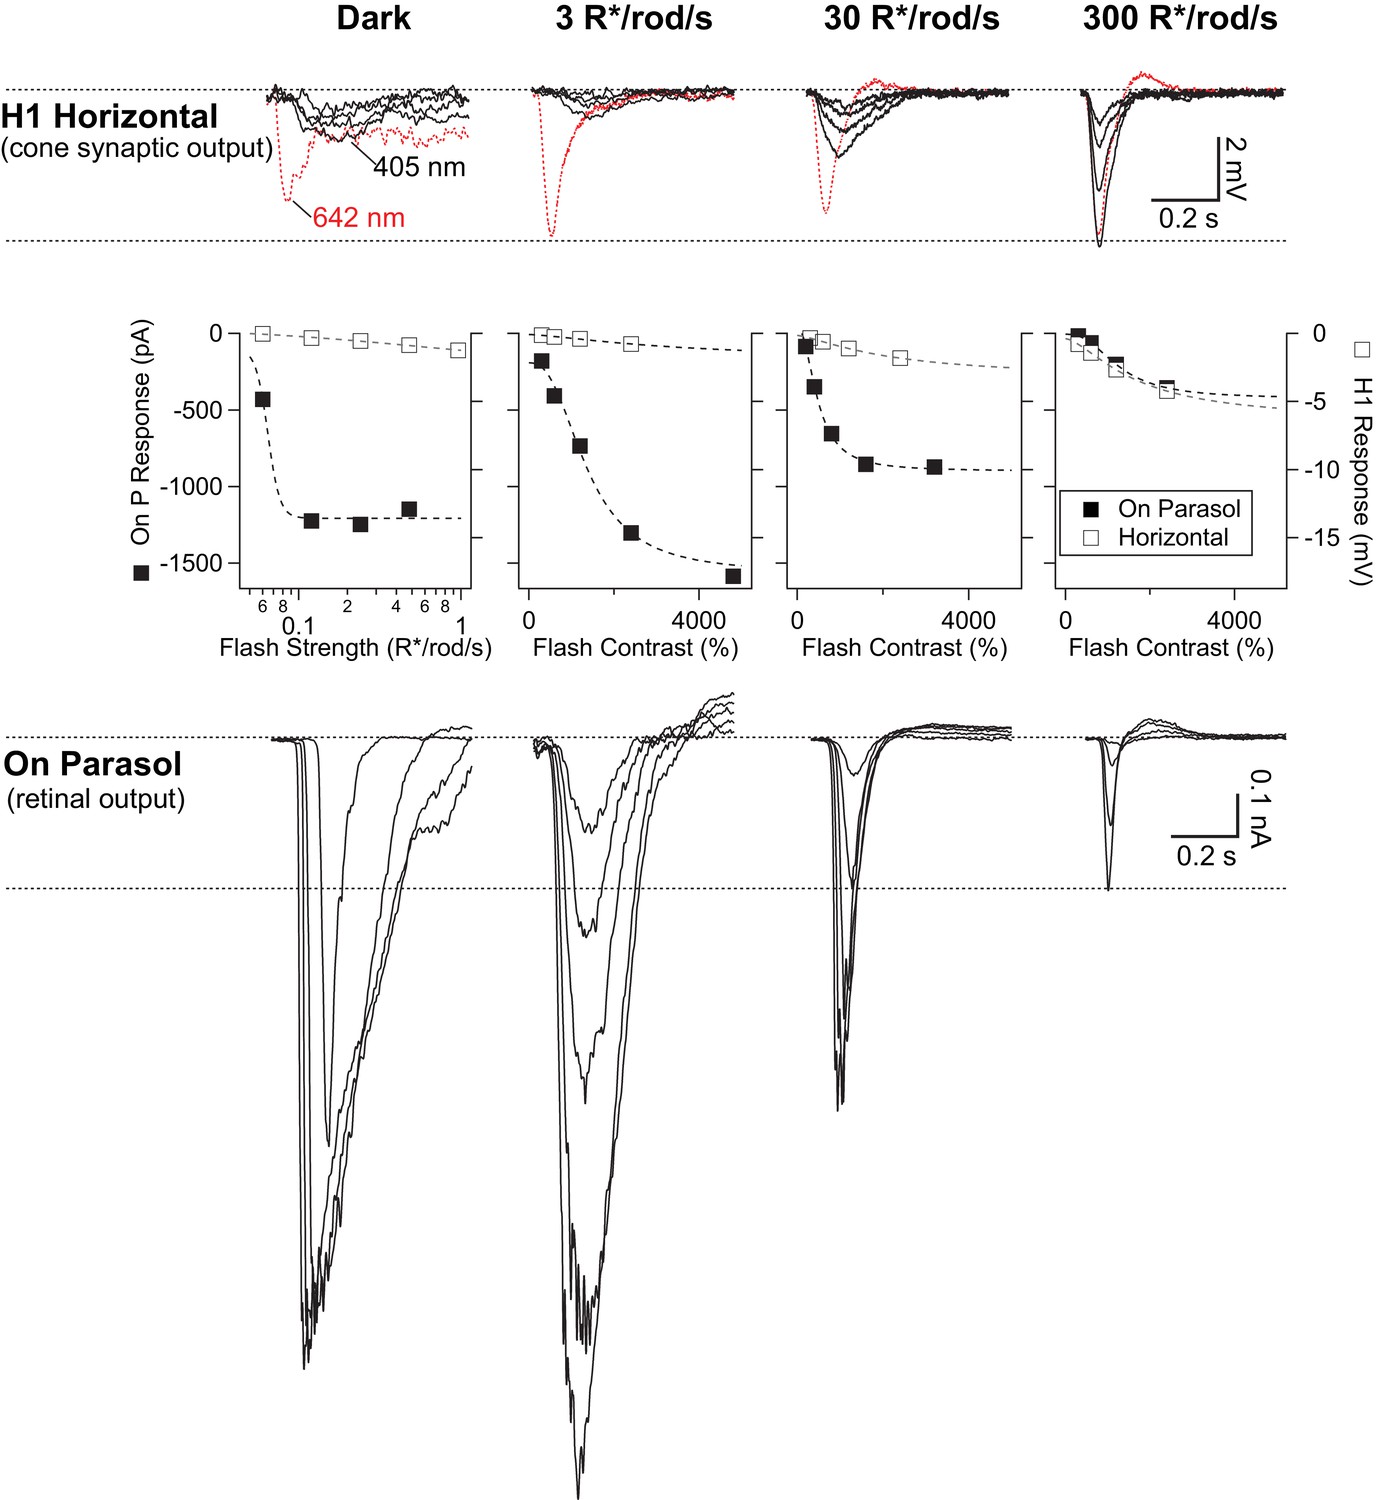
Rod signals are weak in H1 horizontal cells.
Example recordings of a H1 horizontal cell (top row) and an On parasol RGC (bottom row) from the same retinal mount. As in Figure 3—figure supplement 1, short wavelength rod-preferring (and occasional long wavelength cone-preferring) flash responses were recorded across a range of scotopic and mesopic backgrounds. Rod signals in H1 horizontal cells were weak at low and intermediate backgrounds, despite the cells’ robust responses to long wavelength stimuli. At 300 R*/rod/s, long and short wavelength stimuli evoked responses with similar kinetics, suggesting they both arise from cones. On parasol RGC responses, however, were largest at the dimmest light levels. At 300 R*/rod/s, responses in On parasols had kinetics that were similar to those observed in horizontal cells. Right and left ordinate axes on the middle plots are scaled such the RGC and H1 responses are matched at 300 R*/rod/s (a background at which signals are dominated by cone activity).
Figure 4
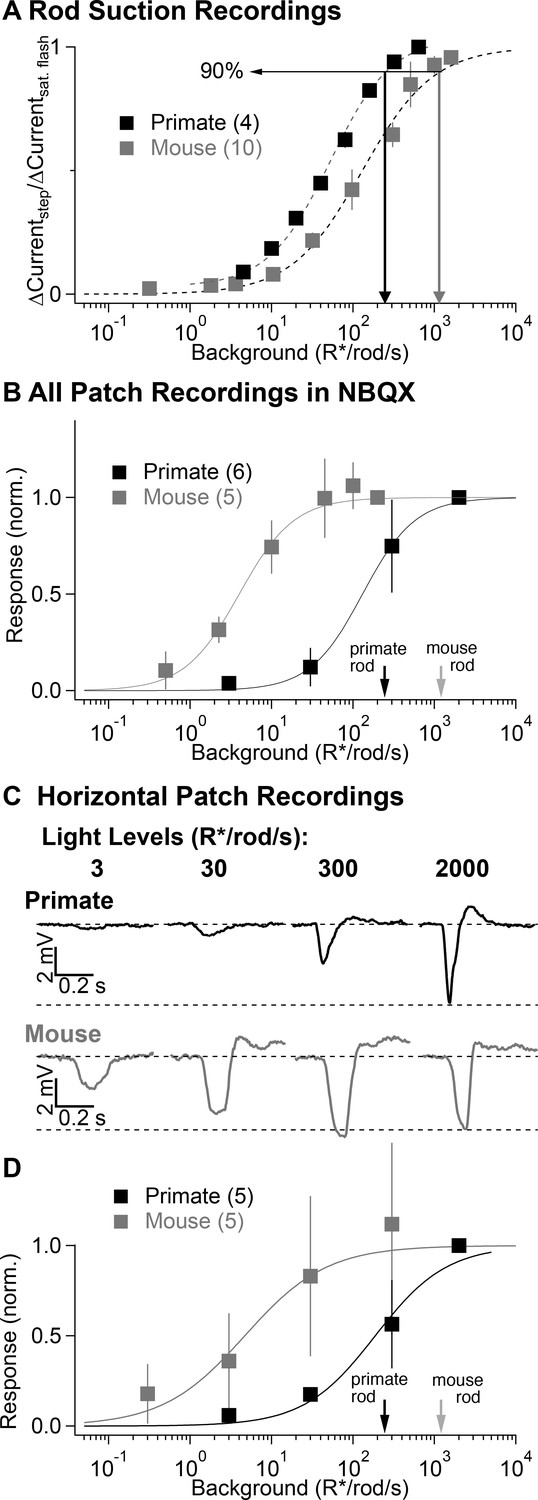
Comparison of secondary pathway activity in mouse and primate under identical experimental conditions.
(A) Steady-state measurements of the dependence of rod current on mean light level from suction recordings in primate and mouse as in Figure 2A. Traces are normalized to the peak amplitude of a brief saturating flash. (B) NBQX-insensitive responses to fixed contrast flashes across backgrounds in AII amacrine cells recorded in current-clamp (as in Figure 3). Asymptotic responses in these experiments (and in C-D) represent Weber behavior, not signal saturation. Black and gray arrows indicate primate and mouse 90% rod saturation levels. (C) Horizontal cell current-clamp recordings to short wavelength flashes across a range of rod adapting backgrounds in primate (top) and mouse (bottom) as in Figure 3. (D) Population data from horizontal cell recordings in primate and mouse, normalized to the responses recorded at 2000 R*/rod/s.
-
Figure 4—source data 1
Excel spreadsheet with data for Figure 4A, B and D.
- https://doi.org/10.7554/eLife.38281.013
Figure 5 with 1 supplement
Rod-signals generated by sine-wave stimuli are also restricted to the RB pathway at backgrounds of ~20 R*/rod/s and ~200 R*/L cone/s.
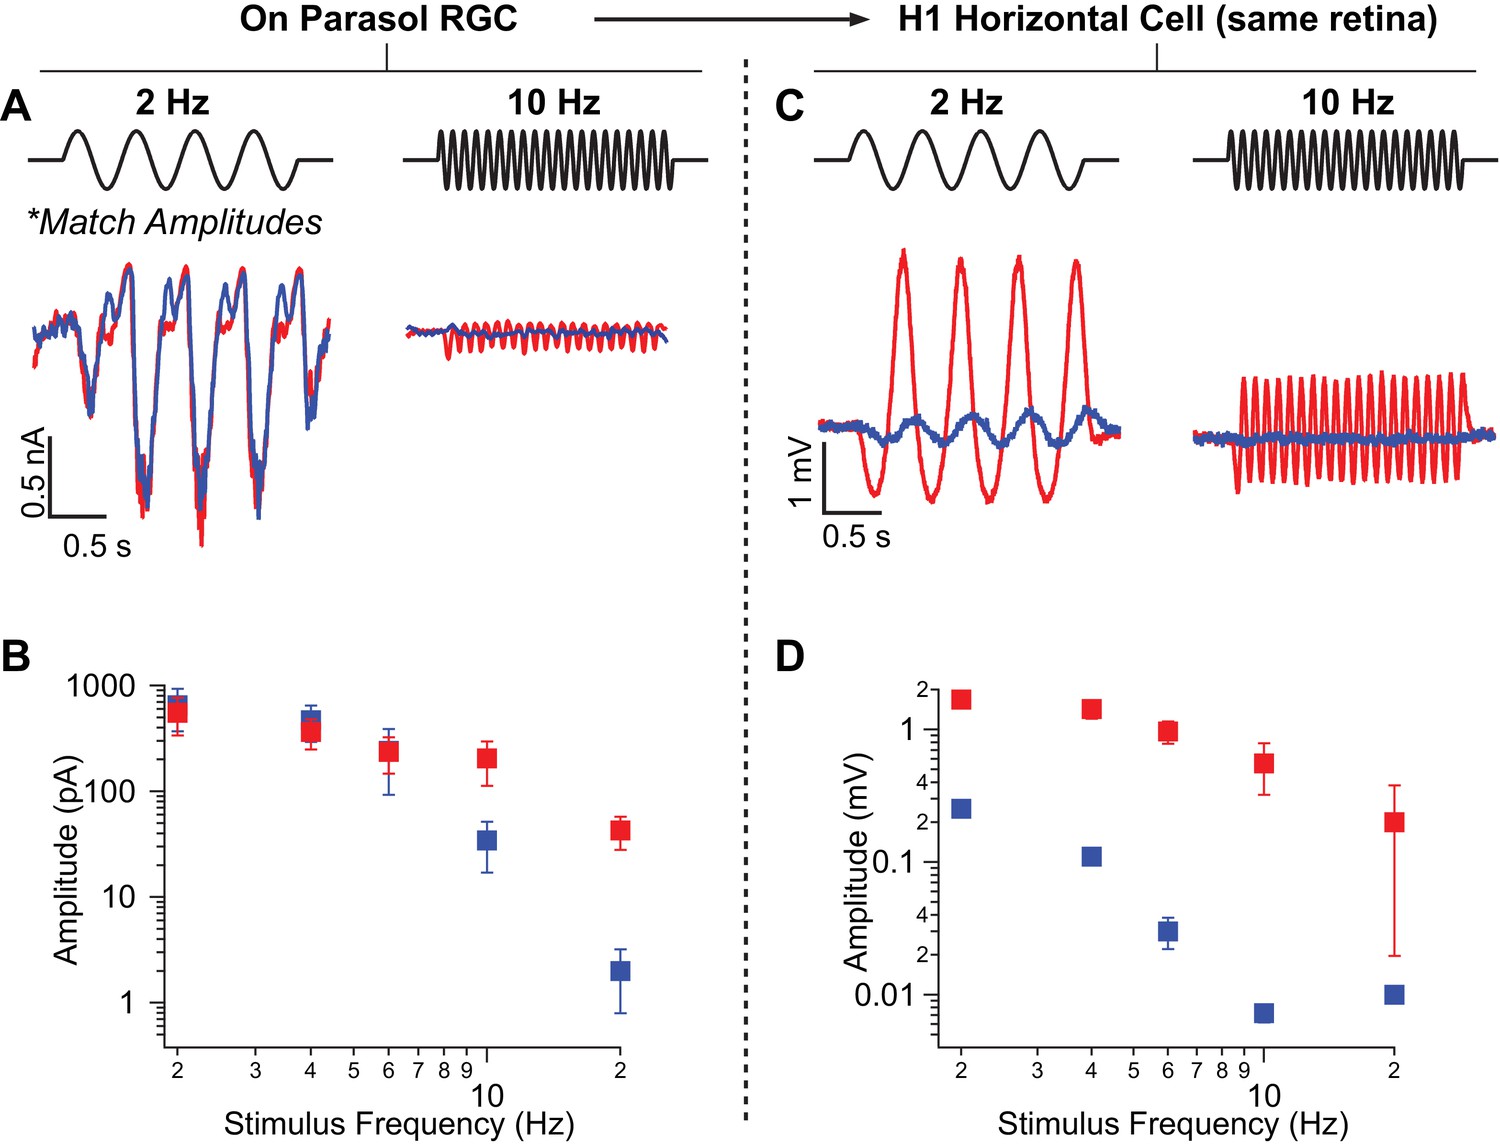
(A) Excitatory synaptic input recorded from an On parasol RGC in response to sinusoidally-modulated short (rod-preferring; blue traces) and long (cone-preferring; red traces) wavelength stimuli. Contrasts were adjusted to produce equal modulation at 2 Hz and were then held fixed for all subsequent recordings (e.g. different frequencies, horizontal recordings). (B) Population data from On parasol RGC recordings (n=2) plotting response modulation versus stimulus frequency. (C) Voltage response of an H1 horizontal cell (from the same retinal mount) to short and long wavelength stimuli for the same contrast used for the parasol cell in A. (D) Population data from H1 horizontal recordings (n=4) plotting response modulation versus stimulus frequency.
-
Figure 5—source data 1
Excel spreadsheet with data for Figure 5B and D.
- https://doi.org/10.7554/eLife.38281.016
Figure 5—figure supplement 1
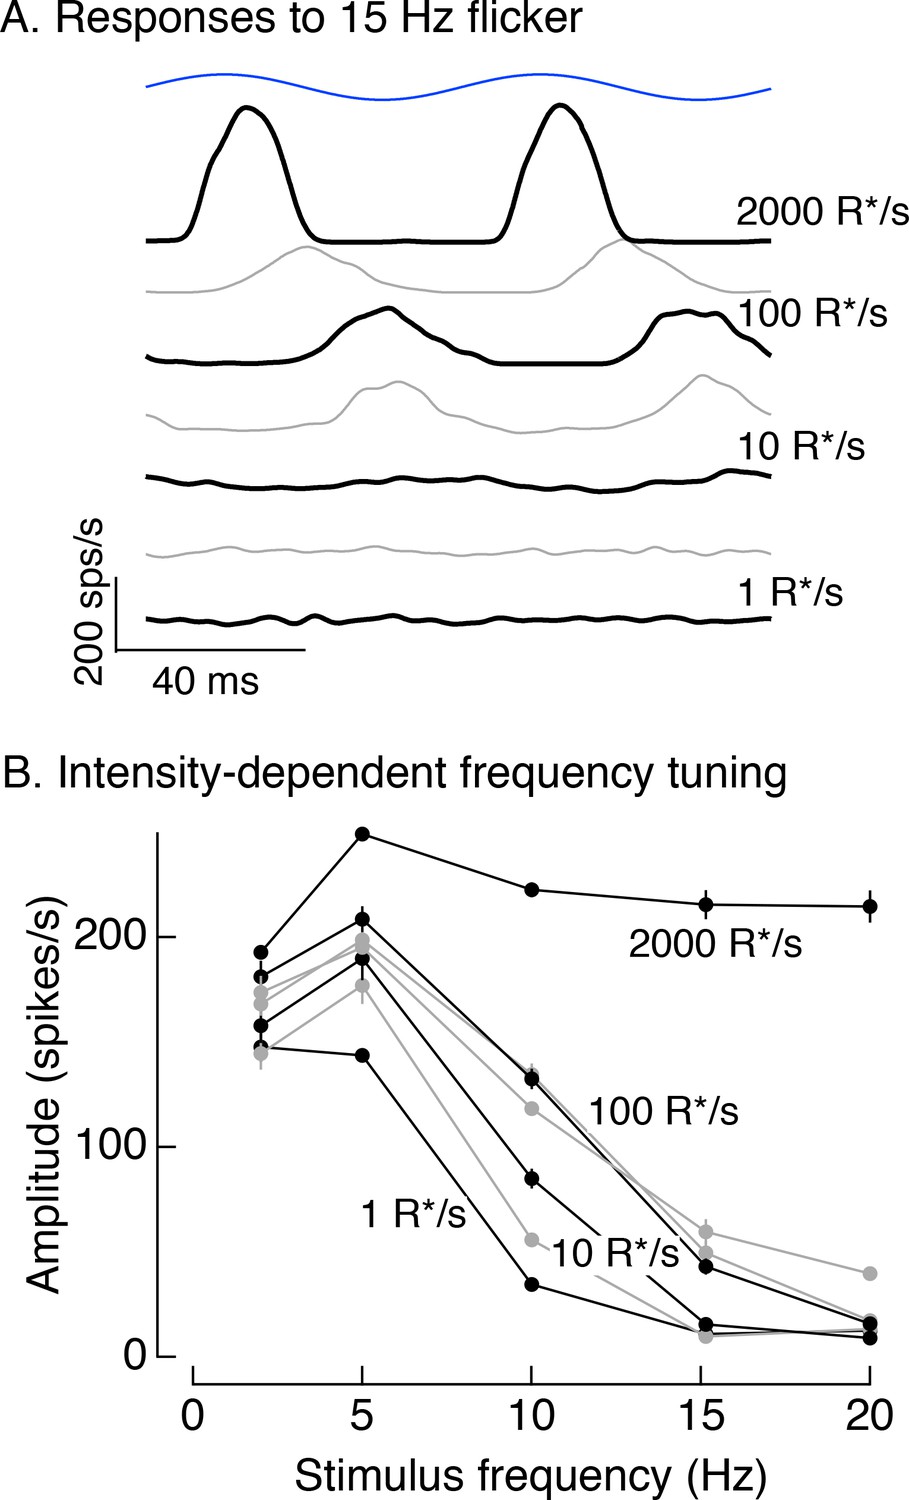
Responses to 100% contrast short wavelength LED modulation across stimulus frequency and background.
(A) Spike responses to 15 Hz flicker in On parasol RGCs across a range of backgrounds. (B) Responses across frequencies and backgrounds. Averaged spike responses for each cell were fit with sine waves matched to the stimulus frequency. The amplitudes of these fits were used for this analysis. Plot collects data from 4 On and 4 Off parasol cells (mean ± SEM).
Figure 6 with 1 supplement
Rod signals in the tertiary rod pathway are weak in primate retina.
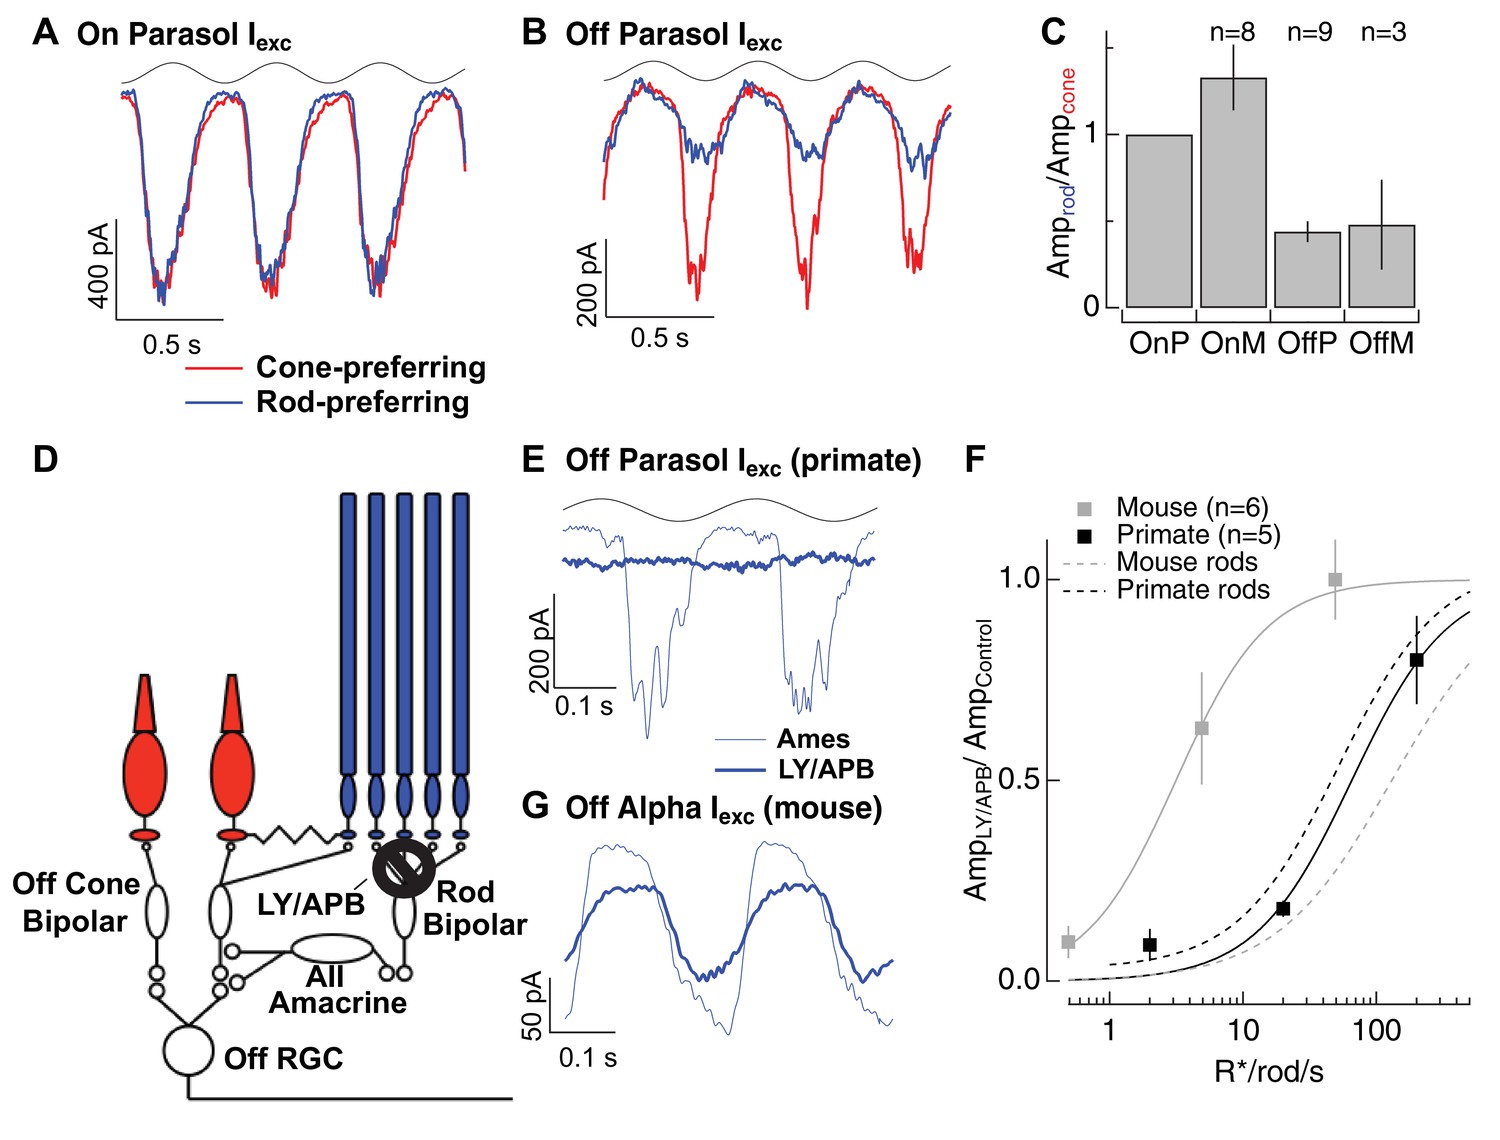
(A) Excitatory synaptic input recorded from an On parasol RGC in response to sinusoidally modulated short (rod-preferring; blue traces) and long (cone preferring; red traces) wavelength stimuli. Contrasts were adjusted to produce equal modulation at 2 Hz, and were then held fixed for subsequent recordings from other cell types (e.g. Off parasol RGC). (B) Excitatory synaptic input recorded from an Off parasol RGC from the same retinal mount as A and in response to the same stimuli. (C) Relative weighting of rod and cone signals in excitatory inputs to On and Off RGCs. Mean light levels for A-C were~20R*/rod/s and~200R*/L-cone/s. (D) Schematic of the primary and tertiary rod circuits that influence Off cone bipolar signaling and the actions of the mGluR6 agonist/antagonist mixture LY/APB. (E) Rod-derived excitatory synaptic inputs to an Off parasol cell at 20 R*/rod/s in control conditions and after suppressing activity in all On bipolar cells with an mGluR6 agonist/antagonist cocktail (LY/APB, see Materials and methods). (F) Response ratio (cocktail:control) across cells as a function of mean luminance. Data are plotted as mean ± SEM. (G) Rod-derived excitatory inputs to an Off alpha RGC (mouse; 5 R*/rod/s) in control conditions and after suppressing activity in all On bipolar cells with an mGluR6 agonist/antagonist cocktail (LY/APB, see Materials and methods).
-
Figure 6—source data 1
Excel spreadsheet with data for Figure 6C and F.
- https://doi.org/10.7554/eLife.38281.019
Figure 6—figure supplement 1
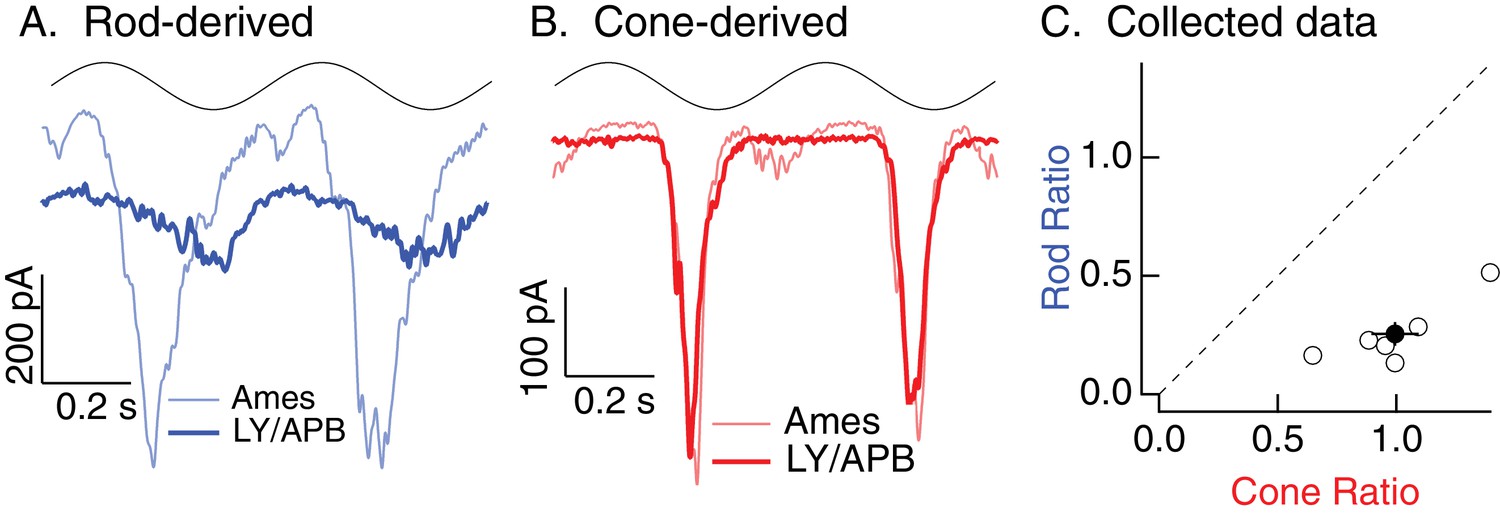
Rod, but not cone, signals in excitatory inputs to Off parasol RGCs arise from the primary rod pathway under mesopic conditions.
Example recording of excitatory synaptic input to an Off parasol RGC in response to 2 Hz sine wave modulation of a short (rod-preferring; 100% contrast) or long (cone-preferring; 50% contrast) wavelength LED on a background of ~20 R*/rod/s and ~200 R*/L cone/s. Responses to short, but not long, wavelength light modulations were largely eliminated by a mixture of LY341495 and APB (see Materials and methods).
Figure 7
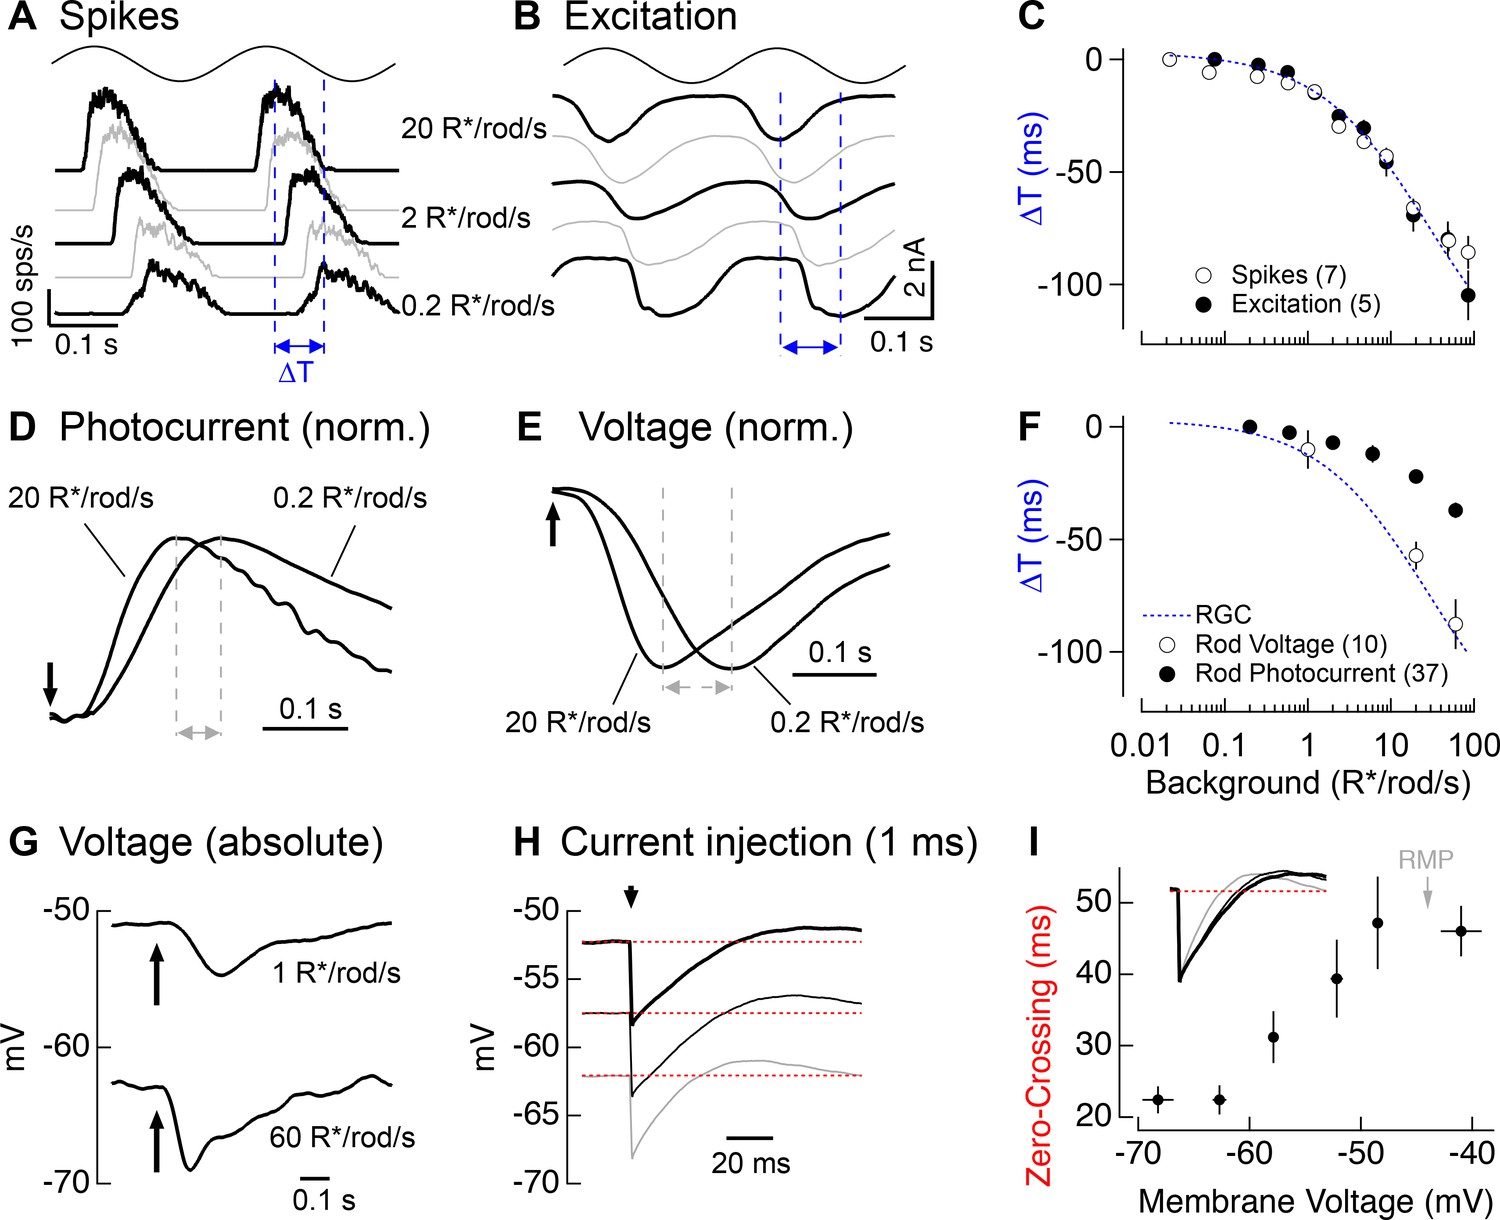
Change in kinetics of rod-derived responses across light levels.
(A) Spike responses to 4 Hz sinusoidal stimuli recorded from an On parasol across a range of rod backgrounds. (B) Excitatory input currents to the same 4 Hz stimuli. (C) Temporal shifts in On parasol responses plotted versus background luminance. The smooth empirical fit to the data is a Hill curve, which is reproduced in F. (D) Recordings of rod outer segment photocurrents in response to brief flashes for two rod backgrounds (normalized). (E) Whole-cell current-clamp recordings from rod photoreceptors to brief flashes for the same two backgrounds as D (normalized). (F) Temporal shifts in rod photoreceptor recordings plotted versus rod background. (G) Exemplary current-clamp recording of a rod photoreceptor responding to a brief flash on two different rod backgrounds. Rods exhibited large steady-state hyperpolarizations as luminance levels increased. (H) Membrane response of a rod to a 1 ms current injection recorded at various physiological membrane potentials. Red dotted lines show bas(I) Measured zero-crossing time of rod responses (n=9) to 1 ms current injections plotted as a function of baseline membrane potential.
-
Figure 7—source data 1
Excel spreadsheet with data for Figure 7C,F and I.
- https://doi.org/10.7554/eLife.38281.021
Figure 8
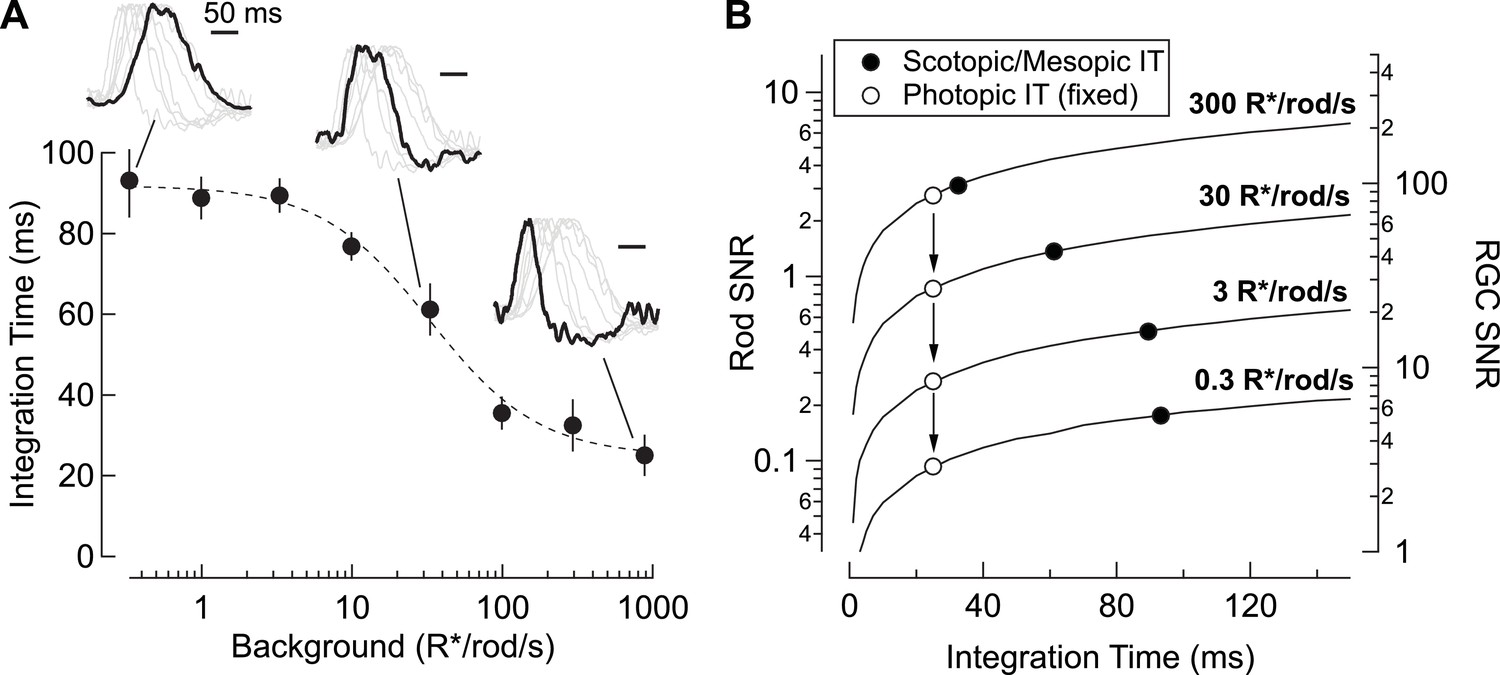
Changes in rod signal kinetics: tradeoffs between timing and SNR.
(A) Integration time of retinal output measured from On parasol RGCs (n=8) as a function of background luminance. Integration time corresponds to the integral of the response (up to the zero-crossing) divided by the peak amplitude. Inset traces show normalized PSTHs of spike responses from On parasol RGCs, with three luminance levels (i.e. 0.3, 30 and 900 R*/rod/s) highlighted. (B) Model simulating the SNR for photon capture for a range of integration times, and for various levels of mean luminance (i.e. photon flux). Longer integration times improve the reliability of retinal encoding. Solid lines represent the SNRs experienced by individual rods (left axis) and individual RGCs (right axis) as a function of integration time (taken from A) for a range of photon capture rates (i.e. luminance). Black markers represent integration time measurements taken from On parasol RGC spike recordings. White markers represent a simulated scenario in which integration time does not increase as luminance decreases (i.e. integration time observed at the highest background tested is held constant).
-
Figure 8—source data 1
Excel spreadsheet with data for Figure 8A.
- https://doi.org/10.7554/eLife.38281.023
Additional files
-
Transparent reporting form
- https://doi.org/10.7554/eLife.38281.024
Download links
A two-part list of links to download the article, or parts of the article, in various formats.
Downloads (link to download the article as PDF)
Open citations (links to open the citations from this article in various online reference manager services)
Cite this article (links to download the citations from this article in formats compatible with various reference manager tools)
Range, routing and kinetics of rod signaling in primate retina
eLife 7:e38281.
https://doi.org/10.7554/eLife.38281


