Spatiotemporally controlled genetic perturbation for efficient large-scale studies of cell non-autonomous effects
- King’s College London, United Kingdom
Figures
Figure 1 with 1 supplement
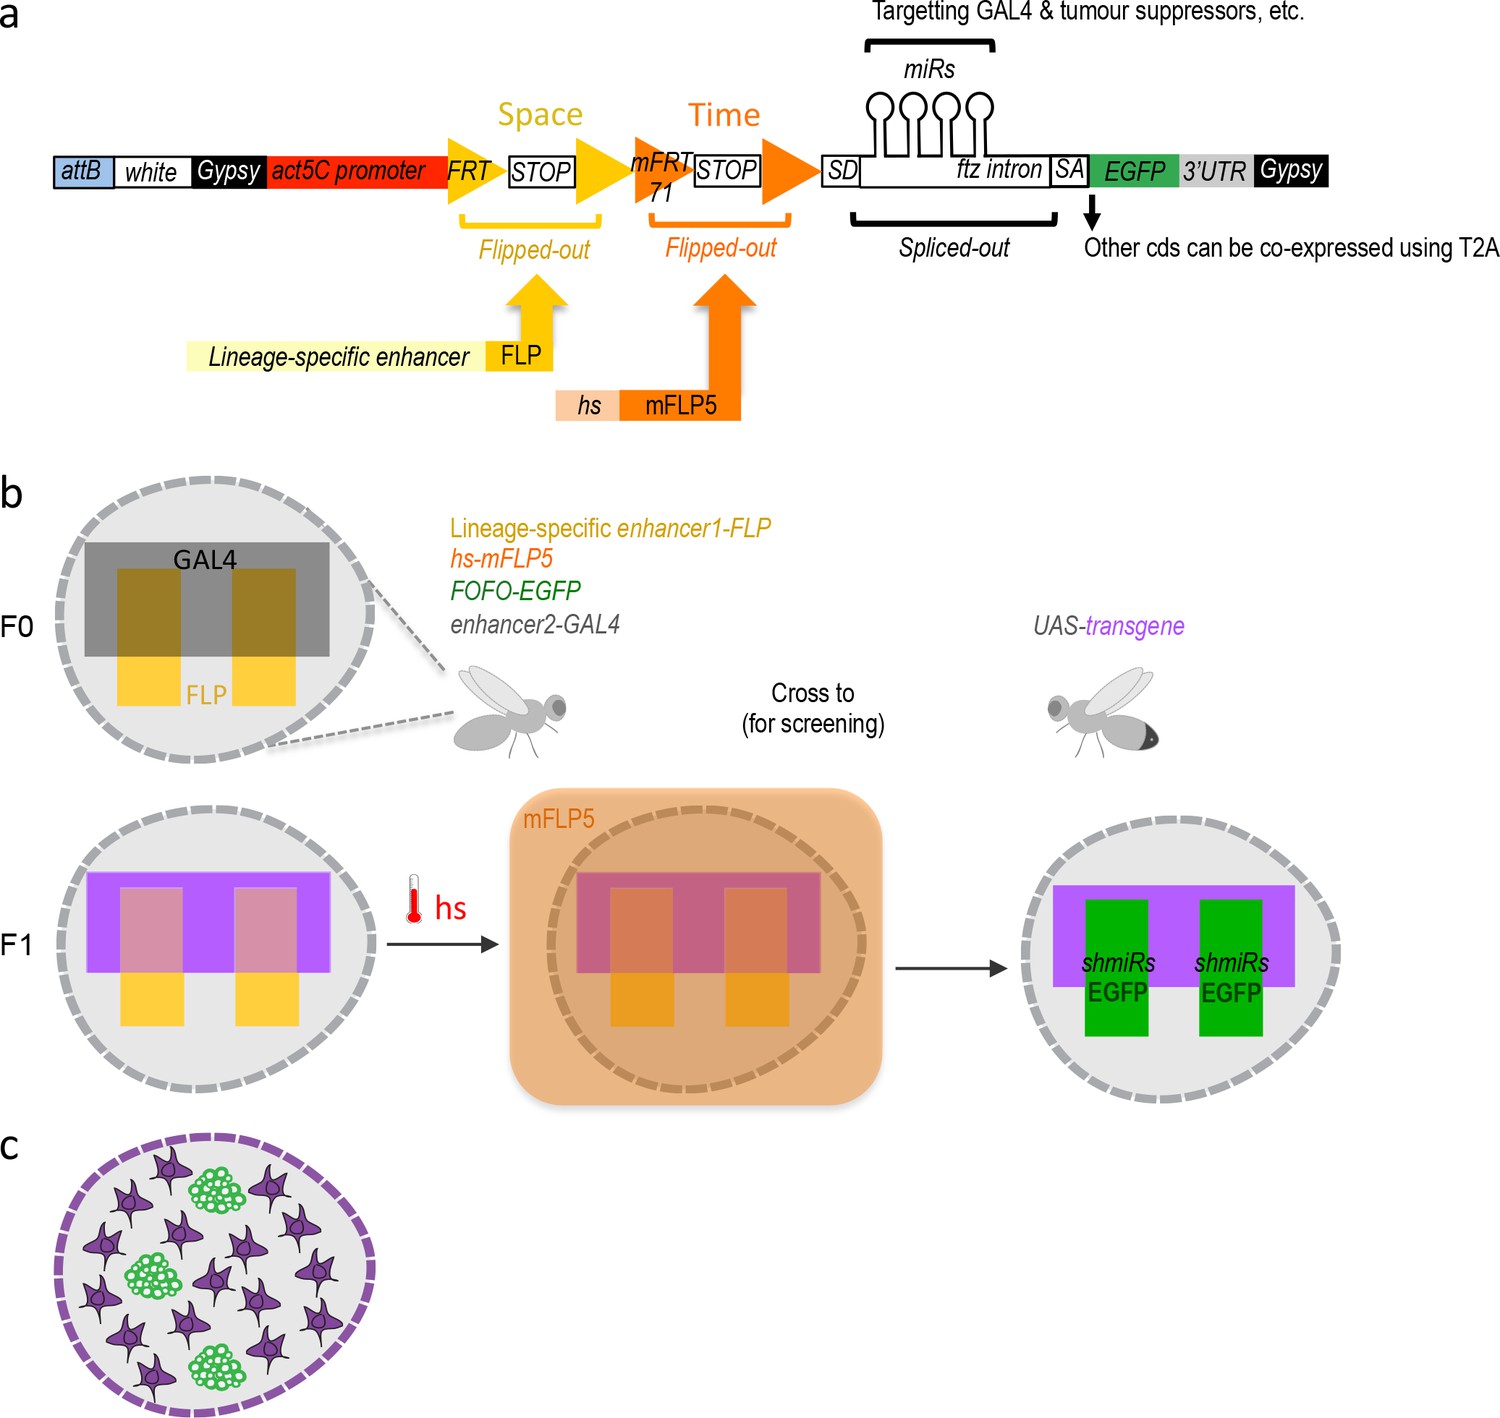
FOFO design and application.
(a) FOFO construct design: the actin5C promoter is blocked from inducing transcript expression by two efficient transcriptional terminator (STOP) cassettes. Each of these is flanked by FRT or mFRT71, specifically recognized by FLP and mFLP5, respectively. Therefore, miRs and EGFP will only be expressed in cells containing the two flippases. Spatial and temporal control is achieved by providing a spatially restricted FLP and hs-induced mFLP5. SD, splice donor; SA, splice acceptor. Following excision of the fushi tarazu (ftz) intron, miRs are processed without detriment to reporter expression. Gypsy insulators minimize position effects whilst enhancing expression levels; attB sites allow site-specific insertion into attP-containing host strains. (b) Schematic of FOFO application. With the insertion sites chosen for this study, flies of the following genotype can be generated: enhancer-FLP; hs-mFLP5, FOFO-EGFP; enhancer2-GAL4 (exemplifying with the GAL4 transgene on the third chromosome, though it could be placed elsewhere). Expression of deleterious sequences (either knock-down by miRs or overexpression alongside the reporter by means of T2A) can be induced (by heat-shock) in a single fly stock (without need to cross) carrying FOFO, a lineage-specific enhancer1-FLP and hs-mFLP5. The point is then to add in the same flies (F0 generation) a GAL4 transgene (enhancer2-GAL4) and cross to UAS responders. The FOFO containing stock expresses FLP in the spatially restricted domain defined by enhancer1 (yellow) in a tissue represented by the grey shape. FLP expression will constitutively excise the first STOP cassette but the presence of a second STOP cassette precludes expression of anything downstream unless flies are subject to hs. The F1 progeny expresses a transgene (purple) in the GAL4-expressing domain defined by enhancer2 (black). Following hs, mFLP5 expression leads to excision of the second STOP cassette and thus expression of miRs and EGFP in the domain covered by the lineage-specific enhancer. Even if the domain of the latter overlaps with that of enhancer2 as depicted, GAL4 miRs will delete GAL4 expression in the EGFP-expressing domain so that the GAL4 domain never overlaps with that of enhancer1 and only cell nonautonomous effects are assessed. (c) Schematic representation of a FOFO application with the tools designed for this study. EGFP-labeled neural tumors (green) are generated within brain lobes (grey shape) in a stock also carrying a GAL4 expressed in glia (purple). Crossing this stock to any UAS-responder lines (could be genome-wide gain- or loss-of-function) will allow identification of genes whose glial expression affects tumor size.
Figure 1—figure supplement 1
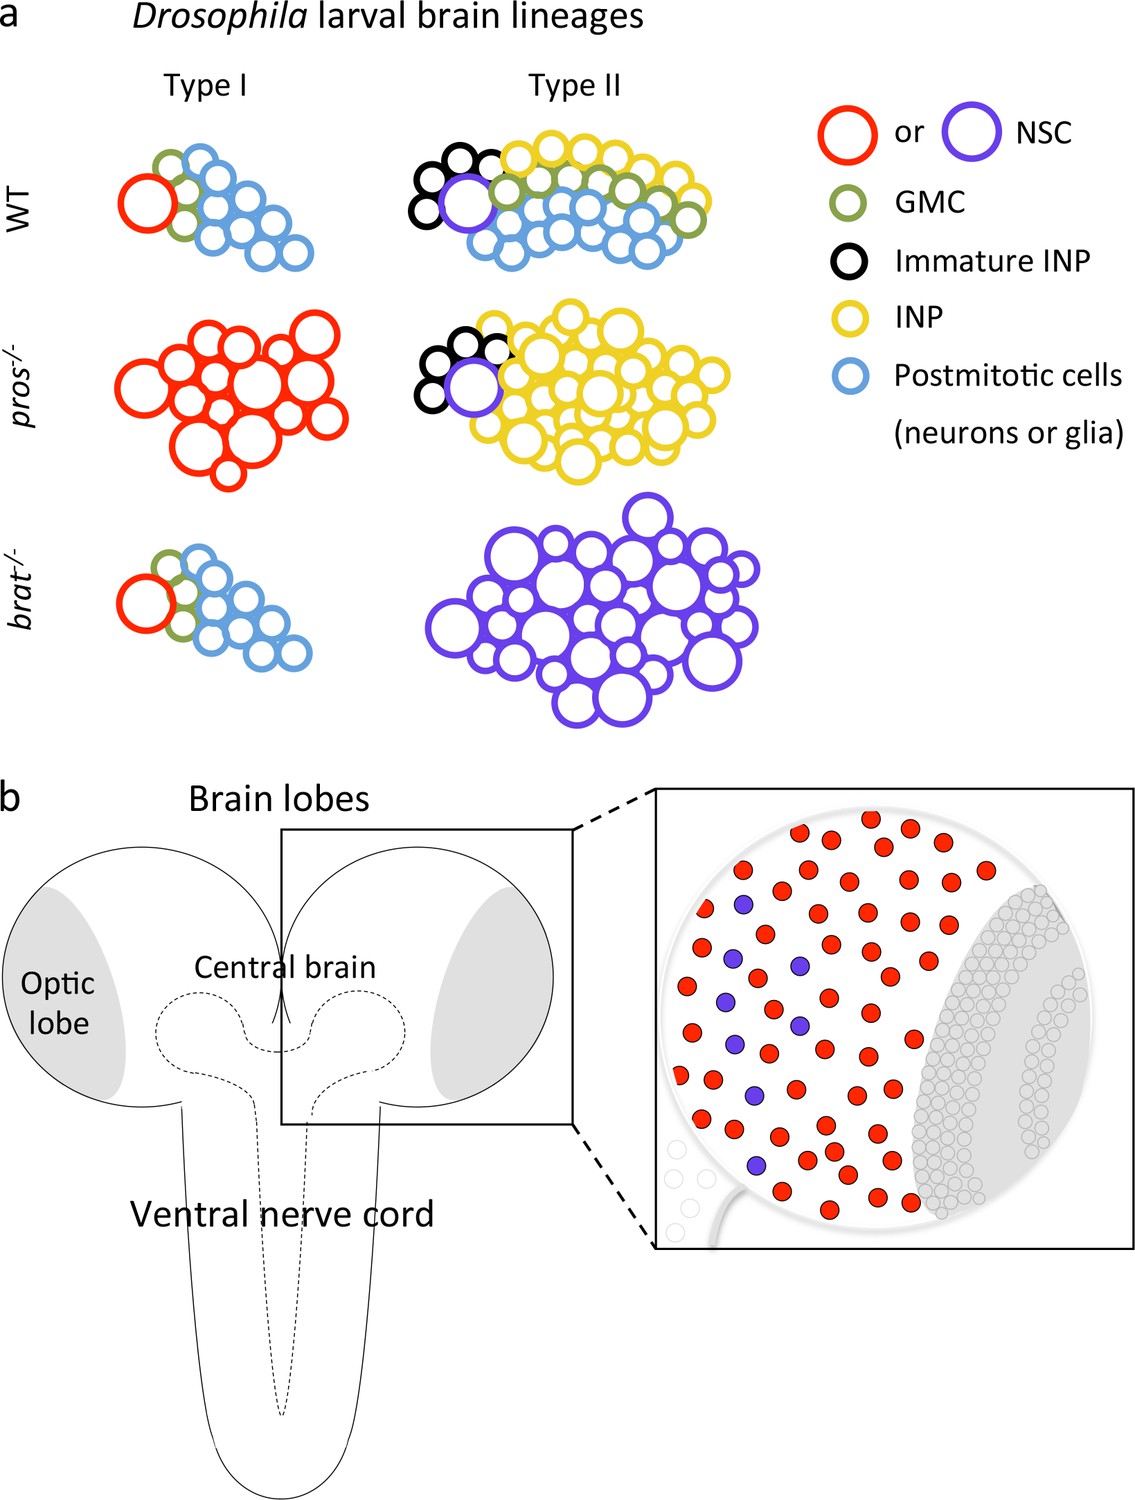
Schematics of Drosophila CNS and NSC lineages.
(a) Schematics of Drosophila type I and II larval brain lineages with color-coded cell types; key on the right. NSC, neural stem cells (type I in red and type II in purple); GMC, ganglion mother cell; INP, intermediate neural progenitor. Wild-type (WT), pros-/- and brat-/- lineages (tumorigenic) are schematized. In pros mutant lineages, GMCs revert to NSCs in type I, and to INPs in type II; brat mutation affects only type II lineages, in which INPs revert to NSCs. (b) Schematic of the Drosophila CNS and its regionalization: each brain lobe consists of central brain and optic lobe regions; each central brain contains ~100 NSCs: eight type II (purple circles) and ~90 type I (red circles). Posterior to the brain is the ventral nerve cord (VNC). (Optic lobe and VNC NSCs are represented by grey circles within amplified schematic). The region outlined by dashed line is the neuropil.
Figure 2 with 1 supplement
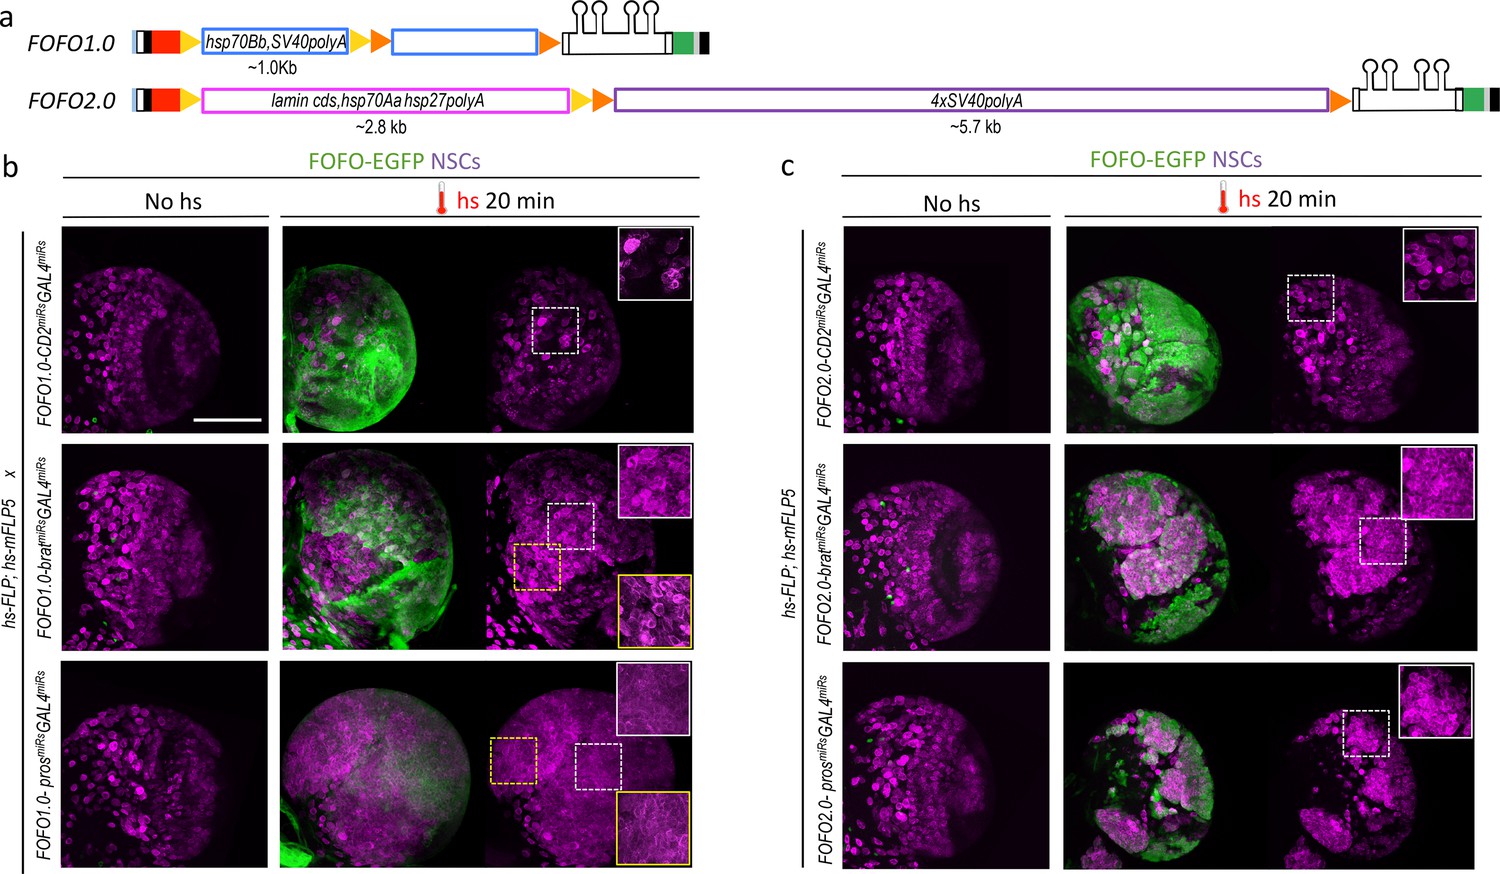
FOFO1.0 versus FOFO2.0.
(a) FOFO.1.0 and FOFO2.0 differ in their STOP cassettes (drawn roughly to scale unlike remainder of construct); shapes are colour-coded as in Figure 1a. (b) Wandering third-instar larval brain lobes. In the absence of hs, the brains of animals carrying FOFO1.0 as well as hs-FLP1 and hs-mFLP5 look WT. Following hs, miR and EGFP expression is induced and supernumerary NSCs characteristic of these tumors are generated within the EGFP domain (notice NSC density in white-boxed insets). However, supernumerary NSCs outside the EGFP domain were also observed (notice NSC density in yellow-boxed inset, comparable to that of white-boxed inset of same sample). (c) Wandering third-instar larval brain lobes. In the absence of hs, the brains of animals carrying FOFO2.0 as well as hs-FLP1 and hs-mFLP5 look WT. Following hs, miR and EGFP expression is induced and supernumerary NSCs characteristic of these tumors are generated only within the EGFP domain (white-boxed insets). All images are maximum-intensity projections of Z-series but those of brains containing tumors are projections of only a few optical sections. Images are of a representative example obtained from two biological replicates (n > 10 per condition). Scale bar: 100 μm.
Figure 2—figure supplement 1
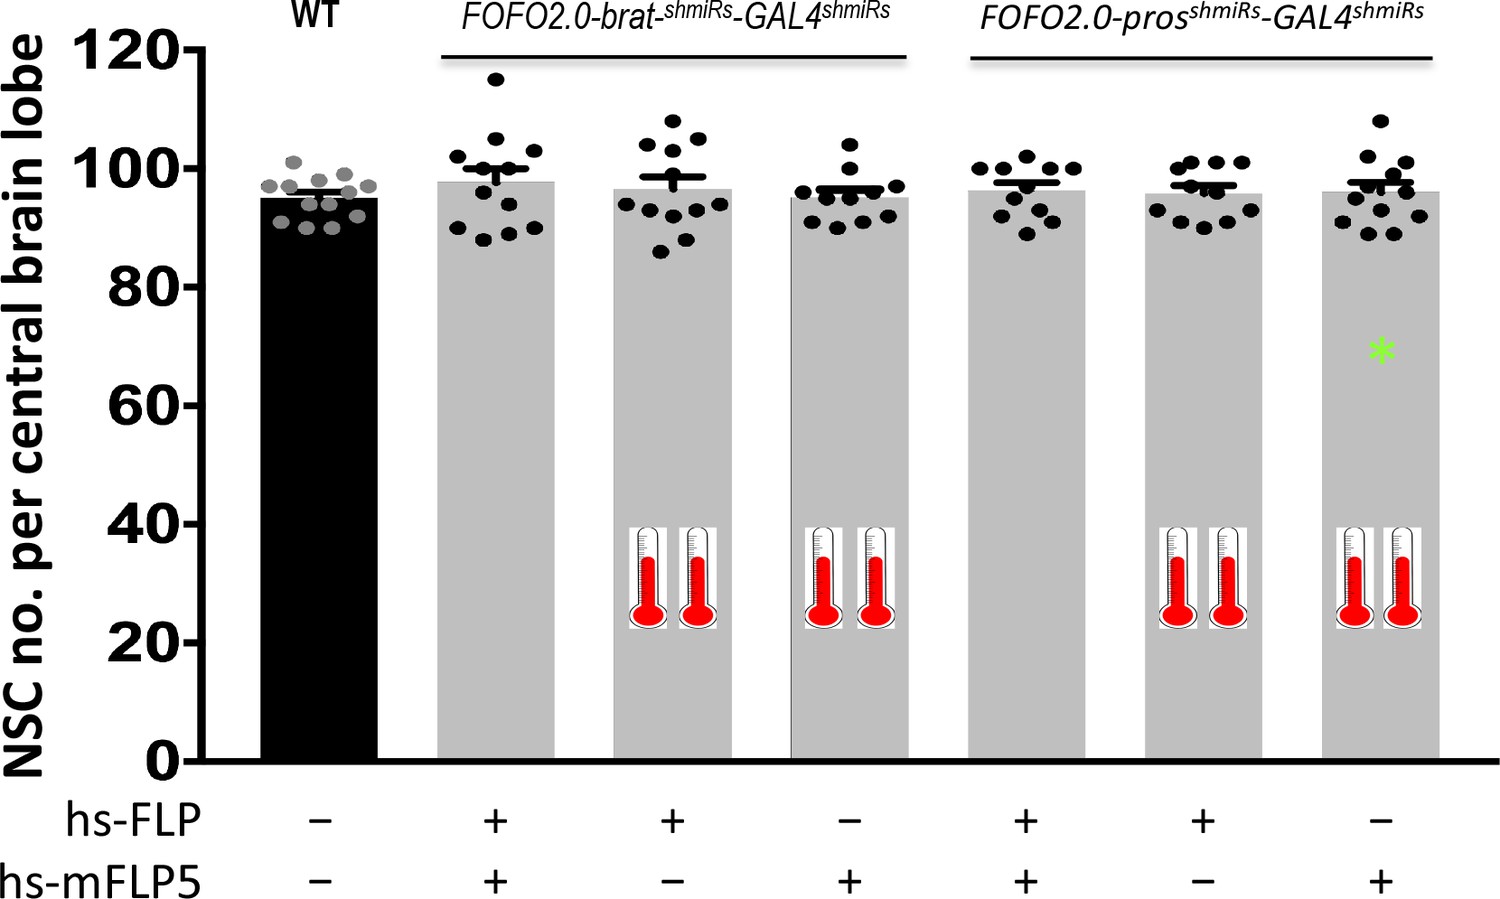
FOFO2.0 precludes formation of supernumerary NSCs unless both FLP and mFLP5 are provided.
Quantification of the number of NSCs (identified by expression of Miranda) per brain lobe in third-instar larvae of the indicated genotypes (above histograms) crossed to either both hs-FLP and hs-mFLP5 or just one of them (as indicated below graph), subjected or not to heat-shock (indicated by thermometers). One brain lobe per animal was picked at random. Histograms heights represent the mean and error bars the S.D. There was no statistically significant difference between any of the conditions. Data points shown were collected from two biological replicates (in order of histograms presented: n = 13; n = 12, p = 0.7177; n = 12, p = 0.964; n = 11, p = 0.9999; n = 11, p = 0.9899; n = 11, p = 0.9995; n = 12, p = 0.9963). * At low-frequency (0.3%) tumors were observed in heat-shocked animals carrying only hs-mFLP5 and FOFO2.0-prosshmiRs-GAL4shmiRs; tumors were labeled by EGFP expression and in those cases only NSCs outside the green domain were counted.
-
Figure 2—figure supplement 1—source data 1
Quantification of NSCs in indicated conditions.
- https://doi.org/10.7554/eLife.38393.006
Figure 3
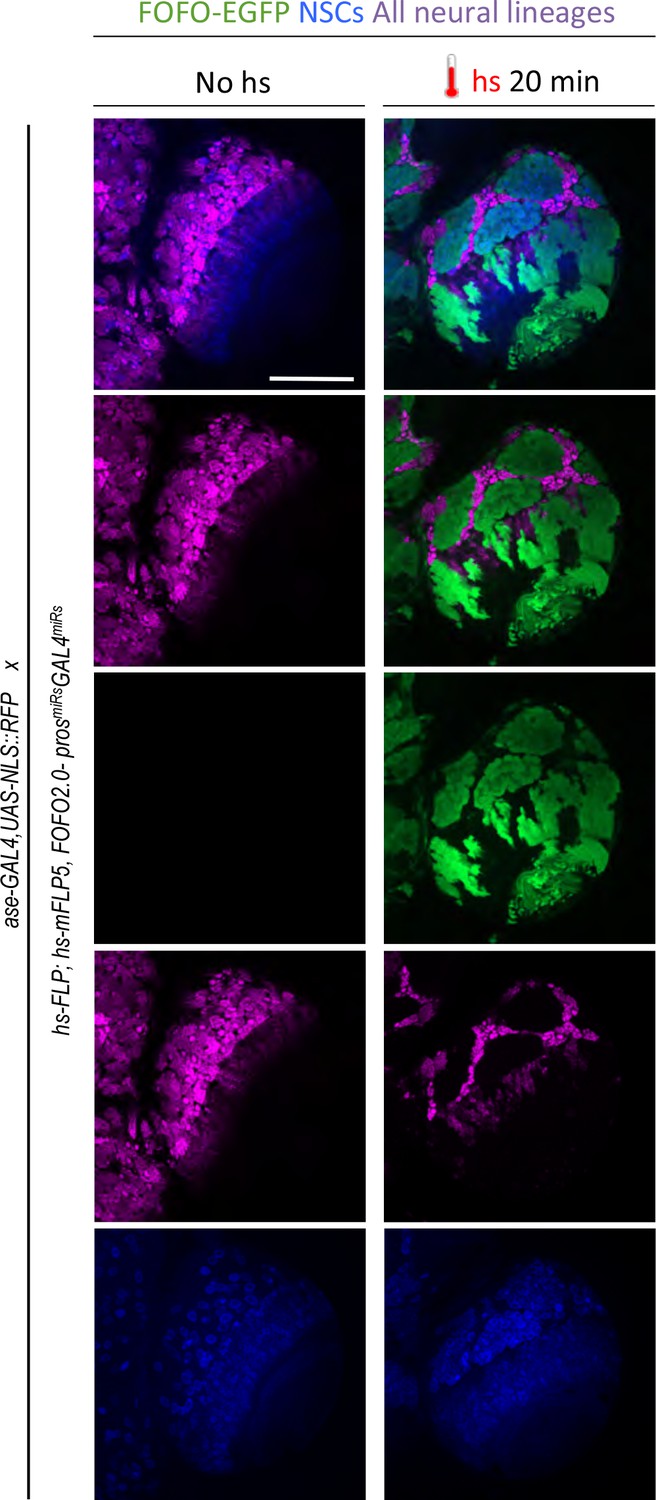
GAL4 miRs efficiently downregulate GAL4.
hs-FLP; hs-mFLP5,FOFO2.0-prosmiRs-GAL4miRs flies were crossed with ase-GAL4,UAS-NLS::RFP (which express RFP in all CNS lineages) flies. Wandering third-instar larval brain lobes of progeny are shown. Following heat-shock, EGFP and GAL4miRs are expressed by the FOFO construct leading to RFP-negative patches in perfect overlap with EGFP-labeled clones as expected from efficient GAL4 knock-down. Images are of a representative example obtained from two biological replicates (n > 10 per condition). Scale bar: 100 μm.
Figure 4 with 1 supplement
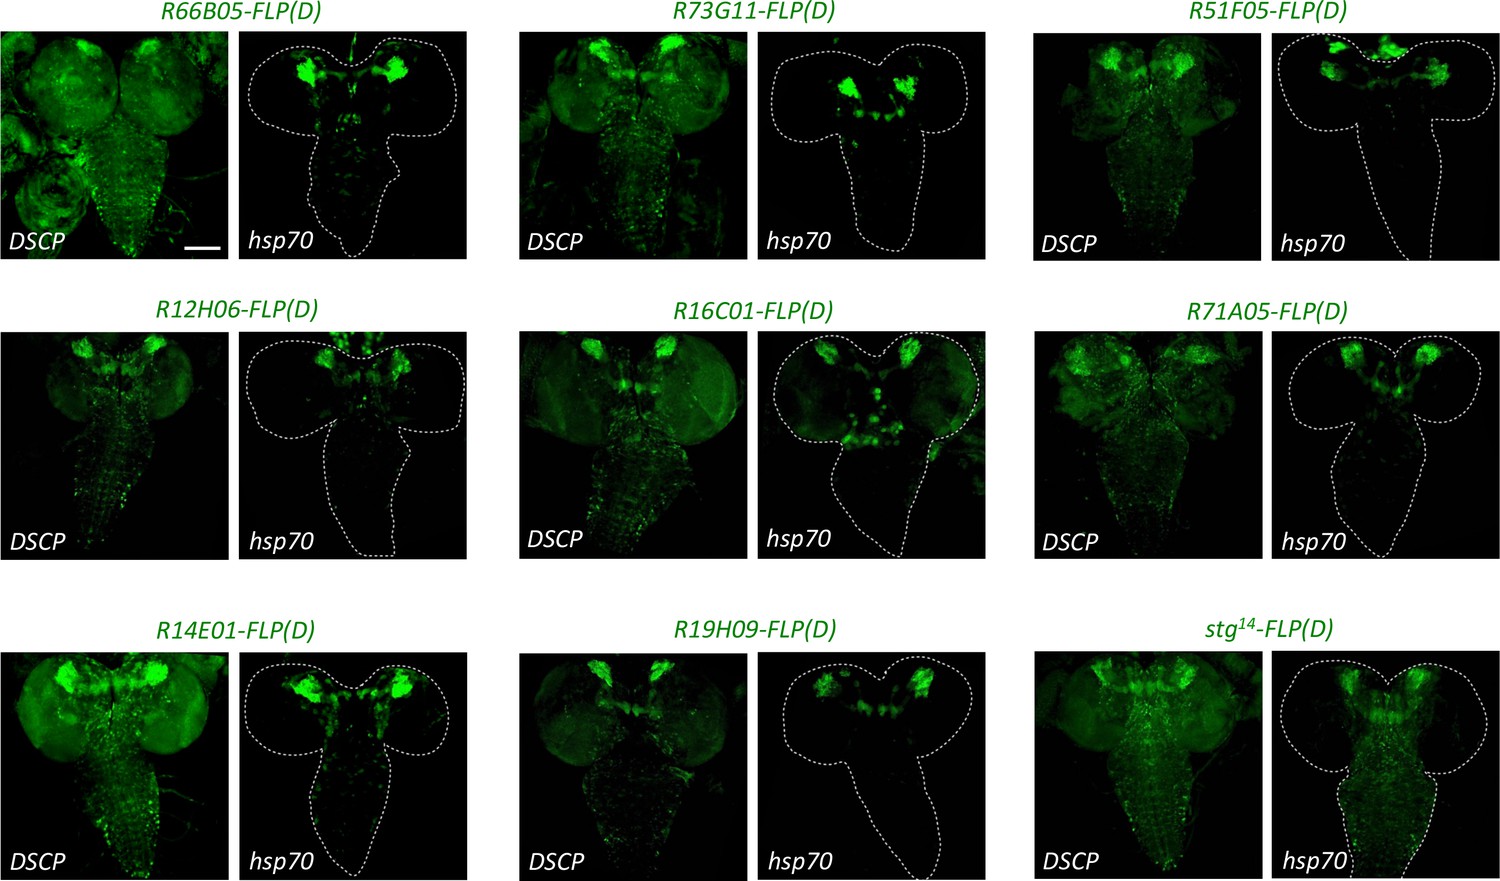
The hsp70 promoter induces less expression of enhancer-FLP(D) lines than the DSCP promoter.
New enhancer-FLP(D) lines were crossed to act >STOP > GAL4,UAS-GFP and wandering third-instar larval CNSs imaged for endogenous GFP expression. All genotypes were processed in parallel and imaged with identical conditions. In all cases, expression controlled by the hsp70 promoter was less relative to that controlled by the DSCP, which could be due either to less background or sensitivity. Images are of a representative example obtained from two biological replicates (n > 10 per condition). Scale bar: 100 μm.
Figure 4—figure supplement 1
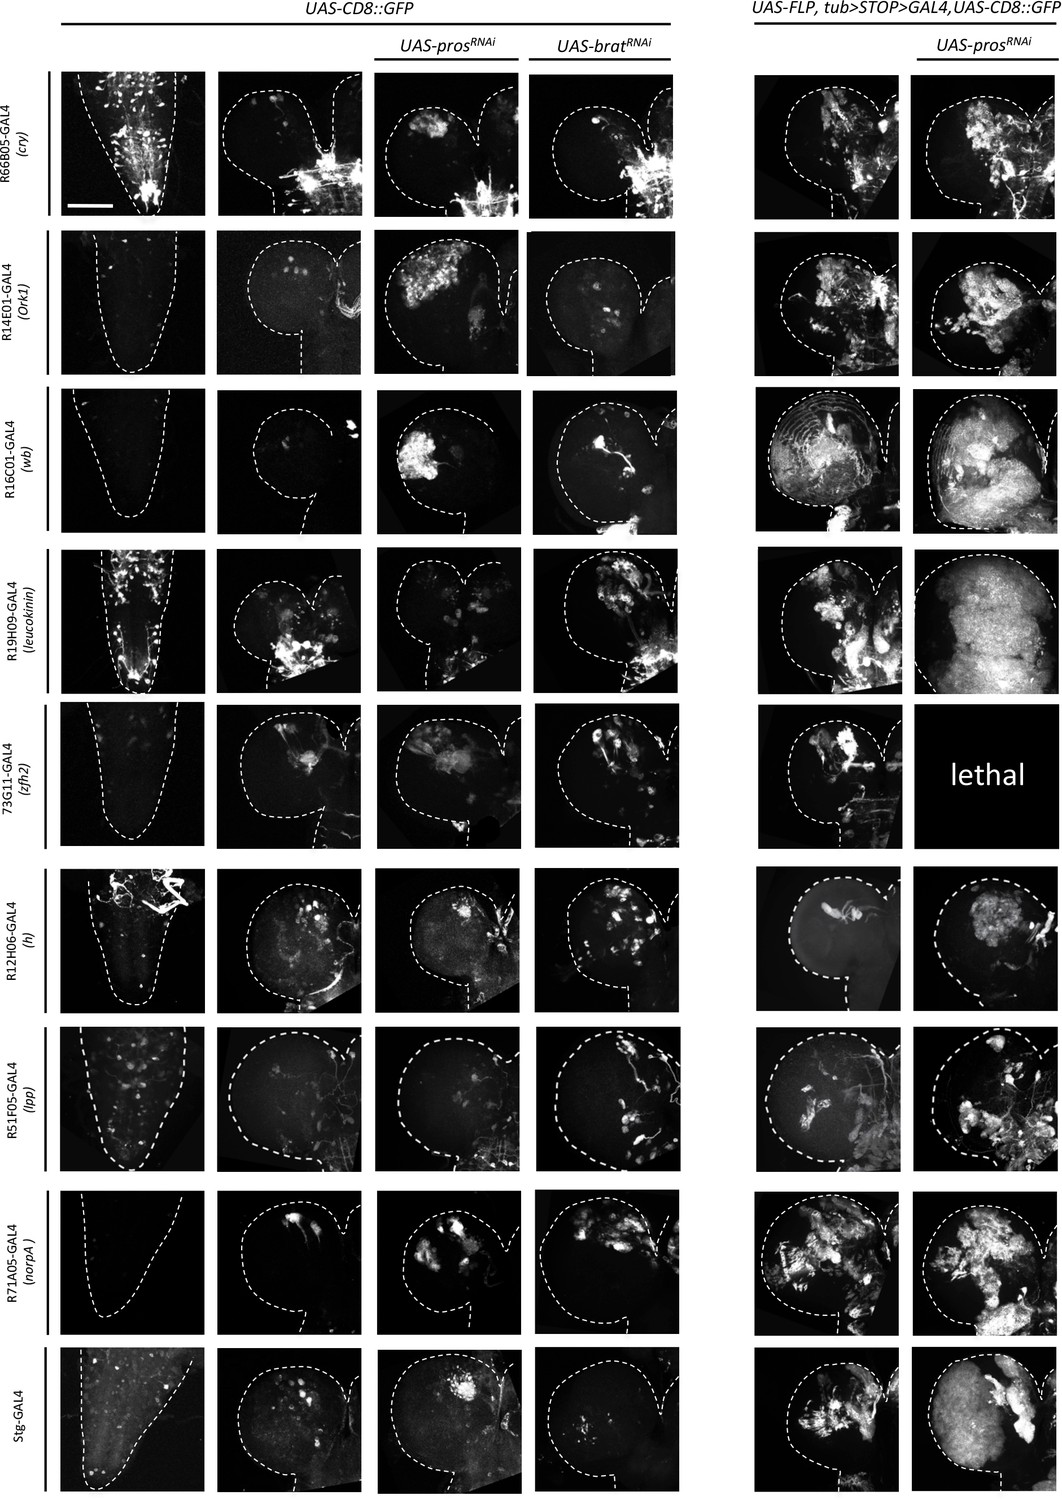
Examples of wandering third-instar larval CNSs of indicated genotypes.
The left column contains images of ventral nerve cords and all other images are of brain lobes. All images are maximum intensity projections of Z-series. Images are of a representative example obtained from two biological replicates (n > 10 per condition). Scale bar: 100 μm.
Figure 5
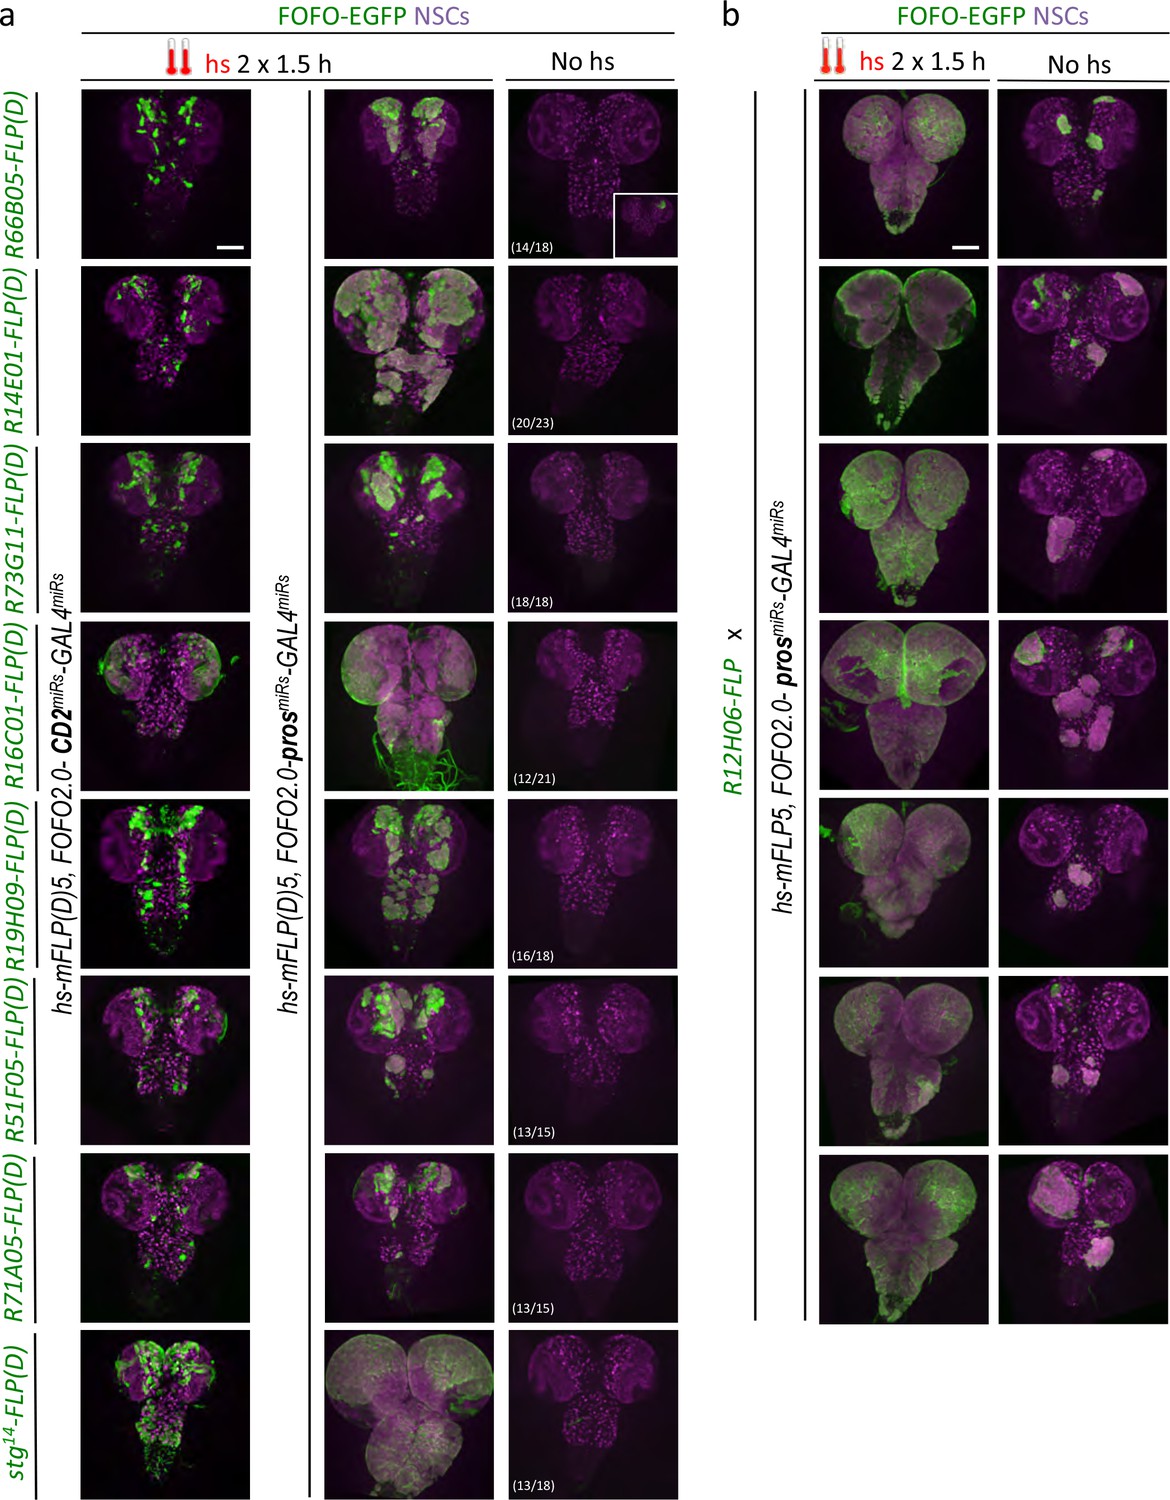
FOFO2.0-mediated lineage-restricted CNS tumor generation within a single stock.
(a) Wandering third-instar CNSs of hs-induced labeled tumors obtained with eight enhancer-FLP(D) and hs-mFLP5,FOFO2.0-prosmiRs-GAL4miRs compared with non-tumor-labeled lineages (same enhancer-FLP(D)s with hs-mFLP5,FOFO2.0-CD2miRs-GAL4miRs) and background (no hs) tumor incidence. In the absence of heat-shock, tumors were occasionally induced with incomplete penetrance (inset in top right; numbers indicate frequency of CNSs devoid of tumours) but these were much smaller than those intentionally induced by heat-shock. (b) Wandering third-instar larval CNSs from progeny of the cross between indicated genotypes. When subject to heat-shock, extensive tumors are induced throughout the CNS (labeled in green and containing supernumerary NSCs). In the absence of heat-shock, tumors (albeit much smaller) are induced. (a–b) All images are maximum-intensity projections of Z-series; obtained from two biological replicates (n > 10 per condition and exact number indicated for the background condition in a – third column). Scale bar: 100 μm.
Figure 6
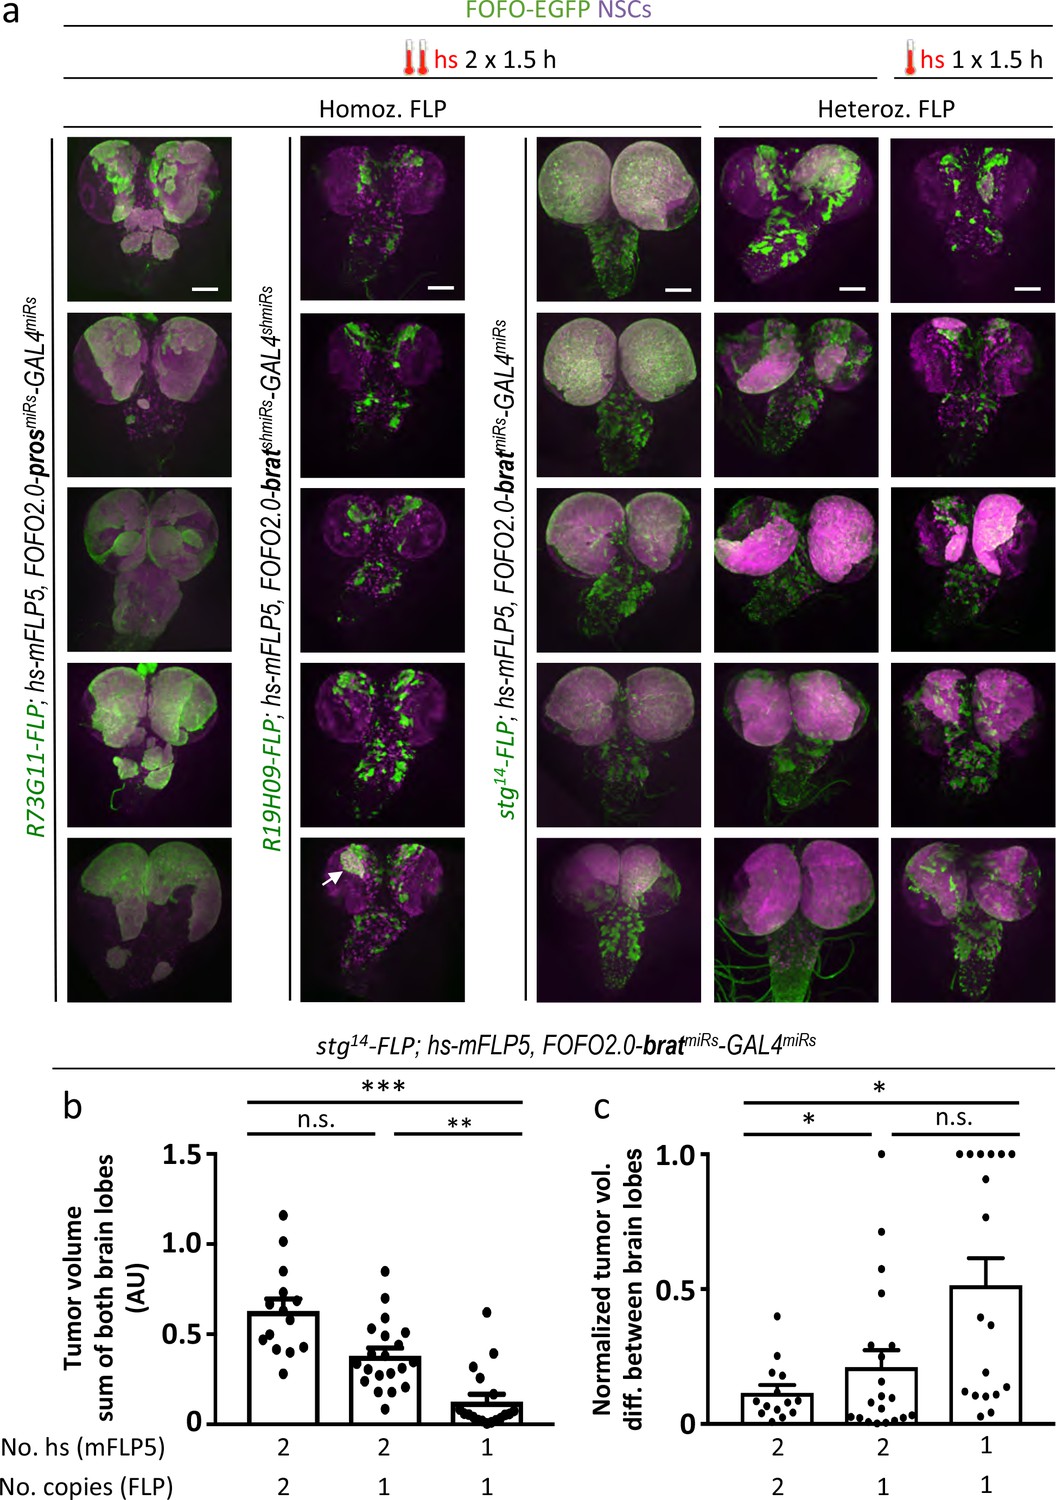
Selection of appropriate enhancer-FLP(D) in combination with hs-mFLP5 allows reproducible CNS tumor generation within a single stock via FOFO2.0.
(a) Representative images of white prepupal CNSs in which the stated enhancer-FLP was employed as either homozygous or heterozygous as indicated, with prosmiRs or bratmiRs with the hs regimes indicated (arrow points at rare tumor generated with R19H09-FLP). All images are maximum intensity projections of Z-series. Scale bar: 100 μm. (b) Quantification of EGFP volumes of bratmiRs tumors. (c) Normalized tumor volume differences between brain lobes. * p < 0.05; ** p < 0.01; *** p < 0.001; n.s. = not significant.
-
Figure 6—source data 1
Quantification of tumor and brain lobe volumes.
- https://doi.org/10.7554/eLife.38393.012
Additional files
-
Supplementary file 1
Sequence of pFOFO2.0-CD2miRs-GAL4miRs-EGFPnls.
- https://doi.org/10.7554/eLife.38393.013
-
Transparent reporting form
- https://doi.org/10.7554/eLife.38393.014
Download links
A two-part list of links to download the article, or parts of the article, in various formats.
Downloads (link to download the article as PDF)
Open citations (links to open the citations from this article in various online reference manager services)
Cite this article (links to download the citations from this article in formats compatible with various reference manager tools)
Spatiotemporally controlled genetic perturbation for efficient large-scale studies of cell non-autonomous effects
eLife 7:e38393.
https://doi.org/10.7554/eLife.38393


