Structural relationship between the putative hair cell mechanotransduction channel TMC1 and TMEM16 proteins
- National Institute of Neurological Disorders and Stroke, National Institutes of Health, United States
- National Institute of Mental Health, National Institutes of Health, United States
- National Institute of Deafness and Other Communication Disorders, National Institutes of Health, United States
Figures
Figure 1 with 2 supplements
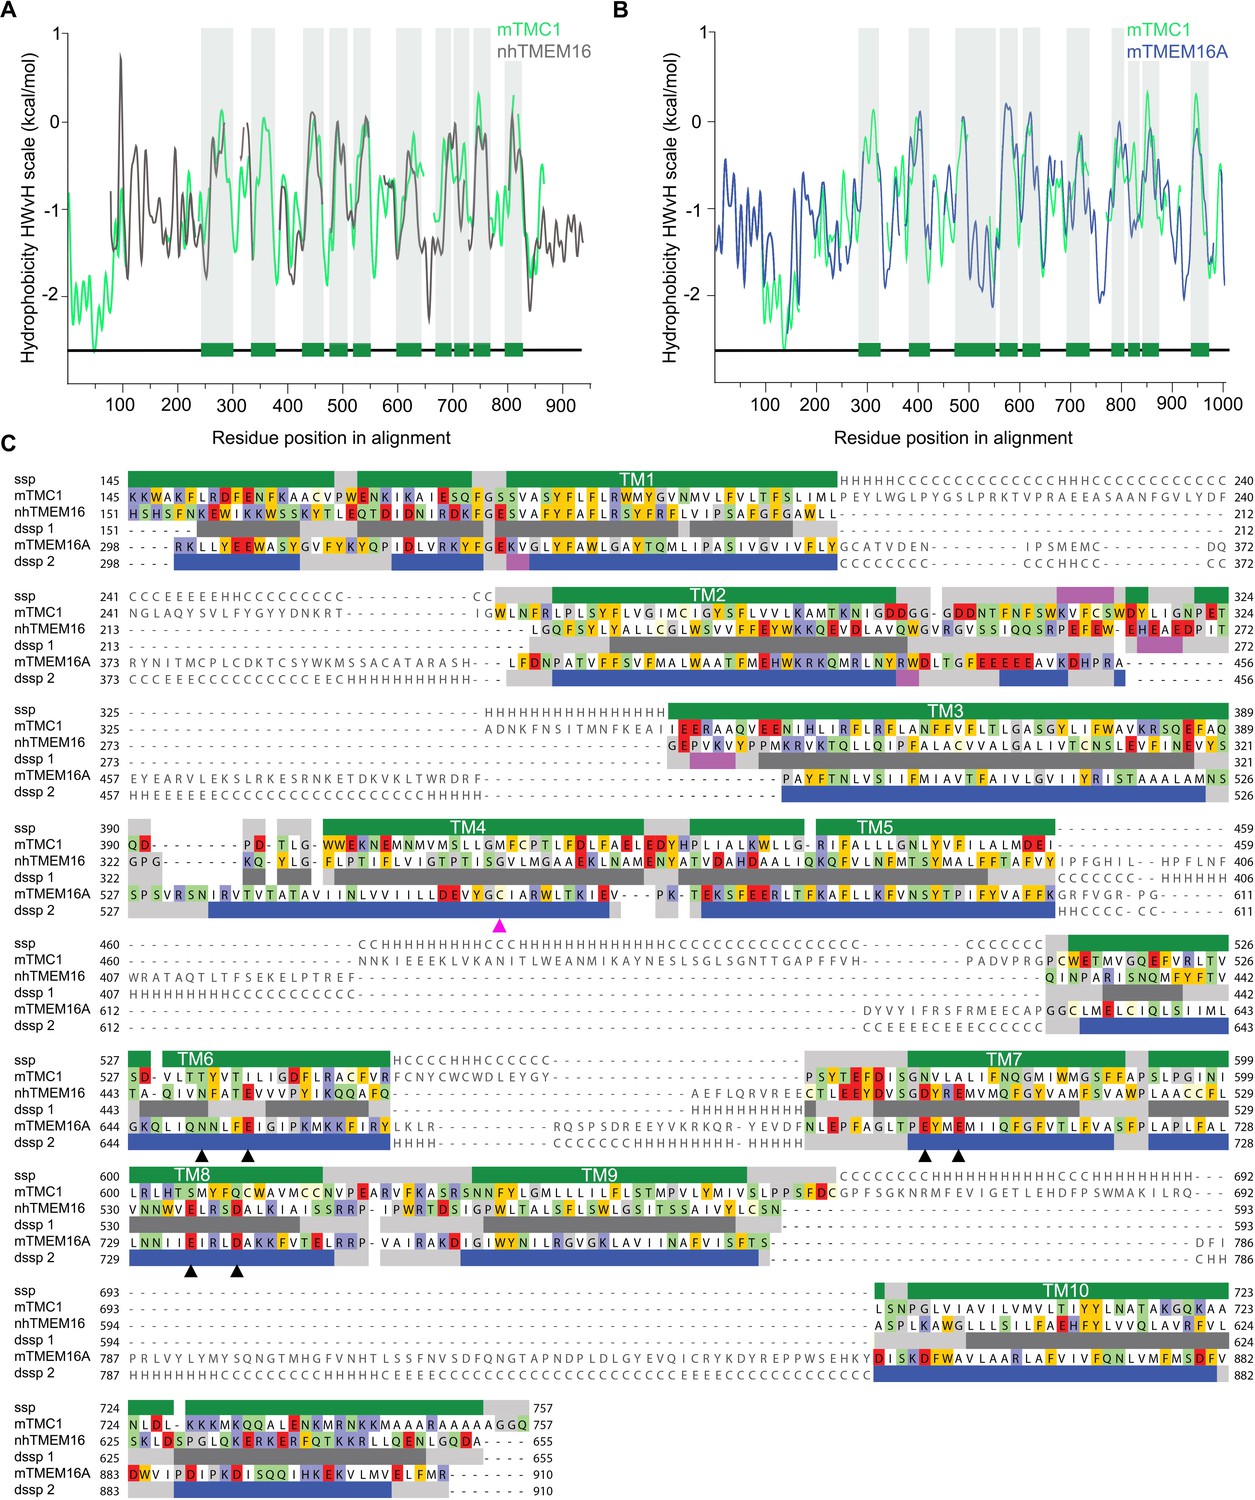
TMC1 and TMEM16 proteins share a common fold.
(A) Hydrophobicity profiles for nhTMEM16 (gray) and mTMC1 (green) revealing conserved hydrophobic regions. Residues corresponding to mTMC1 TM helices are indicated with green bars and gray shading. (B) Hydrophobicity profiles for mTMEM16A (blue) and mTMC1 (green) revealing conserved hydrophobic regions. TM regions are indicated as in (A). (C) mTMC1, nhTMEM16 and mTMEM16A sequence alignment used to generate TMC1 models. Non-modeled residues are shown in gray without highlighting, while residues shown in the model are highlighted according to their properties; neutral in white, aromatic in yellow, polar in green, basic in blue and acidic in red. TMC1 secondary structure prediction (ssp) is shown at the top of the alignment and secondary structure information extracted from nhTMEM16 and mTMEM116A structures (dssp1 and dssp2, respectively) is included below the corresponding sequences. Grey rectangles indicate loops, pink rectangles β-strands, and α−helices are shown as green rectangles for TMC1, grey for nhTMEM16 and blue for mTMEM16A. Conserved TM helices are labeled and the six residues involved in calcium binding found in TMEM16 and absent in TMC proteins, are indicated with black arrowheads. The magenta arrowhead indicates the position of the Beethoven mutation in TMC1.
Figure 1—figure supplement 1
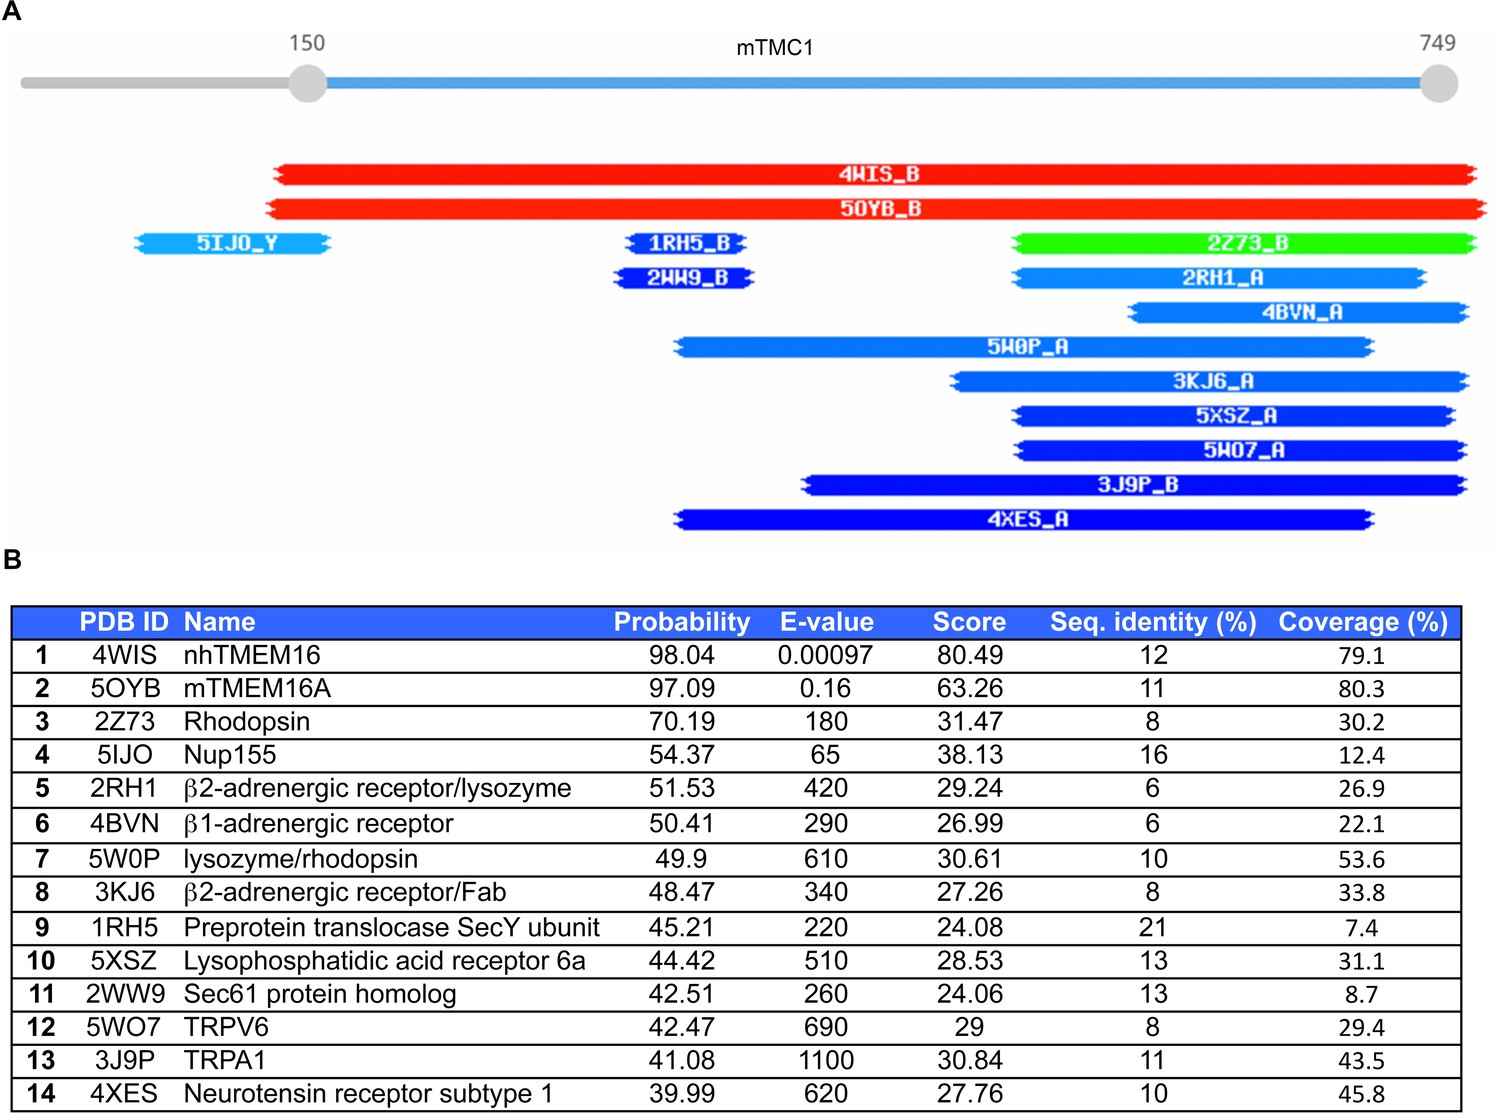
Results from HHpred search for TMC1 templates.
(A) Schematic representation of TMC1 templates identified using HHpred and color-coded based on whether the score is high (red), moderate (green) or low (blue). The two TMEM16 proteins (nhTMEM16, 4WIS and mTMEM16A, 5OYB) stand out as unique high-scoring templates for TMC1. (B) HHpred scores for the top 14 TMC1 templates.
Figure 1—figure supplement 2
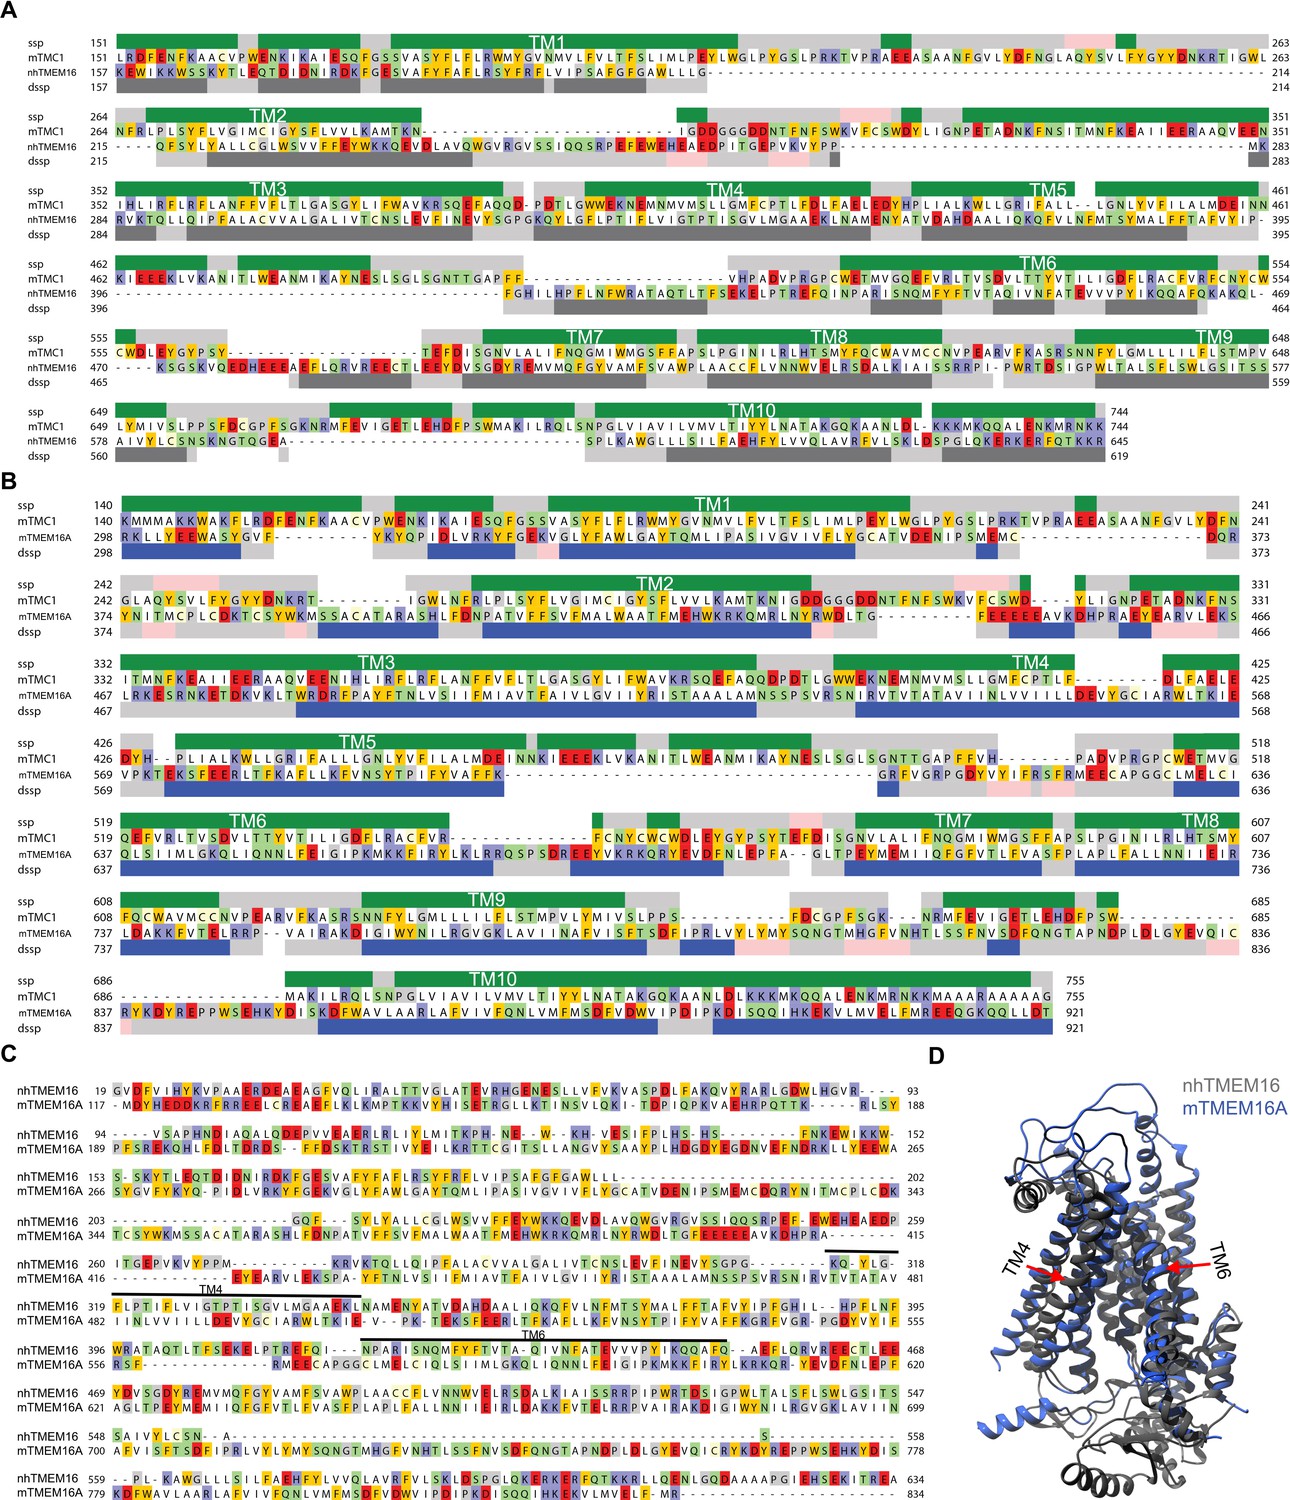
Initial sequence alignments.
Initial protein sequence alignment of TMC1 and nhTMEM16 (A) or TMC1 and mTMEM16A (B) obtained from HHpred and represented as in Figure 1C. (C) nhTMEM16 (PDB ID: 4WIS) and mTMEM16A (PDB ID: 5OYB) structural alignment obtained with TMalign. Cavity-lining helices TM4 and TM6 are indicated. (D) nhTMEM16 (gray) and mTMEM16A (blue) structural superimposition in ribbon representation revealing the major structural difference due to the rearrangement of TM4 and TM6 (red arrows).
Figure 2 with 2 supplements
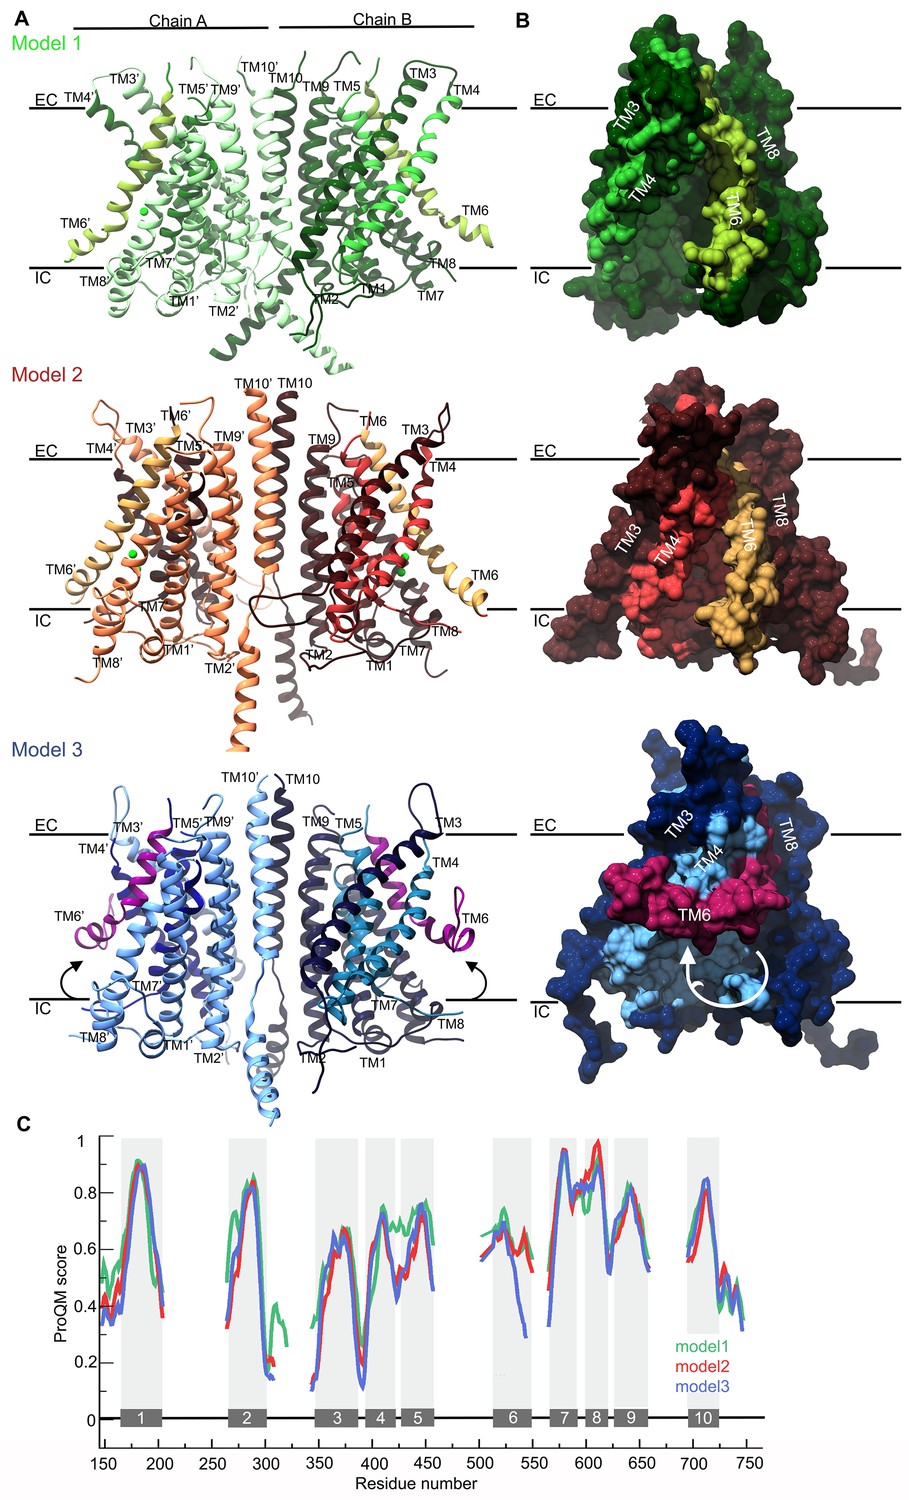
TMC1 models based on TMEM16 structures.
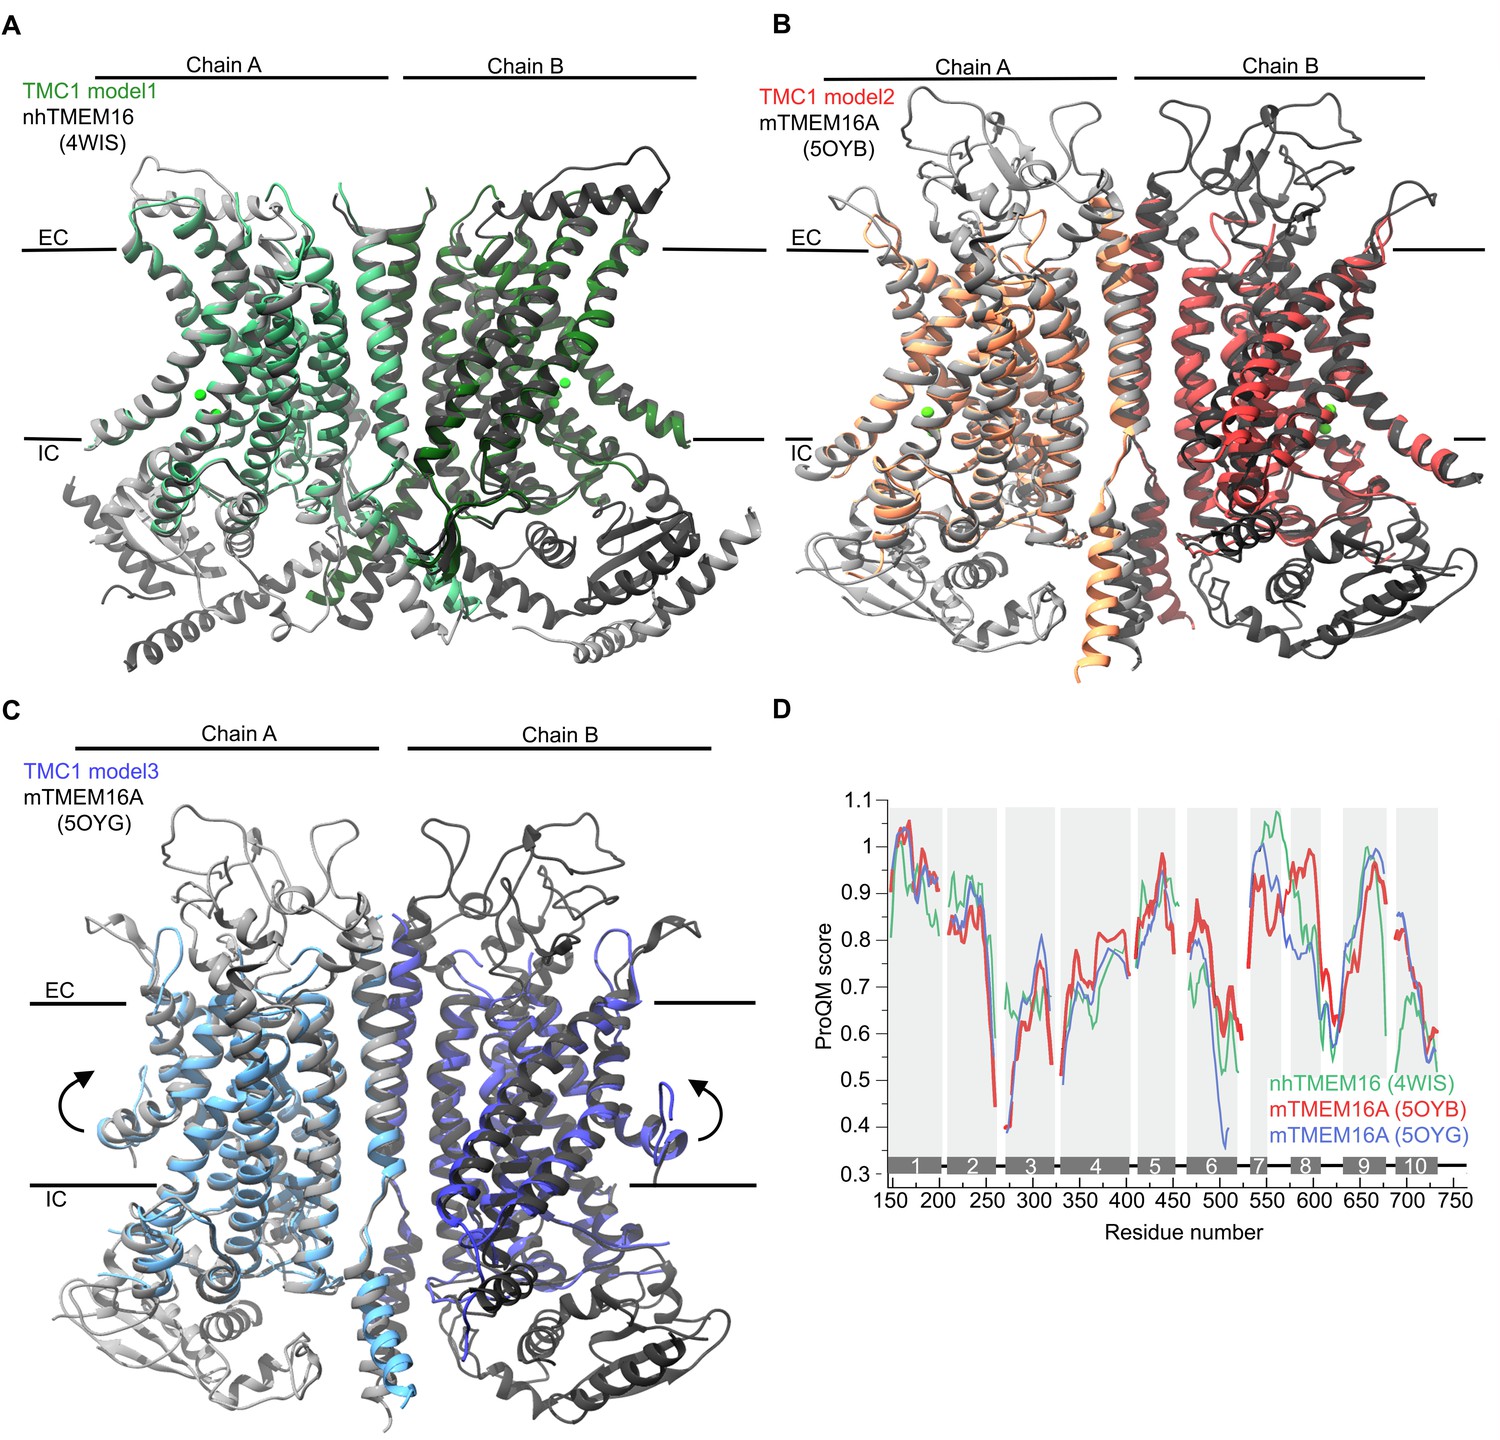
(A) Ribbon representation of TMC1 models based on nhTMEM16 (model 1, green), mTMEM16A in the Ca2+-bound state (model 2, red) and mTMEM16A in the Ca2+-free state (model 3, blue). Chains A and B are indicated and colored in lighter and darker color, respectively. TM4-TM7 helices that form the cavity are colored in a different color and the TM6 is highlighted. The approximate position of the plasma membrane is indicated by black lines and the extracellular (EC) and intracellular (IC) sides are labeled. (B) 90° view of a TMC1 protomer from each model in A shown in surface representation, revealing the cavity formed by helices TM4-TM7. Model 1 reveals a wide-open cavity exposed to the membrane environment, while the TM4 helix is repositioned in model 2 to partially close the cavity (red) towards the EC side. In model 3, the TM6 helix (magenta) is bent, which further closes the cavity. (C) Local ProQM score revealing the main differences between the models, which are caused by the rearrangement of TM4 in model 2 (red) and TM6 in model 3 (blue). The 10 TM helices are indicated and represented with grey bars and shading.
-
Figure 2—source data 1
TMC1 models 1, 2 and 3.
- https://doi.org/10.7554/eLife.38433.008
Figure 2—figure supplement 1
Structural superimposition of TMC1 models and TMEM16 templates.
(A) Superimposition of modeled mTMC1 (green) and template nhTMEM16 structure (grey, PDB ID: 4WIS). Chains A and B are indicated using different colors. The approximate position of the plasma membrane is indicated by black lines and the extracellular (EC) and intracellular (IC) sides are labeled. Ca2+ ions observed in the nhTMEM16 structure are represented as green spheres. (B) Superimposition of modeled mTMC1 (red) and template mTMEM16A in the Ca2+-bound state structure (grey, PDB ID: 5OYB) represented as in (A). (C) Superimposition of modeled mTMC1 (blue) and template mTMEM16A in the Ca2+-free state structure (grey, PDB ID: 5OYG) represented as in A. (D) Local ProQM score of the template structures; nhTMEM16, and mTMEM16A in the Ca2+-bound and -free state in green, red, and blue, respectively. The 10 TM helices are indicated and represented with grey bars and shading.
Figure 2—figure supplement 2
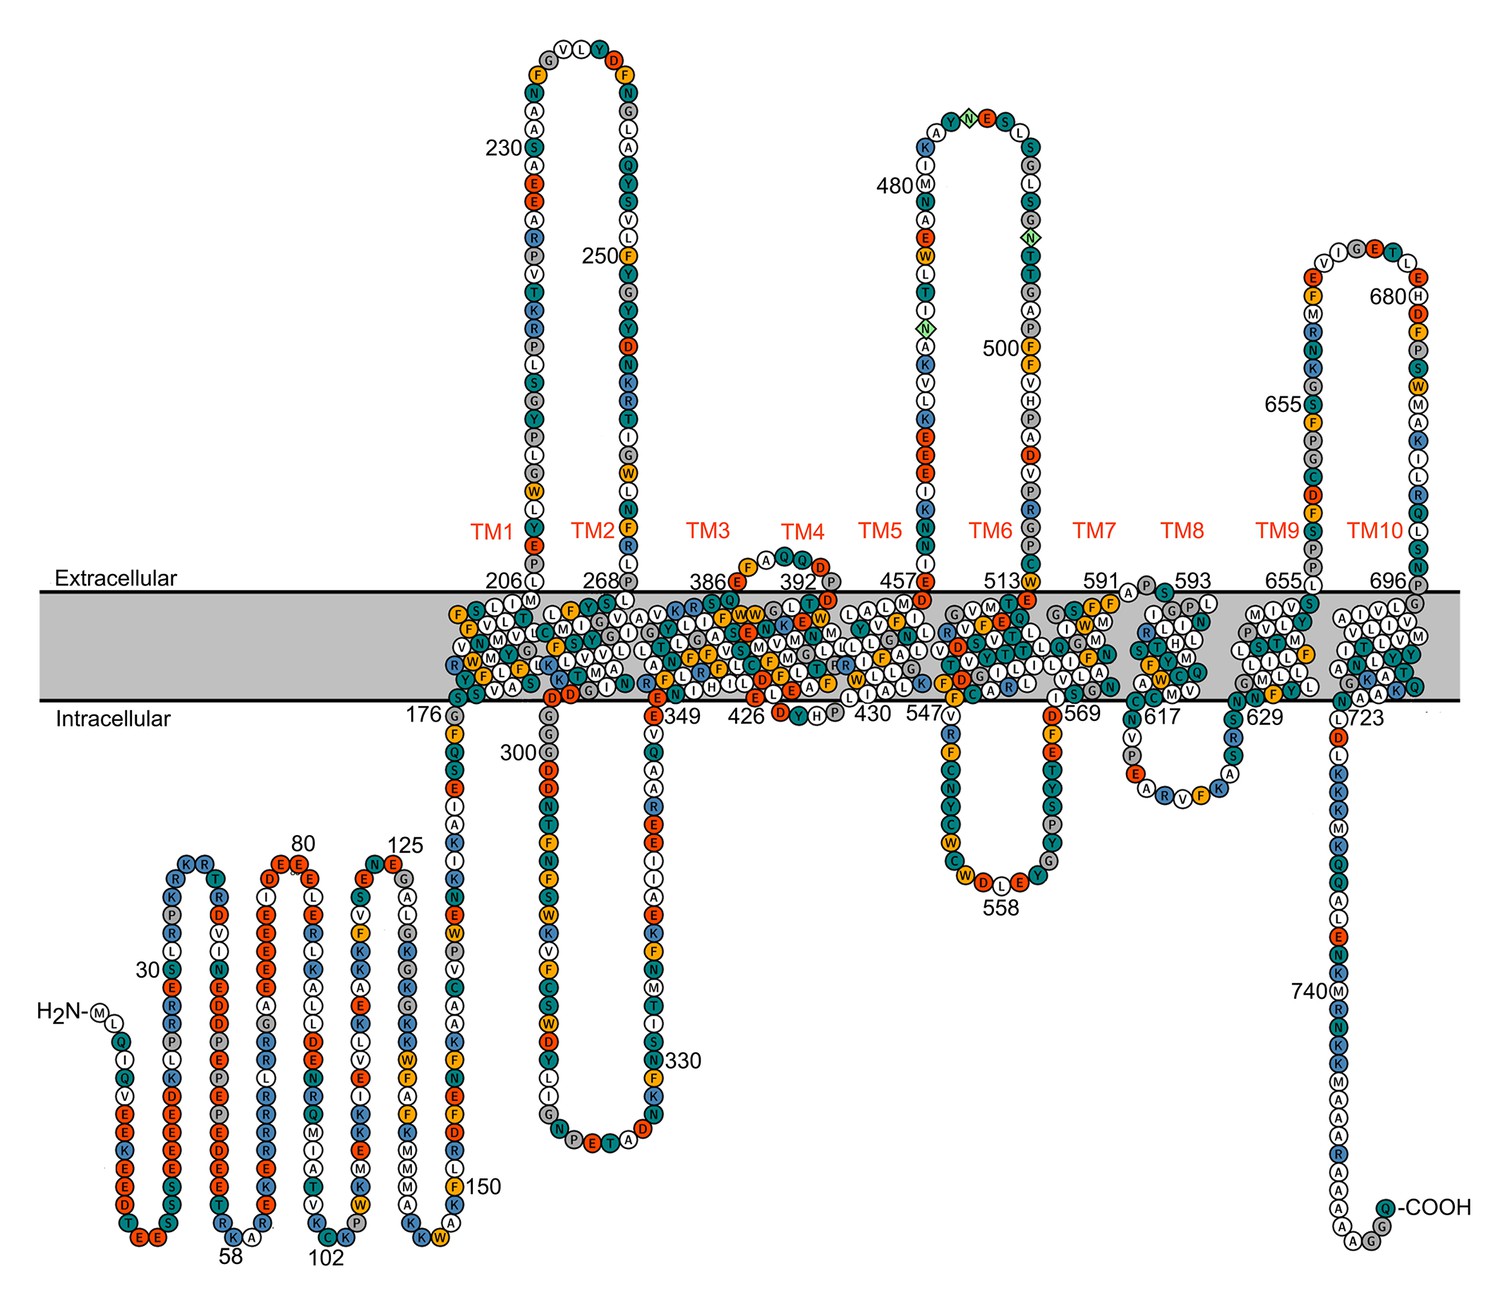
Topology of TMC1.
Representation of mTMC1 topology revealing intracellular N- and C- terminal domains and 10 transmembrane (TM) helices. Residues are color-coded based on their properties; neutral - white, aromatic - yellow, polar - green, basic - blue and acidic - red. Three predicted extracellular N-glycosylation sites located in the extracellular TM5-TM6 loop are shown as light-green rhombus.
Figure 3 with 1 supplement

Representation of the TMC1 model 1.
(A) The TMC1 dimer is represented with the α-helices of one protomer as cylinders with TM helices numbered and colored in grey, the two intracellular N-terminal α−helices are colored in orange and the C-terminal α−helix is colored in blue. The other TMC1 protomer is shown in ribbons representation with the TM4-TM7 that form the cavity colored in lighter green and TM6 in lime. TM4 and TM6 lining the cavity are indicated. Plasma membrane position is indicated by black lines and the extracellular (EC) and intracellular (IC) sides are labeled. (B) 90° view of one TMC1 protomer revealing the cavity formed by the TM4-TM7 helices. Indicated distances are between alpha-carbons of residues located on TM4 and TM6: R523-W397 (15.6 Å), S404-T535 (16.2 Å), and V547-E423 (35.7 Å). (C) Surface representation of the cavity in one TMC1 protomer (as in B), color-coded based on residue properties: neutral-white, aromatic-yellow, polar-green, basic-blue, and acidic-red. (D) TMC1 cavity colored based on its electrostatic potential. (E) TMC1 cavity with residues colored based on their conservation score.
Figure 3—figure supplement 1
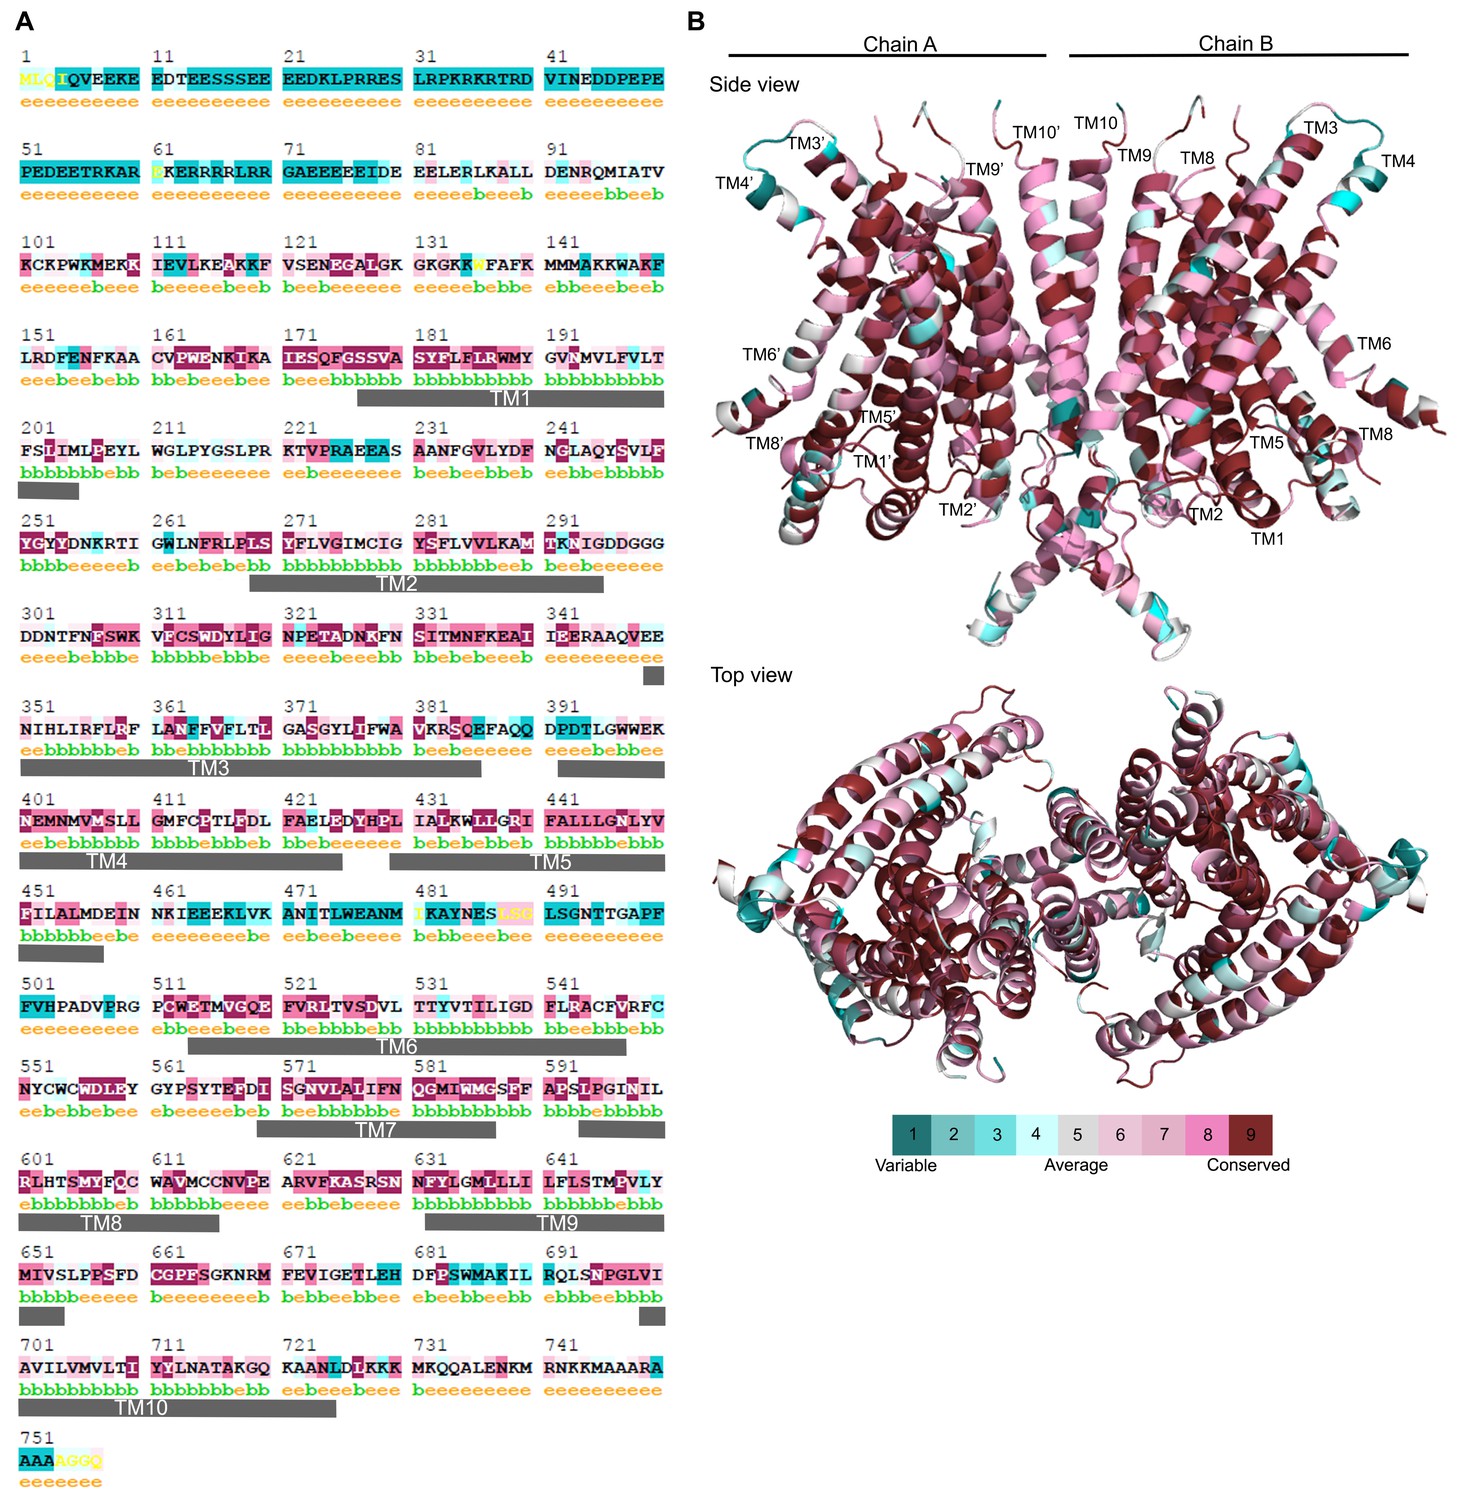
TMC1 residue conservation.
(A) TMC1 residues highlighted using color based on their conservation score (scale shown in B) among TMC proteins. Residues are predicted to be exposed (e) or buried (b) and numbers indicate the residue number in mTMC1. TM helices in the model are indicated with gray rectangles. (B) Ribbon representation of TMC1 model with residues colored based on their conservation score among TMC proteins.
Figure 4 with 2 supplements
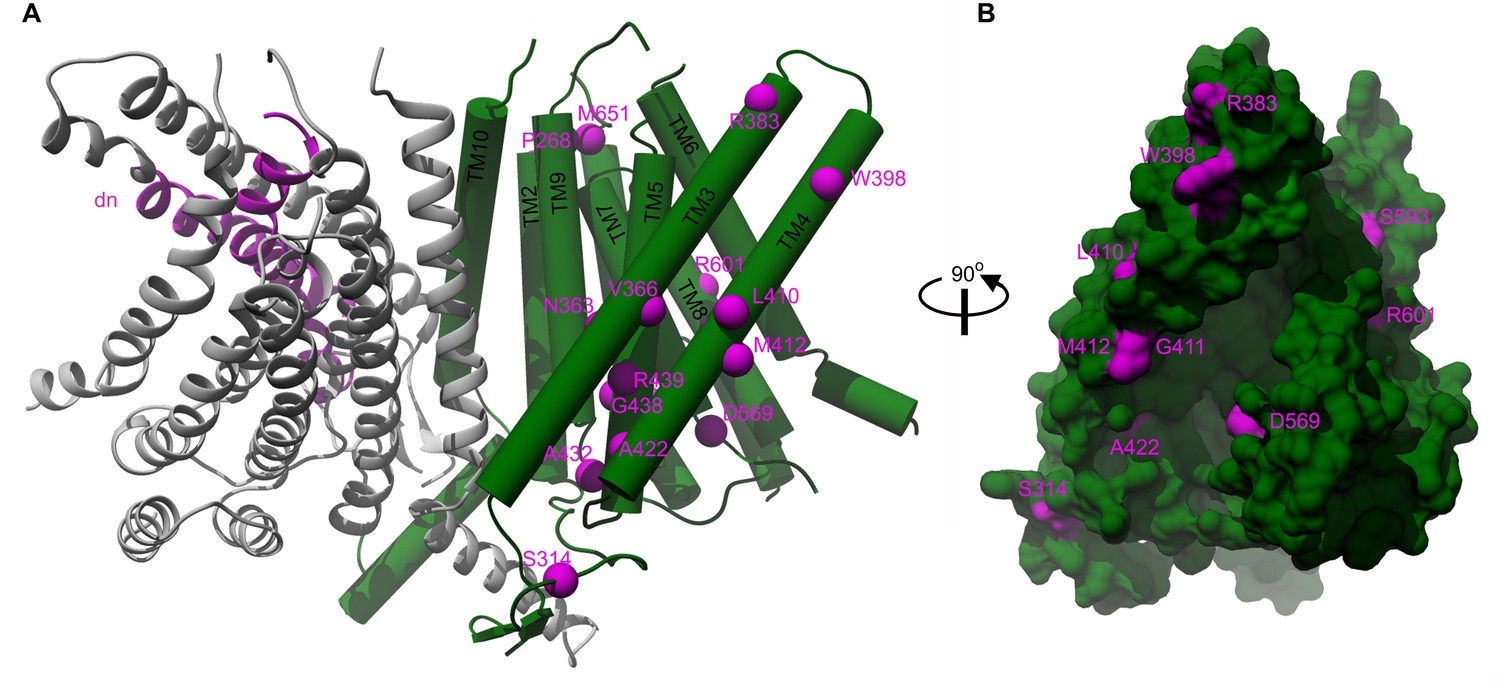
Localization of deafness-causing mutations in TMC1 model 1.
(A) TMC1 model 1 with one protomer in ribbon representation and colored in grey showing the region deleted in the Deafness (dn) mouse model (Δ402–459) in magenta. The helices of the other protomer are represented as cylinders and the deafness-causing mutations are labeled and indicated as magenta spheres. (B) 90° degrees view of panel A in surface representation highlighting the M412, A422 and D569 mutations in the cavity.
-
Figure 4—source data 1
TMC1 deafness-causing mutations.
Table listing the deafness-causing mutations identified in TMC1 and localized in the mTMC1 model. Equivalent mouse and human residues and research article describing the mutation are indicated. Conservation score among mTMC proteins and equivalent residue in mTMEM16A and conservation among mTMEM16 proteins for each mutation are also shown. ¥ denotes mutations identified in mouse.
- https://doi.org/10.7554/eLife.38433.014
Figure 4—figure supplement 1
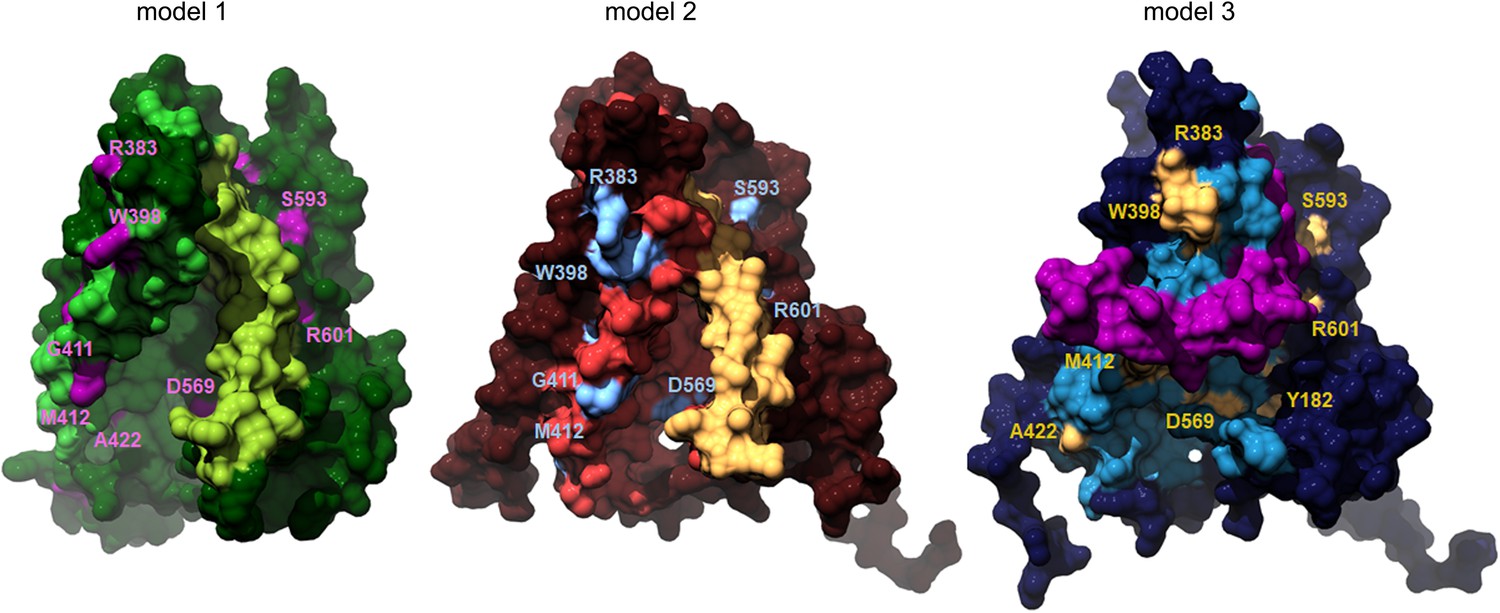
Localization of deafness-causing mutations in TMC1 models.
Surface representation of the TMC1 cavity in model 1, model 2 and model 3 with the deafness-causing mutations labeled and indicated in magenta, blue or yellow, respectively.
Figure 4—figure supplement 2
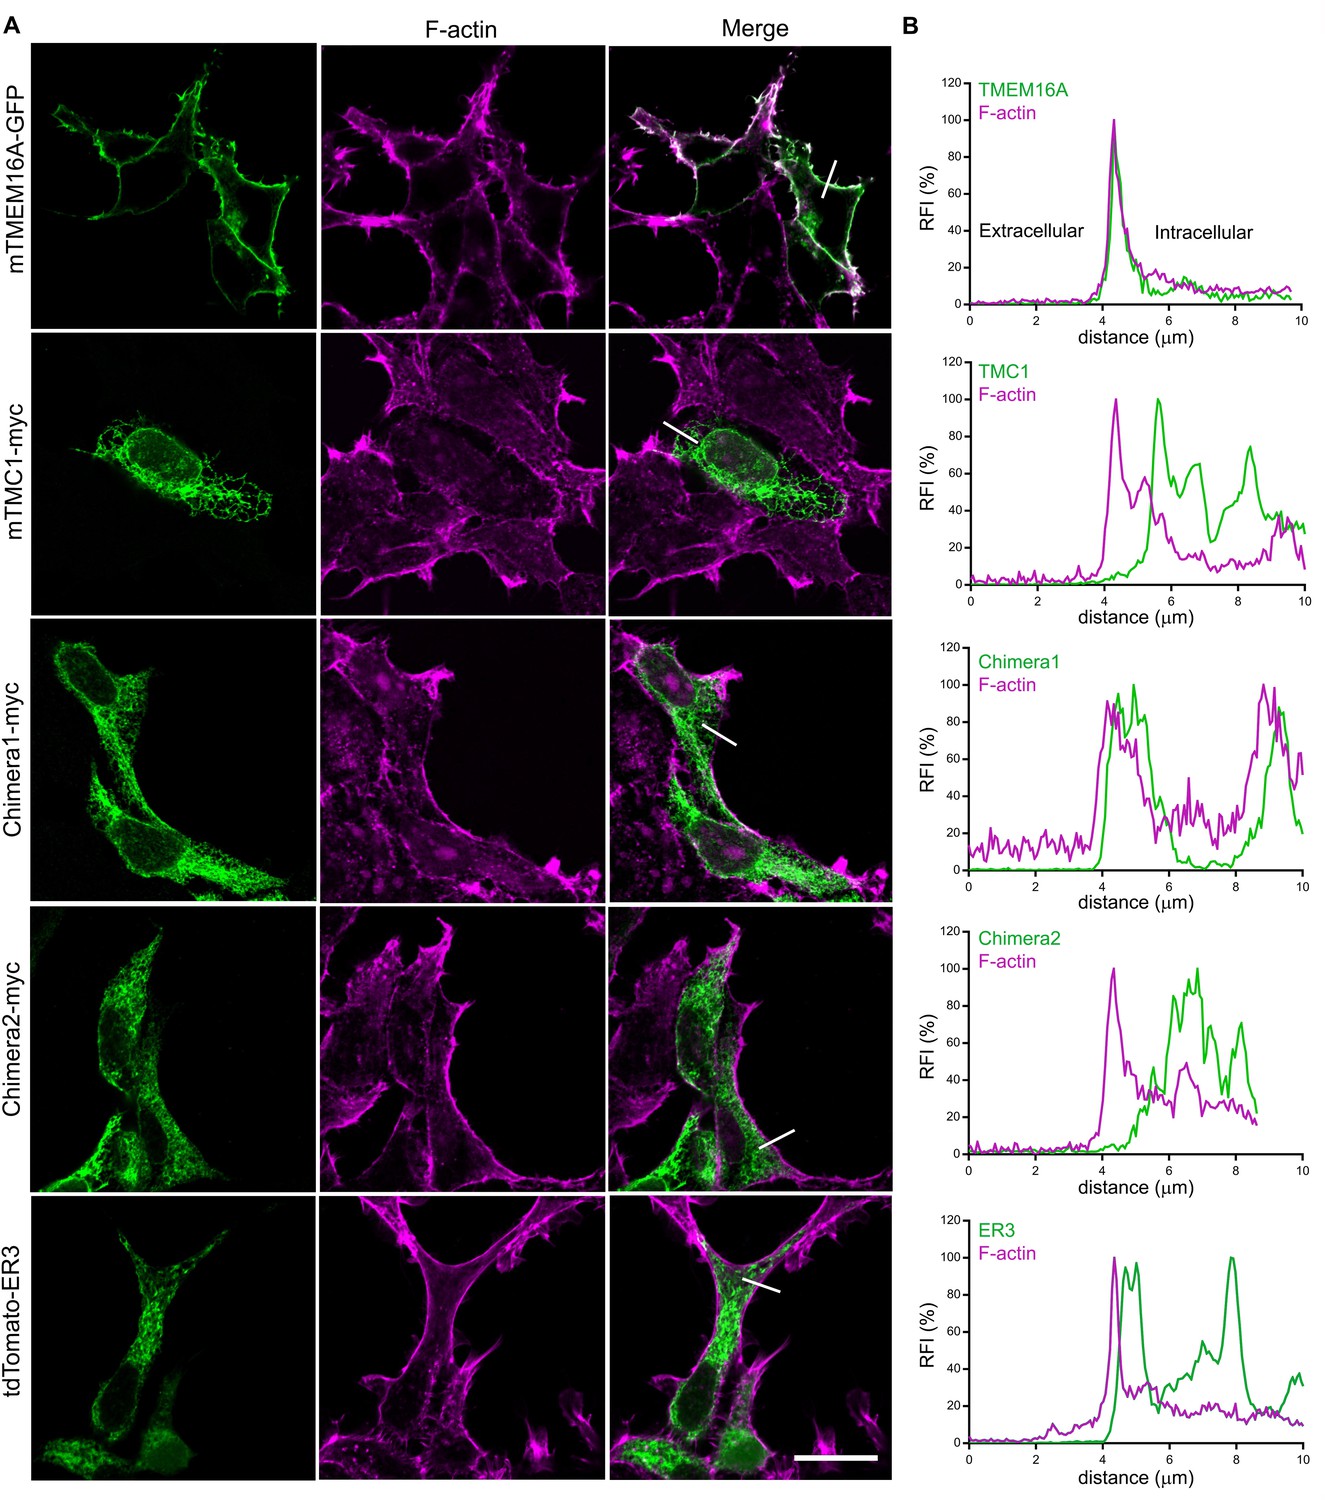
TMC1 and TMC1-TMEM16A chimeras do not traffic to the plasma membrane when expressed in HEK293T cells.
(A) TMEM16A shows plasma membrane localization, while TMC1, Chimera 1 (1–325 TMEM16A/176–719 TMC1/890-960 TMEM16A), Chimera 2 (1–480 TMEM16A/346–617 TMC1/748-960 TMEM16A) and a tomato fluorescent protein with an endoplasmic reticulum retention signal (tdTomato-ER3) (green) are intracellularly retained as shown in the confocal images of transfected cells counterstained with phalloidin to label F-actin (magenta). The scale bar represents 20 μm. (B) Relative fluorescence intensity (RFI) profile for each protein (green) and F-actin (magenta) across the edge of each cell from the extracellular to the intracellular side (white line in A).
Figure 5 with 1 supplement
Hair cells uptake 3 kDa dextran-TR.
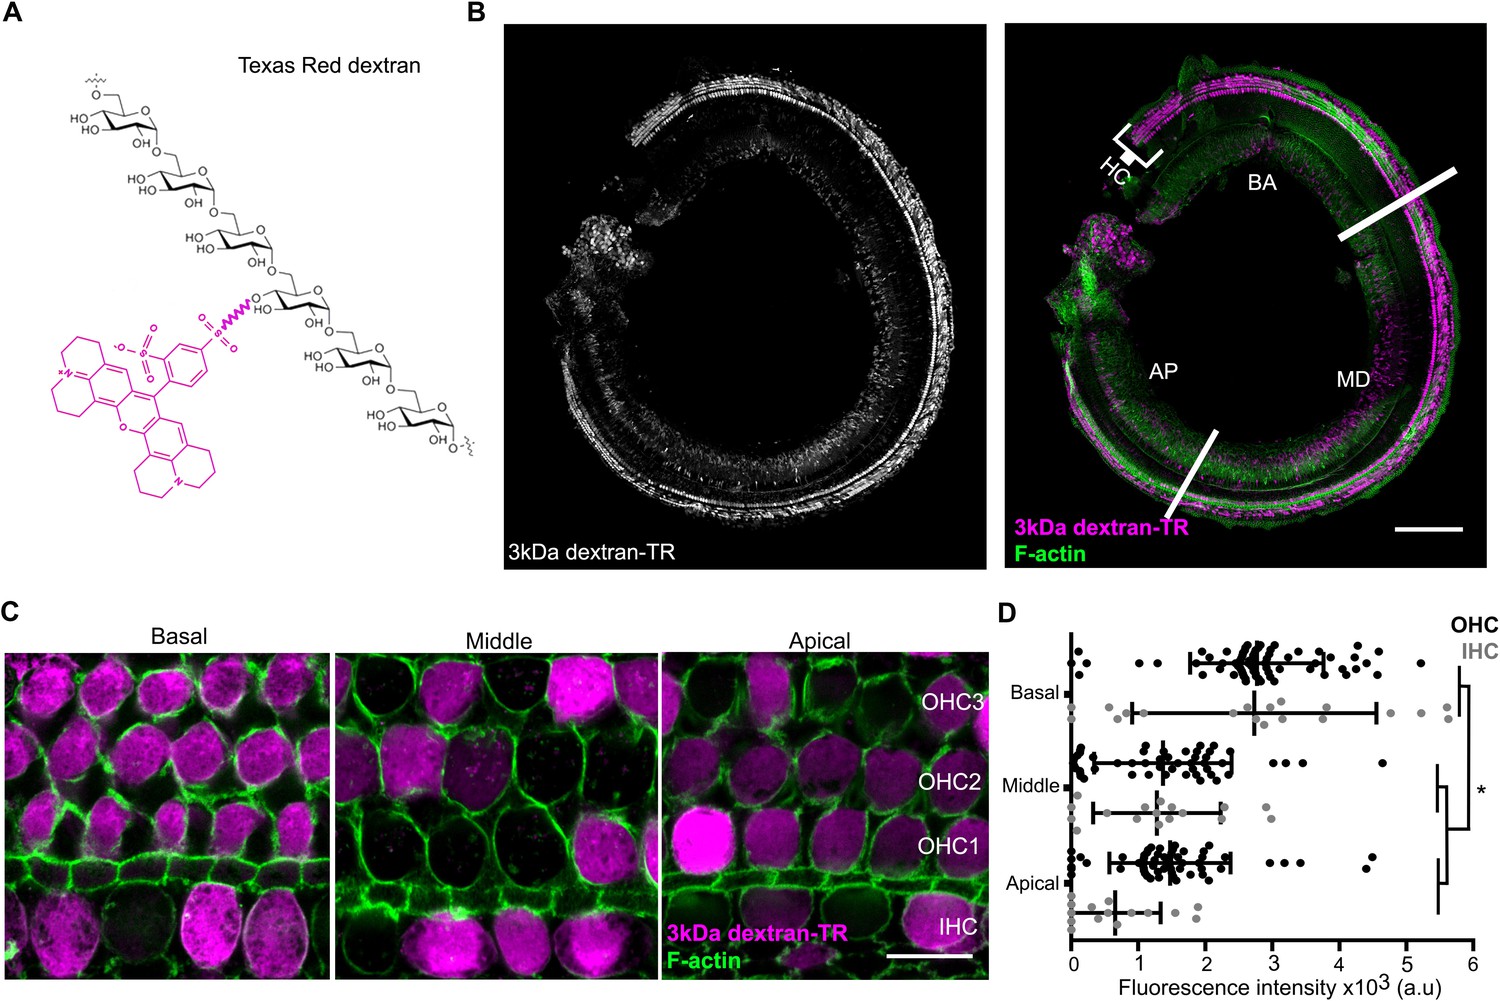
(A) Schematic representation of Texas Redlabeled dextran containing six molecules of glucose corresponding to a molecular weight of 1.08 kDa. A molecule of Texas Red is shown in magenta linked by a succinimidyl ester reaction to a glucose monomer. (B) Confocal image showing specific sensory hair cells (HC) labeling of 3 kDa dextran-TR across the whole organ of Corti from a 6-day-old mouse. The basal (BA), middle (MD), and apical (AP) regions of the organ are indicated. Scale bar represents 200 μm. (C) 3 kDa dextran-TR fluorescence (magenta) intensity at the hair cell body from the basal, middle and apical regions of the organ of Corti. One representative image for each area is shown. The three rows of outer hair cells (OHC) and one row of inner hair cells (IHC) are indicated. Scale bar represents 20 μm. Phalloidin was used to label F-actin (green) and visualize stereocilia and hair cell boundaries in panel B and C. (D) Quantification of fluorescence intensity in the cell body of hair cells at the different cochlear regions (basal, n = 89; middle, n = 69 and apical, n = 74). Each dot represents a single hair cell (OHC in black; IHC in gray). Mean and standard deviation for each group are shown. Asterisks indicate significant differences among the different cochlear regions (p < 0.01, one-way ANOVA with Turkey´s multiple comparison test).
-
Figure 5—source data 1
Mean fluorescence values for Figure 5D.
- https://doi.org/10.7554/eLife.38433.018
Figure 5—figure supplement 1
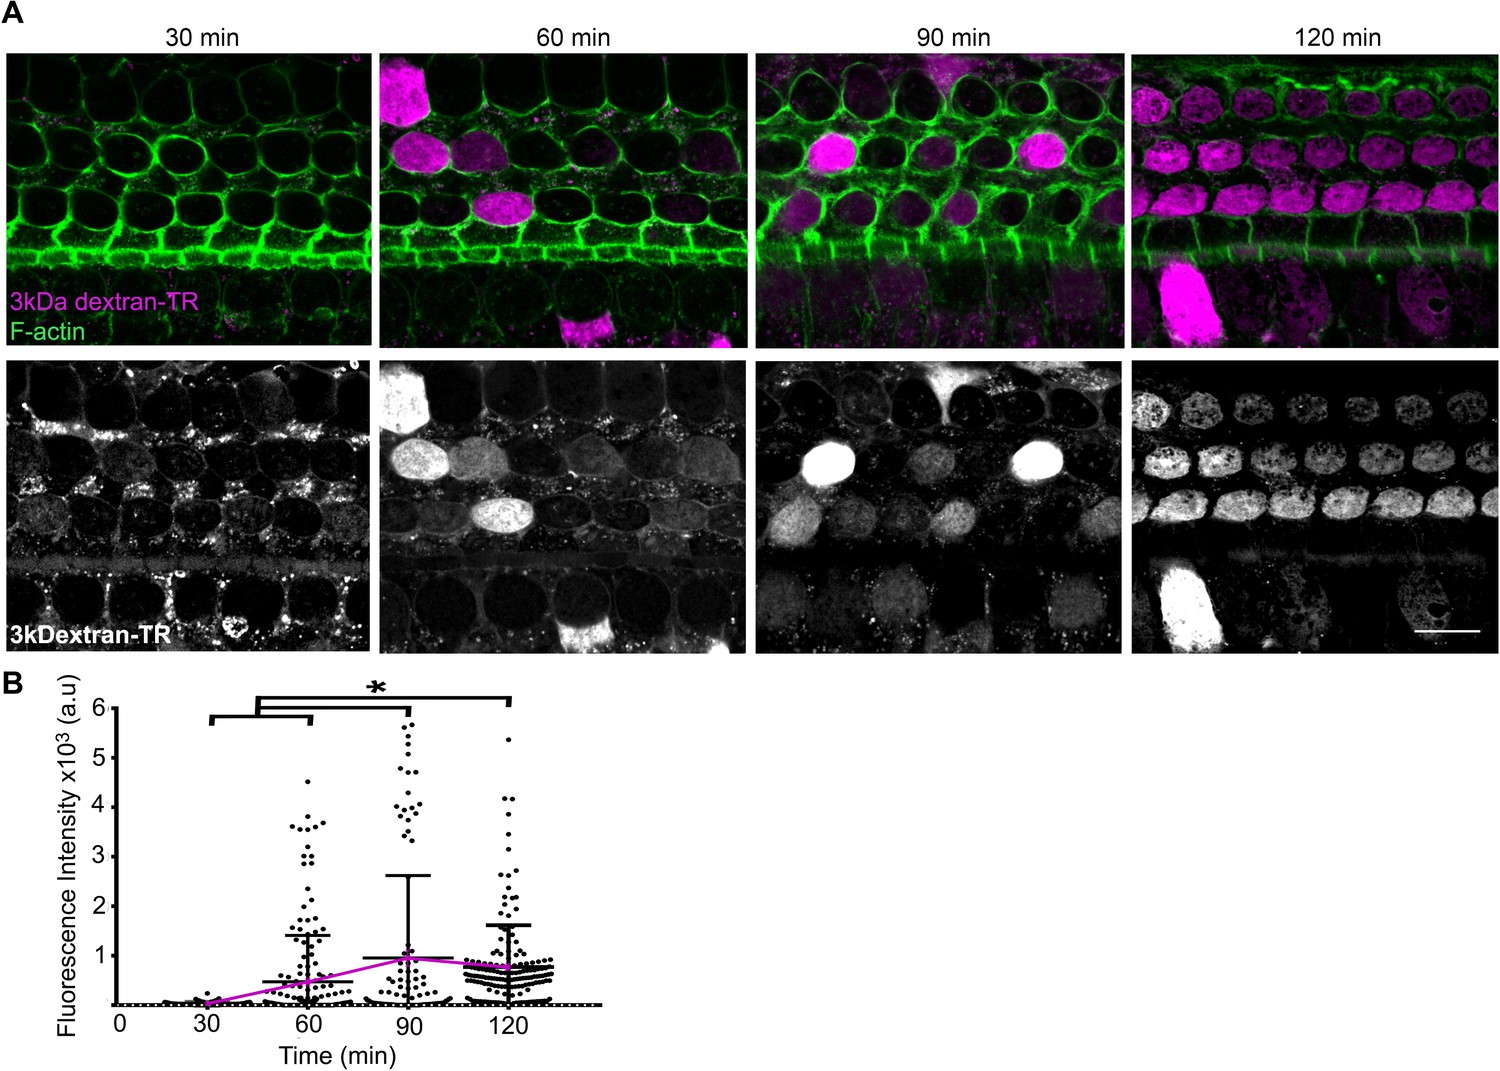
Time course of 3 kDa dextran-TR uptake into hair cells.
(A) 3 kDa dextran-TR fluorescence after 30, 60, 90 or 120 min incubation with organ of Corti explants is shown in magenta merged with F-actin (green) (top images) and independently in gray scale (bottom images). The image display range was linearly adjusted in each one of the gray images independently for visualization of the 3 kDa dextran-TR fluorescence (B) Quantification of fluorescence intensity in the cell body of hair cells at the different time points (30 min, n = 121; 60 min, n = 177; 90 min, n = 107 and 120 min, n = 166). Each dot represents a single hair cell, with mean and standard deviation shown for each group. Asterisks indicate significant differences among the different cochlear regions (p < 0.01, one-way ANOVA with Turkey´s multiple comparison test). Fluorescence intensity means for 30 to 120 min are connected with a magenta line.
-
Figure 5—figure supplement 1—source data 1
Mean fluorescence values for Figure 5—figure supplement 1B.
- https://doi.org/10.7554/eLife.38433.017
Figure 6
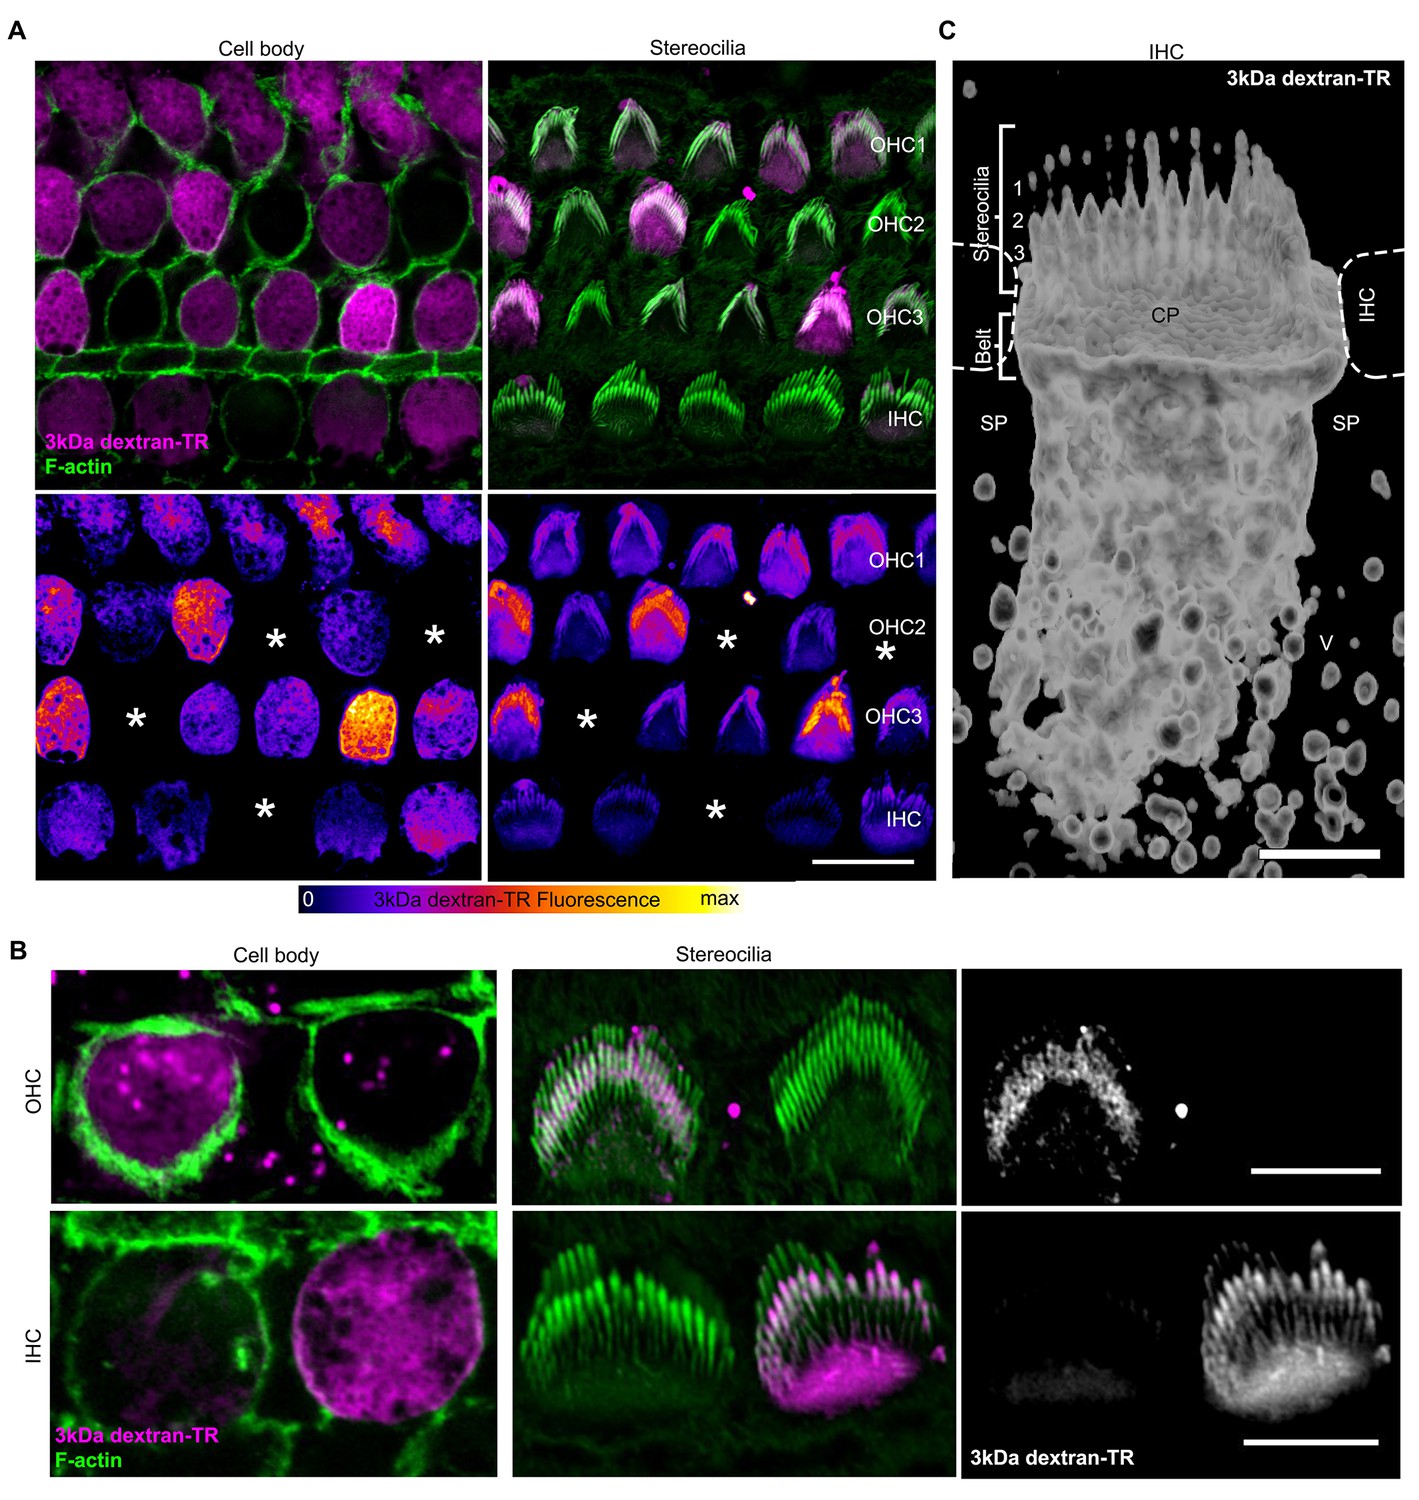
Stereocilia labeling in hair cells taking up 3 kDa dextran-TR.
(A) Confocal images displaying 3 kDa dextran-TR fluorescence (magenta in top panels) at the cell body and stereocilia counterstained with phalloidin to label F-actin (green) and thereby visualize hair cell boundaries and stereocilia. 3 kDa dextran-TR fluorescence from the same confocal images is shown below represented with the fire-LUT scale, which displays the amount of 3 kDa dextran-TR fluorescence in different colors (low in blue, medium in red and high in yellow). Cells lacking 3 kDa dextran-TR fluorescence at the cell body and stereocilia are indicated with an asterisk. Scale bar represents 20 μm. (B) Closer view of 3 kDa dextran-TR fluorescence at the cell body and stereocilia of outer hair cells (OHC) and inner hair cells (IHC). Scale bar represents 5 μm. (C) 3-D volume reconstruction of the 3 kDa dextran-TR fluorescence detected in a z-series image of the apical region of an IHC . Hair cells rows are numbered. Neighboring IHC, cuticular plate (CP) and supporting cells (SP) vesicles (V) are also indicated. Scale bar represents 2 μm.
Figure 7 with 1 supplement
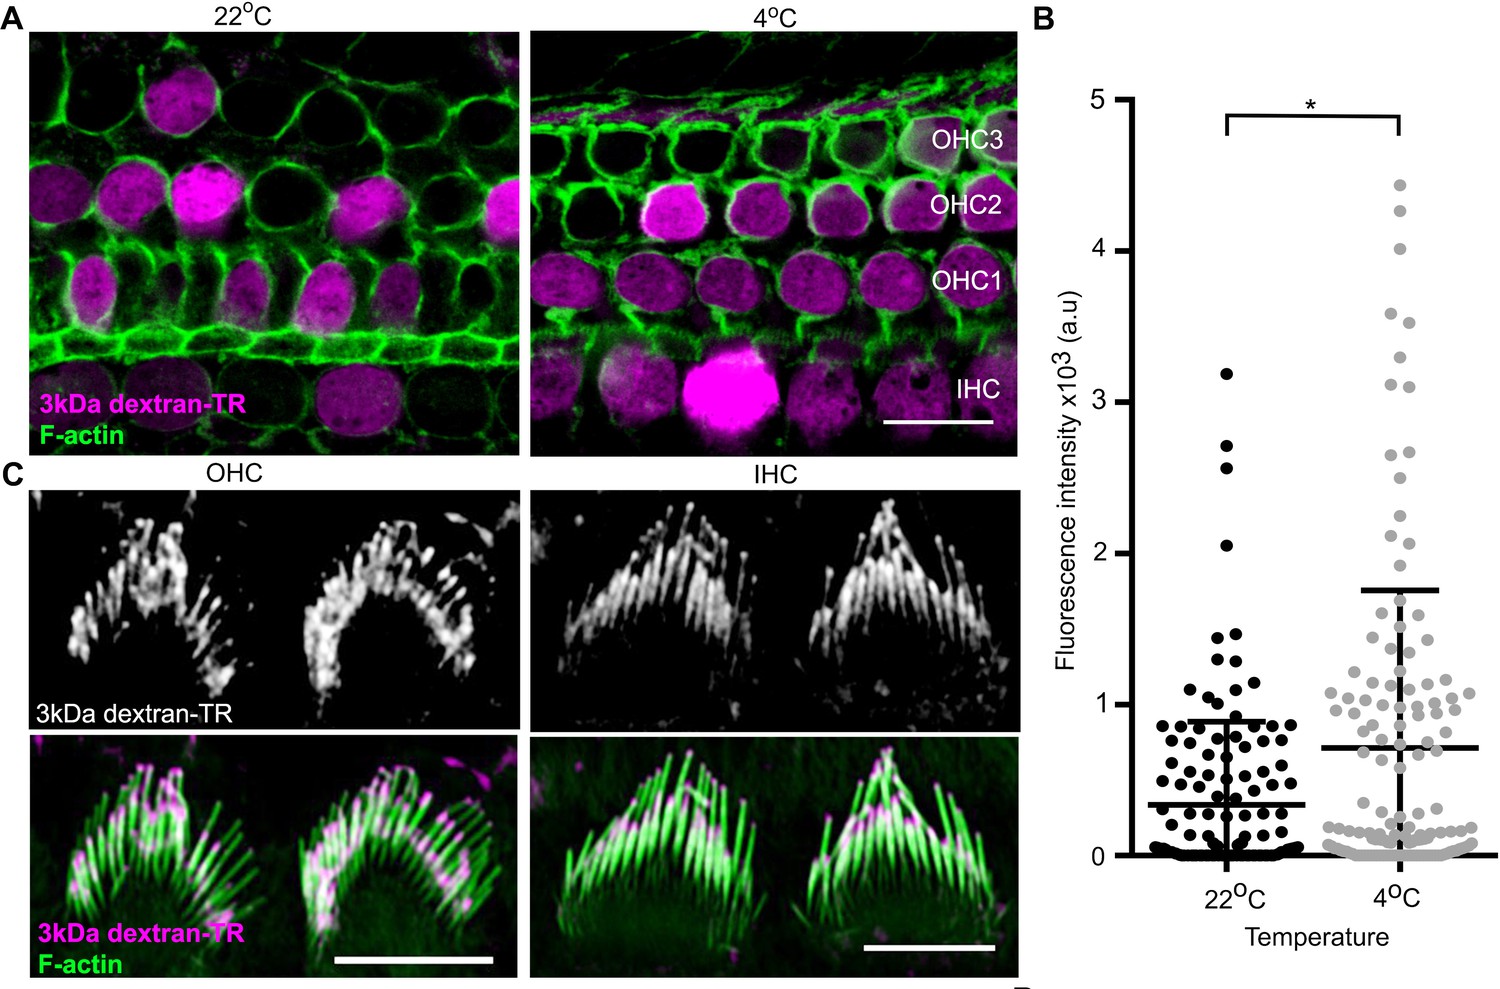
Dextran-TR uptake is maintained at low temperature.
(A) Representative confocal images displaying 3 kDa dextran-TR accumulation (magenta) in mice hair cells at 4 and 22°C. The scale bar represents 20 μm. (B) Fluorescence intensity quantification in the cell body of hair cells at 22°C (black, n = 136) or 4°C (gray, n = 140). Each dot represents a single hair cell and the mean and standard deviation for each condition are shown. Asterisk indicates significant increase in fluorescence intensity at 4°C (p < 0.01, unpaired t-test). (C) 3 kDa dextran-TR localization at the stereocilia of OHC (left) and IHC (right) after 2 hr incubation at 4°C. The scale bar represents 5 μm.
-
Figure 7—source data 1
Mean fluorescence values for Figure 7B.
- https://doi.org/10.7554/eLife.38433.022
Figure 7—figure supplement 1
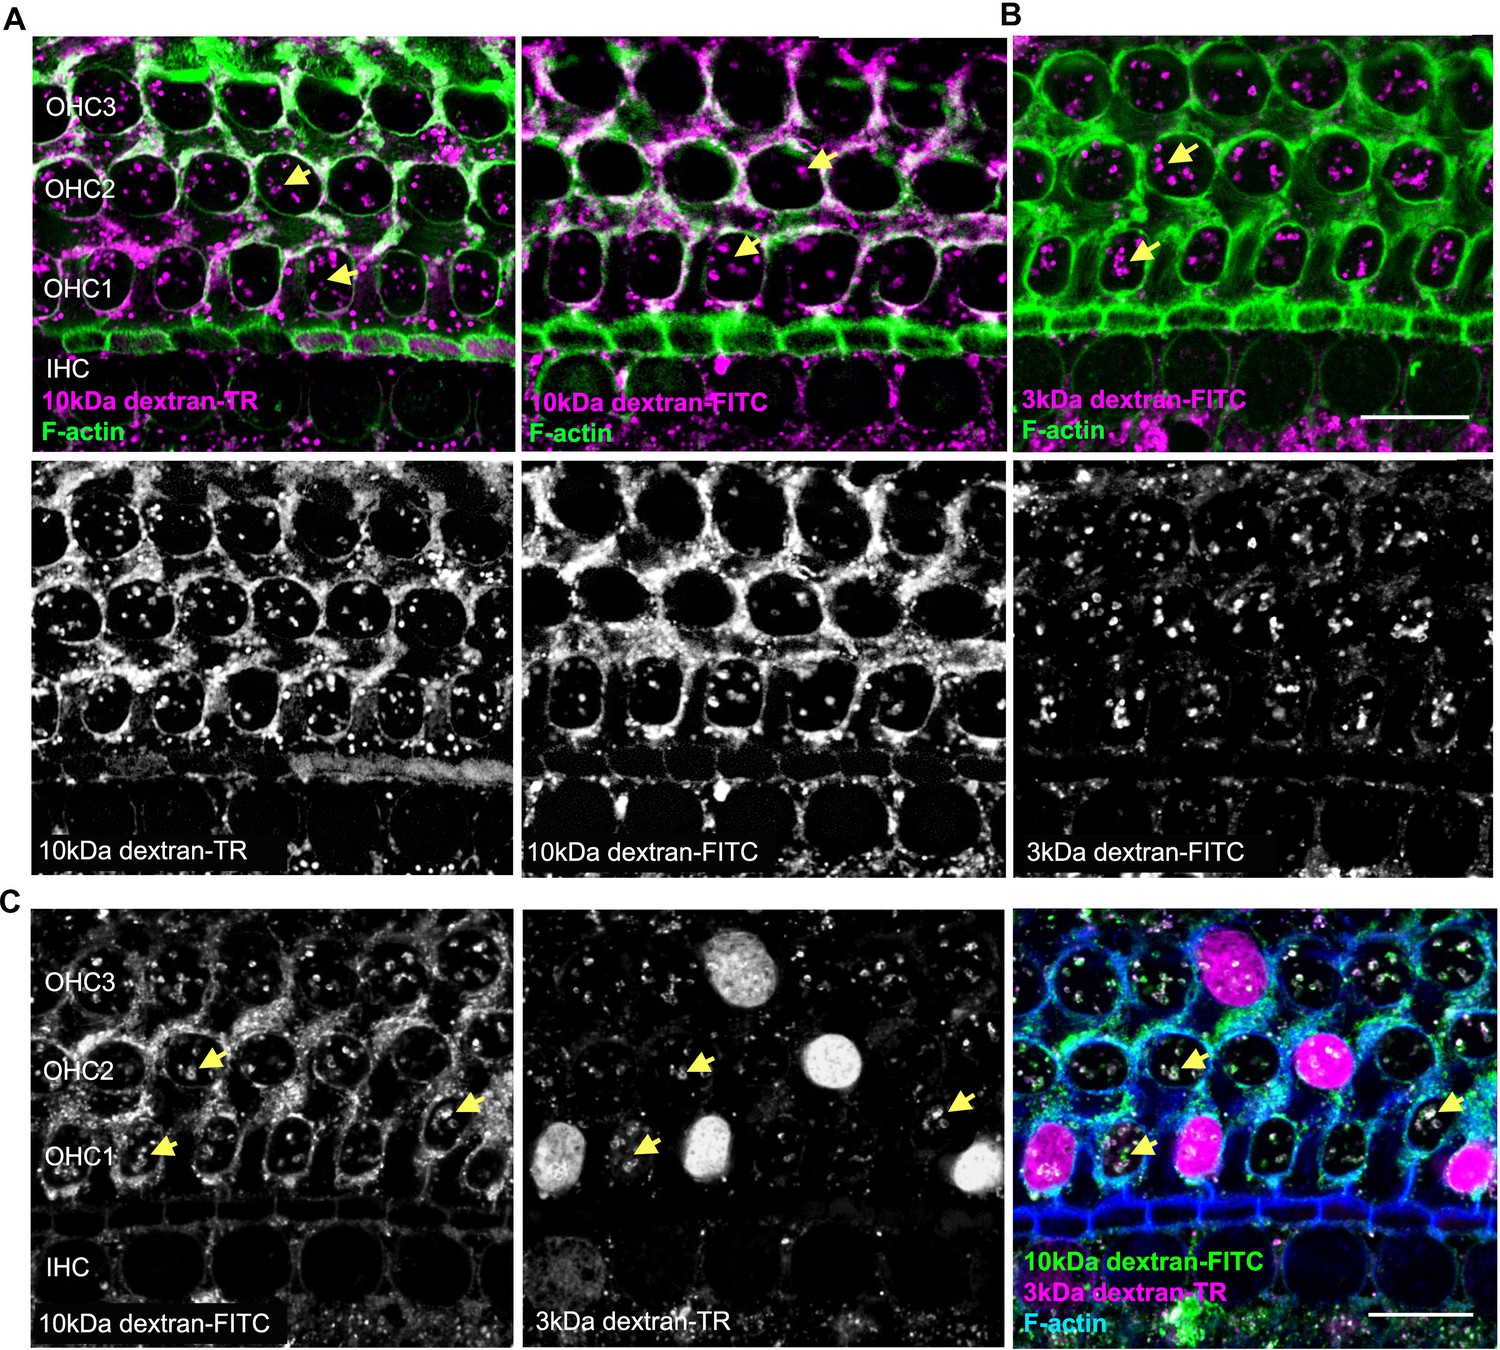
Testing for uptake of 10 kDa dextrans and 3 kDa dextran-FITC.
(A) Confocal image of hair cells incubated with 10 kDa dextran-TR (left) and -FITC (right) reveal vesicle-like structures (arrows). (B) Anionic 3 kDa dextran-FITC labels vesicles-like structures resembling the pattern observed with 10 kDa dextrans. Dextran fluorescence signal is shown in magenta merged with F-actin (green) (top image) and independently in gray scale (bottom image). (C) Organ of Corti incubated simultaneously with 3 kDa dextran-TR and 10 kDa dextran-FITC and depicted separately in gray in the left and middle images. In the right image, 10 kDa dextran-FITC (green) and 3 kDa dextran-TR (magenta) are shown together along with F-actin (blue). The scale bar represents 20 μm and the vesicle-like pattern of uptake is indicated with yellow arrows.
Figure 8 with 1 supplement

Breaking tip-links and blockade of the MET channel abolish dextran uptake.
(A) Representative confocal images of hair cells after incubation with 3 kDa dextran-TR in the absence (control) or presence of BAPTA (5 mM) or MET channel blockers; amiloride (150 µM), benzamil (30 µM), neomycin (500 µM), dihydrostreptomycin (500 µM). 3 kDa dextran-TR fluorescence is shown in magenta and tissue was counterstained with phalloidin for visualization of the hair cell boundaries (green). The three rows of outer hair cells (OHC) and one row of inner hair cells (IHC) are indicated and the scale bar represents 20 μm. (B) Quantification of 3 kDa dextran-TR fluorescence intensity in the cell body of hair cells in the absence (control, n = 133) or presence of BAPTA (n = 116), amiloride (n = 72), benzamil (n = 111), DHS (n = 64) or neomycin (n = 80). Each dot represents a single hair cell, and mean and standard deviation for each condition are shown. Asterisks indicate significant differences between the control and different blocker conditions (p< 0.01, one-way ANOVA with Turkey´s multiple comparison test).
-
Figure 8—source data 1
Mean fluorescence values for Figure 8B.
- https://doi.org/10.7554/eLife.38433.025
Figure 8—figure supplement 1
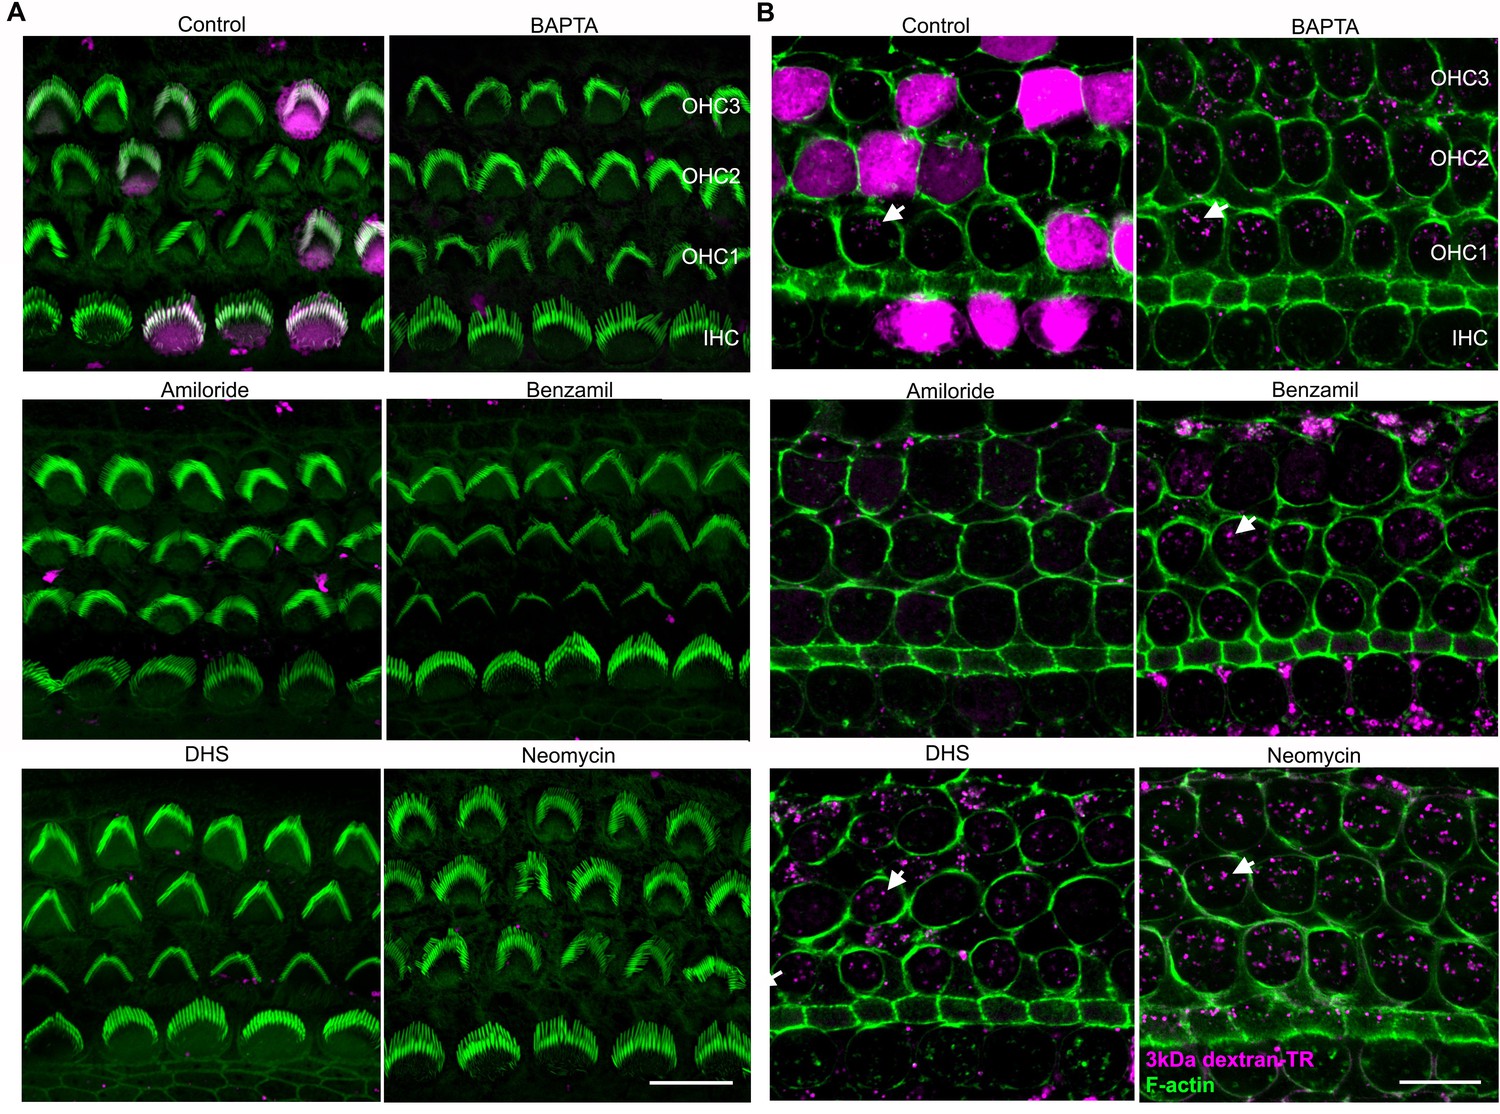
Breaking tip-links and blockade of the MET channel both abolish dextran uptake and stereocilia labeling.
(A) Confocal images of the same hair cells shown in Figure 8A at the stereocilia level showing stereocilia dextran labeling (magenta) in the absence and presence of BAPTA or MET channel blockers. (B) Confocal images of the same hair cell bodies shown in Figure 8A with the brightness and contrast linearly adjusted in ImageJ to enhance visualization of the vesicle-like uptake. The scale bars represent 20 μm in both panels.
Figure 9 with 1 supplement
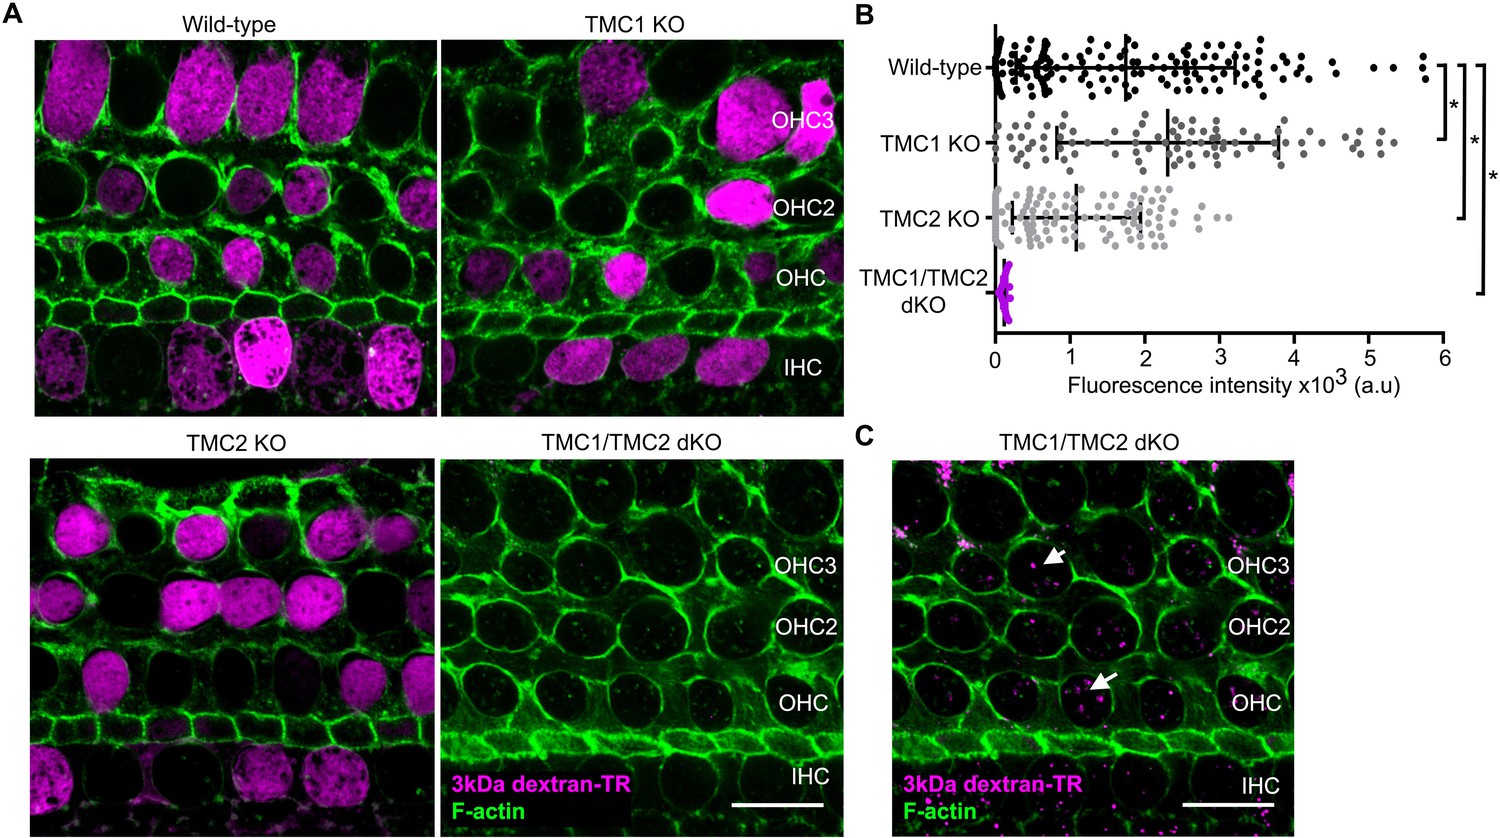
TMC1 and TMC2 are essential for the uptake of 3 kDa dextran-TR into hair cells.
(A) Confocal images showing dextran-TR (magenta) uptake into hair cell bodies from wild-type, TMC1 KO, TMC2 KO or TMC1/TMC2 dKO mice. Phalloidin was used to counterstain for F-actin and visualize hair cell boundaries (green). Three rows of outer hair cells (OHC) and one row of inner hair cells (IHC) are indicated. Scale bar indicates 20 μm. (B) Quantification of fluorescence intensity in the cell body of wild-type (n = 146), TMC1 KO (n = 91), TMC2 KO (n = 111) and TMC1/TMC2 dKO (n = 94) mice. Each dot represents a single hair cell, and the mean and standard deviation for each group are shown. Asterisks indicate significant differences among the different mice genotypes (p < 0.01, one-way ANOVA with Turkey´s multiple comparison test). (C) A vesicle-like pattern is also observed with 3 kDa dextran-TR in TMC1/TMC2 dKO mice hair cells when the image display range was linearly adjusted in ImageJ.
-
Figure 9—source data 1
Mean fluorescence values for Figure 9B.
- https://doi.org/10.7554/eLife.38433.028
Figure 9—figure supplement 1
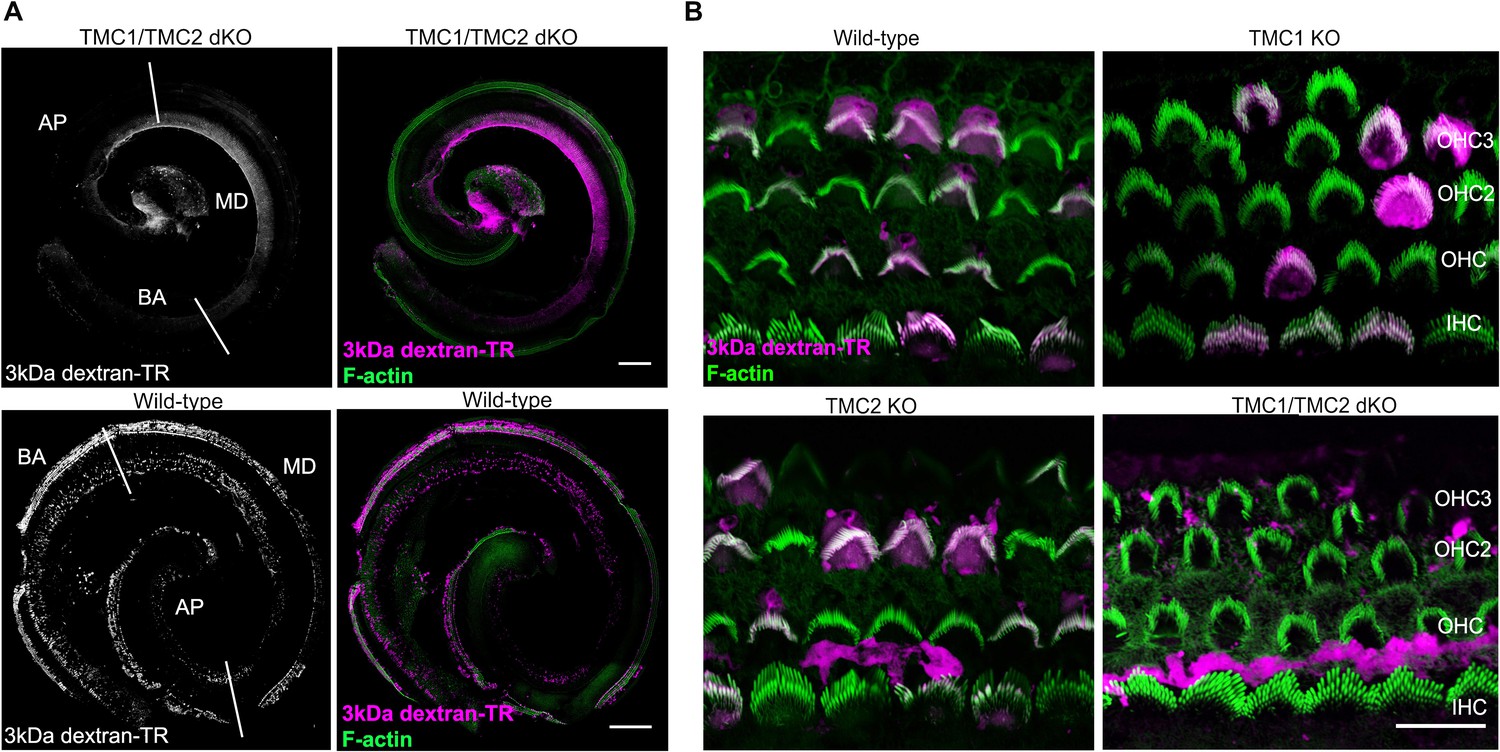
TMC1 and TMC2 are essential for dextran-TR uptake and stereocilia labeling.
(A) Specific 3 kDa dextran-TR (magenta) uptake into hair cells for wild-type (bottom panel) or TMC1/TMC2 dKO mice (top panel) across the whole organ of Corti. Confocal image showing 3 kDa dextran-TR fluorescence (grey) and merged images displaying dextran fluorescence (magenta) and phalloidin (green) used to label F-actin and visualize stereocilia. Basal (BA), middle (MD) and apical (AP) region of the organ are indicated. Scale bar represents 200 μm in both images. (B) Confocal images of the same hair cells shown in Figure 9A at the level of stereocilia for wild-type and KO mice. The scale bar represents 20 μm.
Tables
Table 1
Primers used for the genotyping of TMC1 and TMC2 KO and TMC1-Cherry transgenic mice.
https://doi.org/10.7554/eLife.38433.029| Forward primer | Reverse primer | PCR frag. | |
|---|---|---|---|
| TMC1 wt | GACAGTTGGTGCTGGGATCT | AAGTACGAGGCCACTGAGGA | 215 bp |
| TMC1 KO | ATCCTCTGCATGGTCAGGTC | CGTGGCCTGATTCAT | 315 bp |
| TMC2 wt | CGGTTCTTCTGTGGCATCTTACTT | ACCAGGCAATTGACATGAATA | 401 bp |
| TMC2 KO | CTGCCTTCTGGTTAGATCACTTCA | GTGTTTTAAGTGTACCCACGGTCA | 621 bp |
| mCherry | TTCACTTGCCCTTCTTCATCT | CGCCCTCGATCTCGAACT | 167 bp |
Additional files
-
Transparent reporting form
- https://doi.org/10.7554/eLife.38433.030
Download links
A two-part list of links to download the article, or parts of the article, in various formats.
Downloads (link to download the article as PDF)
Open citations (links to open the citations from this article in various online reference manager services)
Cite this article (links to download the citations from this article in formats compatible with various reference manager tools)
Structural relationship between the putative hair cell mechanotransduction channel TMC1 and TMEM16 proteins
eLife 7:e38433.
https://doi.org/10.7554/eLife.38433


