Targeting light-gated chloride channels to neuronal somatodendritic domain reduces their excitatory effect in the axon
- Baylor College of Medicine, United States
- Jan and Dan Duncan Neurological Research Institute at Texas Children’s Hospital, United States
Figures
Figure 1 with 3 supplements
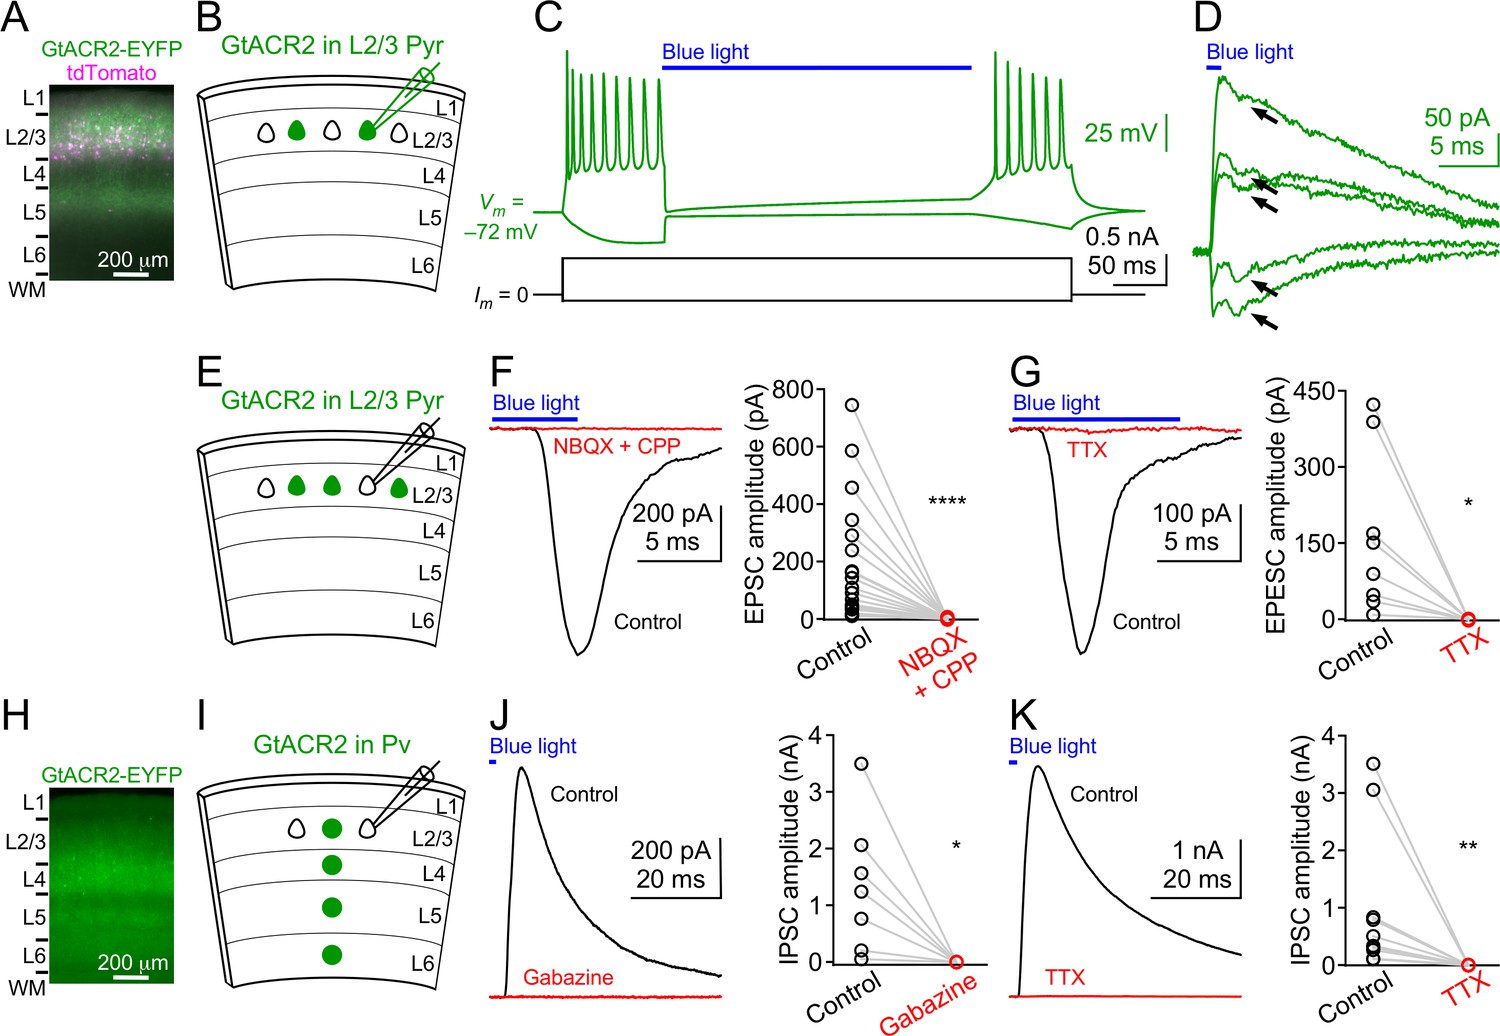
Light activation of GtACR2 causes excitatory and inhibitory neurons to release neurotransmitters.
(A) A representative fluorescent image of the visual cortex showing GtACR2-EYFP and tdTomato expression in a subset of layer 2/3 pyramidal neurons. Note the strong EYFP fluorescence in layer 5 that contains the axons of layer 2/3 pyramidal neurons. L, layer; WM, white matter. (B) Schematic of slice experiments in (C,D). GtACR2 in a subset of layer 2/3 pyramidal neurons. (C) Membrane potentials (upper panel) in response to somatic current injections (lower panel) from a GtACR2+ neuron. Blue light activation of GtACR2 suppressed the action potentials evoked by current injections (n = 5 neurons). (D) Blue light-induced membrane currents recorded at the membrane potentials of −75, –77, −78, –79, and −80 mV from the same GtACR2+ neuron in (C). Note the EPSC-like inward currents (arrows) superimposed on the GtACR2-mediated photocurrents (n = 2 neurons). (E) Schematic of slice experiments in (F,G). GtACR2 in a subset of layer 2/3 pyramidal neurons. (F) Left, photoactivation of GtACR2 generated EPSCs in a GtACR2– neuron, which were abolished by the glutamate receptor antagonists, NBQX and CPP. Right, summary graph of similar experiments (n = 17, p<0.0001). (G) Left, photoactivation of GtACR2 generated EPSCs in a GtACR2– neuron, which were abolished by the voltage-gated sodium channel blocker, TTX. Right, summary graph of similar experiments (n = 8, p=0.02). (H) A representative fluorescent image of the visual cortex showing GtACR2-EYFP expression in Pv neurons. (I,J,K) As in (E,F,G), but for GtACR2 in Pv neurons. GtACR2 activation-induced IPSCs were abolished by the GABAA receptor antagonist, Gabazine (J, n = 7, p=0.02) or TTX (K, n = 10, p=0.002).
Figure 1—figure supplement 1
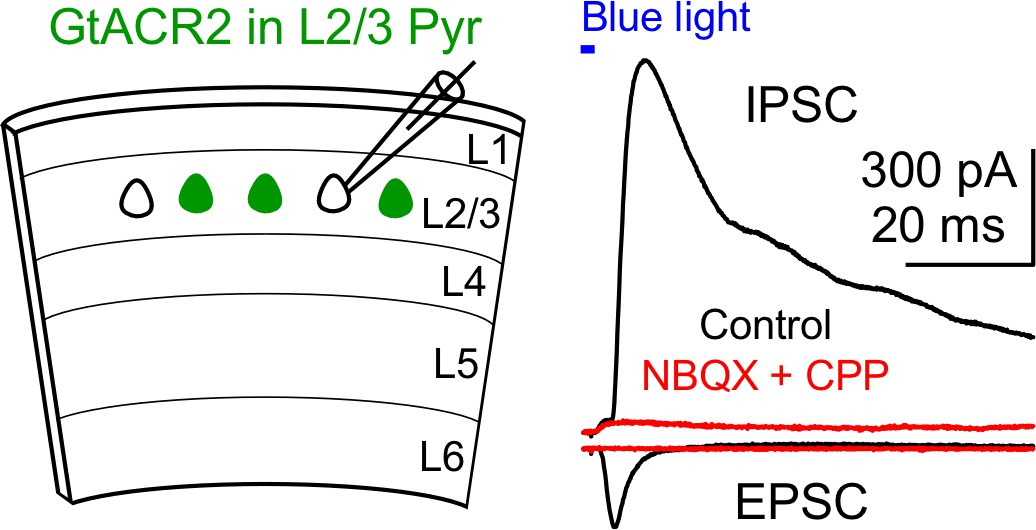
Recruitment of inhibitory neurons by activating GtACR2 in excitatory neurons.
Left, schematic of slice experiments. GtACR2 in a subset of layer 2/3 pyramidal neurons. Right, photoactivation of GtACR2 generated an EPSC (inward current) recorded at the membrane potential of −60 mV and an IPSC (outward current) recorded at the membrane potential of +10 mV in a GtACR2– neuron. The IPSC was abolished by the glutamatergic receptor antagonists, NBQX and CPP (red trace), indicating its disynaptic nature (n = 3 neurons).
Figure 1—figure supplement 2
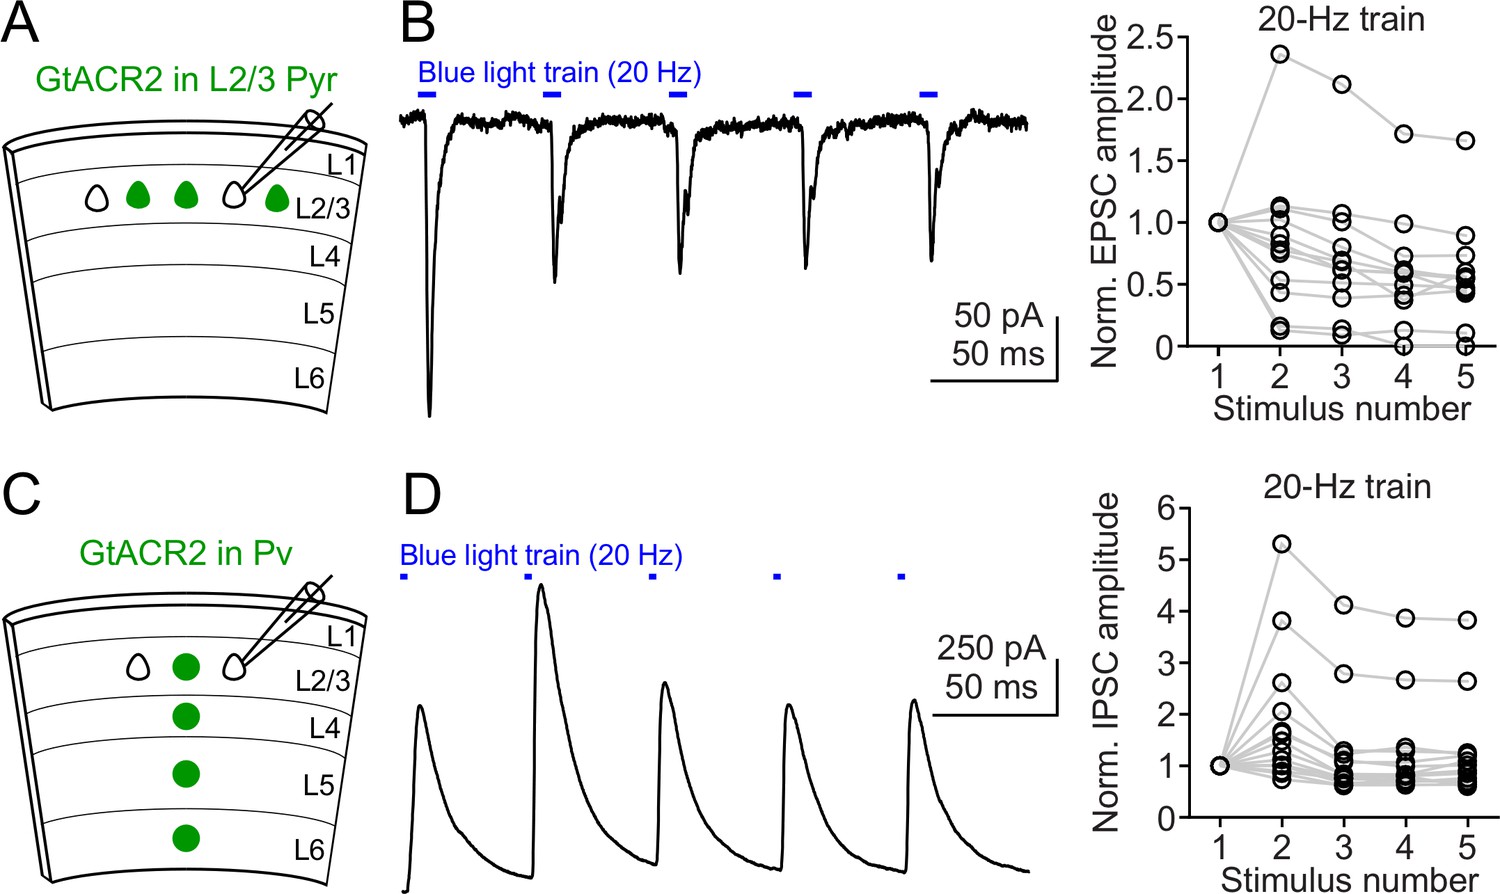
Neurotransmitter release induced by repetitive activation of GtACR2.
(A) Schematic of slice experiments in (B). GtACR2 in a subset of layer 2/3 pyramidal neurons. (B) Left, a 20 Hz train of blue-light pulses activated GtACR2 to generate EPSCs in a GtACR2– neuron. Right, summary graph of similar experiments (n = 12) showing the EPSC amplitudes normalized to the first response. (C,D) As in (A,B), but for GtACR2 in Pv neurons. A 20 Hz train of blue-light pulses activated GtACR2 to generate IPSCs in GtACR2– neurons (n = 14).
Figure 1—figure supplement 3
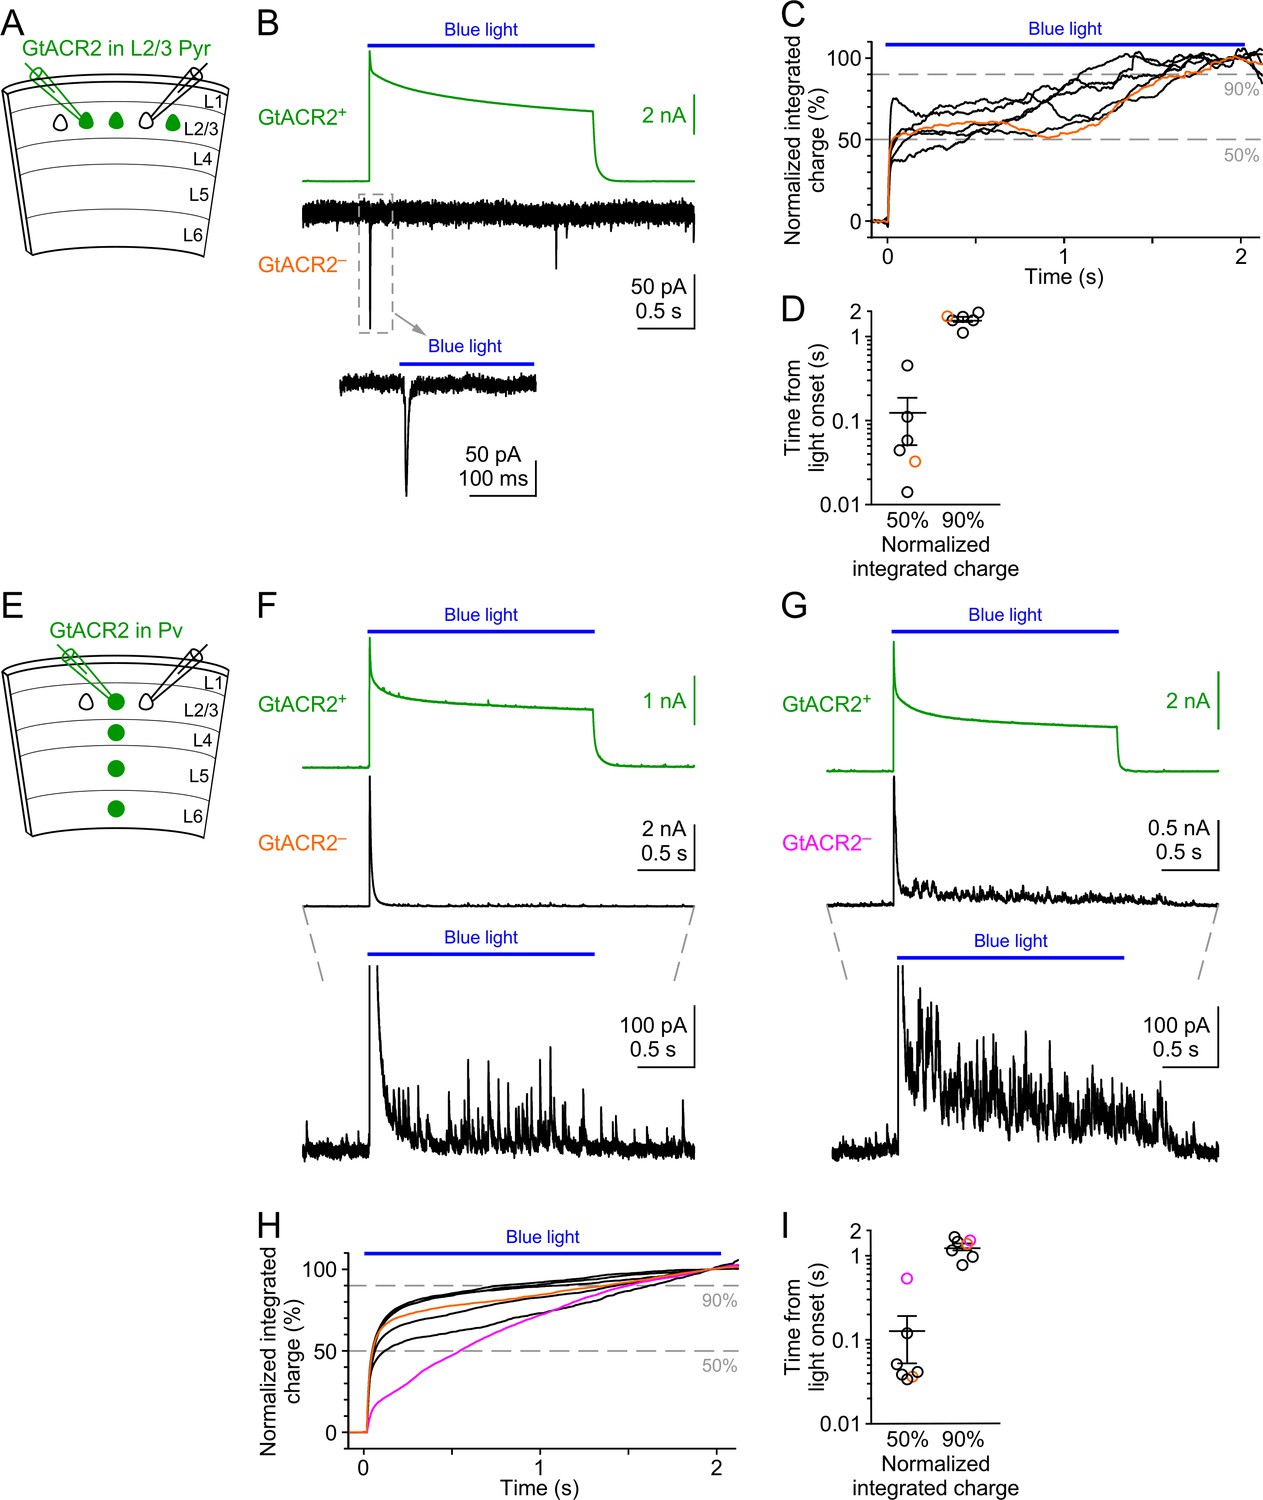
Neurotransmitter release induced by prolonged activation of GtACR2.
(A) Schematic of slice experiments in (B). GtACR2 in a subset of layer 2/3 pyramidal neurons. (B) Photoactivation of GtACR2 by a 2-s light pulse generated photocurrents in a GtACR2+ neuron (top panel, recorded at the membrane potential of +10 mV) and EPSCs in a simultaneously recorded GtACR2– neuron (middle panel, recorded at the membrane potential of −60 mV). A segment of the trace from the GtACR2– neuron was expanded to show the EPSCs (bottom panel). Note the sustained photocurrent throughout the light pulse and the large EPSC at the onset of the light pulse. (C,D) Summary graphs of similar experiments (n = 6) as in (B). (C) The cumulative charge transfers of EPSCs from GtACR2– neurons during 2-s light pulses were plotted as a function of time to show the time course of neurotransmitter release. Each curve was normalized by the mean of its last 100 ms of the 2-s light pulse. (D) The durations from the onset of the light pulse to the time when the cumulative charge transfer reached 50% and 90%. The orange line and symbol correspond to the experiment in (B). (E,F,G) As in (A,B), but for GtACR2 in Pv neurons. Two experiments were shown in (F,G). The traces from the GtACR2– neurons were expanded to show IPSCs (bottom panels). Note the sustained photocurrents throughout the light pulses and the large IPSCs at the onset of the light pulses followed by smaller IPSCs. (H,I) As in (C,D), but for GtACR2 in Pv neurons (n = 7). The orange and magenta lines and symbols correspond to the experiments in (F,G), respectively.
Figure 2 with 3 supplements

Reducing intracellular chloride concentrations diminishes the neurotransmitter release induced by activation of GtACR2 or iC++.
(A) Schematic of slice experiments in (B). GtACR2 in a subset of layer 2/3 pyramidal neurons. (B) Left, photoactivation of GtACR2 generated EPSCs in a GtACR2– neuron, which were diminished by decreasing intracellular chloride concentrations with an NKCC1 blocker, bumetanide. Right, summary graph of similar experiments (n = 10, p=0.002). (C,D) As in (A,B), but for ChR2. ChR2 activation-induced EPSCs were not affected by bumetanide (n = 8, p=0.9). (E,F) As in (A,B), but for GtACR2 in Pv neurons. GtACR2 activation-induced IPSCs were diminished by bumetanide (n = 9, p=0.004). (G,H) As in (A,B), but for iC++. iC++-induced EPSCs were diminished by bumetanide (n = 6, p=0.009). (I,J) As in (E,F), but for iC++. iC++-induced IPSCs were diminished by bumetanide (n = 8, p=0.008).
Figure 2—figure supplement 1
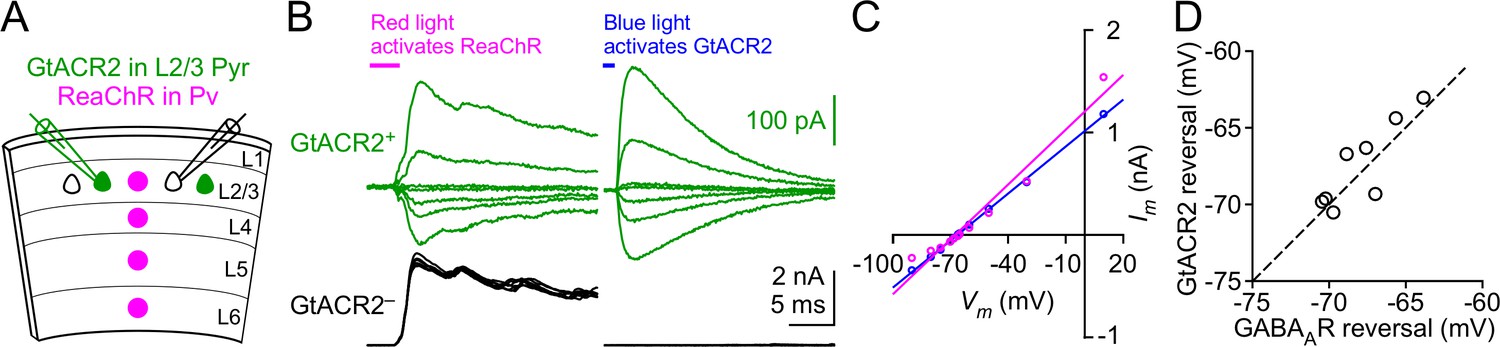
The reversal potential of GtACR2 at the soma is similar to that of GABAA receptors.
(A) Schematic of slice experiments in (B). GtACR2 in a subset of layer 2/3 pyramidal neurons and ReaChR in Pv neurons. (B) In a GtACR2+ neuron, GABAergic IPSCs induced by activating ReaChR in Pv neurons (left panel) and GtACR2-mediated photocurrents (right panel) were sequentially recorded at different membrane potentials. The example traces show the currents at the membrane potentials of −50, −60, −65, −66, −68, −70, and −75 mV. A GtACR2– neuron was simultaneously recorded at the membrane potential of +10 mV to ensure that the blue light did not generate IPSCs (right panel). (C) The amplitudes of IPSCs and GtACR2 photocurrents were plotted as a function of the membrane potentials for the GtACR2+ neuron in (B). Each set of data were fit with linear regression and the reversal potentials were determined by the Vm-axis intercepts. (D) Summary graph of similar experiments in (B,C) where the reversal potential of IPSCs was plotted against that of GtACR2 photocurrents for each GtACR2+ neuron. All data points fall close to the dotted unity line, and there is no significant difference between the reversal potentials of IPSCs and photocurrents (n = 8, p=0.4).
Figure 2—figure supplement 2
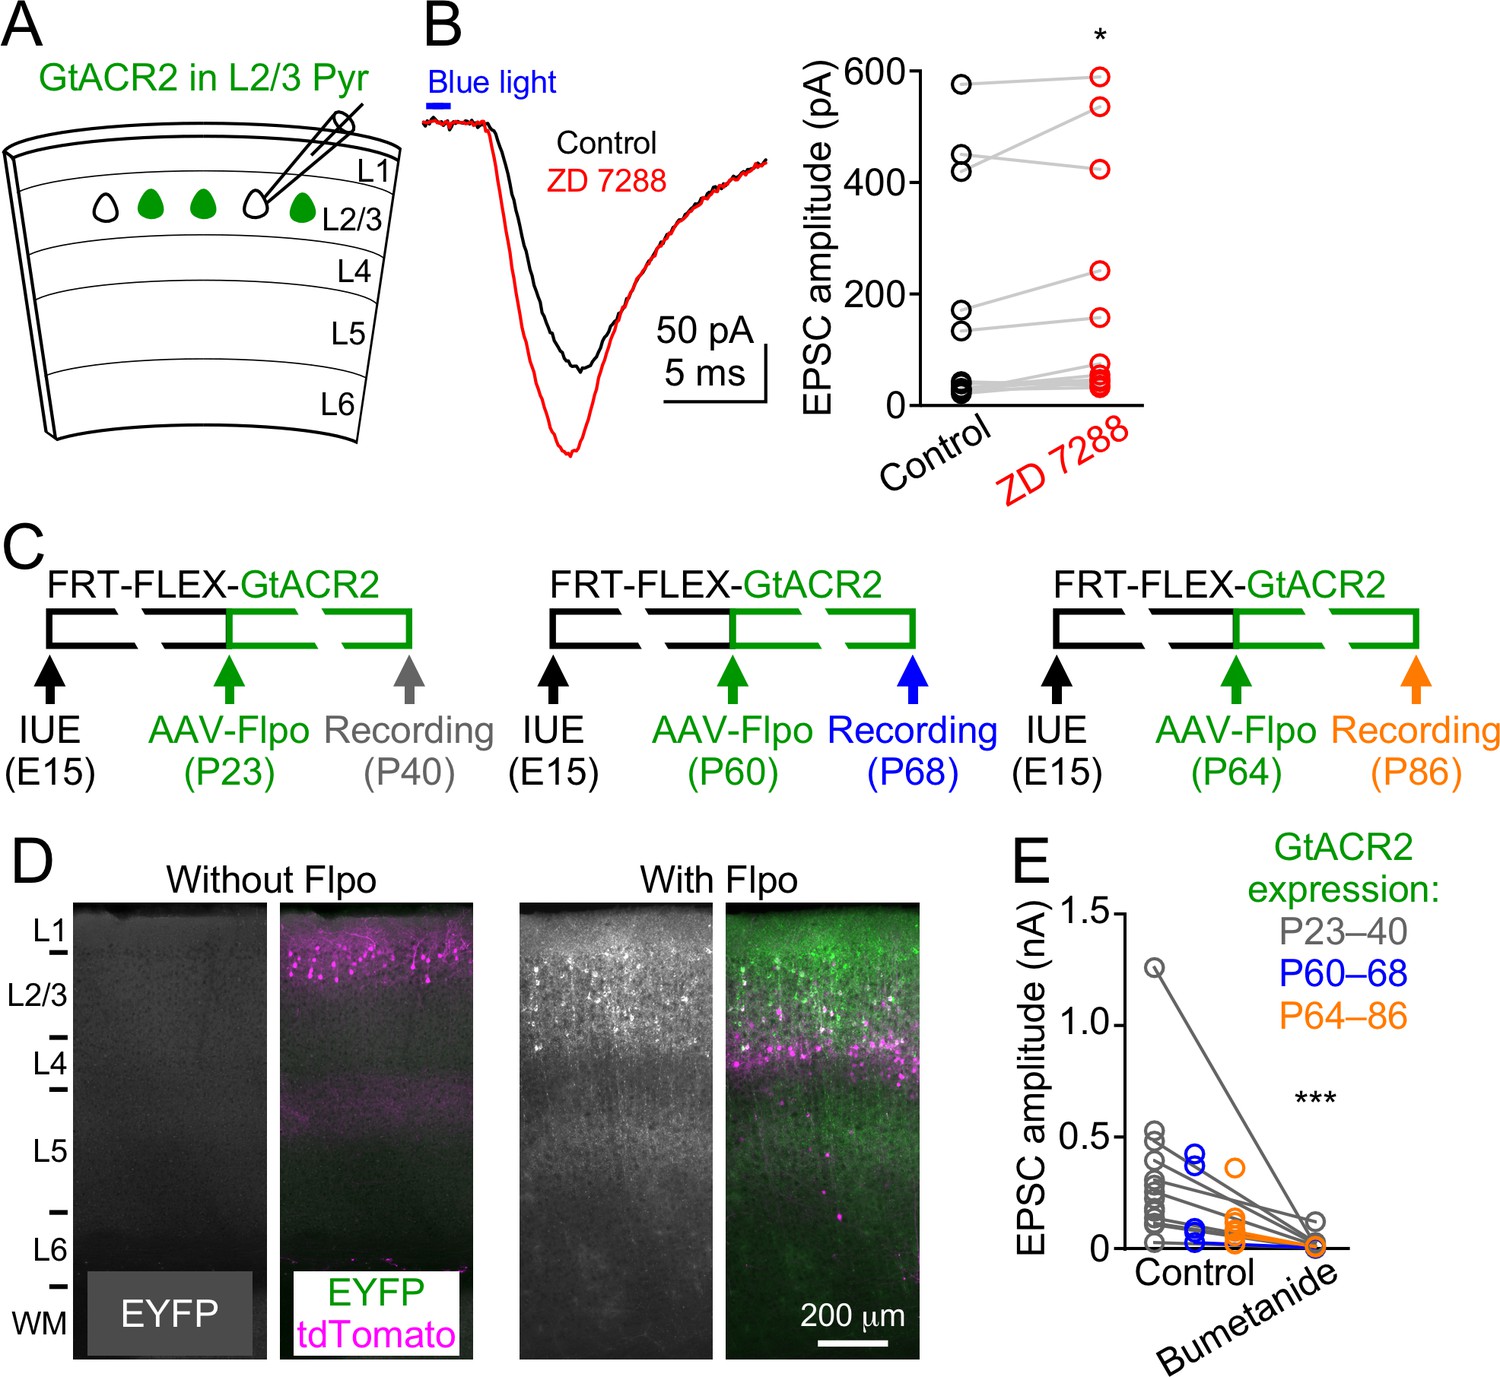
GtACR2-induced neurotransmitter release is not due to rebound depolarization or its long-term expression throughout development.
(A) Schematic of slice experiments in (B). GtACR2 in a subset of layer 2/3 pyramidal neurons. (B) Left, photoactivation of GtACR2 generated EPSCs in a GtACR2– neuron, which were not decreased by blocking the Ih current with ZD7288 (20 μM). Right, summary graph of similar experiments showing that the EPSC amplitudes were slightly increased by ZD7288 (n = 12, p=0.03). (C) Schematics of conditional expression of GtACR2 in a subset of layer 2/3 pyramidal neurons. A Flpo-dependent plasmid (FRT-FLEX-GtACR2) was electroporated at embryonic day 15 (E15) and AAV9-hSyn-Flpo was injected into the electroporated mice at different postnatal days (P23, P60, or P64). Green bars indicate the approximate GtACR2 expression time windows. (D) Left, representative fluorescent images of the visual cortex obtained at postnatal day 78 showing that, without injection of AAV9-hSyn-Flpo, transfected neurons (labeled by tdTomato) did not express GtACR2-EYFP (left panel, n = 6 mice, postnatal day 51–150). Right, representative fluorescent images of the visual cortex obtained at postnatal day 40 showing that the expression of GtACR2-EYFP in transfected neurons was turned on by the injection of AAV9-hSyn-Flpo at postnatal day 23 (right panel, n = 7 mice, postnatal day 40–86). L, layer; WM, white matter. (E) Photoactivation of GtACR2 generated EPSCs in GtACR2– neurons when GtACR2 was expressed during 3 different time windows as indicated in (C). Bumetanide was applied in a subset of experiments and the EPSCs were diminished (n = 12, p=0.0005).
Figure 2—figure supplement 3
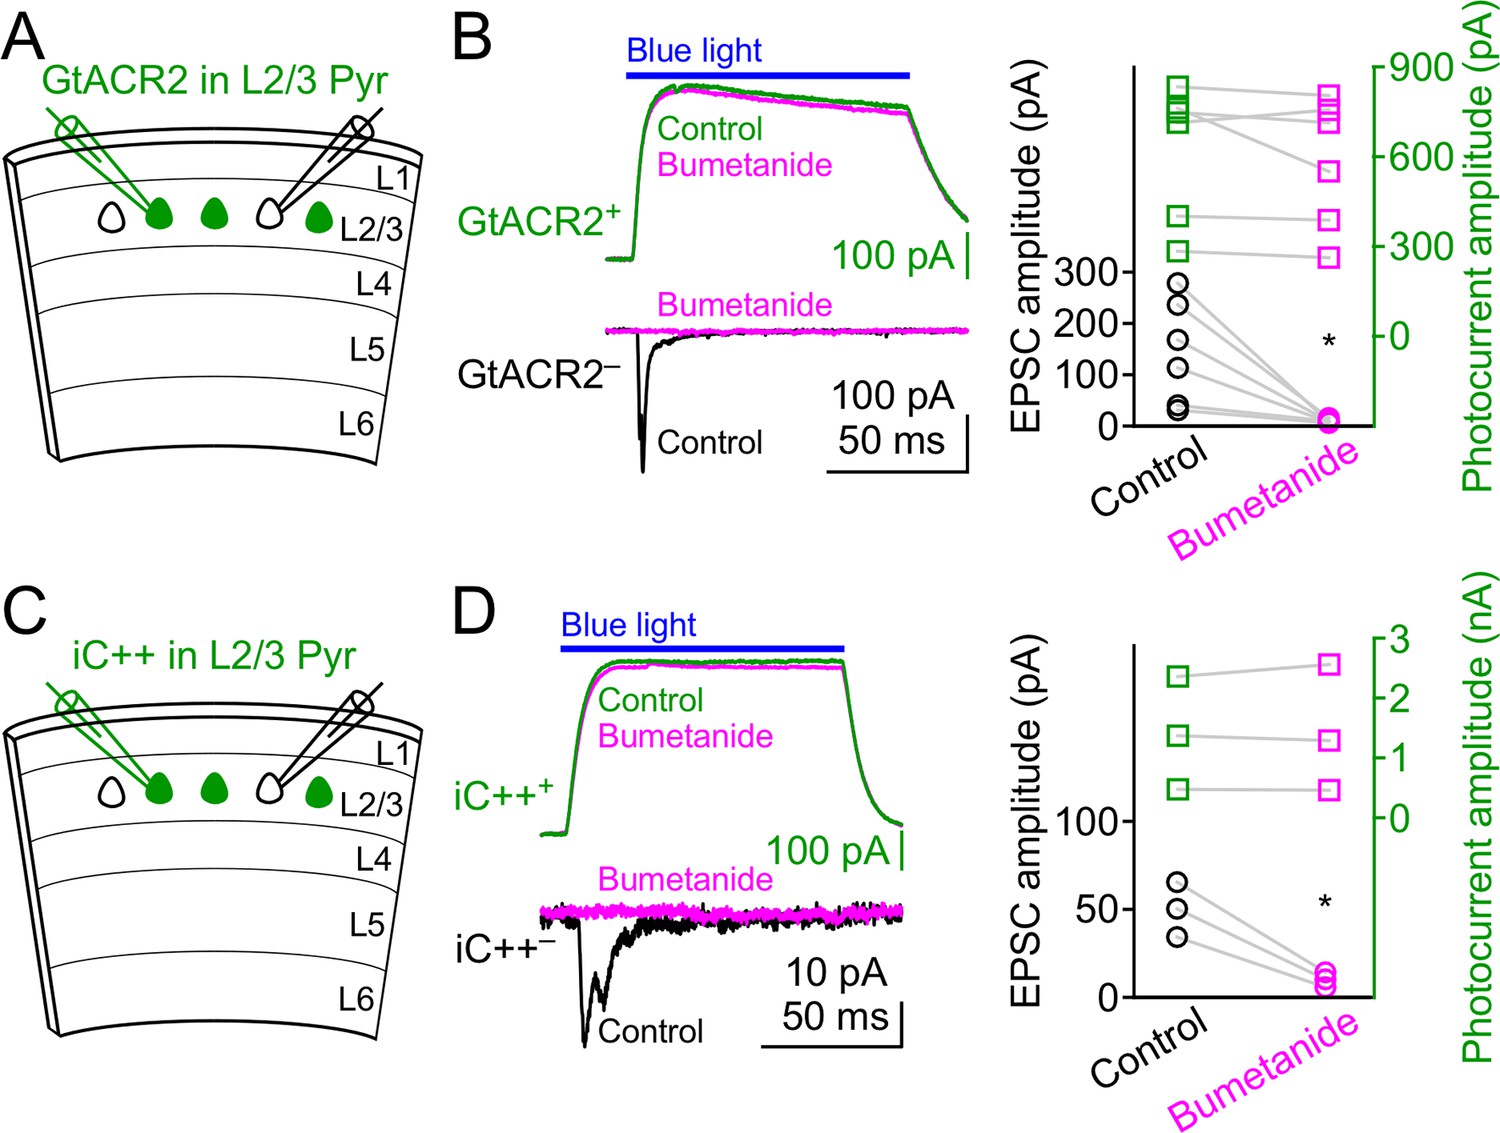
Bumetanide does not affect GtACR2 and iC++-mediated photocurrents.
(A) Schematic of slice experiments in (B). GtACR2 in a subset of layer 2/3 pyramidal neurons. (B) Left, photoactivation of GtACR2 generated photocurrents in a GtACR2+ neuron (top panel, recorded at the membrane potential of +10 mV) and EPSCs in a simultaneously recorded GtACR2– neuron (bottom panel, recorded at the membrane potential of −60 mV). Bumetanide diminished the EPSCs (circle symbols) without affecting the photocurrents (square symbols). Right, summary graph of similar experiments (n = 6; EPSCs, p=0.03; photocurrents, p=0.3). (C,D) As in (A,B), but for iC++. Bumetanide diminished the EPSCs without affecting the photocurrents (n = 3; EPSCs, p=0.03; photocurrents, p=0.7).
Figure 3 with 1 supplement
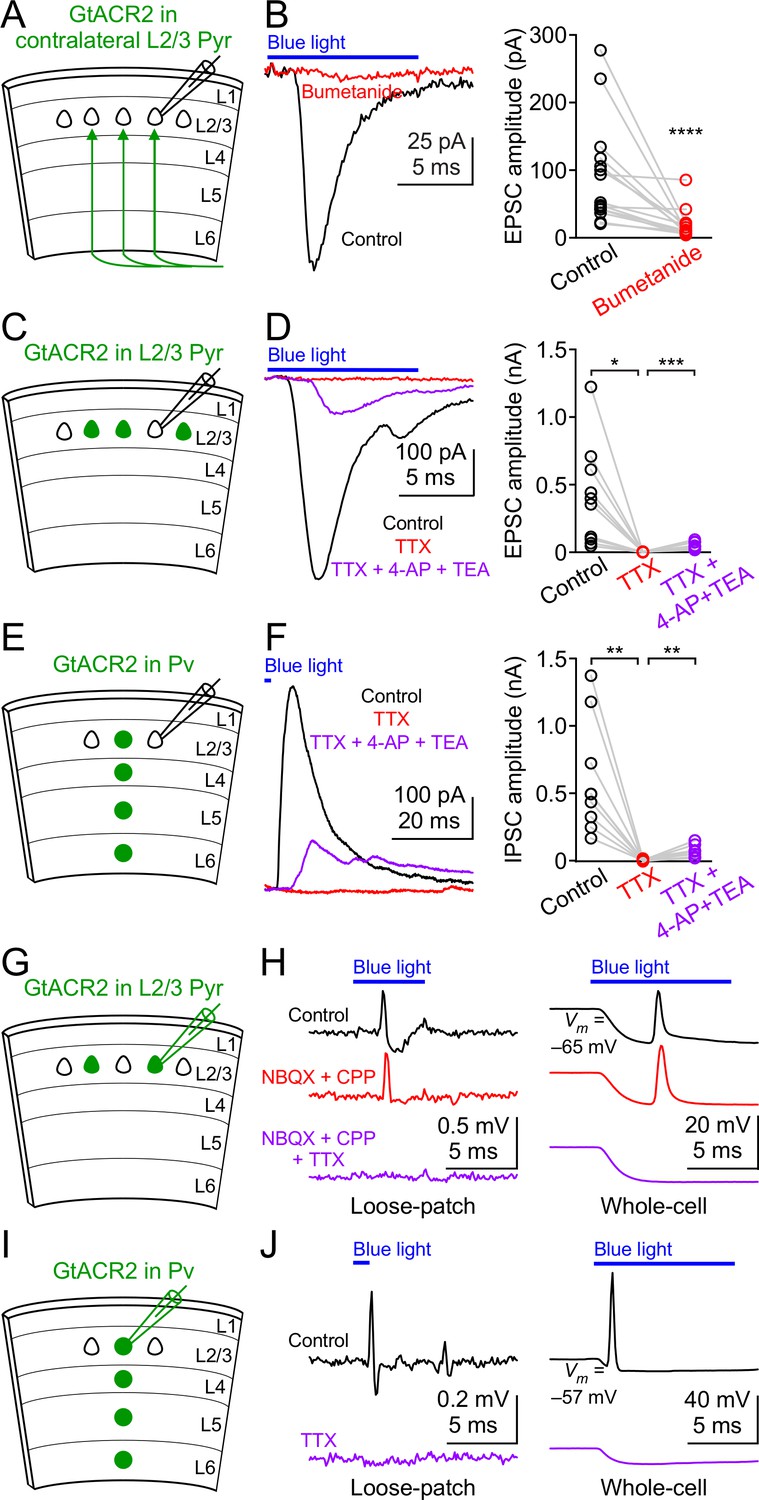
GtACR2 activation directly depolarizes the distal axon and presynaptic terminals and can result in antidromic spikes.
(A) Schematic of slice experiments in (B). GtACR2 in a subset of layer 2/3 pyramidal neurons in the contralateral hemisphere. (B) Left, photoactivation of GtACR2 in the callosal axons, severed from their somas, generated EPSCs in a GtACR2– neuron, which were diminished by bumetanide. Right, summary graph of similar experiments (n = 15, p<0.0001). (C) Schematic of slice experiments in (D). GtACR2 in a subset of layer 2/3 pyramidal neurons. (D) Left, photoactivation of GtACR2 generated EPSCs in a GtACR2– neuron, which were abolished by TTX, but partially recovered by the addition of voltage-gated potassium channel blockers, 4-AP (1.5 mM) and TEA (1.5 mM). Right, summary graph of similar experiments (n = 10; TTX vs. control, p=0.02, average EPSC amplitude in TTX was 2% of control; TTX + 4-AP + TEA vs. TTX, p=0.0004, average EPSC amplitude in TTX + 4-AP + TEA was 35% of control). (E,F) As in (C,D), but for Pv neurons. GtACR2 activation-induced IPSCs were abolished by TTX, but partially recovered by 4-AP and TEA (n = 9; TTX vs. control, p=0.006, average IPSC amplitude in TTX was 0.9% of control; TTX + 4-AP + TEA vs. TTX, p=0.008, average IPSC amplitude in TTX + 4-AP + TEA was 23% of control). (G) Schematic of slice experiments in (H). GtACR2 in a subset of layer 2/3 pyramidal neurons. (H) Photoactivation of GtACR2 generated antidromic spikes in GtACR2+ pyramidal neurons, which were not affected by NBQX and CPP, but were abolished by TTX in both loose-patch (left panel) and whole-cell (right panel) recordings. In the whole-cell recordings, the resting membrane potentials of those neurons that generated antidromic spikes were −68.1 ± 1.7 mV (mean ± s.e.m., n = 21). (I,J) As in (G,H), but for Pv neurons. The antidromic spikes in GtACR2+ Pv neurons were abolished by TTX. In the whole-cell recordings, the resting membrane potentials of those neurons that generated antidromic spikes were −60.0 ± 2.4 mV (mean ± s.e.m., n = 7).
Figure 3—figure supplement 1
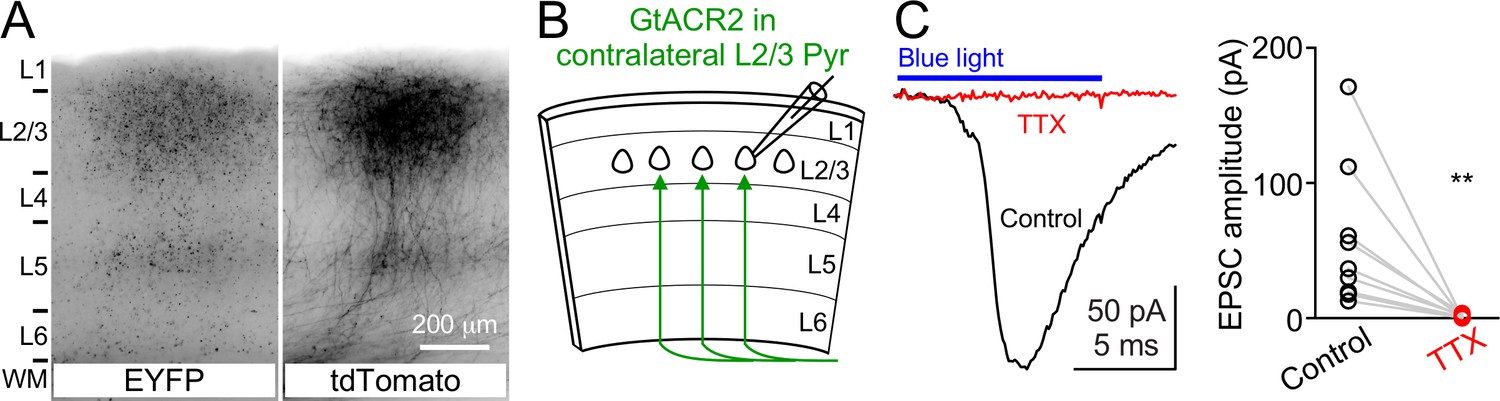
Activation of GtACR2 in the callosal axons causes neurotransmitter release.
(A) GtACR2-EYFP and tdTomato were expressed in a subset of layer 2/3 pyramidal neurons in the visual cortex of one hemisphere. Representative fluorescent images of the contralateral hemisphere showing GtACR2-EYFP (left panel) in the callosal projections labeled by tdTomato (right panel). L, layer; WM, white matter. (B) Schematic of slice experiments in (C). GtACR2-EYFP in a subset of layer 2/3 pyramidal neurons in the contralateral hemisphere. (C) Left, photoactivation of GtACR2 in the callosal axons generated EPSCs in a GtACR2– neuron, which were abolished by TTX. Right, summary graph of similar experiments (n = 9, p=0.004).
Figure 4
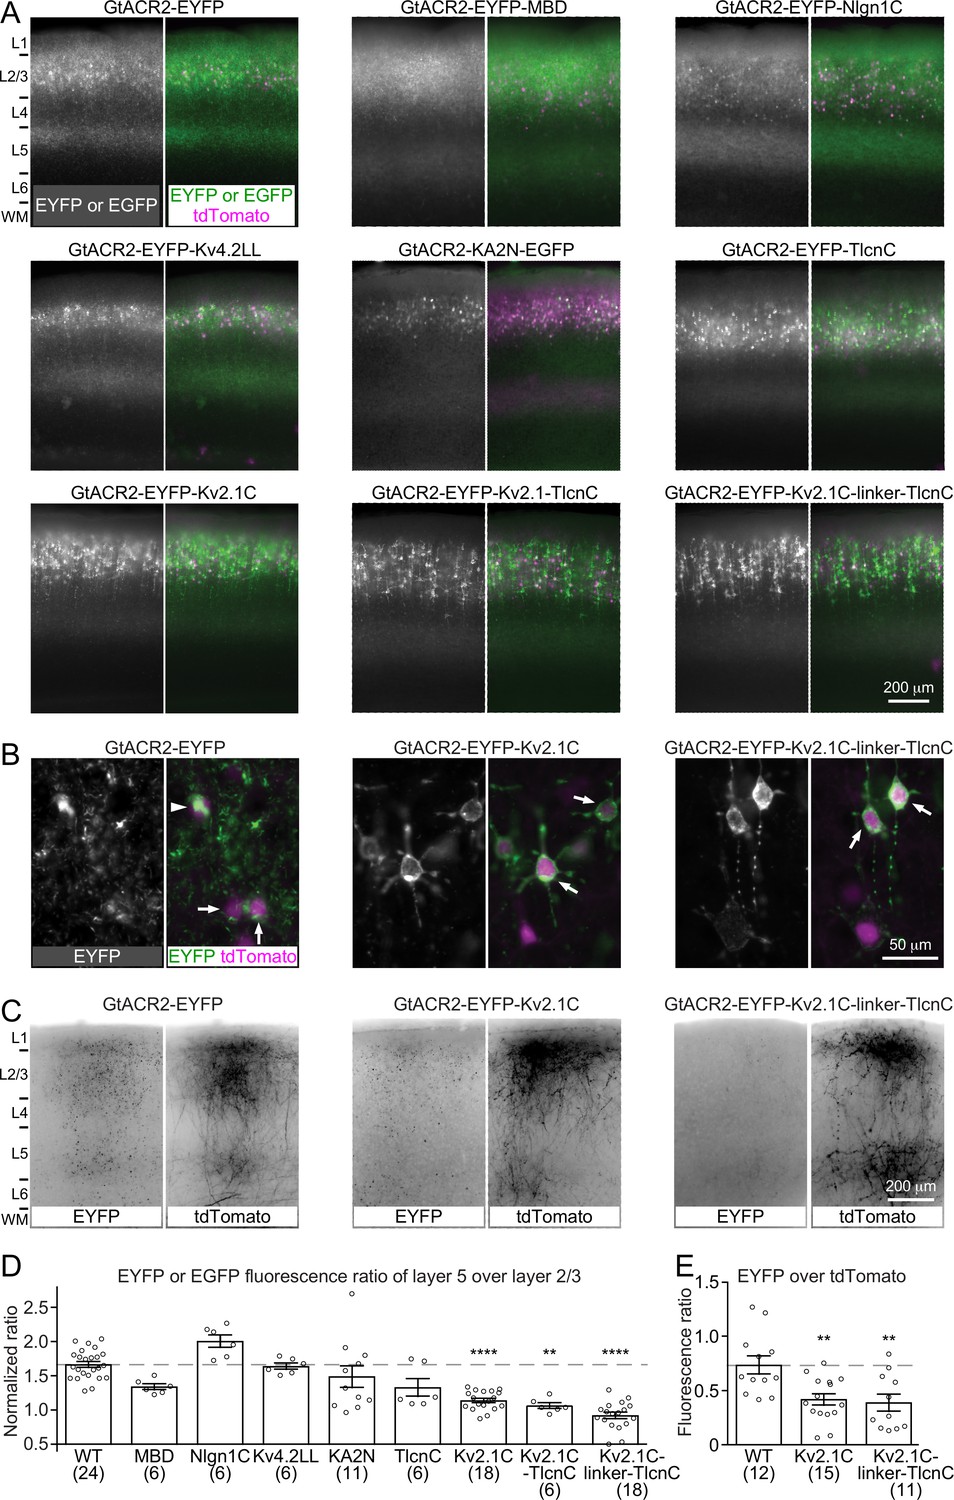
Targeting GtACR2 to neuronal somatodendritic domain.
(A) Wild type (WT) GtACR2 and its variants tagged with EYFP or EGFP were expressed along with tdTomato in a subset of layer 2/3 pyramidal neurons. Representative fluorescent images of the cortices showing the distribution of GtACR2. Note the strong EYFP fluorescence in layer 5 for WT GtACR2 and weak EYFP fluorescence in layer 5 for some somatodendritically targeted GtACR2 variants (e.g., Kv2.1C-linker-TlcnC). L, layer; WM, white matter. (B) Representative fluorescent images of electroporated neurons showing that GtACR2-EYFP-Kv2.1C and GtACR2-EYFP-Kv2.1C-linker-TlcnC were more concentrated on the membranes at the soma and proximal dendrites (arrows) than GtACR2-EYFP. Note the intracellular aggregation of GtACR2-EYFP (arrow head). (C) Representative fluorescent images of the contralateral hemisphere showing less GtACR2-EYFP-Kv2.1C and GtACR2-EYFP-Kv2.1C-linker-TlcnC in the callosal projections than GtACR2-EYFP. The callosal projections were labeled by tdTomato. (D) Summary data of the experiments in (A). The EYFP or EGFP fluorescence ratio between layer 5 and layer 2/3 was normalized by the tdTomato fluorescence ratio between layer 5 and layer 2/3. A reduction in the normalized EYFP or EGFP fluorescence ratio indicates a shift of the EYFP or EGFP distribution from the axon to somatodendritic domain. (E) Summary data of the experiments in (C). The ratio of EYFP fluorescence to tdTomato fluorescence of the callosal projections in the contralateral hemisphere. A reduction in the ratio indicates less EYFP in the callosal axons. The numbers of analyzed slices were indicated in the panels. The columns and error bars are mean ± s.e.m. **p<0.01, ****p<0.0001.
Figure 5 with 1 supplement
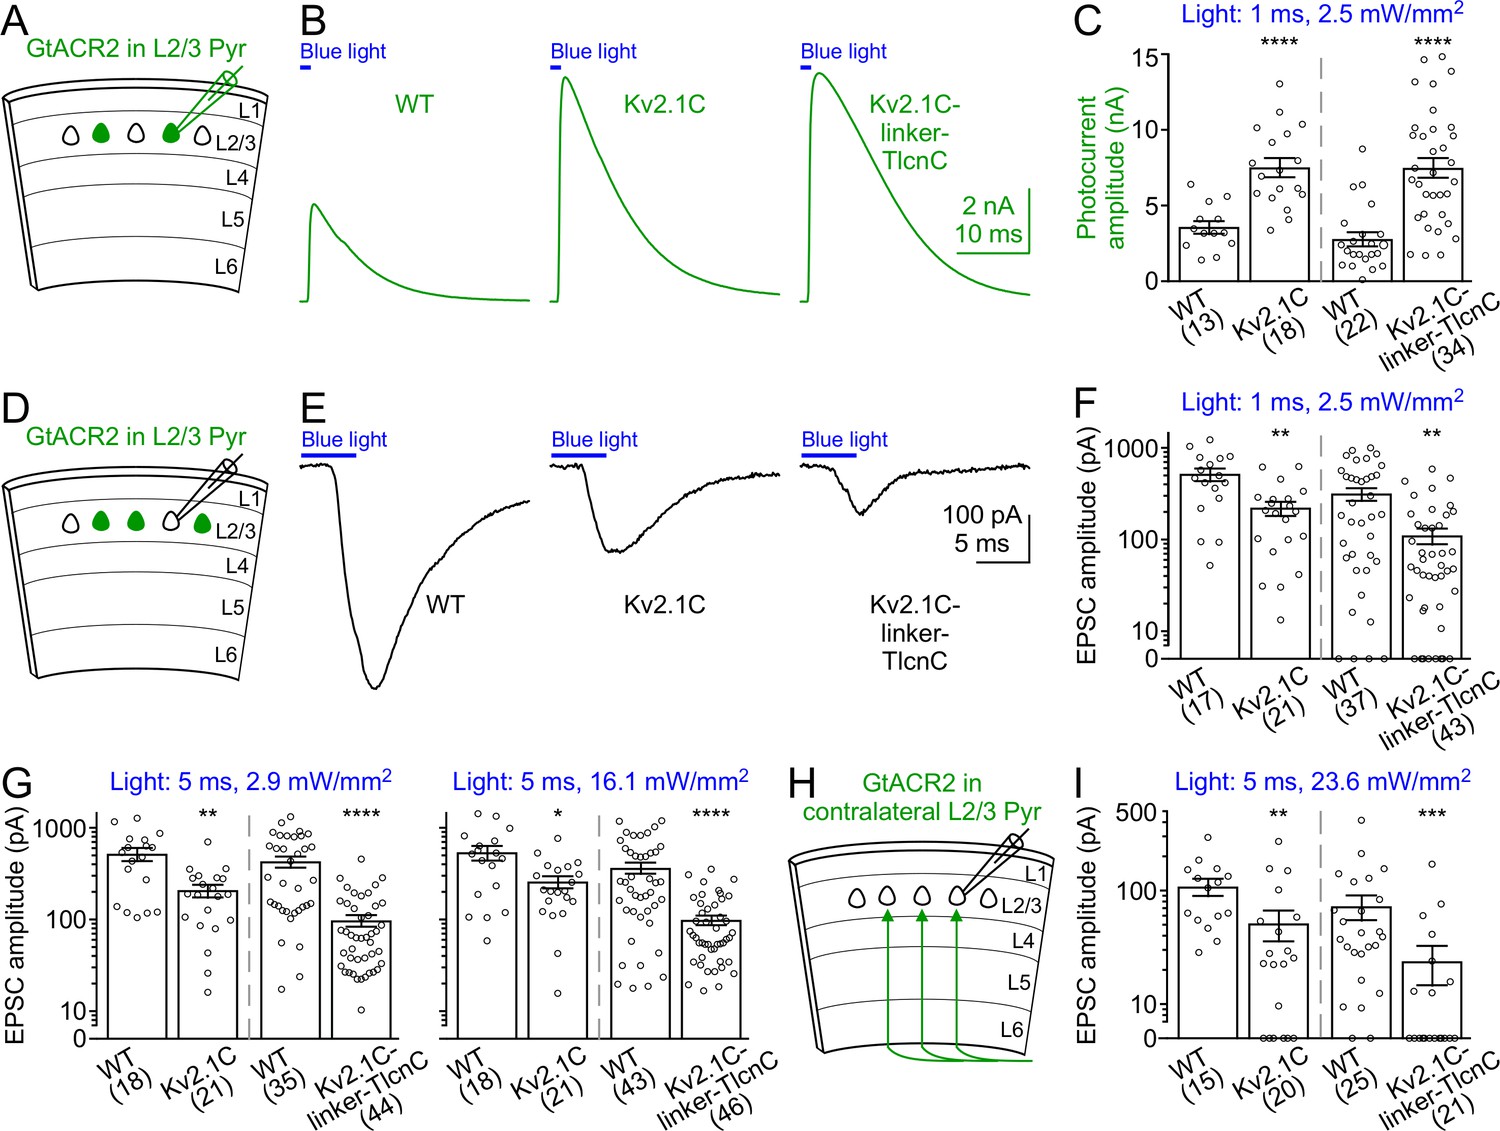
Activation of somatodendritically targeted GtACR2 variants generates larger photocurrents but causes less neurotransmitter release than wild type GtACR2.
(A) Schematic of slice experiments in (B,C). GtACR2-EYFP, GtACR2-EYFP-Kv2.1C, or GtACR2-EYFP-Kv2.1C-linker-TlcnC in a subset of layer 2/3 pyramidal neurons. (B) Somatic photocurrents recorded at the membrane potential of +10 mV from GtACR2-EYFP-, GtACR2-EYFP-Kv2.1C-, or GtACR2-EYFP-Kv2.1C-linker-TlcnC-expressing neurons in response to a blue light pulse of 1 ms and 2.5 mW/mm2. (C) Summary graph showing the photocurrent peak amplitudes in response to a blue light pulse of 1 ms and 2.5 mW/mm2. (D,E) As in (A,B), but for recording EPSCs in GtACR2– layer 2/3 pyramidal neurons in response to a blue light pulse of 5 ms and 2.9 mW/mm2. (F,G) Summary graphs showing the EPSC amplitudes in response to a blue light pulse of 1 ms and 2.5 mW/mm2 (F), 5 ms and 2.9 mW/mm2 (G, left panel), or 5 ms and 16.1 mW/mm2 (G, right panel). Note that at the stimulation strength of 1 ms and 2.5 mW/mm2 (F), EPSCs were not observed in a subset of neurons, particularly for GtACR2-EYFP-Kv2.1C-linker-TlcnC. (H) Schematic of slice experiments in (I). GtACR2-EYFP, GtACR2-EYFP-Kv2.1C, or GtACR2-EYFP-Kv2.1C-linker-TlcnC in a subset of layer 2/3 pyramidal neurons in the contralateral hemisphere. (I) Summary graphs showing the EPSC amplitudes of GtACR2– layer 2/3 pyramidal neurons in response to stimulating the callosal axons with a blue light pulse of 5 ms and 23.6 mW/mm2. The numbers of recorded neurons were indicated in the panels. The columns and error bars are mean ± s.e.m. *p<0.05, **p<0.01, ***p<0.001, ****p<0.0001.
Figure 5—figure supplement 1
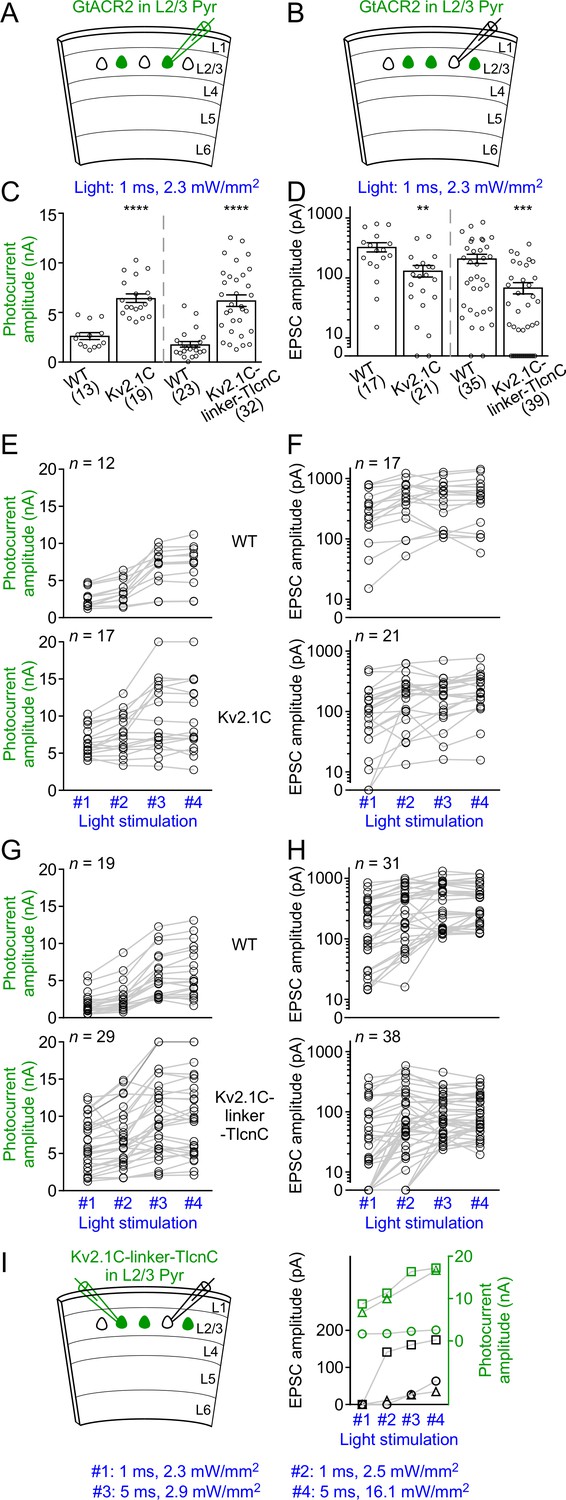
GtACR2-induced photocurrents and EPSCs at different strengths of blue light stimulation.
(A,B) Schematics of slice experiments in (C,E,G) and (D,F,H), respectively. GtACR2-EYFP, GtACR2-EYFP-Kv2.1C, or GtACR2-EYFP-Kv2.1C-linker-TlcnC in a subset of layer 2/3 pyramidal neurons. (C,D) Summary graph showing the photocurrent peak amplitudes (C) and EPSC amplitudes (D) in response to a blue light pulse of 1 ms and 2.3 mW/mm2. Note that at this stimulation strength, EPSCs were not observed in a subset of neurons, particularly for GtACR2-EYFP-Kv2.1C-linker-TlcnC. (E,F) Summary graph showing that in a subset of experiments for WT GtACR2-EYFP (top panels) and GtACR2-EYFP-Kv2.1C (bottom panels), photocurrents (E) or EPSCs (F) were recorded in response to all four different strengths of stimulation (#1: 1 ms and 2.3 mW/mm2, #2: 1 ms and 2.5 mW/mm2, #3: 5 ms and 2.9 mW/mm2, and #4: 5 ms and 16.1 mW/mm2). (G,H) As in (E,F), but for WT GtACR2-EYFP (top panels) and GtACR2-EYFP-Kv2.1C-linker-TlcnC (bottom panels). Note that for GtACR2-EYFP-Kv2.1C-linker-TlcnC, EPSCs were absent in 13 out of 38 GtACR2– neurons when the stimulation strength decreased to 1 ms and 2.3 mW/mm2, whereas photocurrents were still observed in all recorded GtACR2+ neurons at this stimulation strength. (I) Left, schematic of slice experiments. GtACR2-EYFP-Kv2.1C-linker-TlcnC in a subset of layer 2/3 pyramidal neurons. EPSCs and photocurrents were simultaneously recorded from a GtACR2– neuron and a GtACR2+ neuron, respectively. Right, in 3 experiments where the EPSCs in GtACR2– neurons were absent when the stimulation strength decreased to 1 ms and 2.3 mW/mm2 or 2.5 mW/mm2, the photocurrent peak amplitudes and EPSC amplitudes from these pairs of GtACR2+ and GtACR2– neurons were plotted as a function of light stimulation strength. Each shape of the symbols represents one pair of neurons. Note that GtACR2+ neurons still showed robust photocurrents when the EPSCs in GtACR2– neurons reduced to zero.
Tables
Table 1
Amino acid sequences of somatodendritic targeting motifs.
Black bold, amino acid sequences of somatodendritic targeting motifs; blue, GtACR2; red, EYFP or EGFP; purple, linker.
| Motif | Sequence |
|---|---|
| MBD | ---RDQPLNSKKKKRLLSFRDVDFEEDSD |
| Nlgn1C | --VVLRTACPPDYTLAMRRSPDDIPLMTPNTITM |
| Kv4.2LL | --FETQHHHLLHCLEKTT |
| KA2N | --MPAELLLLLIVAFANPSCQVLSSLRMAAILDDQ TVCGRGERLALALAREQINGIIEVPAKARVEVDIFELQRDSQYETTDTMCQIL PKGVVSVLGPSSSPASASTVSHICGEKEIPHIKVGPEETPRLQYLRFASVSLYPS NEDVSLAVS-- |
| TlcnC | --AESPADGEVFAIQLTSS |
| Kv2.1C | --QSQPILNTKEMAPQSKPPEELEMSSMPSPVAPLPARTEGVID MRSMSSIDSFISCATDFPEATRF |
| Kv2.1C-TlcnC | --QSQPILNTKEMAPQSKPPEELEMSSMPSPVAPLPARTEGVID MRSMSSIDSFISCATDFPEATRF-AESPADGEVFAIQLTSS |
| Kv2.1C-linker-TlcnC | --QSQPILNTKEMAPQSKPPEELEMSSMPSPVAPLPARTEGVID MRSMSSIDSFISCATDFPEATRF--AESPADGEVFAIQLTSS |
Key resources table
| Reagent type (species) or resource | Designation | Source or reference | Identifiers | Additional information |
|---|---|---|---|---|
| Strain, strain background (M. musculus) | Pvalb-2A-Flpo | Jackson Laboratory | RRID:IMSR_JAX:022730 | |
| Strain, strain background (M. musculus) | Pvalb-2A-Cre | Jackson Laboratory | RRID:IMSR_JAX:012358 | |
| Recombinant DNA reagent (plasmid) | GtACR2 | Govorunova et al., 2015 | Addgene:67877 | pLenti-UbiC- GtACR2-EYFP; obtained from Dr. John Spudich |
| Recombinant DNA reagent (plasmid) | GtACR1 | Govorunova et al., 2015 | Addgene:67795 | pLenti-UbiC- GtACR1-EYFP; obtained from Dr. John Spudich |
| Recombinant DNA reagent (plasmid) | iC++ | Berndt et al., 2016 | pAAV-CaMKIIα-i C++-TS-EYFP or pAAV-EF1α-DIO-iC++ -TS-EYFP; obtained from Dr. Karl Deisseroth | |
| Recombinant DNA reagent (plasmid) | Flpo | Xue et al. (2014) | Addgene:60662 | pCAG-Flpo |
| Recombinant DNA reagent (plasmid) | ChR2 | this paper | Addgene:114367 | pCAG-hChR2(H134R) -EYFP |
| Recombinant DNA reagent (plasmid) | Flpo-dependent GtACR2 | this paper | Addgene:114369 | pAAV-EF1α-FRT-FLEX -GtACR2-EYFP |
| Recombinant DNA reagent (plasmid) | Flpo-dependent GtACR1 | this paper | Addgene:114370 | pAAV-EF1α-FRT-FLEX -GtACR1-EYFP |
| Recombinant DNA reagent (plasmid) | GtACR2-EYFP-Kv2.1C | this paper | Addgene:114375 | pAAV-EF1α-FRT- FLEX-GtACR2- EYFP-Kv2.1C |
| Recombinant DNA reagent (plasmid) | GtACR2-EYFP- Kv2.1C-linker-TlcnC | this paper | Addgene:114377 | pAAV-EF1α-FRT- FLEX-GtACR2-EYFP- Kv2.1C-linker-TlcnC |
| Transfected construct (adeno- associated virus) | Flpo | Xue et al. (2014); Penn Vector Core | Addgene:60663 | AAV9-hSyn-Flpo |
| Transfected construct (adeno -associated virus) | Flpo-dependent GtACR2; GtACR2 | This paper; Baylor College of Medicine Gene Vector Core | Addgene:114369 | AAV9-EF1α- FRT-FLEX -GtACR2-EYFP |
| Transfected construct (adeno- associated virus) | ReaChR | This paper; Baylor College of Medicine Gene Vector Core | Addgene:114368 | AAV9-EF1α- DIO-ReaChR-P2A-dTomato |
| Transfected construct (adeno- associated virus) | iC++ | This paper; Baylor College of Medicine Gene Vector Core | AAV9-EF1α-DIO- iC++-TS-EYFP; plasmid obtained from Dr. Karl Deisseroth | |
| Transfected construct (adeno-associated virus) | iChloC | This paper; Baylor College of Medicine Gene Vector Core | AAV9-EF1α-DIO- iChloC-T2A-mCherry; plasmid obtained from Drs. Matthew Caudill and Massimo Scanziani | |
| Chemical compound, drug | Bumetanide (Ro 10–6338) | Santa Cruz Biotechnology | Santa Cruz:sc-200727 | 50 or 100 µM |
Additional files
-
Supplementary file 1
Statistical Reporting Table.
The statistical tests, numbers of replicates and mice, and P values were reported for all figures and experiments.
- https://doi.org/10.7554/eLife.38506.017
-
Transparent reporting form
- https://doi.org/10.7554/eLife.38506.018
Download links
A two-part list of links to download the article, or parts of the article, in various formats.
Downloads (link to download the article as PDF)
Open citations (links to open the citations from this article in various online reference manager services)
Cite this article (links to download the citations from this article in formats compatible with various reference manager tools)
Targeting light-gated chloride channels to neuronal somatodendritic domain reduces their excitatory effect in the axon
eLife 7:e38506.
https://doi.org/10.7554/eLife.38506


