Condensin controls cellular RNA levels through the accurate segregation of chromosomes instead of directly regulating transcription
- CNRS Laboratory of Biology and Modelling of the Cell, France
- Université de Lyon, ENSL, UCBL, France
- MRC London Institute of Medical Sciences, United Kingdom
- Imperial College London, United Kingdom
- Structural and Computational Biology Unit, European Molecular Biology Laboratory, Germany
- European Molecular Biology Laboratory, Germany
Figures
Figure 1 with 1 supplement
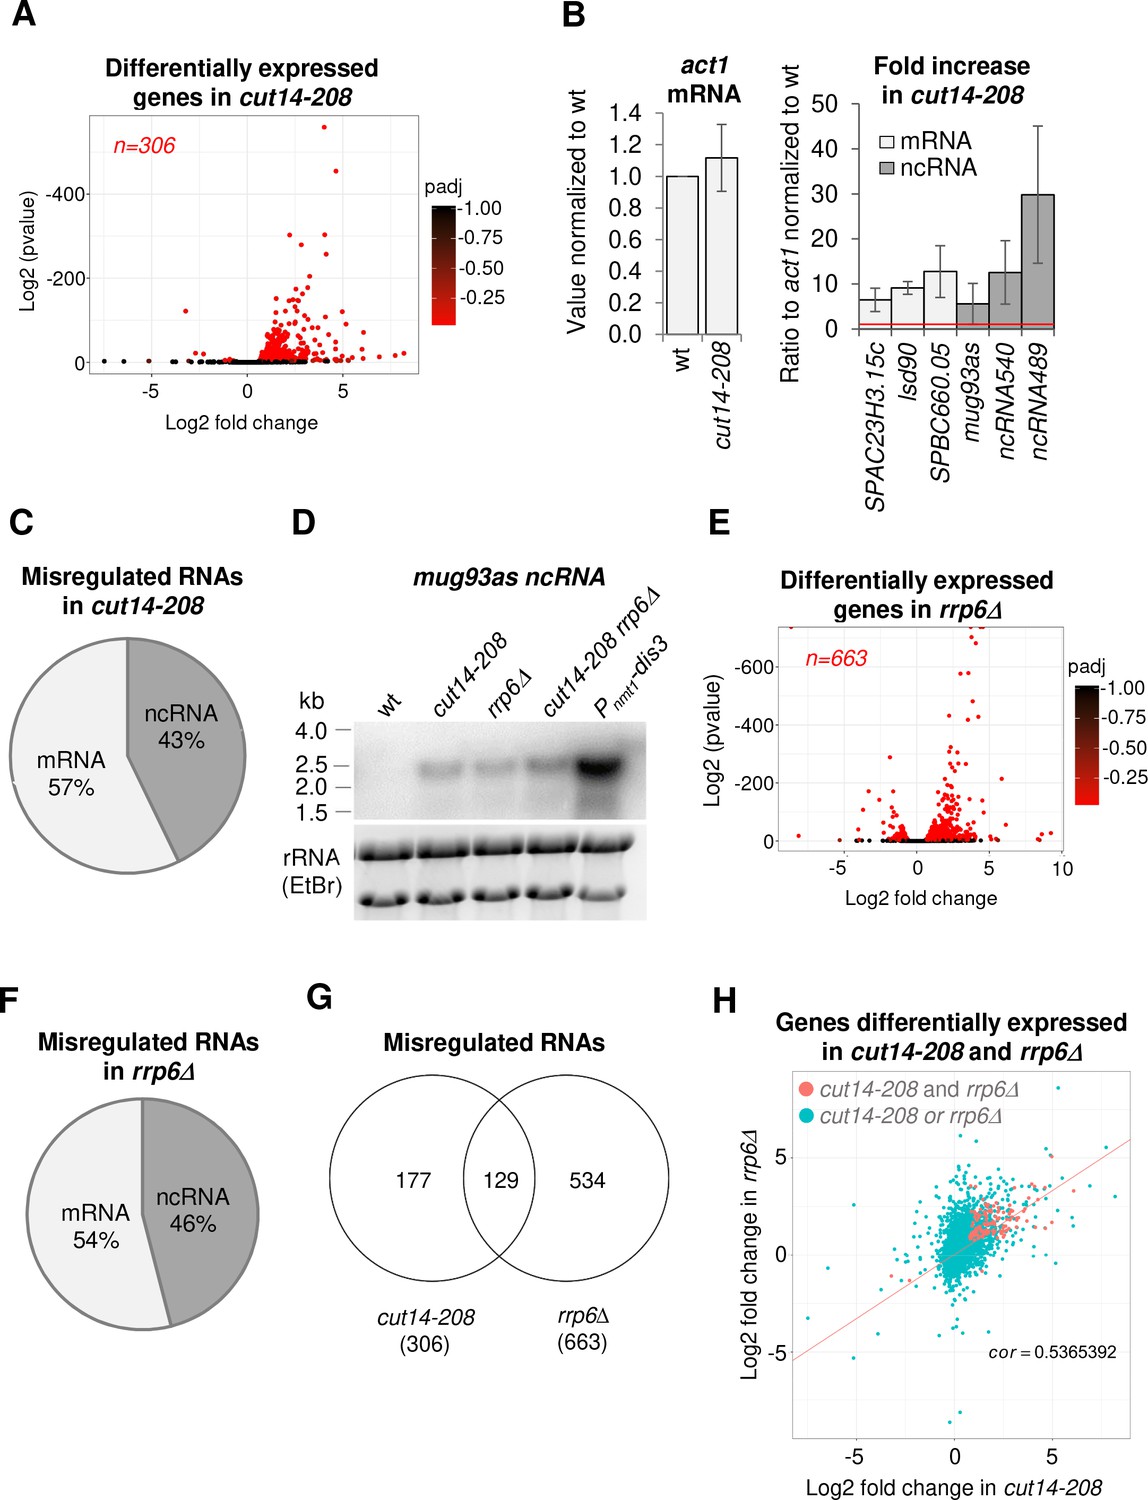
The condensin loss-of-function mutant cut14-208 accumulates RNA-exosome-sensitive transcripts.
(A) Volcano plot of RNA levels measured by strand-specific RNA-seq in the cut14-208 condensin mutant after 1 cell doubling at 36°C, from biological triplicates. Genes exhibiting a log2 fold change superior to 0.5 or inferior to −0.5 with an adjusted P-value (padj) ≤ 0.05 are indicated in red. (B) RT-qPCR validation. Total RNA from cells grown at 36°C for 2.5 hr was reverse-transcribed in the presence or absence of Reverse Transcriptase (RT) and cDNAs were quantified by qPCR. Shown are the averages and standard deviations (SDs) measured from three biological replicates. (C) Misregulated RNA in cut14-208. (D) Northern blot analysis of the non-coding RNA mug93as. Cells were shifted at 36°C for 1 cell doubling and total RNA probed for mug93as level. Ribosomal RNA (rRNA) stained with ethidium bromide (EtBr) was used as loading control. (E) Volcano plot of RNA levels measured by RNA-seq from biological triplicates of the rrp6Δ mutant after 1 cell doubling at 36°C. Genes exhibiting a log2 fold change superior to 0.5 or inferior to −0.5 with an adjusted P-value (padj) ≤ 0.05 are indicated in red. (F) Misregulated RNA in rrp6Δ.( G) Genes misregulated in cut14-208 and rrp6Δ. (H) Comparison plots between the transcriptomes of cut14-208 and rrp6Δ. Genes differentially expressed in both mutants are highlighted in red. The correlation coefficient has been calculated for all genes.
Figure 1—figure supplement 1
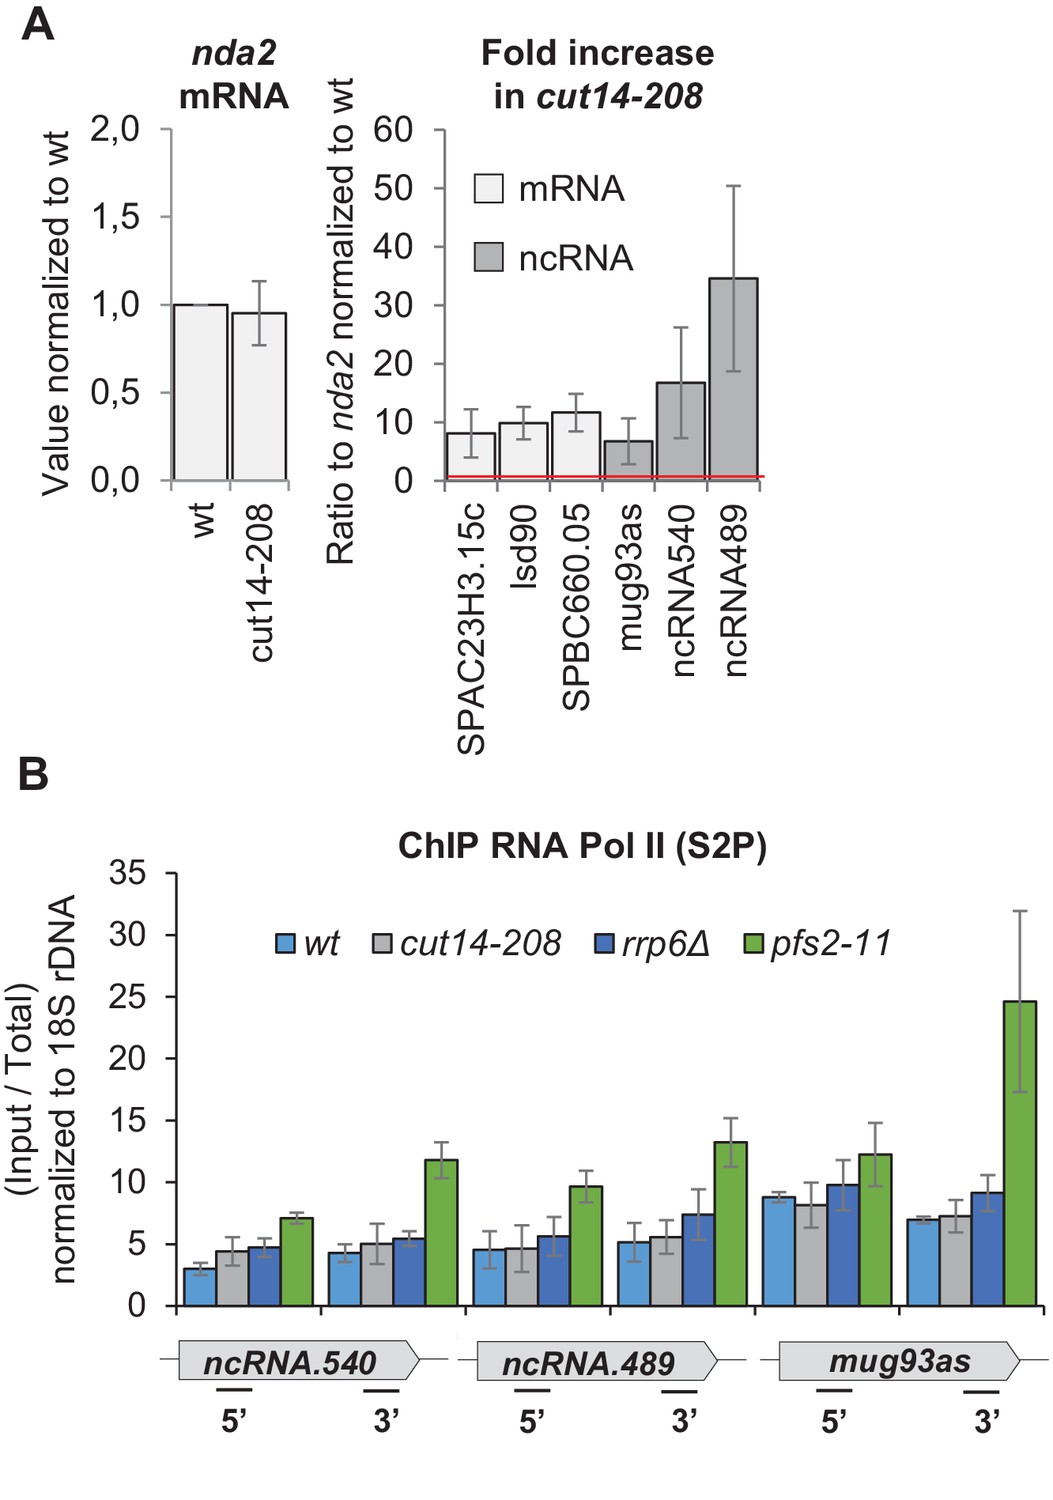
The condensin loss-of-function mutant cut14-208 accumulates exosome-sensitive transcripts.
(A) RT-qPCR validation of up-regulated RNA in cut14-208 mutant cells. Total RNA extracted from wild-type and cut14-208 cycling cells grown for 2.5 hr at the restrictive temperature of 36°C was reverse-transcribed in the presence or absence of RT and the cDNA quantified by qPCR. Shown are averages ± SDs measured from n = 3 biological replicates. (B) Pol II occupancy measured by ChIP. Cells of indicated genotypes were grown at the restrictive temperature of 36°C for 2.5 hr and processed for ChIP against RNA Pol II phosphorylated on serine 2 of the CTD (S2P). The transcription termination mutant pfs2-11 was used as a control for Pol II accumulation in the 3’ ends of genes (Wang et al., 2005). Shown are averages ± SDs calculates from 6 ChIPs performed on biological triplicates.
Figure 2 with 2 supplements
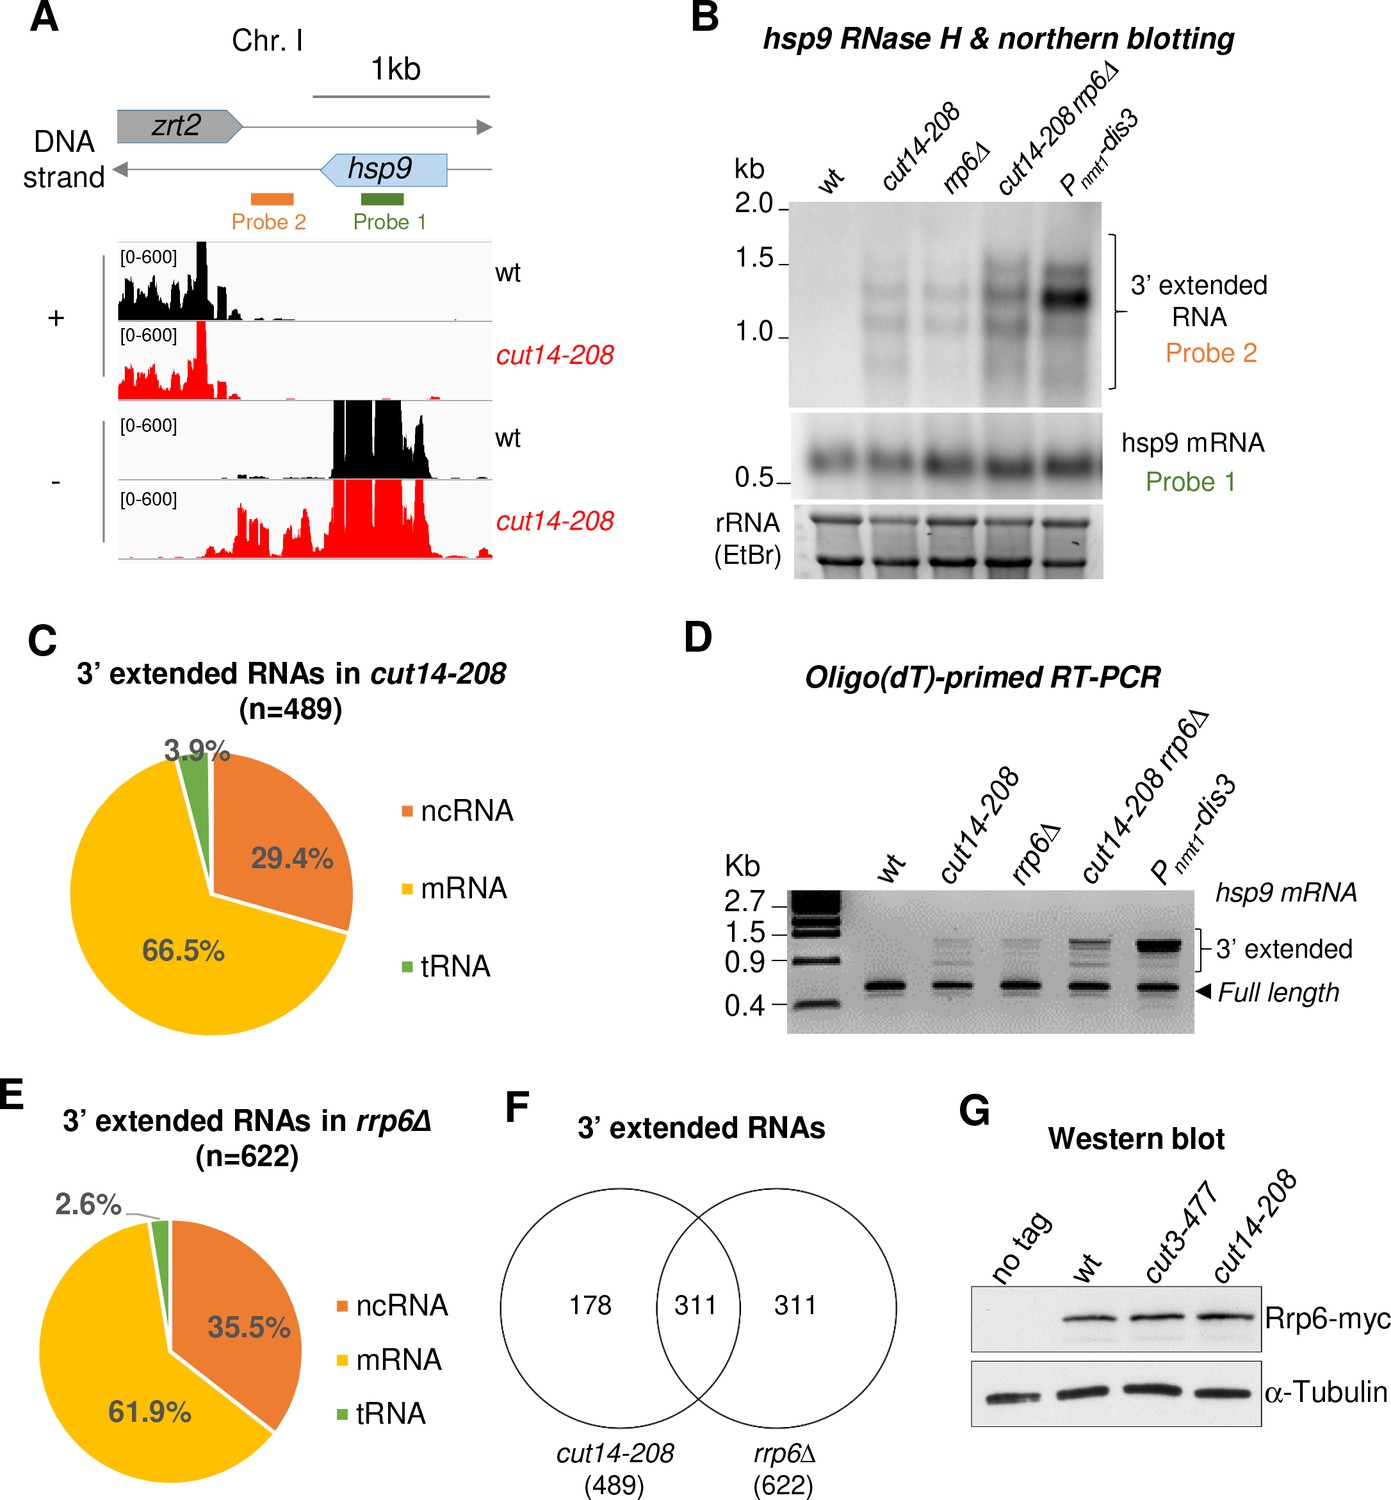
The condensin loss-of-function mutant cut14-208 accumulates 3’-extended read-through transcripts.
(A) 3’-extended hsp9 read-through RNA detected by strand-specific RNA-seq in cut14-208. (B) Read-through hsp9 RNA detected by RNase H digestion and northern blotting. Total RNA from indicated strains grown at 36°C was digested by RNase H in the presence of a DNA oligonucleotide complementary to the 5’end of hsp9 mRNA. Cleaved products were revealed by a probe hybridizing downstream the transcription termination site of hsp9 (see probe2 in A), or within the coding sequence (probe 1, shown in A). rDNA stained with EtBr served as loading control. (C) 3’-extended read-through RNAs in cut14-208. (D) Polyadenylated RNAs detected by oligo(dT)-primed RT-PCR. Cells were grown at 36°C for 2.5 hr in PMG supplemented with 60 µM thiamine to repress nmt1-dis3. Total RNA was reverse transcribed using oligo(dT) primers in the presence or absence of RT. cDNA were amplified by 25 cycles of PCR using oligo(dT) and gene specific primers. Minus RT reactions produced no signal. (E) 3’-extended read-through RNAs in rrp6Δ. (F) Overlap between the sets of read-through RNAs in cut14-208 and rrp6Δ. (G) Steady state level of Rrp6. Indicated strains were grown at 36°C for 2.5 hr, total proteins were extracted and probed with an anti-myc antibody. Alpha-tubulin served as loading control.
Figure 2—figure supplement 1
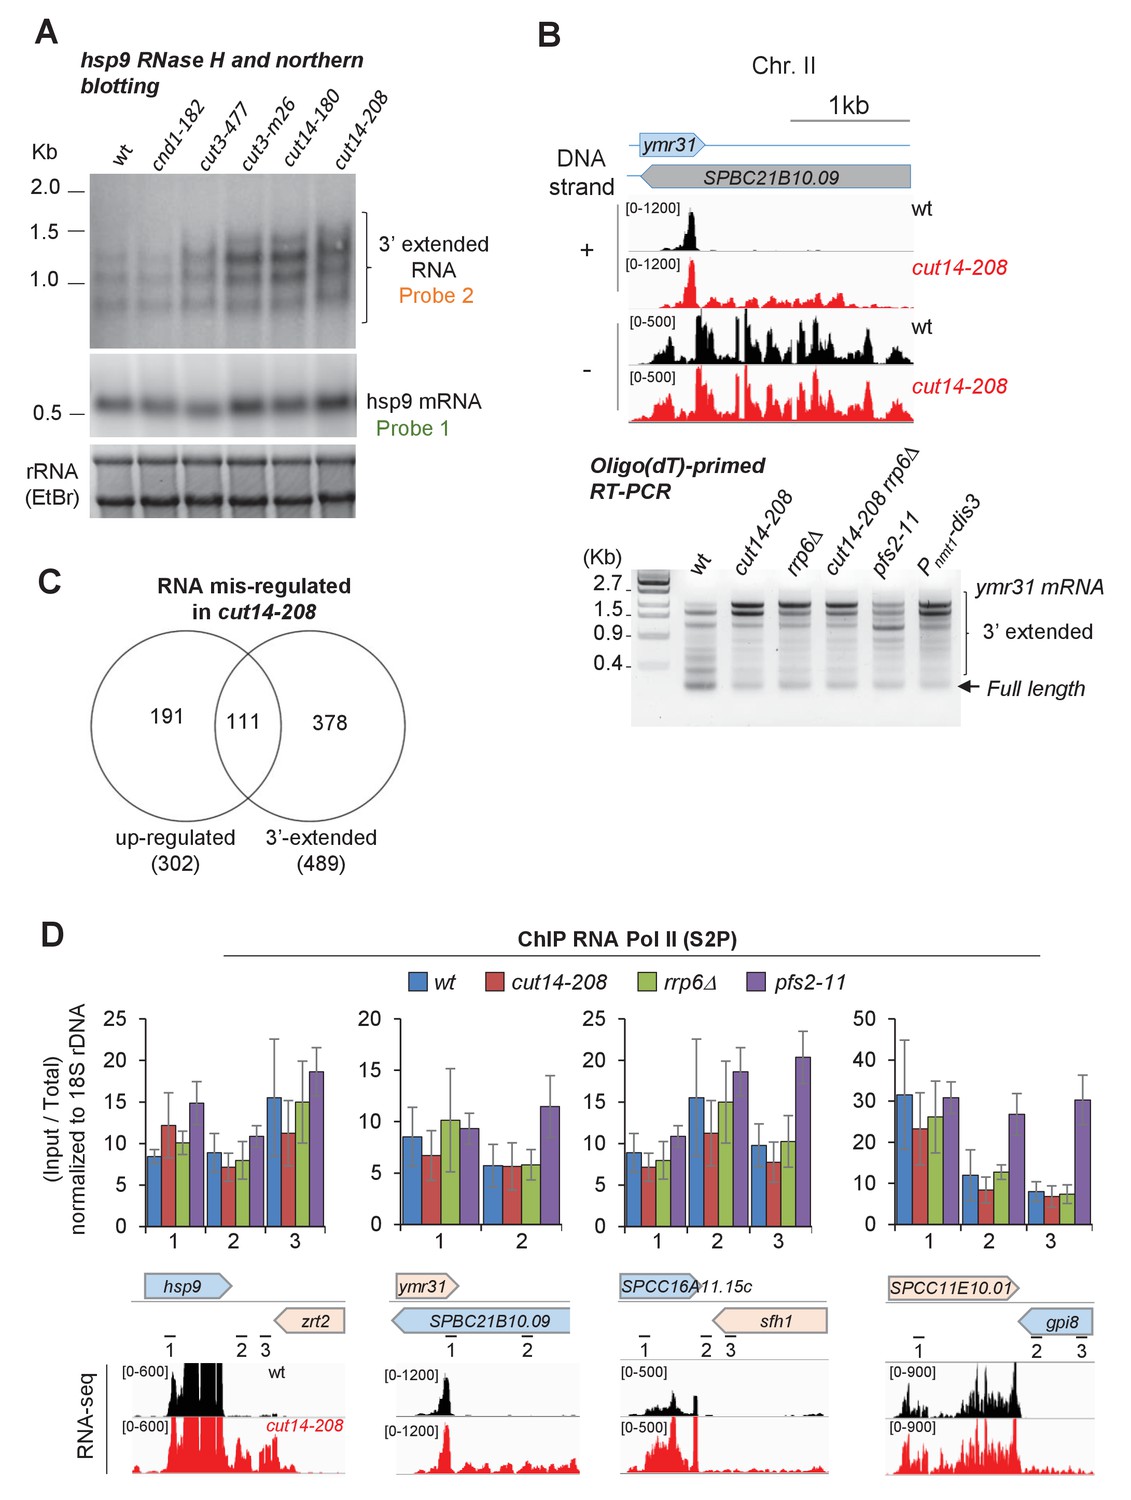
The condensin loss-of-function mutant cut14-208 accumulates 3’-extended read-through transcripts.
(A) 3’-extended hsp9 RNA detected by RNase H digestion and northern blotting in condensin mutant cells. Indicated strains were grown at 36°C for 2.5 hr. Total RNA was digested by RNase H in the presence of a DNA oligonucleotide complementary to the 5’end of hsp9 mRNA. Cleaved products were revealed by a probe hybridizing downstream of the transcription termination site of hsp9 (probe two in Figure 2A), or within the coding sequence (probe one in Figure 2A). rDNA stained with EtBr served as loading control. (B) Polyadenylated RNAs detected by oligo(dT)-primed RT-PCR. Cells were grown at 36°C for 2.5 hr in PMG supplemented with 20 µM thiamine to repress nmt1-dis3. Total RNA was reverse transcribed using oligo(dT) primers in the presence or absence of RT. cDNA were amplified by 25 cycles of PCR using oligo(dT) and gene-specific primers. PCR products were separated on an agarose gel and stained with EtBr. Minus RT reactions produced no signal. (C) Venn diagram showing the overlap between the two sets of increased RNAs and read-through RNAs in cut14-208. (D) Pol II occupancy measured by ChIP. Cells of indicated genotypes were grown at the restrictive temperature of 36°C for 2.5 hr and processed for ChIP against RNA Pol II phosphorylated on serine 2 of the CTD (S2P). Shown are averages ± SDs calculates from 6 ChIPs performed on biological triplicates. The positions of primers used for qPCR and the RNA-seq profiles are indicated.
Figure 2—figure supplement 2
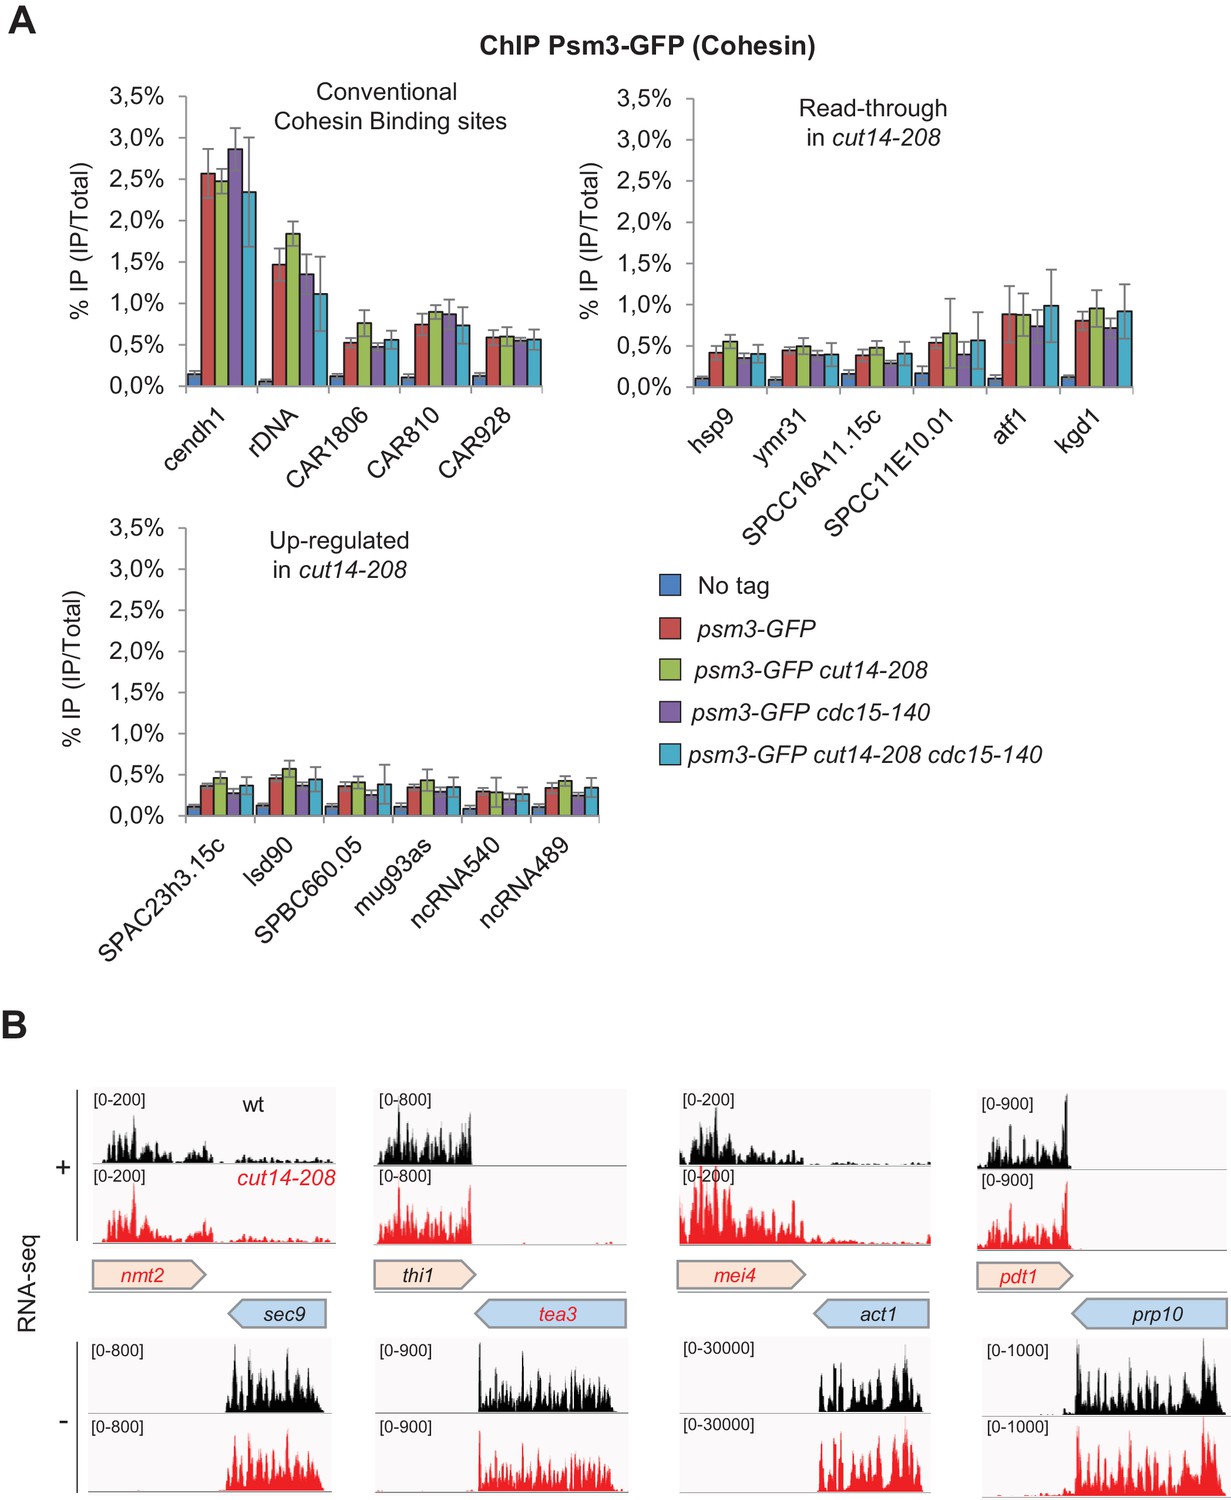
The condensin loss-of-function mutant cut14-208 accumulates 3’-extended read-through transcripts.
(A) Cohesin localisation in cut14-208 condensin mutant cells. Indicated cells were grown at 36°C for 2.5 hr and processed for ChIP against the Psm3 subunit of cohesin tagged with GFP. Psm3-GFP occupancy was assessed at known, conventional cohesin binding sites (Feytout et al., 2011; Schmidt et al., 2009), and at genes showing either read-through transcripts or up-regulate RNAs, in cut14-208 cells. Show are averages ± SDs calculates from 6 ChIPs performed on biological triplicates. (B) Representative strand-specific RNA-seq profiles of the co-transcribed convergent gene pairs nmt2-sec9, tea3-thi1, mei4-act1 and pdt1-prp10 in cut14-208 mutant cells compared to wt. DNA strands (+or -) are indicated.
Figure 3
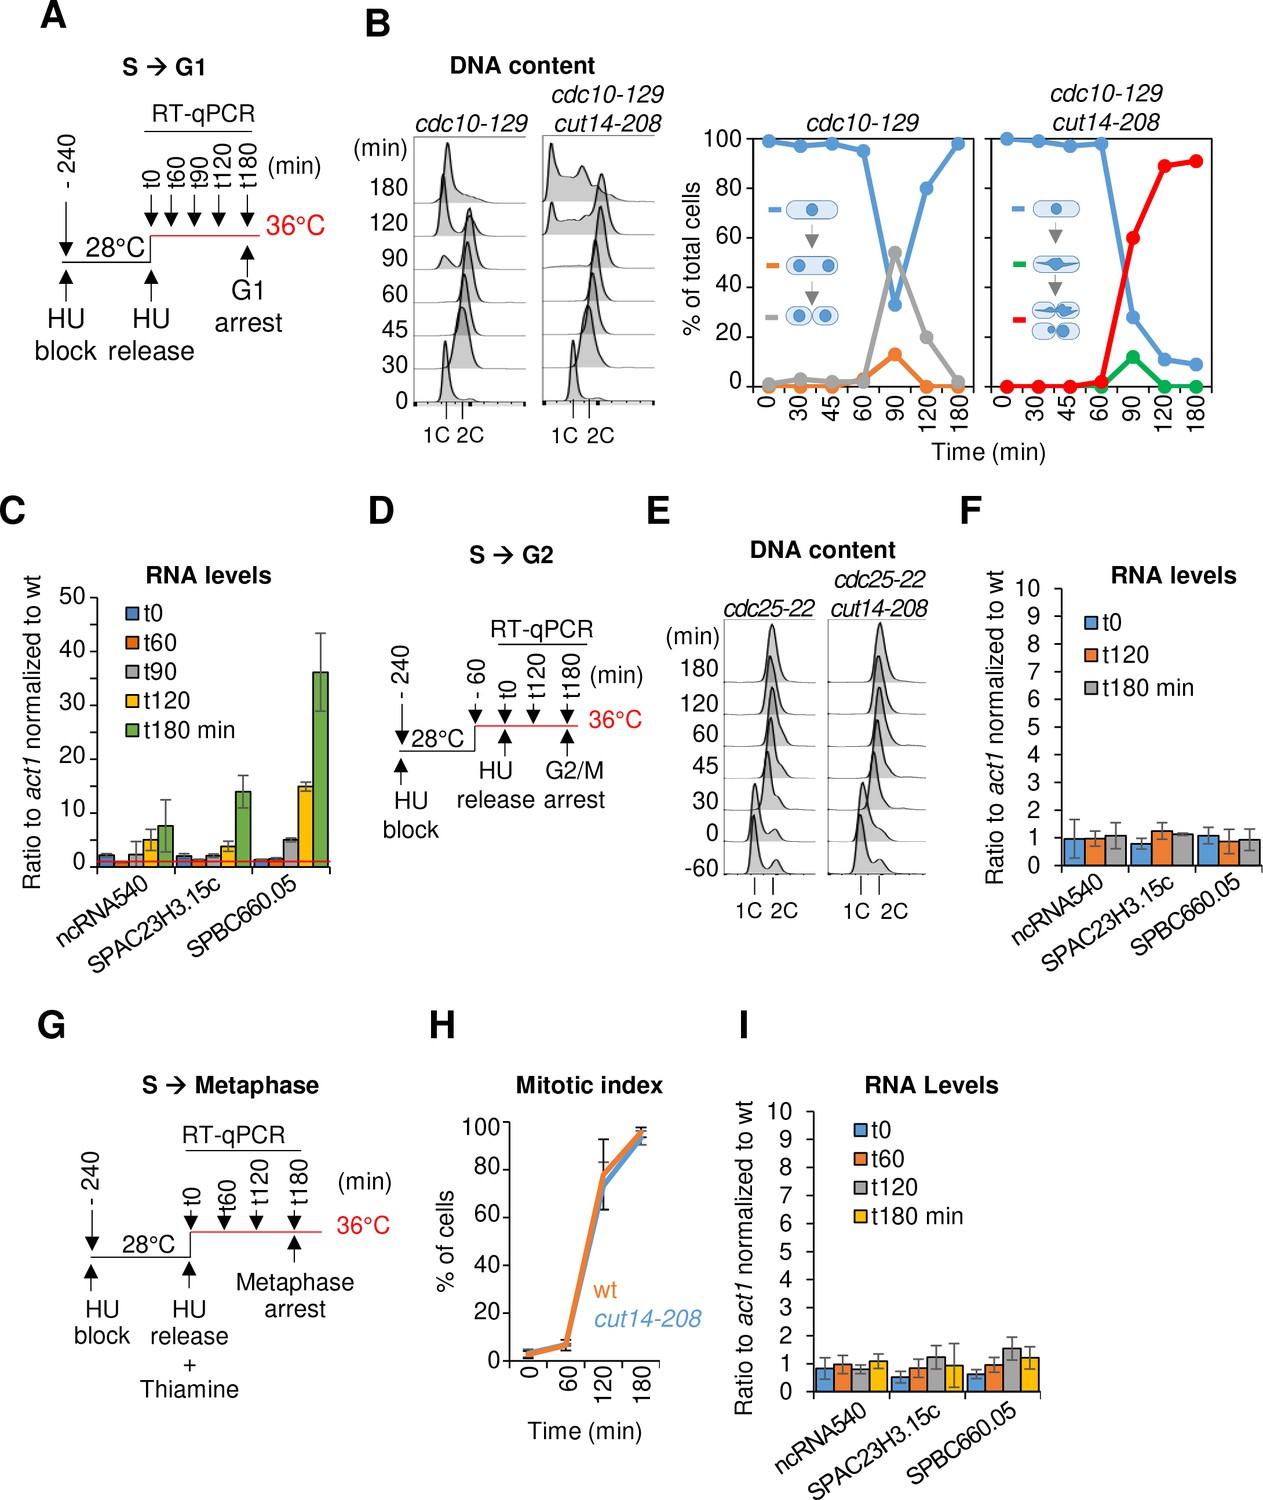
The function of condensin is dispensable for gene regulation during S and G2 phases of the cell cycle in fission yeast.
(A–C) Gene expression was assessed in synchronized cut14-208 cells progressing from early S phase to G1 phase at the restrictive temperature. (A) Scheme of the experiment.(B) Left panel: FACScan analyses. Right panels: chromosome segregation and cytokinesis assessed by staining DNA with DAPI and the septum with calcofluor (n >= 100). (C) Total RNA extracted from cdc10-129 and cdc10-129 cut14-208 cells shown in (B), was reverse-transcribed in the presence or absence of RT and cDNA quantified by qPCR. Red line = 1. Shown are averages ± SDs measured from biological triplicates. (D–F) Gene expression was assessed in synchronized cut14-208 cells progressing from early S phase to late G2 phase at the restrictive temperature. (D) Scheme of the experiment. (E). FACScan analyses. (F) Total RNA extracted from cdc25-22 and cdc25-22 cut14-208 cells shown in (E) was reverse-transcribed in the presence or absence of RT and cDNA quantified by qPCR. Shown are averages ± SDs measured from biological triplicates. (G–I) Gene expression was assessed in synchronized cut14-208 cells progressing from early S phase to metaphase at the restrictive temperature. (G) Scheme of the experiment. Thiamine repressed the nmt41-slp1 gene in order to arrest cells in metaphase. (H) Percentages of mononucleate, mitotic cells from n = 3 experiments. (I) Total RNA extracted from nmt41-slp1 and nmt41-slp1 cut14-208 cells shown in (H) was reverse-transcribed in the presence or absence of RT and cDNA quantified by qPCR. Shown are averages ± SDs measured from biological triplicates.
Figure 4 with 1 supplement
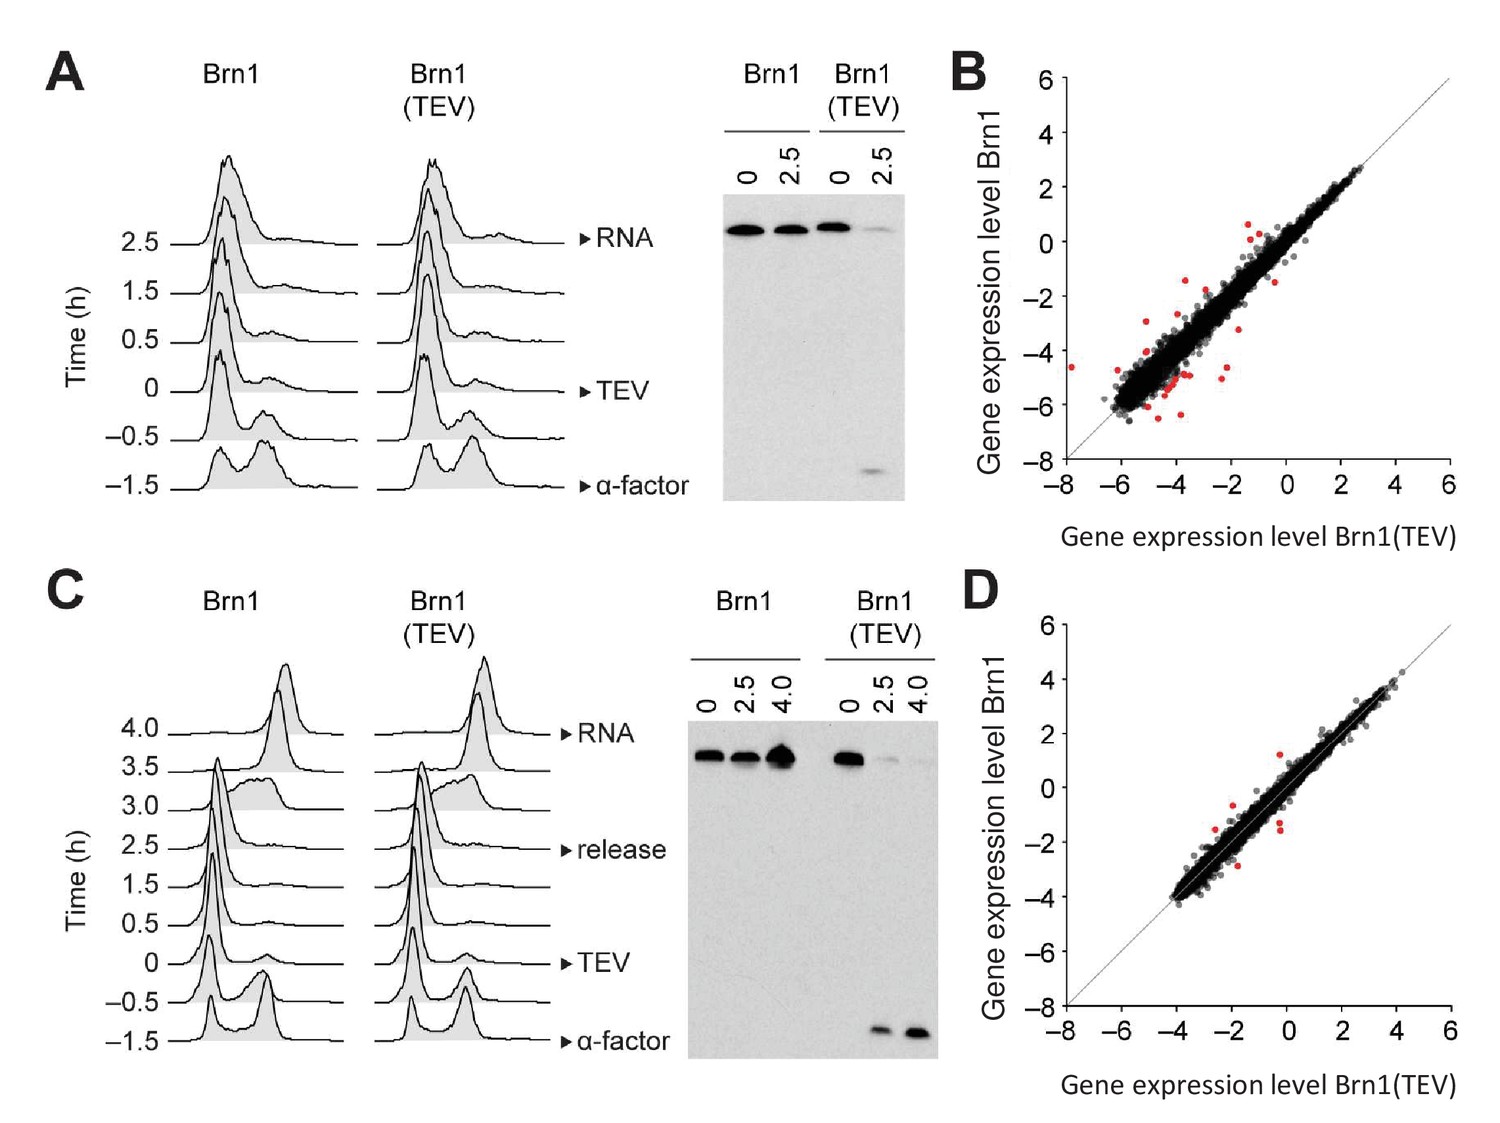
Condensin release from chromosomes has no major effects on G1 or M phase gene expression programs in budding yeast.
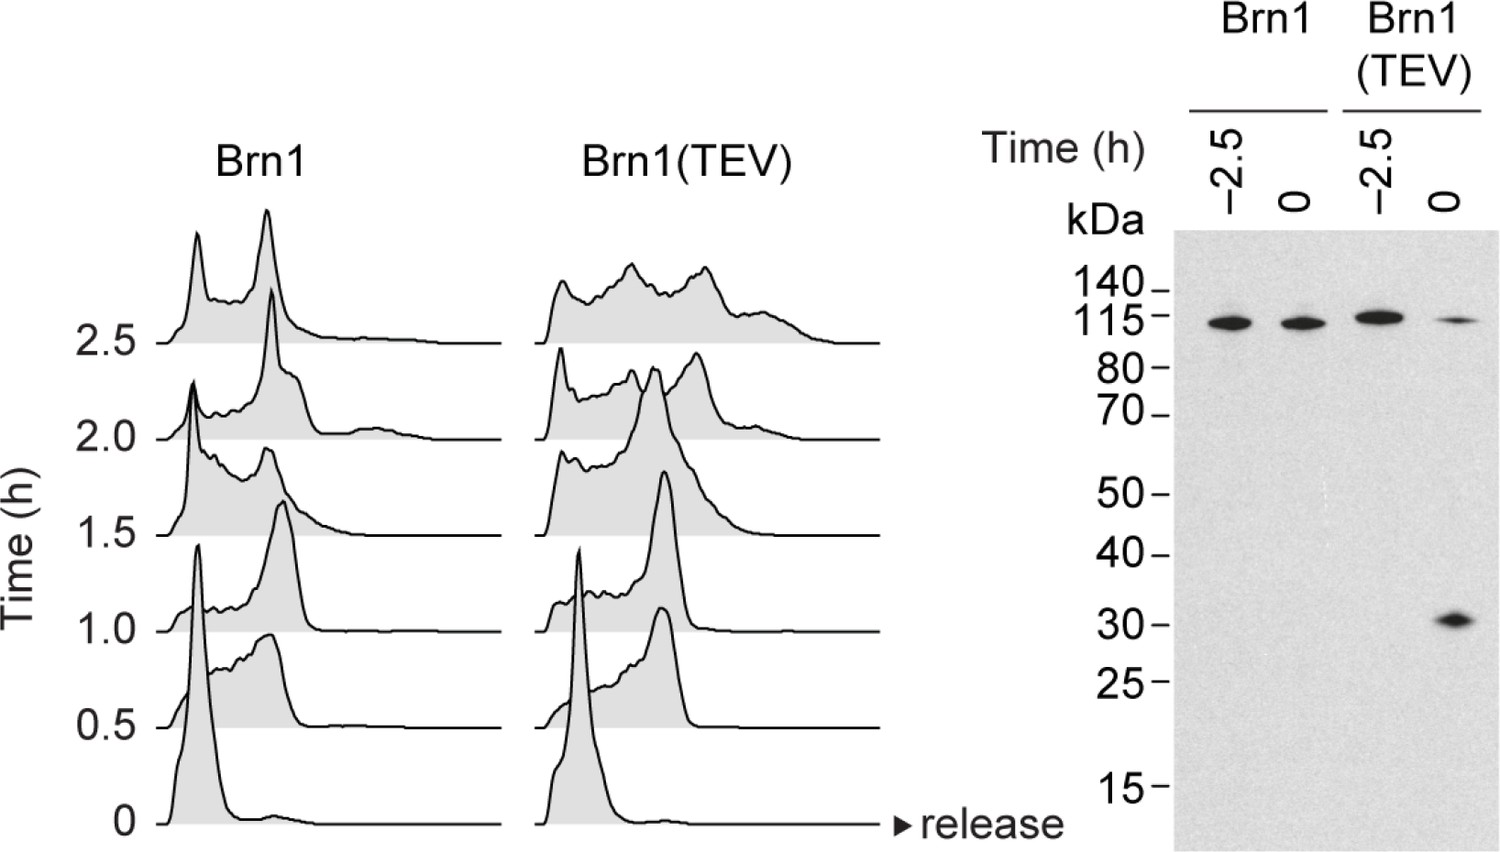
(A) TEV protease expression was induced in cells synchronized in G1 phase by α-factor (strains C3138 and C3139). 2.5 hr after TEV induction, RNA was extracted, cDNA synthesized, labelled and hybridized to tiling arrays. Cell cycle synchronization was scored by FACScan analysis of cellular DNA content and Brn1 cleavage was monitored by western blotting against the C-terminal HA6 tag. (B) Scatter plot of gene expression values of cells from (A) with cleaved or intact Brn1 (mean values of n = 3 biological replicates). Red color highlights two-fold or more up- or downregulated transcripts. (C) TEV protease expression was induced in cells synchronized in G1 phase by α-factor (strains C2335 and C2455). Cells were release into nocodazole 2.5 hr after TEV induction and RNA was extracted 1.5 hr later, cDNA synthesized, labelled and hybridized on tiling arrays. Cell cycle synchronization and Brn1 cleavage was monitored as in A. (D) Scatter plot of gene expression values of cells from (C) with cleaved or intact Brn1 (mean valued of n = 2 biological replicates). Red color highlights two-fold or more up- or downregulated transcripts.
Figure 4—figure supplement 1
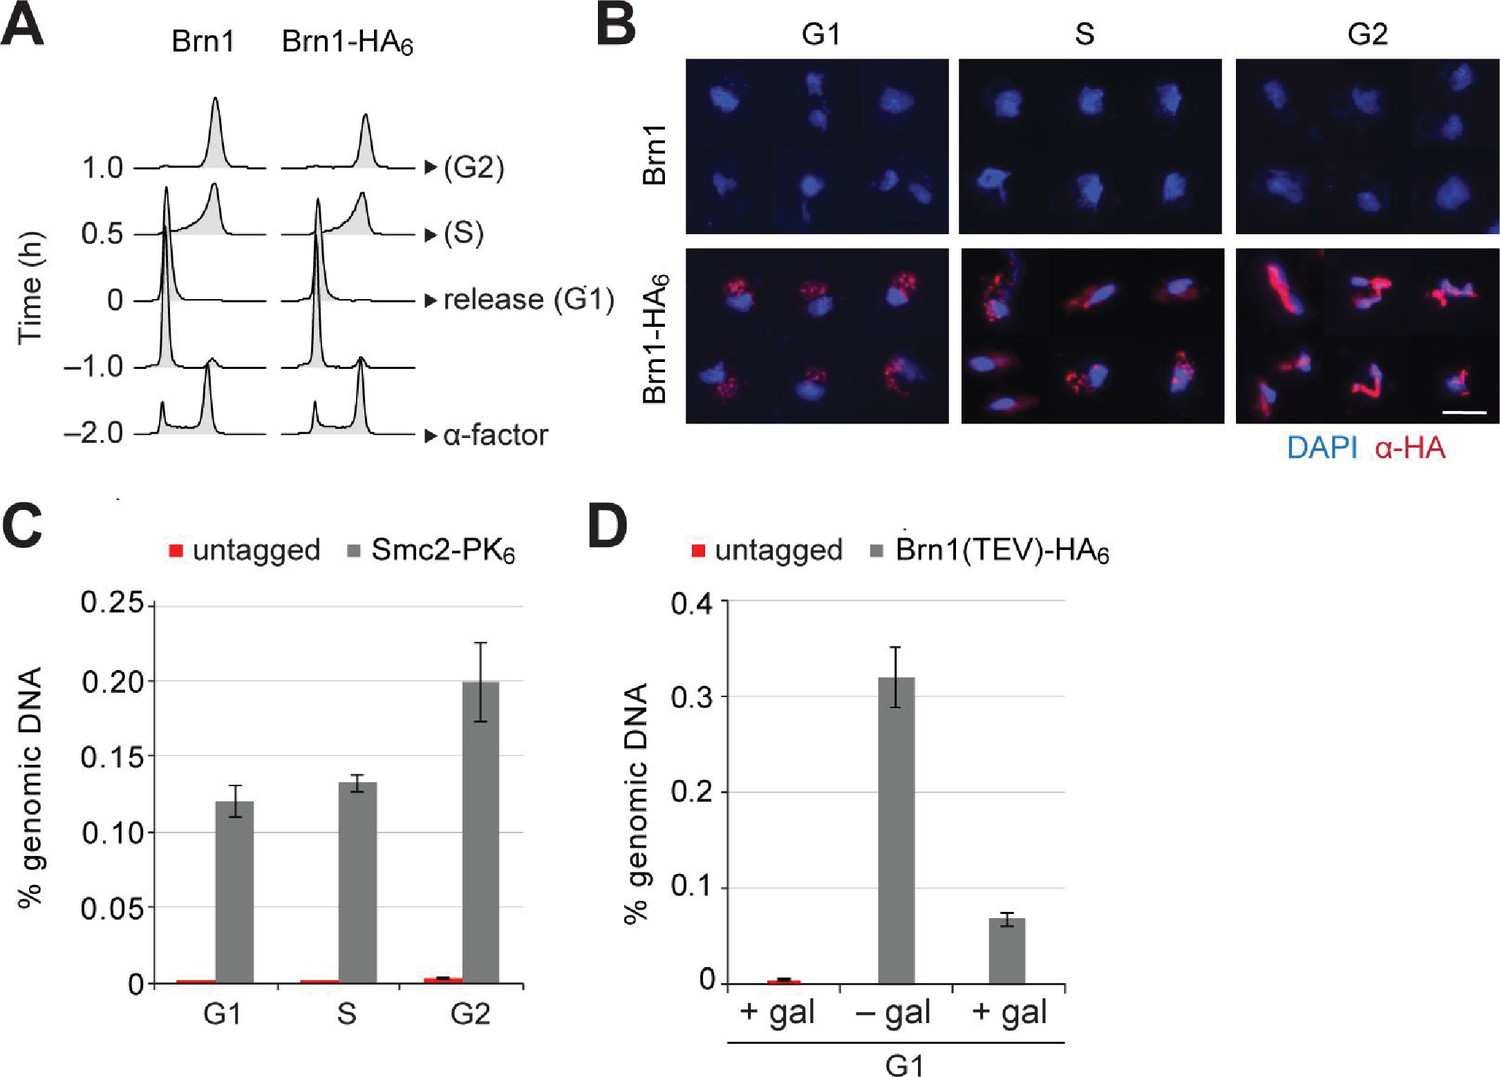
Condensin release from chromosomes has no major effects on G1 or M phase gene expression programs in budding yeast.
(A) Cells were synchronized to G1 phase by α-factor and released (strains C1 and C1584). Samples for chromosome spreads were taken prior to the release, 0.5 and 1 hr after the release in order to yield G1, S and G2 phase samples, as indicated. Cell cycle synchronization was scored by FACScan analysis of cellular DNA content. (B) Condensin levels on chromosomes of cells in (A) were measured by immunofluorescence of chromosome spreads (red, anti-HA; blue DAPI). Scale bar: 5 µm. (C) Cells were synchronized to G1 phase by α-factor (strains C1 and C1597) and released as in (A). Samples for ChIP were taken prior to the release, or 0.5 or 1 hr after the release for G1, S and G2 phase samples, respectively. Condensin levels on chromosomes were measured by anti-PK ChIP at the rDNA locus followed by quantitative PCR. (D) TEV protease expression was induced by addition of galactose (+gal) in cells synchronized in G1 phase by α-factor (strains C1039 and C2455). A control sample was not induced (– gal). Condensin levels on chromosomes were measured by anti-HA ChIP followed by quantitative PCR at the rDNA locus.
Figure 5 with 2 supplements
Defective mitosis underlies deregulated gene expression in the fission yeast cut14-208 condensin mutant.
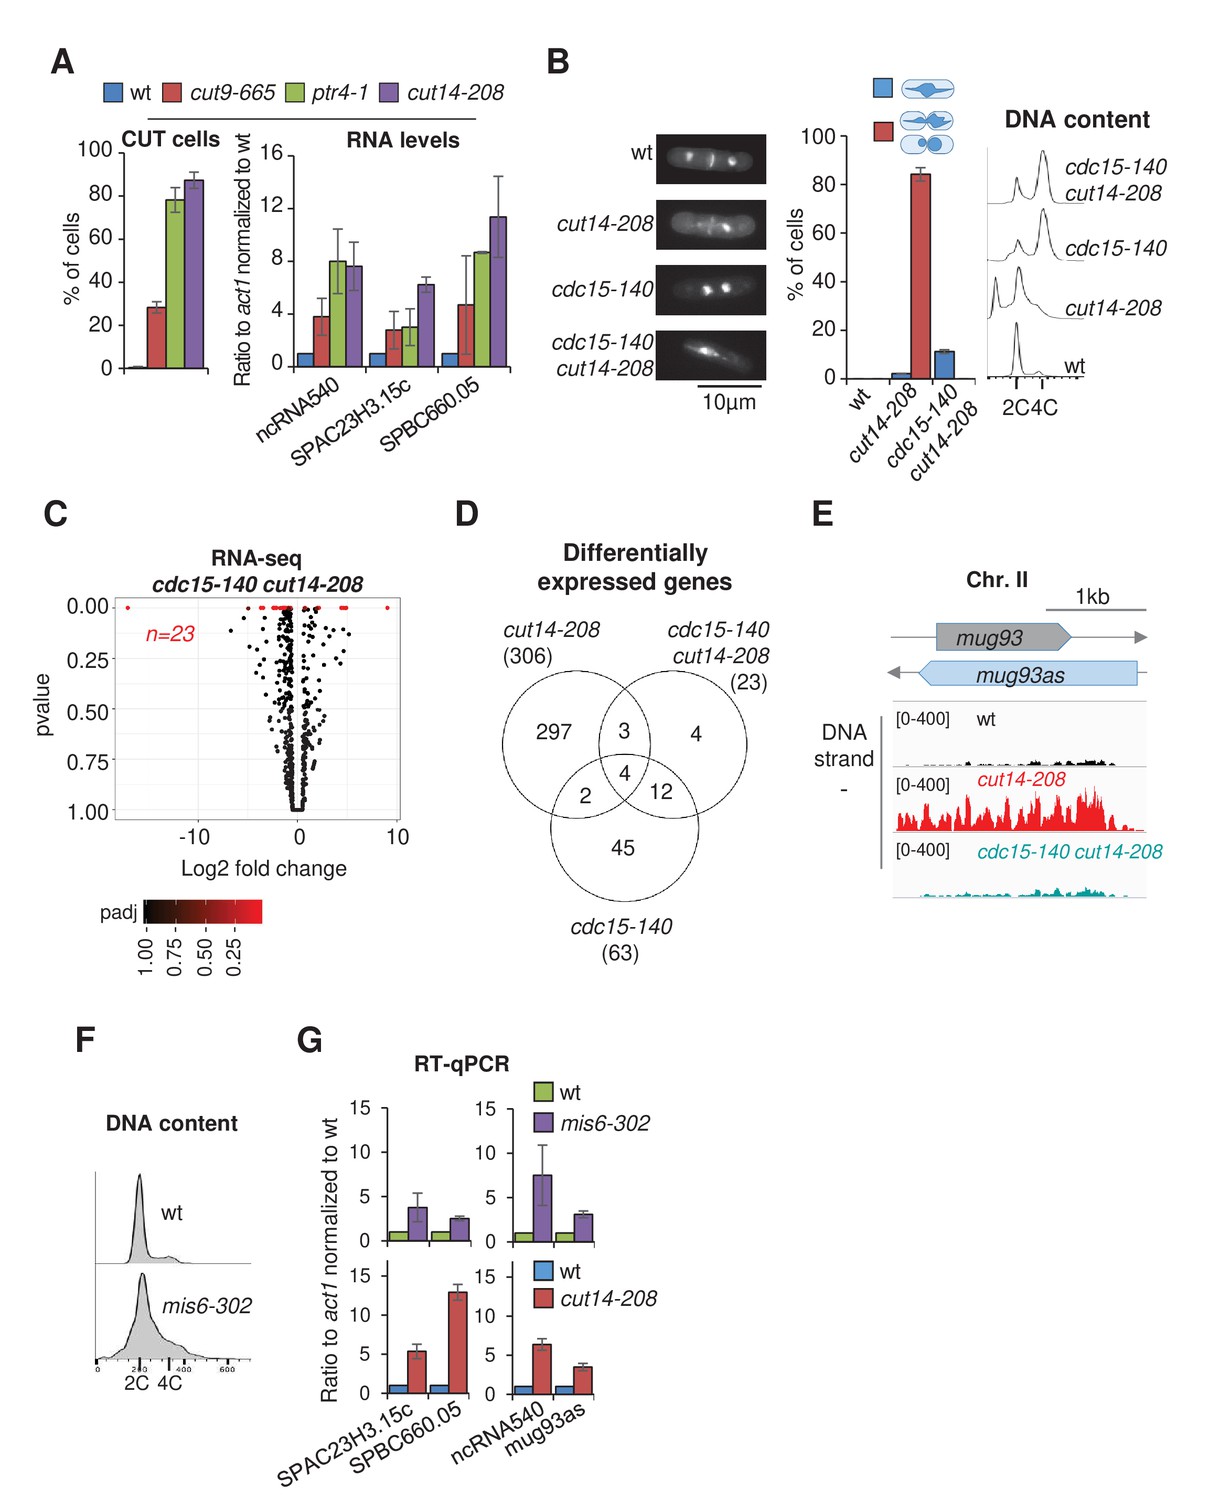
(A) Gene deregulation in mutant cells in which chromosomes are cut by the cytokinetic ring upon mitotic exit. Strains grown at 36°C for 2.5 hr were processed for cytological analysis and RT-qPCR. Right: cells were stained with DAPI and calcofluor to visualise DNA and the septum, respectively, and to quantify the frequency of chromosome cutting by the septum (CUT cells). Left: total RNA was reverse-transcribed in the presence or absence RT and cDNA quantified by qPCR. Shown are averages ± SDs calculated from three biological replicates. (B–E) Preventing chromosome severing restores normal gene expression in the condensin mutant cut14-208. (B) Cells were grown at 36°C for 2.5 hr and stained with DAPI and calcofluor to reveal DNA and the septum, and measure the frequency of CUT cells, or treated for FACScan analysis of DNA content. (C) Volcano plot of RNA levels measured by strand-specific RNA-seq in the cdc15-140 cut14-208 double mutant after 2.5 hr at 36°C, from biological triplicates. (D) Comparative RNA-seq transcriptomic analysis from biological triplicates. (E) RNA-seq profiles of the mug93as ncRNA. (F–G) The kinetochore mutation mis6-302 and the condensin mutation cut14-208 deregulate a same set of genes. Wildtype and mis6-302 cells grown at 36°C for 8 hr were processed to analyse DNA content by FACScan (F) and RNA levels by RT-qPCR (G). cut14-208 cells and the isogenic wt control grown at 36°C for 2.5 hr were used for comparison. Shown are averages ± SDs measured from biological triplicates.
Figure 5—figure supplement 1

Defective mitosis underlies deregulated gene expression in the fission yeast cut14-208 condensin mutant.
(A–C) Gene expression was assessed in synchronized cut14-208 cells progressing through mitosis. (A) Cells expressing the analogue-sensitive Cdc2asM17 kinase were arrested at the G2/M transition in the presence of 3-Br-PP1 (2 µM), shifted at 36°C, released into mitosis and re-arrested in late G1 phase by the cdc10-129 mutation. (B) Mitotic progression was assessed by cytological observation. DNA was stained with DAPI and the septum with calcofluor. The frequencies of chromatin bridges (green line) and chromosome cutting by the septum (red line) are shown. (C) Total RNA extracted from wild-type and cut14-208 cells shown in (B) was reverse-transcribed in the presence or absence of RT and cDNA quantified by qPCR. (D–E) The amplitude of increase in RNA levels correlates with the prevalence of chromosome severing in condensin mutants. Indicated cells were grown at 36°C for 2.5 hr and processed for cytological analysis of chromosome segregation (D) or RT-qPCR (E). (D) Cells were fixed and processed for immunofluorescence against α-tubulin. DNA was stained with DAPI. Chromosome segregation was assessed in anaphase cells exhibiting a mitotic spindle ≥6 µm in length (n ≥ 100). CUT phenotype was assessed by staining DNA with Hoechst 3342 and the septum by calcofluor (n ≥ 100). Shown are averages ± SDs from biological triplicates. (E) Total RNA extracted from cells grown at 36°C was reverse-transcribed in the presence or absence of RT and the cDNA quantified by qPCR. Shown are the averages ± SDs measured from biological triplicates.
Figure 5—figure supplement 2
Defective mitosis underlies deregulated gene expression in the fission yeast cut14-208 condensin mutant.
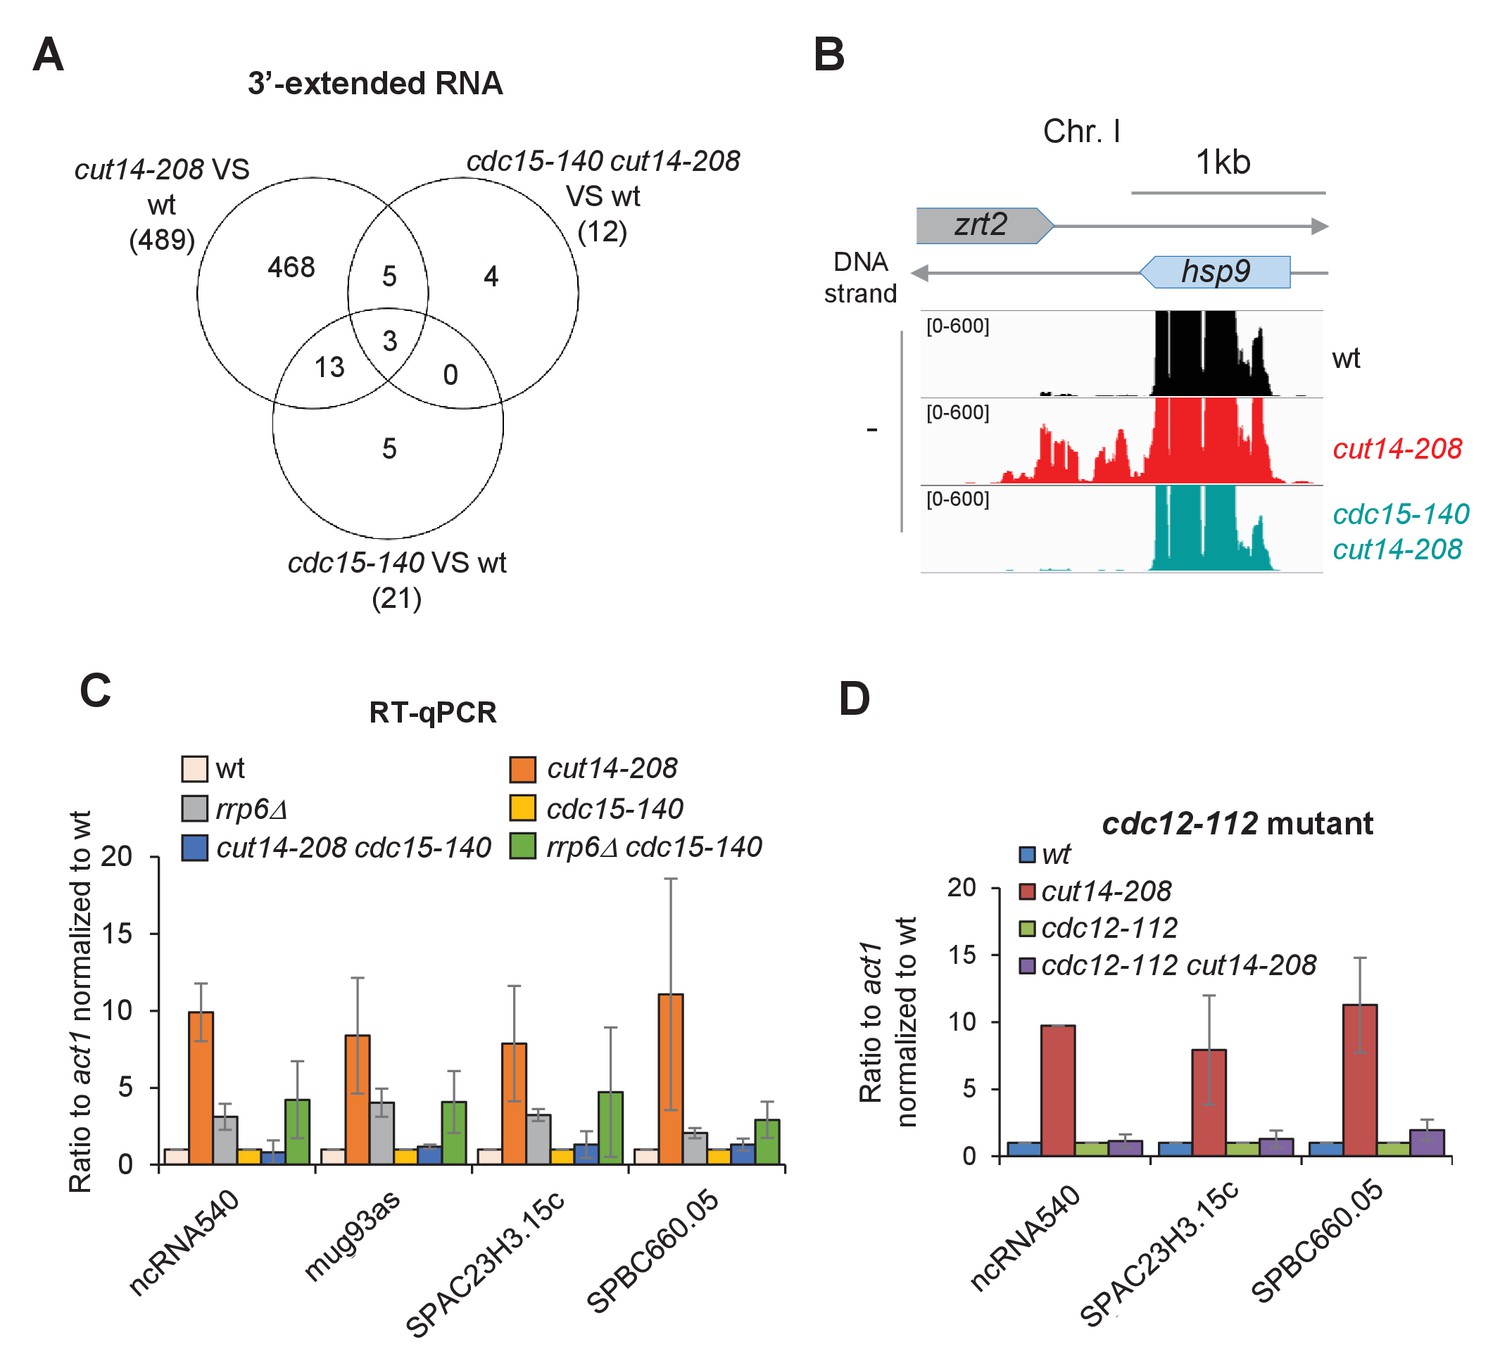
(A) Venn diagram of 3-extended RNAs detected by strand-specific RNA-seq in indicated strains. (B) RNAseq profiles of the hsp9 gene showing the suppressive effect of cdc15-140 on the accumulation of read-through transcripts caused by cut14-208. (C) Increased RNA levels persist in the double mutant cdc15-140 rrp6Δ. Cells were grown at 36°C for 2.5 hr, total RNA was reverse-transcribed in the presence or absence of RT and cDNA quantified by qPCR. Shown are the averages ± SDs measured from biological triplicates. (D) The mutations cdc12-112 that prevents cytokinesis at the restrictive temperature restored normal RNA levels in a cut14-208 genetic background. Cells were grown at 36°C for 2.5 hr, total RNA was reverse-transcribed in the presence or absence of RT and cDNA quantified by qPCR. Shown are the averages ± SDs measured from biological duplicates.
Figure 6
The accumulation of tRNAs in condensin mutant cells is linked to chromosome missegregation.
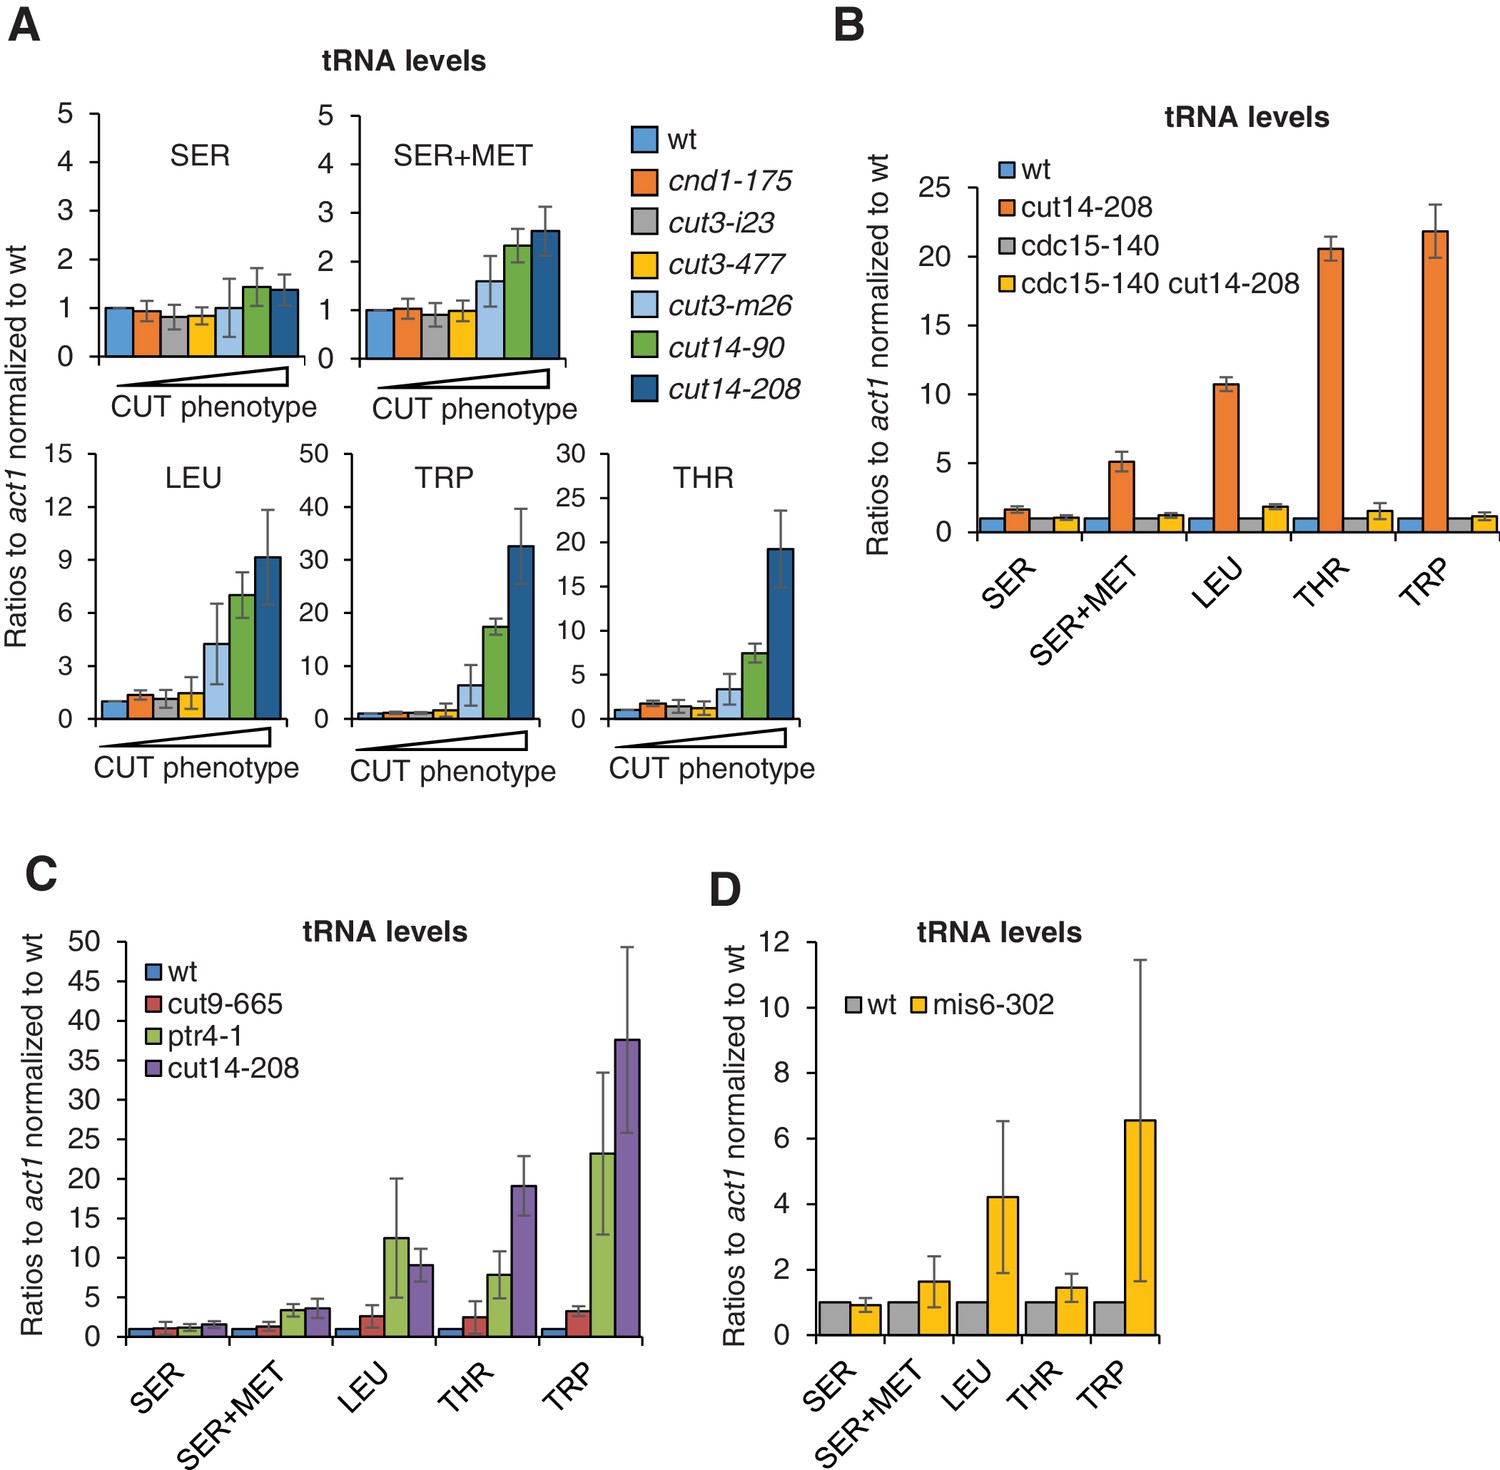
(A) The accumulation of tRNAs in condensin mutant cells correlates with chromosome missegregation. Cells were grown at 36°C for 2.5 hr and processed for cytological analysis to measure the frequency of chromosome segregation and CUT phenotype (see Figure 5—figure supplement 1D). Total RNA extracted from these cells was reverse-transcribed in the presence or absence of RT and the cDNA were quantified by qPCR with primers unique to the indicated families of tRNAs. SER +MET refers to a dimeric tRNA(SER)-tRNA(MET) transcript (Johnson et al., 1989). (B–C) Total RNA extracted from cells grown at 36°C for 2.5 hr was processed for RT qPCR. (D) Wildtype and mis6-302 cells grown at 36°C for 8 hr were processed for RT-qPCR. cut14-208 cells and the isogenic wt control grown at 36°C for 2.5 hr were used for comparison. All the data shown in Figure 6 are averages ± SDs measured from biological triplicates.
Figure 7 with 2 supplements
Condensin inactivation generates anucleolate daughter cells, which are depleted of the RNases Rrp6 and Dis3 and accumulate unstable RNA.
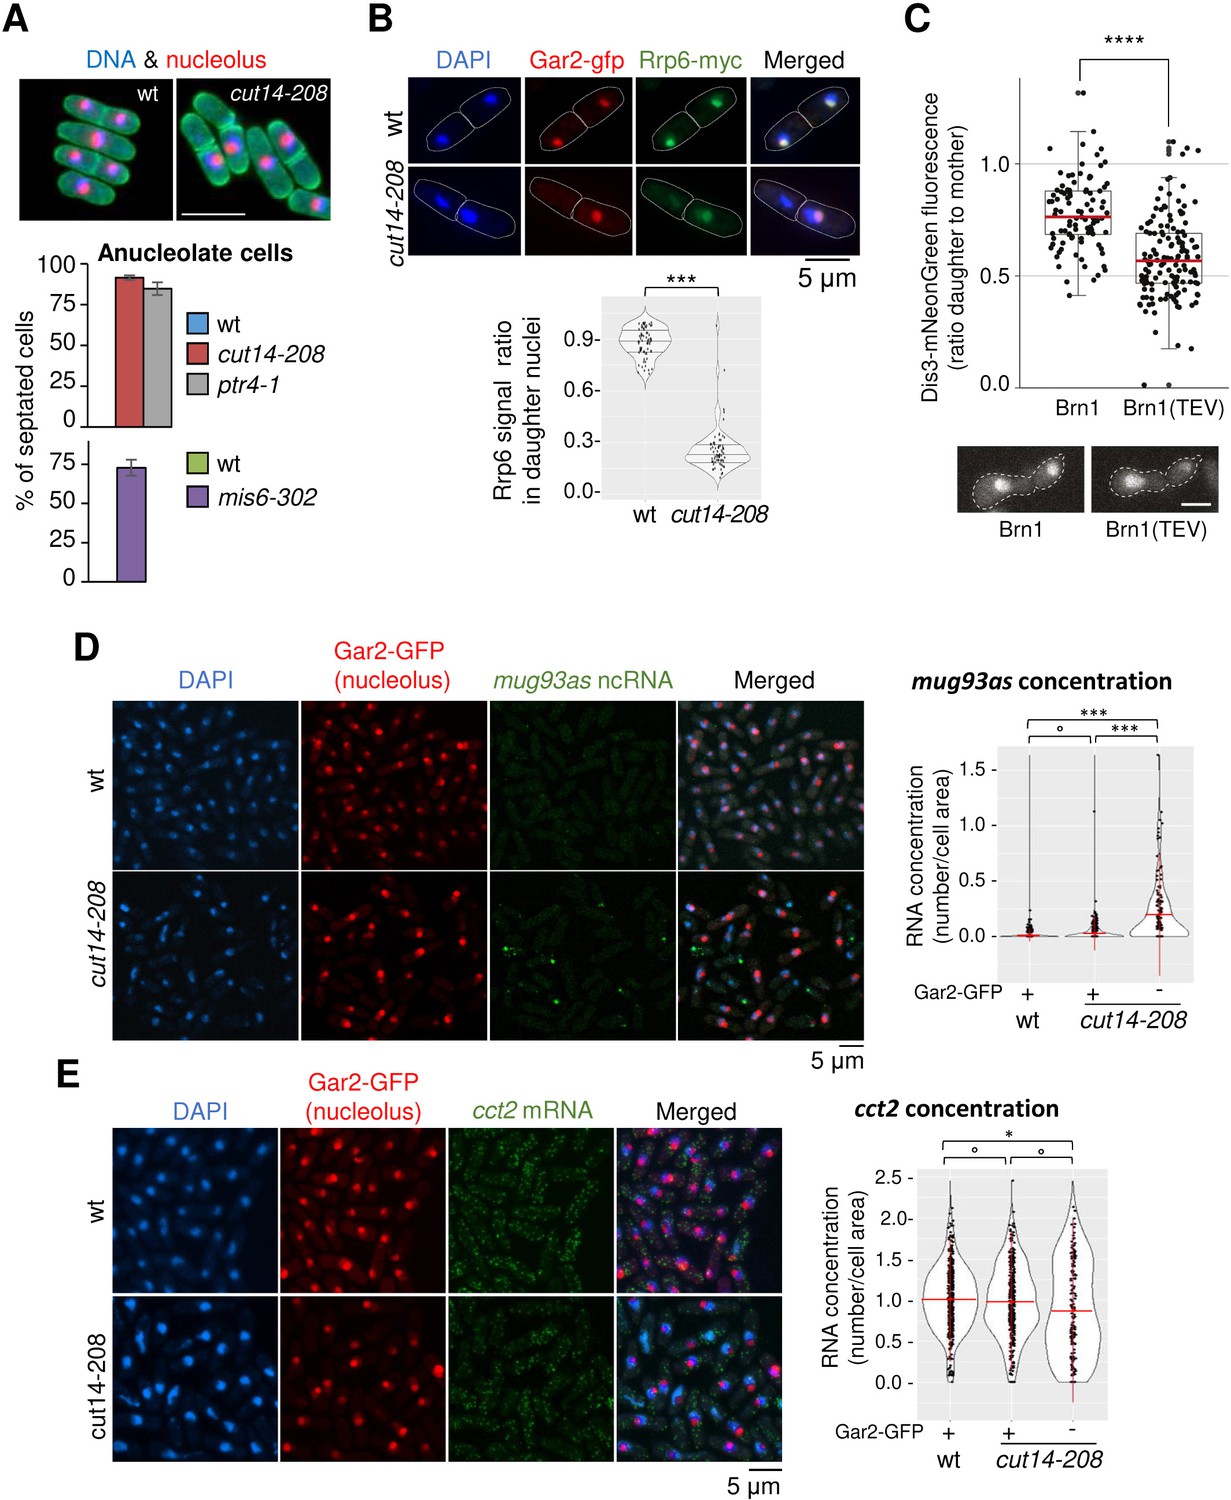
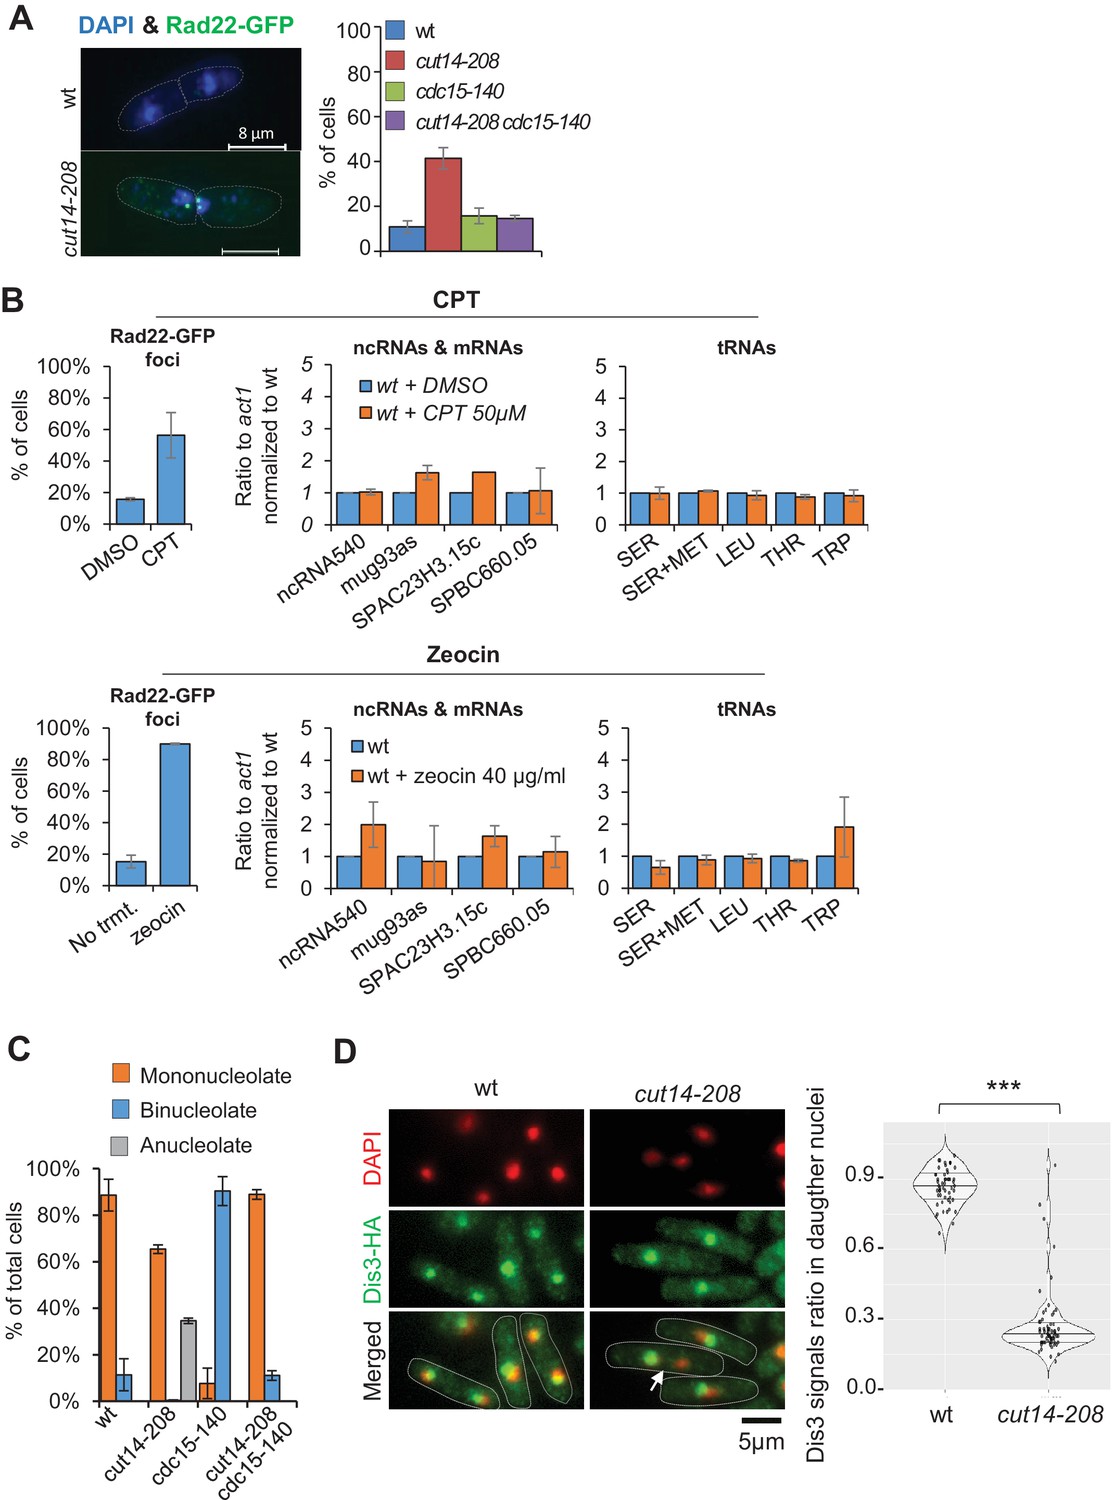
(A) Non-disjunction of the rDNA in cut14-208 cells. The nucleolar protein Gar2-mcherry was used as a marker for the rDNA (nucleolus) and the plasma membrane protein Psy1-GFP to visualise cytokinesis. Mutant cells and their isogenic wt controls were grown at 36°C for 2.5 hr (cut14-208 and ptr4-1) or 8 hr (mis6-302), fixed and stained with DAPI. Segregation of the rDNA in daughter nuclei was measured upon mitotic exit. Scale bar: 10 μm. (B) Rrp6 is enriched in the nucleolus, and depleted from anucleolate cut14-208 mutant cells. Indicated cells were grown at 36°C, fixed and processed for immunofluorescence against Gar2-GFP and Rrp6-myc. DNA was stained with DAPI. Lower panel shows the ratio of Rrp6-myc signals measured within daughter nuclei in septated cells. ***p<0.001, Wilcoxon ranked sum test with continuity correction. (C) Asymmetric partitioning of Dis3 in budding yeast upon condensin cleavage. pTEV protease expression was induced in cells synchronized in G1 phase by α-factor. 2.5 hr after TEV induction, cells were released from the arrest and segregation of Dis3-mNeonGreen was scored between 2 and 2.5 hr after the release by measuring the ratio between Dis3 signals in daughter to mother cells (N = 97 (strain C5259), N = 139 (strain C5260); box plot shows median (red) ±first quartile and 1.5x interquartile range (whiskers); ****p<0.0001, unpaired t-test with Welch’s correction). Scale bar: 5 μm. (D–E) The non-coding RNA mug93as accumulate in anucleolate cut14-208 cells. Cells of indicated genotype and expressing Gar2-GFP were grown at 36°C for 2.5 hr, fixed and processed for single molecule RNA FISH using probes complementary to the ncRNA mug93as (D) or the mRNA cct2 (E). Box and whiskers plots show quantifications of RNA spots in cut14-208 compared to wt, and in nucleolate compared to anucleolate mutant cells. ***p<0.001, *p<0.05 and °p>0.05, Wilcoxon non-parametric test.
Figure 7—figure supplement 1
Condensin inactivation generates anucleolate daughter cells, which are depleted of the RNases Rrp6 and Dis3 and accumulate unstable RNA
(A) cut14-208 mutant cells accumulate DNA damage that can be suppressed by cdc15-140. Cells expressing Rad22-GFP were grown at 36°C for 2.5 hr, fixed and stained with DAPI. Cells exhibiting at least one Rad22-GFP focus were scored. Shown are the averages ± SDs calculated from biological triplicates with more than 100 cells per experiment. (B) DNA damage does not increase RNA levels as cut14-208. Cells expressing Rad22-GFP were synchronised in prometaphase by the nda3-KM311 mutation and released in mitosis in the presence of Camptothecin (CPT), or its vehicle DMSO, to induce DNA damage upon mitotic exit. Asynchronously growing cells expressing Rad22-GFP were treated with zeocin to induce DNA double-strand breaks. The prevalence of DNA damage was measured by scoring Rad22-GFP foci. RNA levels in cells experiencing DNA damage were assessed by RT-qPCR. Shown are averages ± SDs calculated from biological triplicates. (C) The cdc15-140 mutation prevents the production of anucleolate cells in a cut14-208 genetic background. Cells expressing Gar2-GFP were grown at 36°C for 2.5 hr, fixed and stained with DAPI to score the percentage of anucleolate cells. Shown are the averages ± SDs calculated from biological triplicates with more than 100 cells per experiment. (D) Dis3 is enriched in the nucleolus and segregates asymmetrically in cut14-208 mutant cells (arrow). Indicated cells were grown at 36°C, fixed with ethanol and processed for immunofluorescence against Dis3-HA. DNA was stained with DAPI. Right panel shows the ratio of Dis3-HA signals measured within daughter nuclei in septated cells. *** indicates that the difference is statistically significant with ***p<0.001 by the Wilcoxon ranked sum test with continuity correction.
Figure 7—figure supplement 2
Condensin inactivation generates anucleolate daughter cells, which are depleted of the RNases Rrp6 and Dis3 and accumulate unstable RNA.
Cell cycle synchronization of cells expressing mNeonGreen-tagged Dis3 was scored by FACScan analysis of cellular DNA content and Brn1 cleavage was monitored by western blotting against the C-terminal HA6 tag.
Figure 8
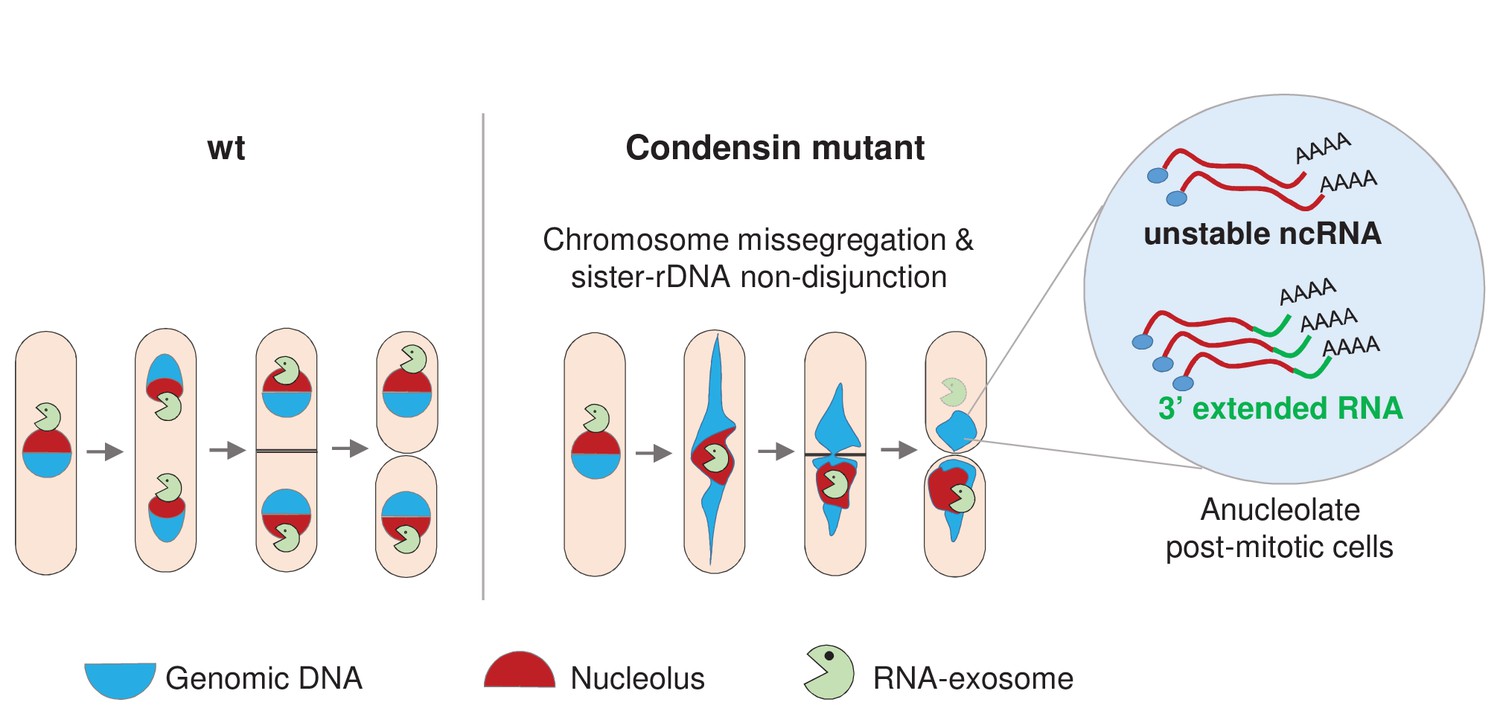
Condensin deficiency impinges upon gene expression by promoting accurate chromosome segregation throughout mitosis.
In wild-type fission yeast cells, Rrp6 and Dis3, the catalytic subunits of the RNA-exosome, are enriched in the nucleolus and a large fraction co-segregates with the bulk of the rDNA during anaphase. In condensin mutant cells, chromosomes fail to properly segregate during anaphase. Chromatin bridges are formed and entangled sister-rDNA copies fail to separate, leading to the production of karyotypically aberrant cells, whose aneuploid condition changes the transcriptome. Notably, the non-disjunction of the rDNA co-depletes anucleolate daughter cells from Rrp6 and Dis3, allowing the accumulation of RNA molecules that are normally actively degraded by the RNA-exosome, such as unstable ncRNAs and 3’-extended RNAs.
Tables
Key resources table
| Reagent type (species) or resource | Designation | Source or reference | Identifiers | Additional information |
|---|---|---|---|---|
| Genetic background (S. pombe) | 972 h- | NA | 245818 [UID] 391418 [GenBank] 245818 [RefSeq] | |
| Genetic background (S. cerevisiae) | W303 | NA | ||
| Genetic reagents (yeast strains) | See Supplementary file 2 | |||
| Antibody | Anti-tubulin (mouse monoclonal) | Keith Gull | TAT1 | (1:50) |
| Antibody | Anti-myc (mouse monoclonal) | Thermo Fisher | #9E10 | (1:500) |
| Antibody | Anti-HA (mouse monoclonal) | Sigma-Aldrich | #12CA5 | (1:500) |
| Antibody | Anti-GFP (rabbit polyclonal) | Life Technologies | #A11122 | (1:800 for IF and 6 μg / IP for ChIP) |
| Antibody | Anti-ser2P RNAPII (rabbit polyclonal) | Abcam | #ab5095 | 6 μg / IP |
| Antibody | Anti-HA (mouse monoclonal) | Covance | 16B12 (anti-HA.11) | 1.5 µl / 50 µl beads |
| Antibody | Anti-PK (mouse monoclonal) | Abd Serotec | MCA1360 | 2 µl / 50 µl beads |
| Sequence-based reagent | See Supplementary file 3 | Sigma | ||
| Commercial assay or kit | Dynabeads protein A | Invitrogen | #10002D | |
| Commercial assay or kit | In vitro transcription kit for probe labelling | Ambion/Thermo Fisher | T7 riboprobe system (AM1312) | |
| Chemical compound, drug | 3-BrB-PP1 | Toronto Research Canada | A602985 | |
| Software, algorithm | RNA seq analysis | This study | https://github.com/LBMC/readthroughpombe |
Additional files
-
Supplementary File 1
RNA levels of RNA-exosome and TRAMP components in cut14-208 mutant cells
- https://doi.org/10.7554/eLife.38517.018
-
Supplementary File 2
Yeast strains used in this study
- https://doi.org/10.7554/eLife.38517.019
-
Supplementary File 3
Primers and RNA-FISH probes used in this study
- https://doi.org/10.7554/eLife.38517.020
-
Supplementary File 4
Antibodies used in this study
- https://doi.org/10.7554/eLife.38517.021
-
Supplementary File 5
Microarrays analysis nocodazole-arrested cells
- https://doi.org/10.7554/eLife.38517.022
-
Transparent reporting form
- https://doi.org/10.7554/eLife.38517.023
Download links
A two-part list of links to download the article, or parts of the article, in various formats.
Downloads (link to download the article as PDF)
Open citations (links to open the citations from this article in various online reference manager services)
Cite this article (links to download the citations from this article in formats compatible with various reference manager tools)
Condensin controls cellular RNA levels through the accurate segregation of chromosomes instead of directly regulating transcription
eLife 7:e38517.
https://doi.org/10.7554/eLife.38517


