Privatisation rescues function following loss of cooperation
- University of Oxford, United Kingdom
- Technical University of Denmark, Denmark
- Rigshospitalet, Denmark
- University of Copenhagen, Denmark
Figures
Figure 1

Super-cooperators precede the sampling of non-producers.
Inverse Kaplan-Meier graph showing that pyoverdine non-producers are found more often in the presence of super-cooperators (dotted line, n = 25 representing 24 clonal lineages in patients, one of which had two independent losses of pyoverdine production), compared to when super-cooperators are absent (solid line, n = 22, representing 21 clonal lineages in patients, one of which had two independent losses). Circles indicate when sampling of clonal lineages stopped, without the observation of lost pyoverdine production. Insert shows that a transition from wild-type (WT) production to super-cooperation (pvd+) was observed in 24 clonal lineages, followed by nine independent occurrences of non-producers. Non-producers evolved in the absence of super-cooperators five times. In total, 33 clone types infecting 35 patients were followed.
Figure 2
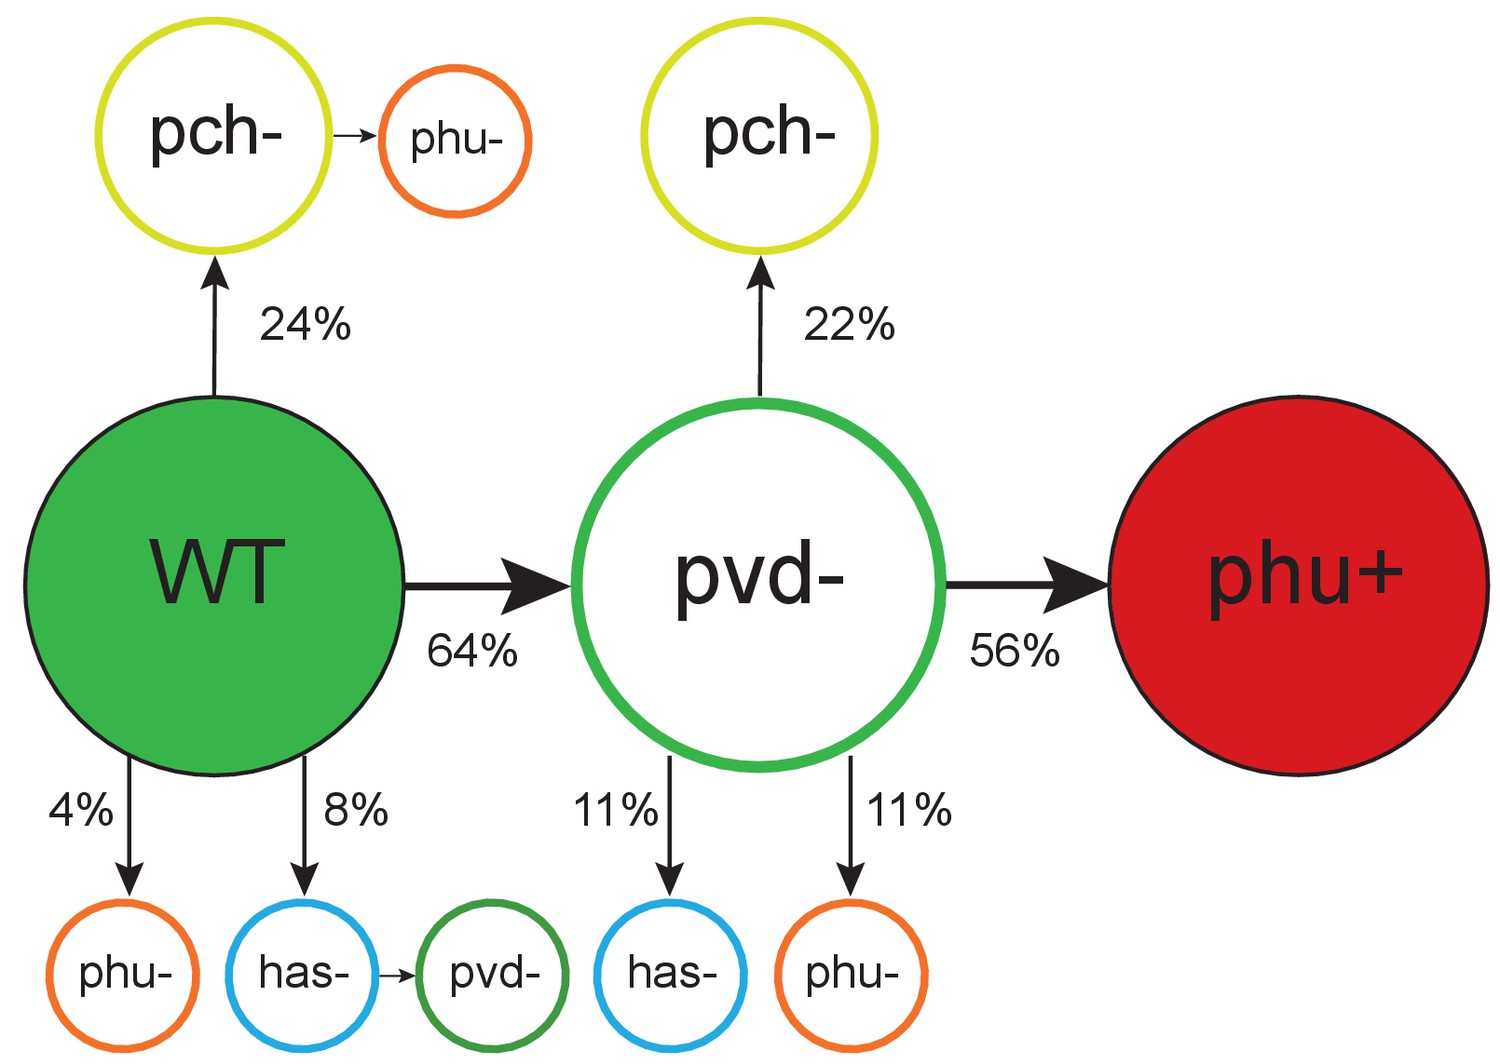
Order of mutations across iron acquisition systems.
Wild type-like (WT) isolates colonize patients, and subsequent loss of cooperative pyoverdine production (pvd-) is the most common change in iron metabolism (n = 25), compared to mutations expected to affect the pyochelin, phu and has systems negatively (pch-, phu-, has-). Loss of pyoverdine production in clonal lineages is followed by intergenic phuS//phuR mutations, predicted to upregulate the private phu system, significantly more often than expected by chance (phu+, n = 9). Colour indicates iron uptake system (green = pyoverdine, yellow = pyochelin, dark red = intergenic phuS//phuR, orange = phu (either a mix of phuS//phuR and other phu mutations, or only ns SNPs), blue = has). The occurrence of has mutations may be underestimated due to low sequencing depth of two genes. The figure shows only transitions where there was a clear order in which systems were affected, see Supplementary file 1F for all transitions.
Figure 3
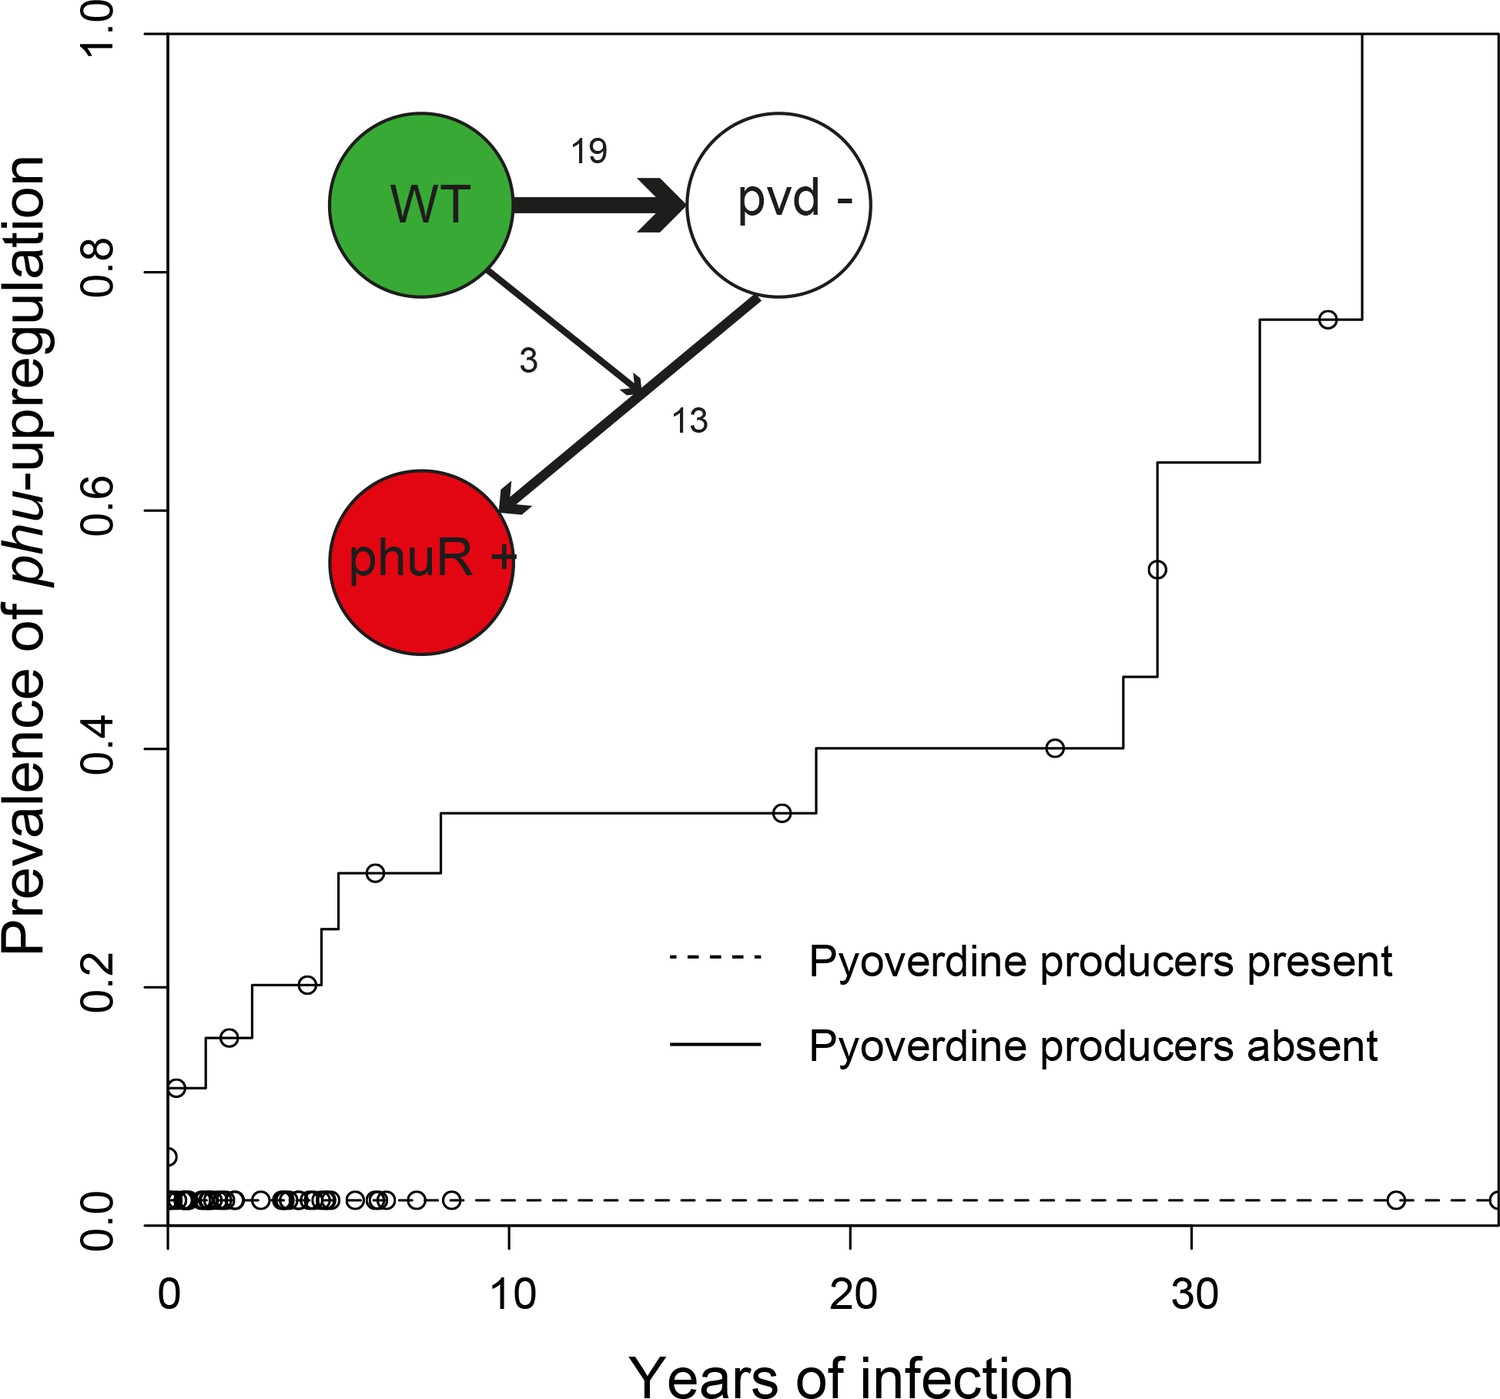
Loss of cooperation precedes privatisation of iron uptake.
Inverse Kaplan-Meier graph showing that phuS//phuR mutations are observed 15 times when pyoverdine is absent from the social environment (solid line, n = 26), and only once when pyoverdine is available in the social environment (dashed line, n = 47, see text). The mutations are only found in clonal lineages that do not produce pyoverdine. Circles indicate when sampling of clonal lineages stopped, without the observation of phuS//phuR mutations. Insert shows that a transition from wild-type pyoverdine production (WT) to no production (pvd-) was observed 22 times in clonal lineages, while phuS//phuR mutations occurred 16 times independently (phu+), 13 of which were after loss of pyoverdine production from the environment. The order could not be inferred in three cases, in one of which the isolate co-occurred with pyoverdine producers.
Figure 4

Evolutionary trajectories of iron metabolism in the CF airways.
Following infection (n = 45 clonal lineages of 33 clone types), pyoverdine production is frequently upregulated (n = 25). Cheaters are significantly more likely to invade following upregulation. Following loss of pyoverdine production in the social environment (n = 26 non-producing clonal lineages of 6 clone types, from eight independent losses of production and two clonal lineages from which no pyoverdine producers were sampled), the phu system is frequently upregulated by intergenic phuS//phuR mutations (15 times), while this very rarely occurs (one time) when pyoverdine is produced in the social environment (n = 47 producing clonal lineages of 32 clone types).
Figure 5
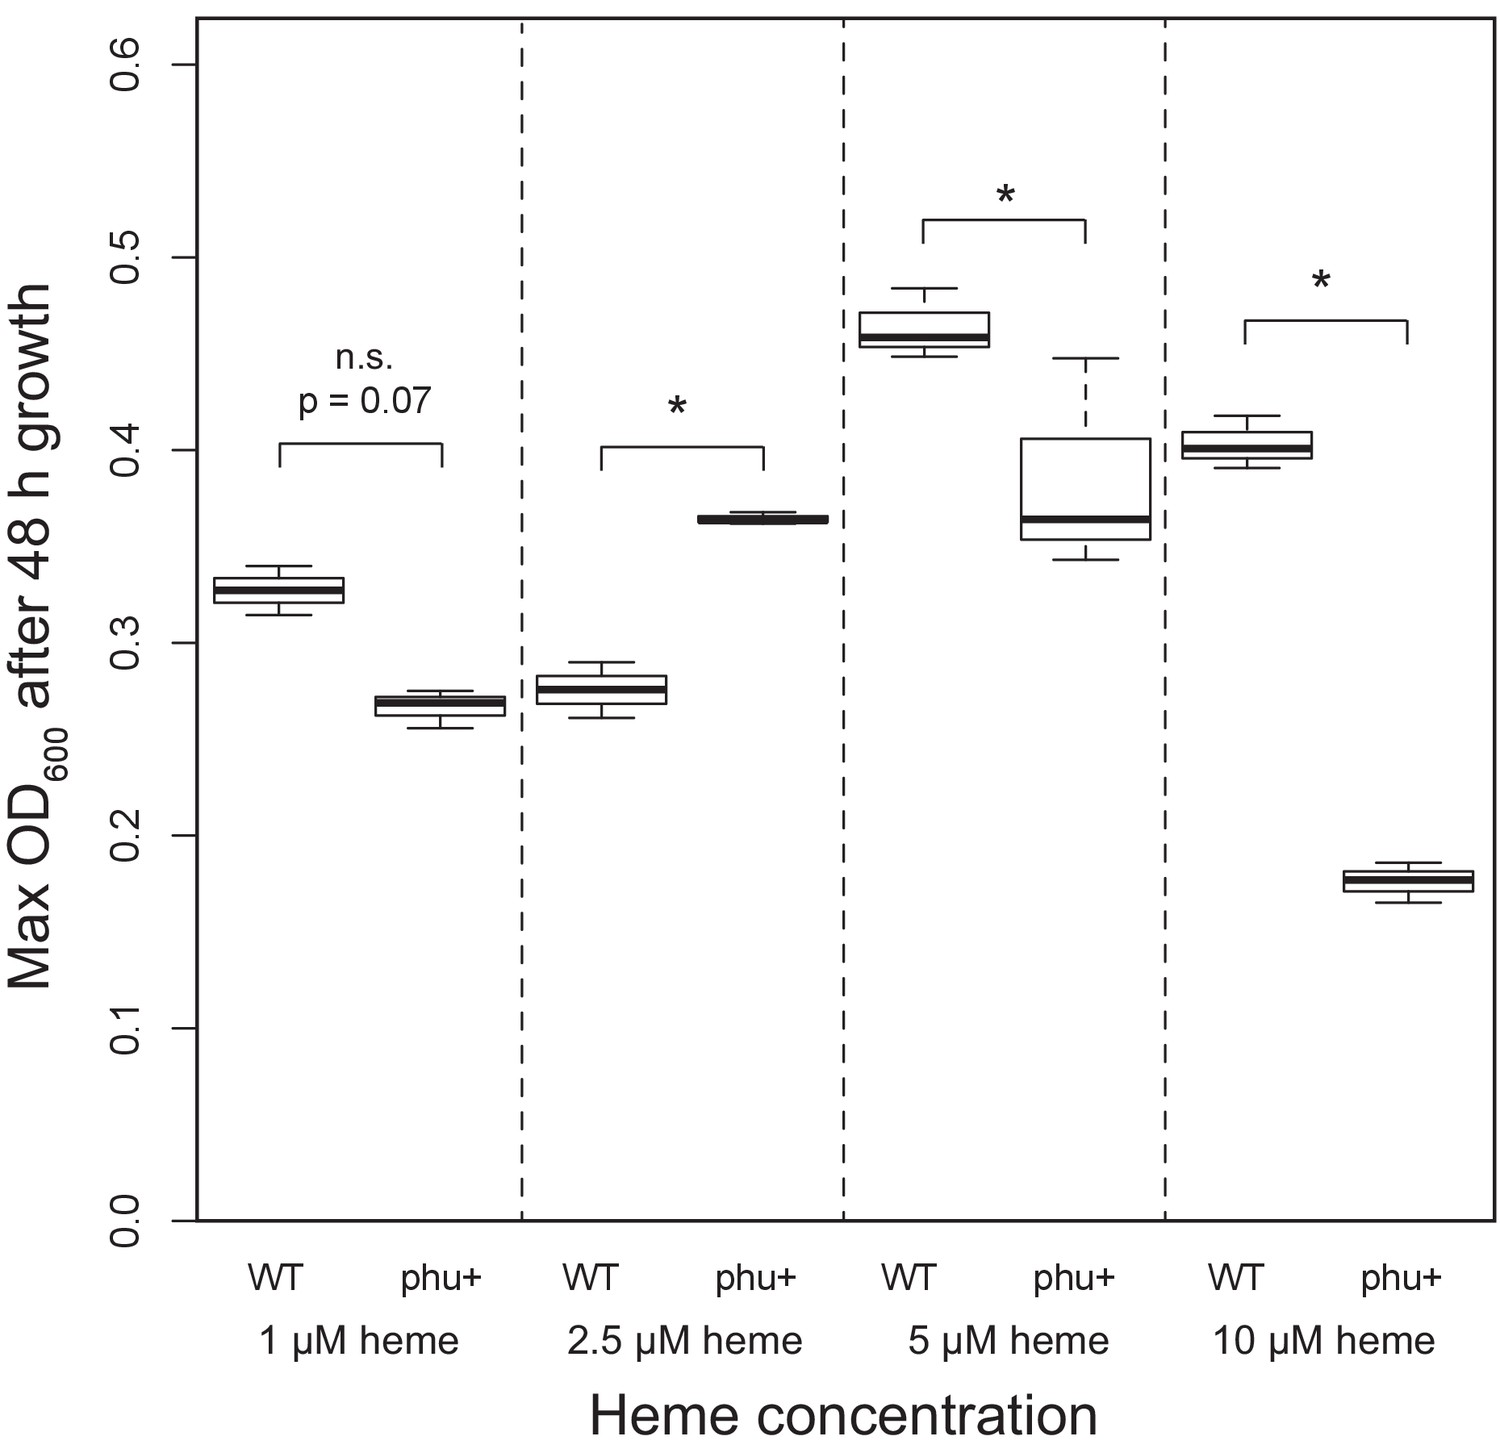
Effect of phu upregulation depends on the heme concentration.
An isogenic pair of isolates differing only in a 1 bp phuS//phuR deletion was grown in iron-limited media supplemented with heme at 1–10 μM. The clinical isolate without the mutation, that does not produce pyoverdine (WT), had a significant higher maximum OD600 after 48 hr growth at 5 and 10 μM, whereas the mutant (phu+) grew best at 2.5 μM. There was no significant difference at 1 μM. Boxplots show median value, and the interquartile range ±25%. The * marks a significant difference at p < 0.05.
Figure 6
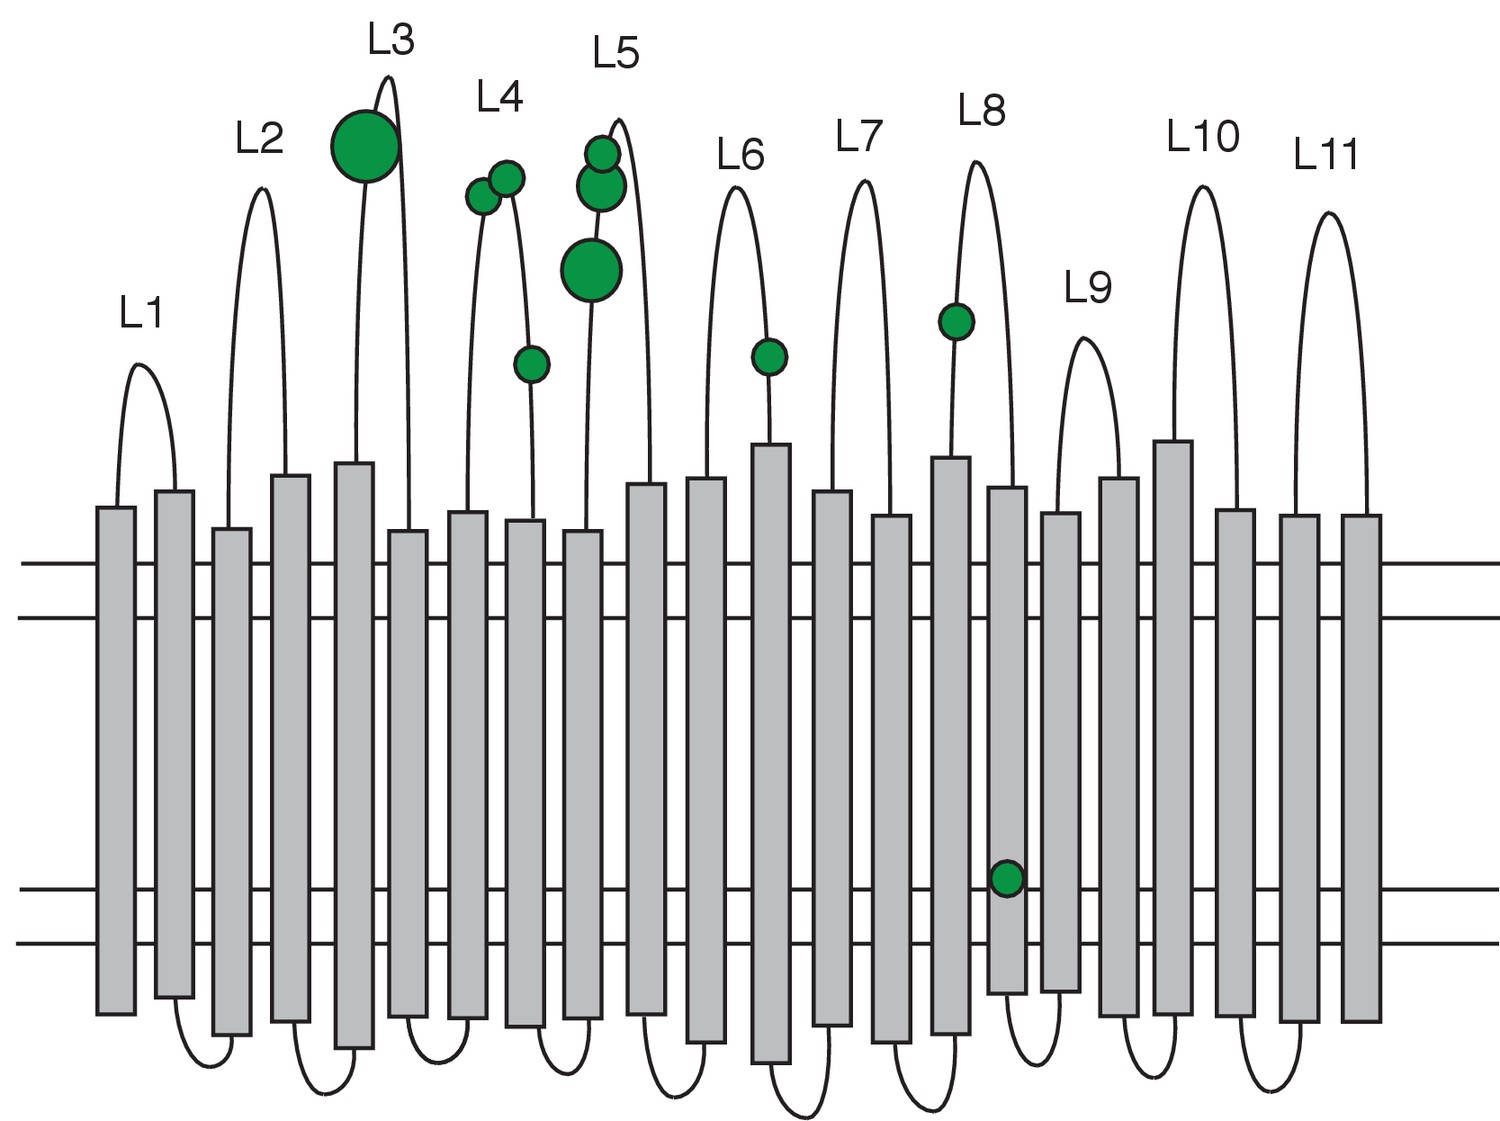
Distribution of non-synonymous mutations in the PhuR heme receptor.
The figure shows the β-barrel structure spanning the cell membrane (horizontal lines) with transmembrane strands (grey bars), extracellular loops (labelled L1-L11) and periplasmic turns (bottom loops). Green circles indicate the location of non-synonymous SNPs, the smallest circles denoting one mutation and the largest four. Mutations were significantly biased towards the extracellular loops.
Appendix 1—figure 1
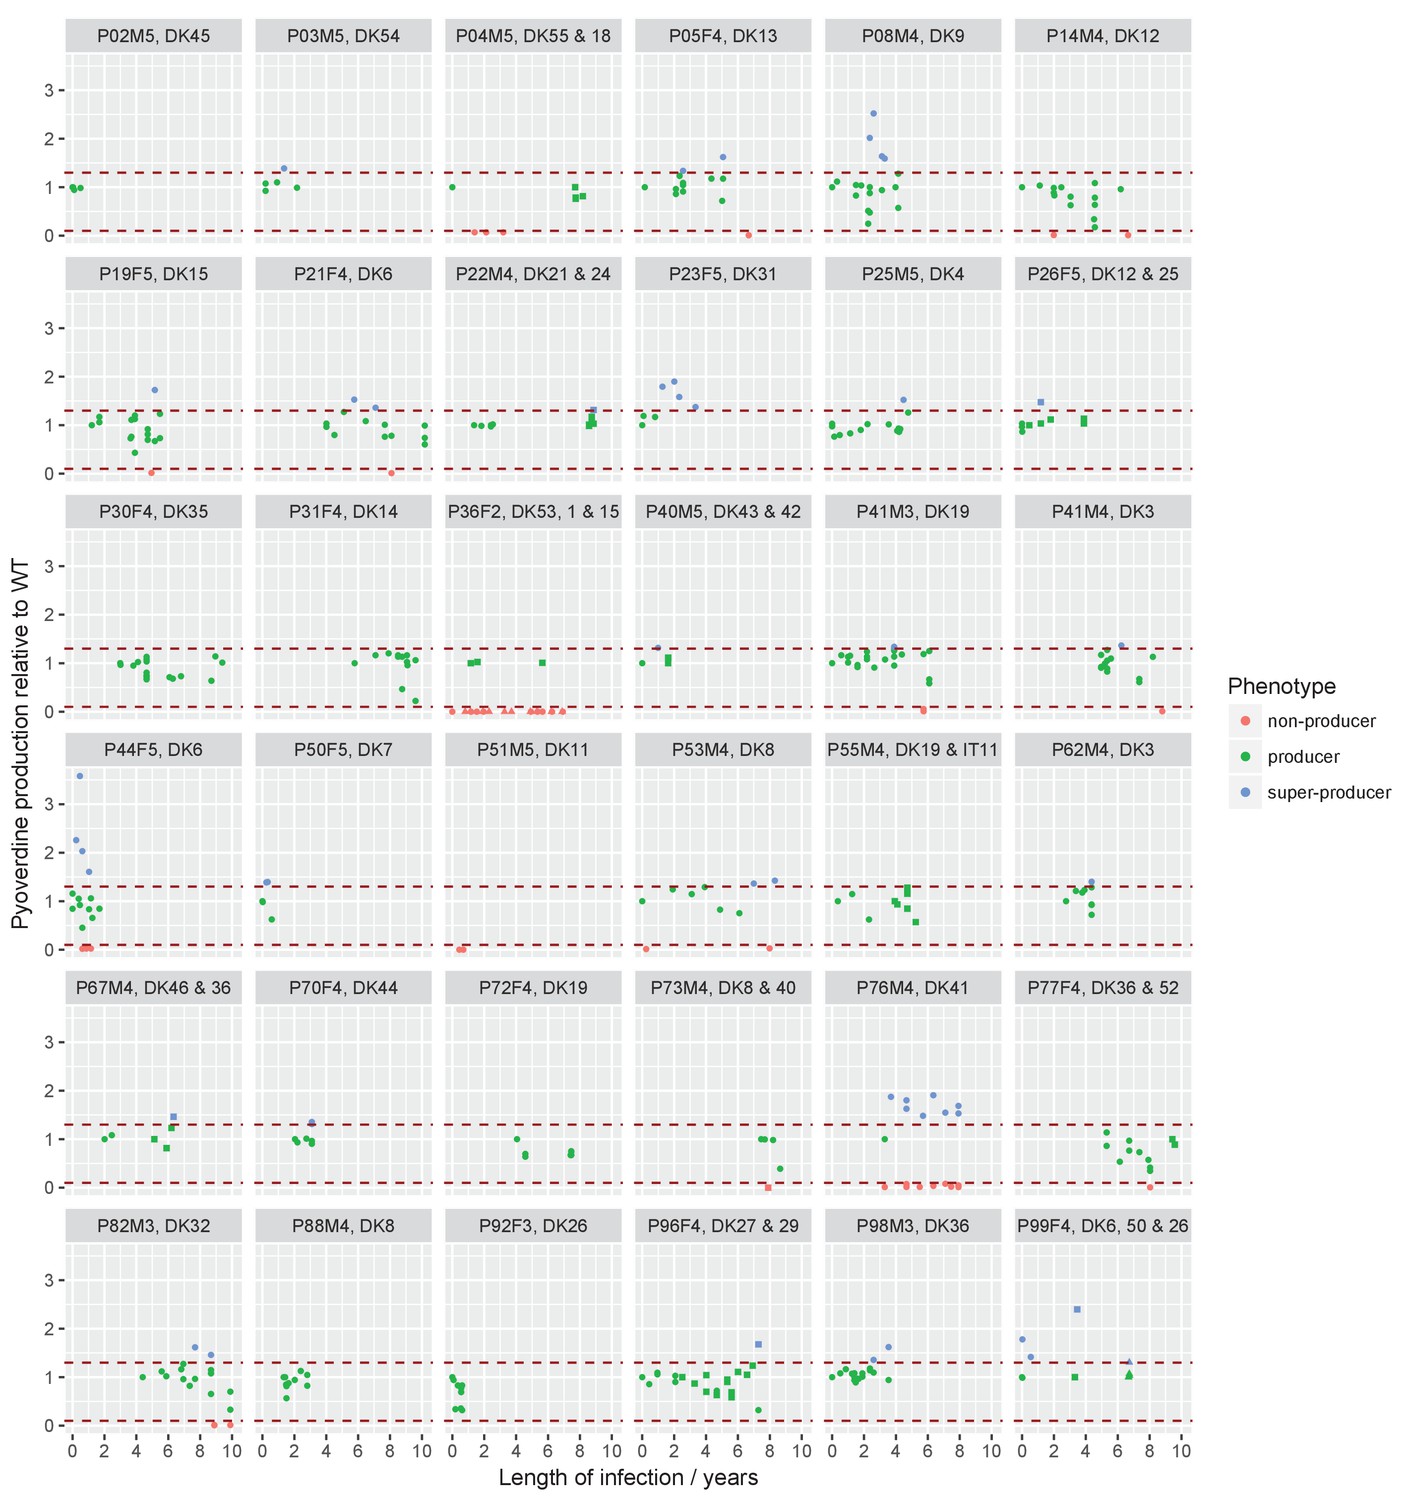
Sampling regimen and standardised pyoverdine production of longitudinally sampled clonal lineages (>1 isolate) from the children’s collection.
Plots show the sampling time of isolates from individual patients denoted by the patient code and clone type. When more than one clone type was sampled they are ordered so that the first listed corresponds to the dot symbol, followed by the square and triangle. The y-axis shows pyoverdine production standardized by production of the first sampled isolate(s). Isolates with a production of 10–129% of the WT are green, non-producers with a production at <10% of the WT are red, and super-cooperators with a production >130% of the WT are blue. Dashed red lines mark these cut-off points. Four clonal lineages of a ‘chronic’ phenotype with no pyoverdine producers sampled were excluded from the analysis on super-cooperators (DK1 and DK53 in P36F2, DK40 in P73M4, and DK11 in P51M5). When sampling is shown to start later than year 0 (as e.g. for P67M4) there was a sample collected earlier from the patient that either was not sequenced or of a clone type only sampled once. Created with ggplot2 in R (R Core Team, 2013; Wickham, 2016).
Appendix 1—figure 2
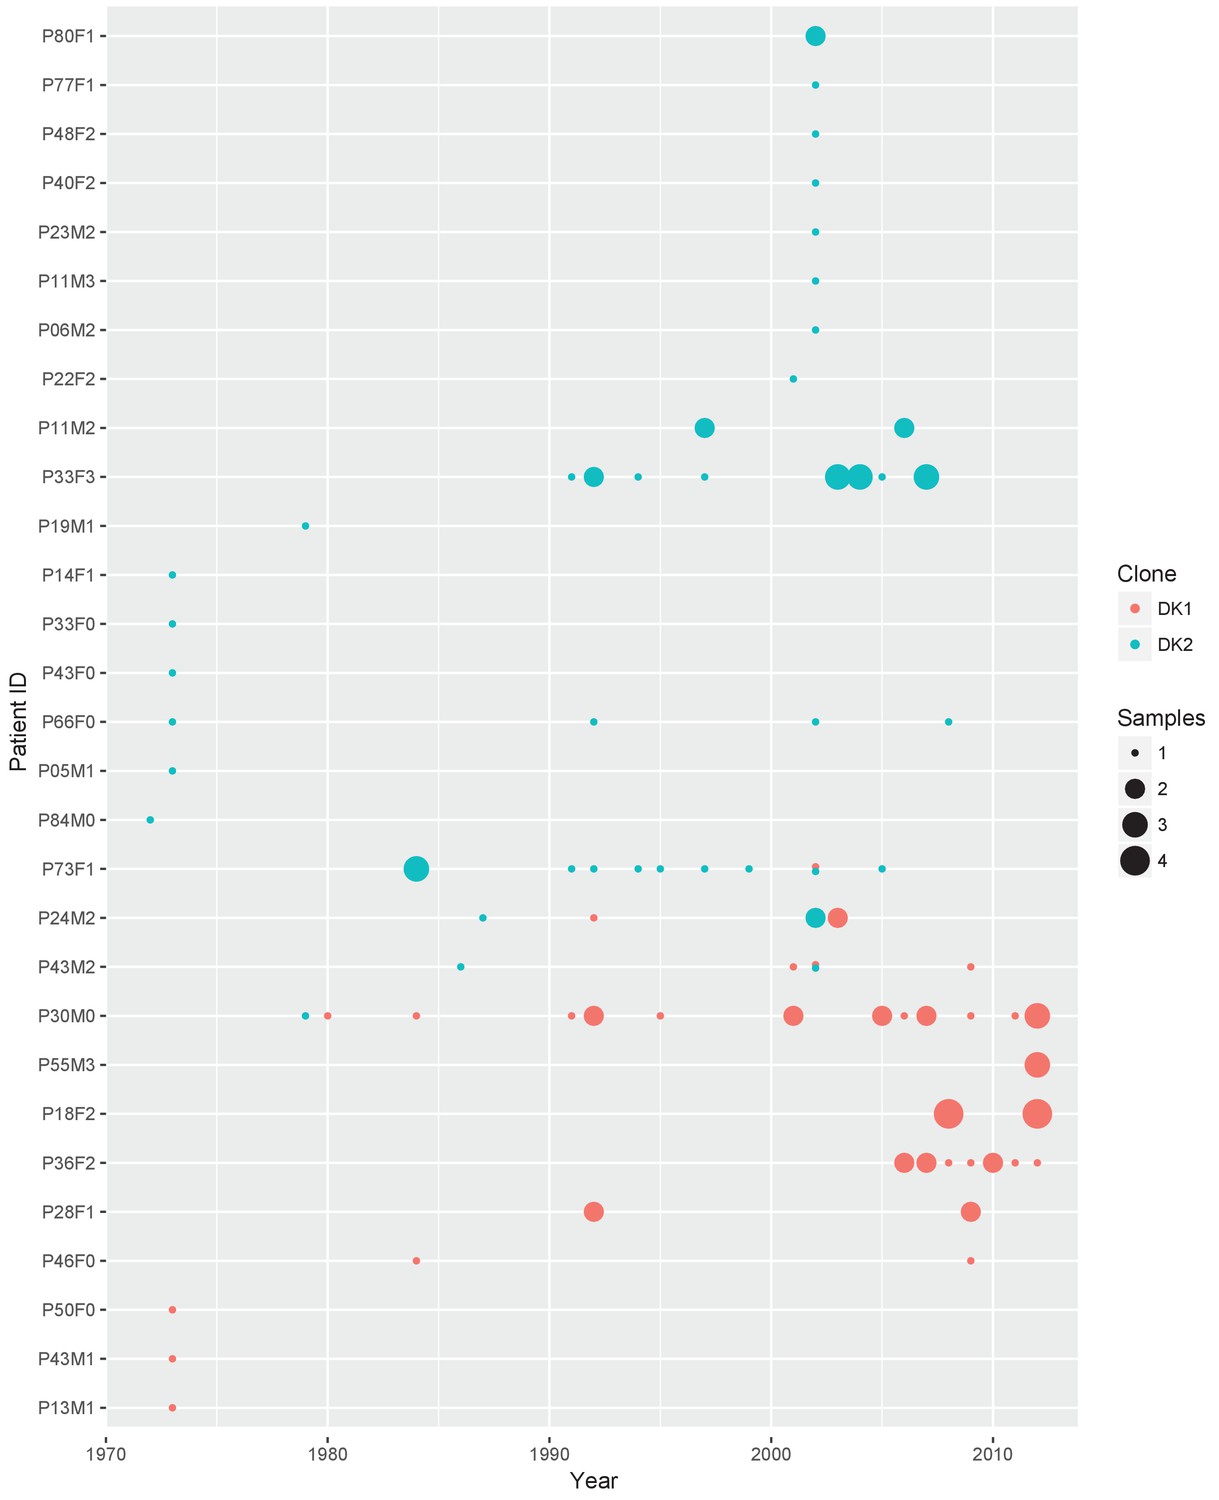
Sampling regimen for the transmissible clone types DK1 and DK2.
On the x-axis is sampling year and on the y-axis the patient ID. Red dots show DK1 and blue DK2. Dot size reflects the number of samples collected in a given year (1-4). Note that patient P36F2 from the children’s collection is included here as this patient harboured DK1 in addition to two other clone types (see also Appendix 1—figures 1 and 6). Created with ggplot2 in R (R Core Team, 2013; Wickham, 2016).
Appendix 1—figure 3
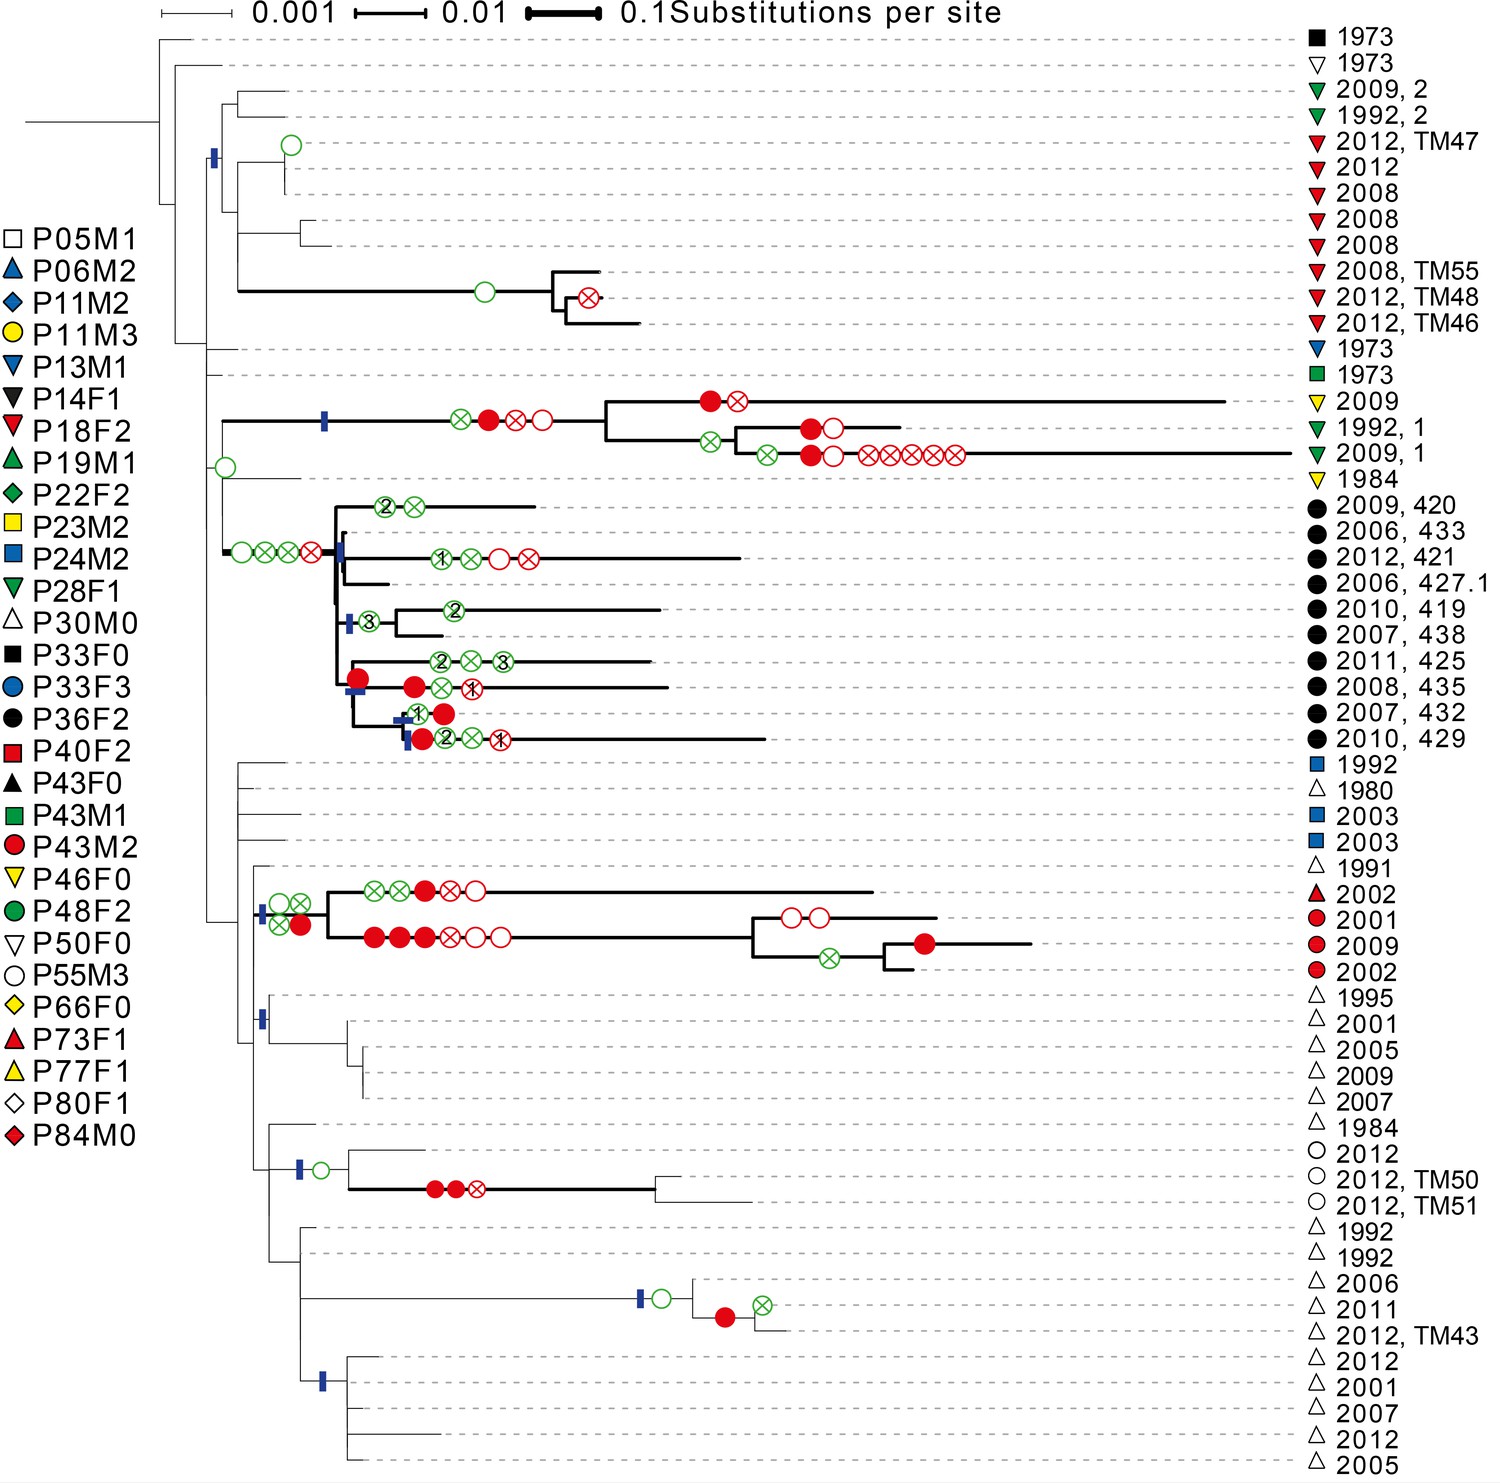
Phylogenetic tree of DK1 samples.
Tree was generated as described in Methods. Patient ID is denoted by shape and sampling year is listed. When multiple samples were collected from the same patient the same year, they are labelled corresponding to labels used in Supplementary file 1C. Scale depends on branch thickness; the thickest branch is only used for samples from P36F2. A green empty circle shows the loss of pyoverdine production measured phenotypically. A green circle with a cross shows the occurrence of a non-synonymous mutation in the pyoverdine receptor gene fpvA or the receptor sigma-factor gene fpvI. A full red circle shows phuS//phuR mutations, a red circle with a cross non-synonymous mutations in the phu receptor gene phuR and an empty red circle additional non-synonymous phu mutations. Additional mutations in the pyoverdine, pyochelin, has and feo systems are not shown. Blue lines mark monophyletic clades used in the analysis on phu upregulation. For isolates from P36F2, one phuR mutation, and three in fpvA were found in multiple isolates on polyphyletic branches (marked with 1, 2 and 3). These are likely not independent, and were not treated as such. Differences in pyoverdine mutations between isolates from P36F2 and P46F0 and P28F1 suggest two independent losses of production..
Appendix 1—figure 4
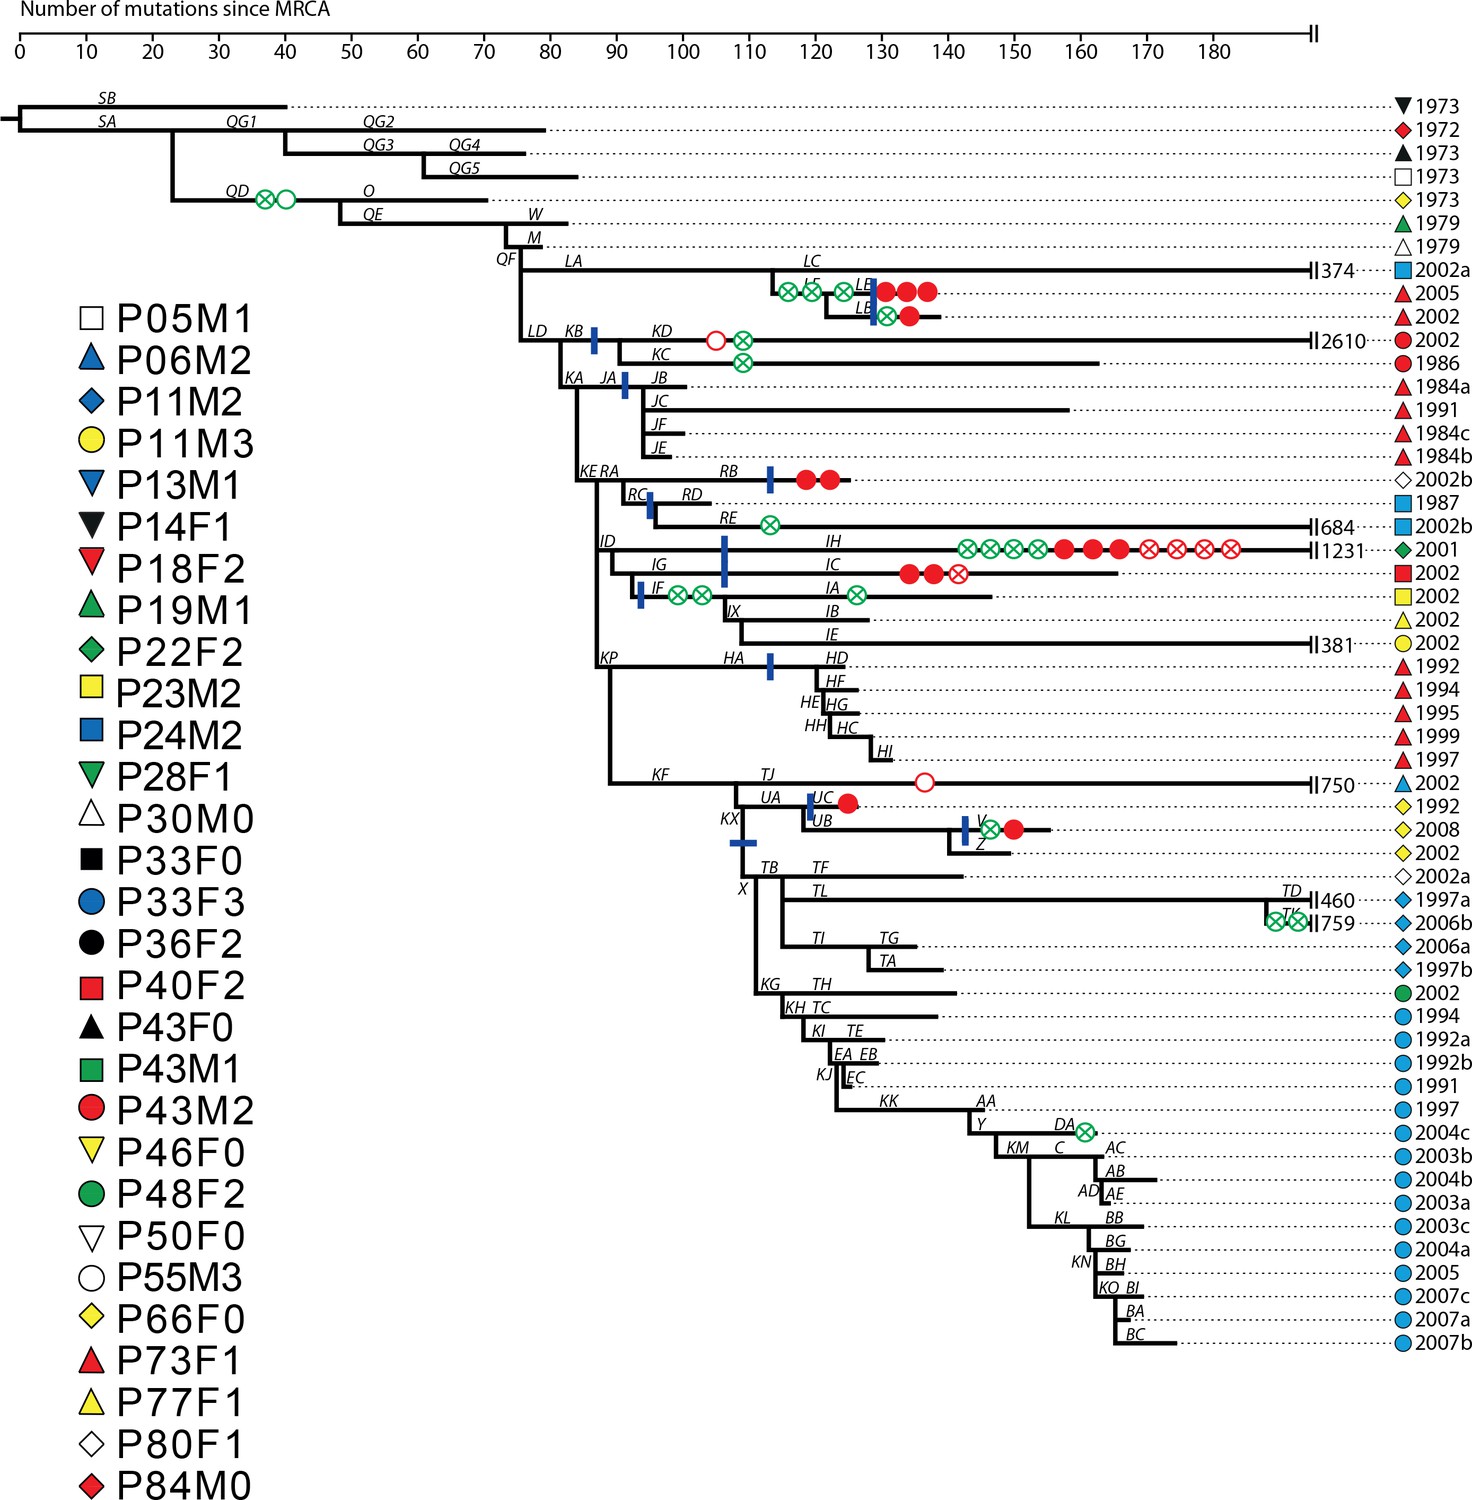
Phylogenetic tree of DK2 samples, adapted from (Marvig et al., 2013).
Pheno- and genotypes highlighted as in Appendix 1—figure 3.
Appendix 1—figure 5
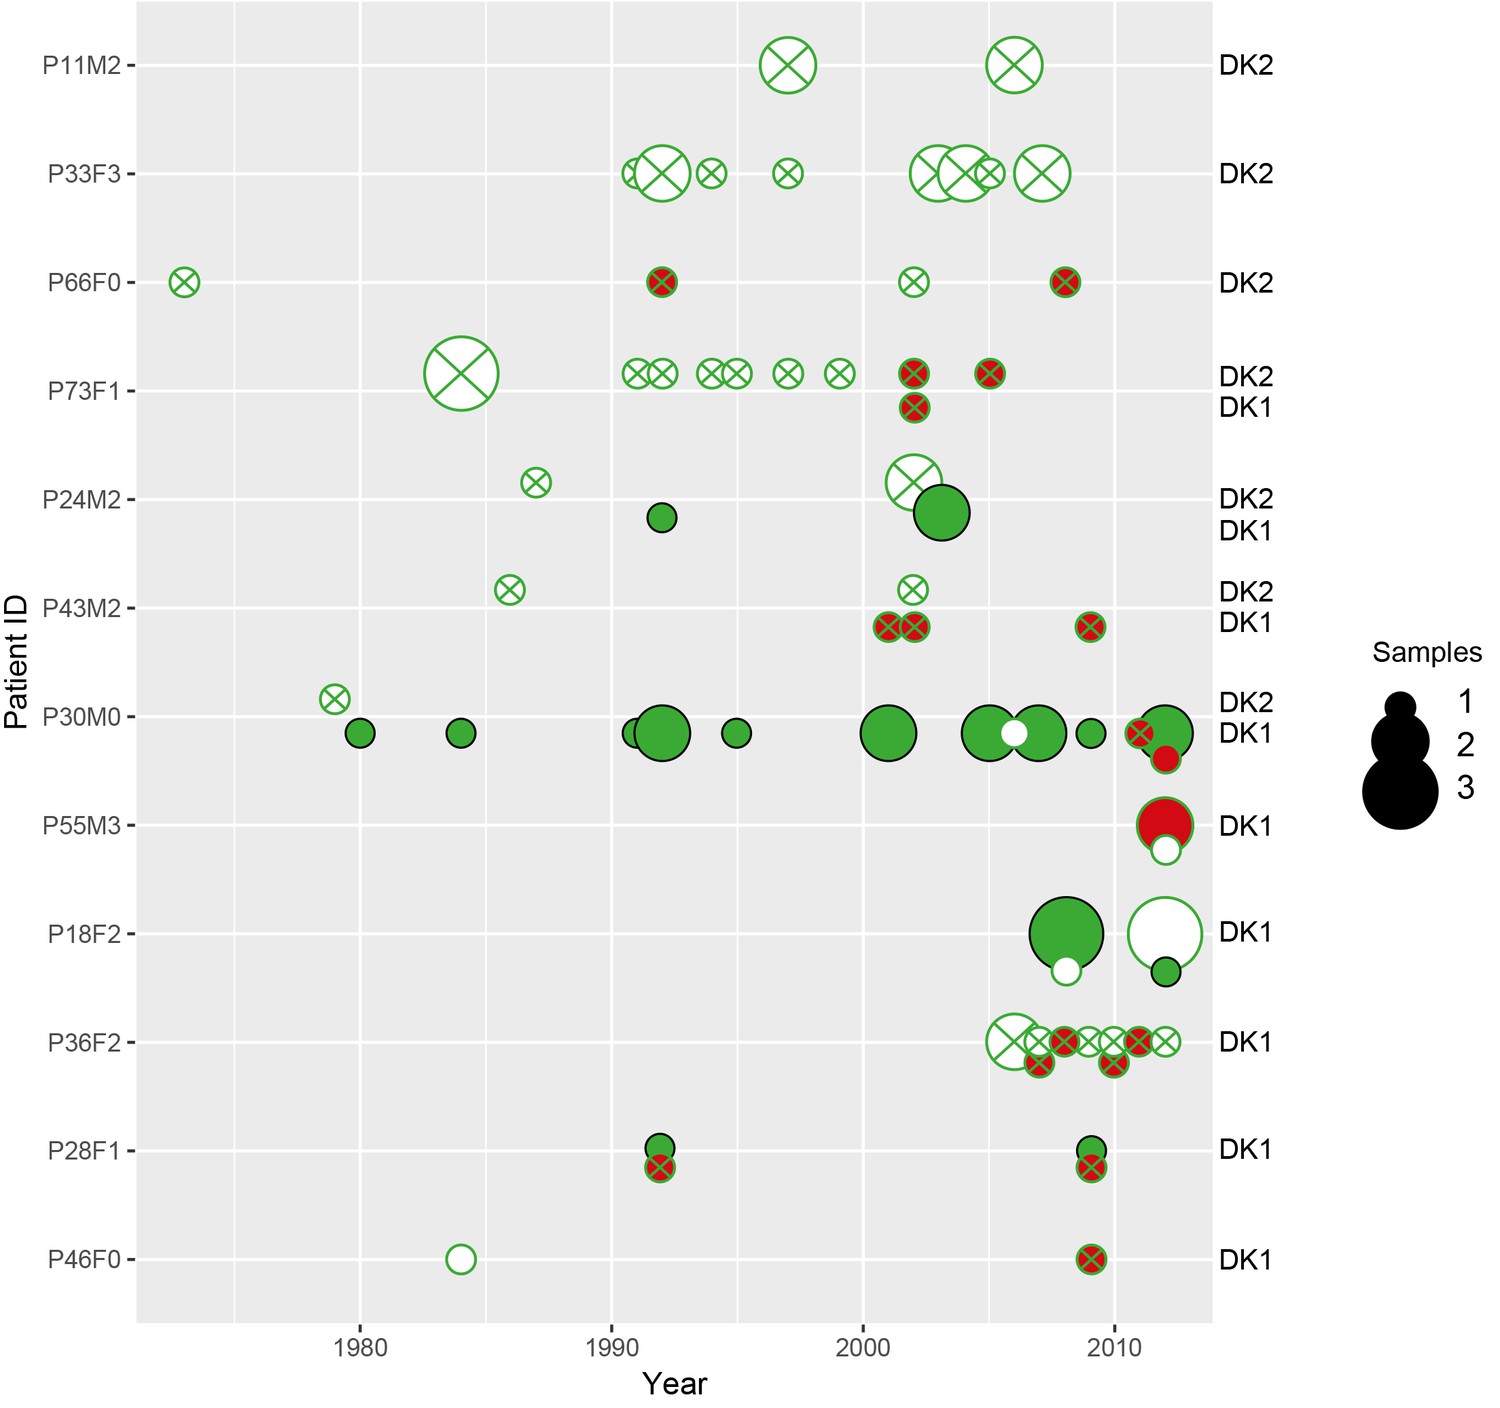
Phenotypes of longitudinally sampled DK1 and DK2 lineages.
Size of circle denotes the number of samples (1-3). WT-like isolates that produce pyoverdine are shown as a full green circle, non-producers in white with a green stroke, pyoverdine receptor mutations with a green cross and phu-upregulation by phuS//phuR mutations is shown with red. Created with ggplot2 in R (R Core Team, 2013; Wickham, 2016).
Appendix 1—figure 6

Phenotypes of co-occurring clone types in two patients from the children’s collection.
Phenotypes as in Appendix 1—figure 5. Size of circle denotes the number of samples (1, 2 and 4). On the x-axis years since colonization. Note that patient P36F2 is shown in both Appendix 1—figures 5 and 6.
Appendix 1—figure 7
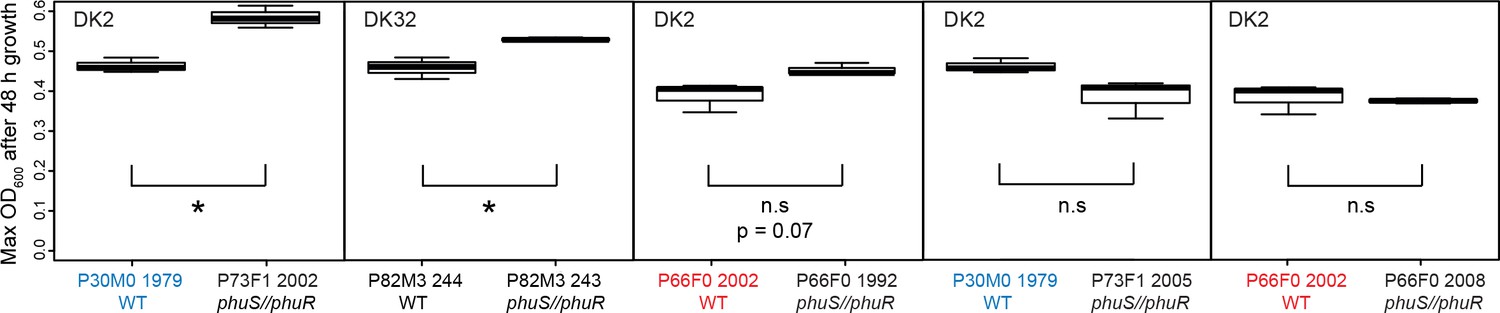
Growth of pairs of clinical isolates with and without phuS//phuR mutations.
Isolates were grown in iron-limited media with 5 μM heme added. Pairs where the same WT isolate is used because of two independent acquisitions of phuS//phuR mutations are highlighted in red and blue. Boxplots show median value of three biological replicates, and the interquartile range ±25%. * marks a significant difference. Plotted in R (R Core Team, 2013; Wickham, 2016).
Tables
Table 1
Main iron uptake systems of P. aeruginosa.
The pyoverdine and pyochelin systems produce siderophores which can steal Fe3+from host carriers. The conditionally cooperative has system produces a hemophore that can bind to heme, or hemoglobin that contains heme. The phu and feo systems are private. All systems have a specific receptor and uptake feeds back to increase system expression. The illustration shows a receptor in the cell membrane taking up an iron source (star). In a cooperative system a secreted public good (circle) binds the target and is taken up by the receptor, whereas a private system takes up the iron source directly.
| System | Mechanism | Social status | Target | Illustration |
|---|---|---|---|---|
| Pyoverdine | Public good; siderophore and specific receptor | Cooperative | Fe3+, host-bound | 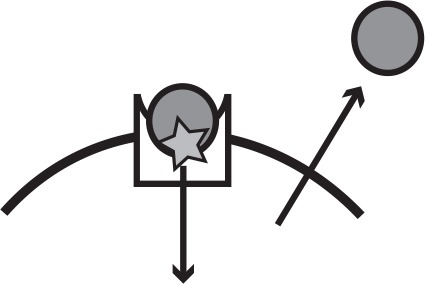 |
| Pyochelin | Public good; siderophore and specific receptor | Cooperative | Fe3+, host-bound | |
| has | Public good; hemophore and specific receptor | Conditionally cooperative or private | Heme, hemoglobin | |
| phu | Specific receptor | Private | Heme, hemoglobin |  |
| feo | Specific receptor | Private | Fe2+ |
Additional files
-
Supplementary file 1
Tables with Supplementary Information.
(A) Calculation of estimated generation times of infecting clone types. For each, the patient ID, clone type, length of infection in years and minutes, estimated doubling time and calculated number of generations is given. A doubling time of 74 min was used for clonal lineages infecting for less than 6 years, 83 min for 6–24 years and 109 min for >24 years based on the measurements of Yang et al. (2011). This is, to our knowledge, the best available for CF conditions. (B) Overview of patients and isolates. For each patient is given the ID, the number of samples, the year of first sample, the extent of sampling in years, whether pyoverdine non-producers were sampled, the number of clone types sampled, and the clone type name(s). (C) List of mutations in genes associated with iron metabolism. For each isolate, the patient ID, clone type and mutations are listed. A //denotes an intergenic mutation. The isolate names refer to previous descriptions (Andersen et al., 2015; Markussen et al., 2014; Marvig et al., 2015). The six DK1 isolates that were not included in the previous analysis of pyoverdine mutations had one ns SNP in pvdL (A5702G) and one in pvdP (C1508T, patient P55M3, isolate TM50 and TM51). The six isolates used in the phenotypic assay of phuS//phuR mutations are highlighted in yellow. (D) Summary of the mutations found in five different iron uptake systems in P. aeruginosa. The size of the respective systems is given in kb, and mutations are listed as non-synonymous (ns) SNPs, synonymous (syn) SNPs, insertions and deletions (indels) and intergenic (IG). The overall mutations, and ns SNPS and indels, per kb are listed. The phu operon experienced the highest mutation rate, dominated by intergenic mutations. Two genes in the has operon were poorly sequenced in the majority of isolates, and this is taken into account in the size and mutations listed in parentheses. (E) Mutations identified in pyoverdine over-producers that may contribute to this phenotype. For each mutation, the patient ID, clone type and gene is listed, as well as a reference to previous work showing a link between the gene and pyoverdine production (Frangipani et al., 2014; Ochsner et al., 2002; Stintzi et al., 1998; Visaggio et al., 2015; Wu et al., 2004). (F) Transitions between iron uptake systems characterized as the order in which mutations accumulate. When a clear order of mutations could be established the observed and expected number of transitions, given a Poisson distribution, is stated and whether the difference between them is statistically significant. (G) Results of Tukey HSD post hoc comparison of a Two-Way ANOVA analysing the difference in Max OD600 between an isogenic pair of isolates differing in a phuS//phuR mutation at four different heme concentrations.
- https://doi.org/10.7554/eLife.38594.009
-
Transparent reporting form
- https://doi.org/10.7554/eLife.38594.010
Download links
A two-part list of links to download the article, or parts of the article, in various formats.
Downloads (link to download the article as PDF)
Open citations (links to open the citations from this article in various online reference manager services)
Cite this article (links to download the citations from this article in formats compatible with various reference manager tools)
Privatisation rescues function following loss of cooperation
eLife 7:e38594.
https://doi.org/10.7554/eLife.38594


