Deletion of KCNQ2/3 potassium channels from PV+ interneurons leads to homeostatic potentiation of excitatory transmission
- University of Connecticut, United States
- Baylor College of Medicine, United States
Figures
Figure 1
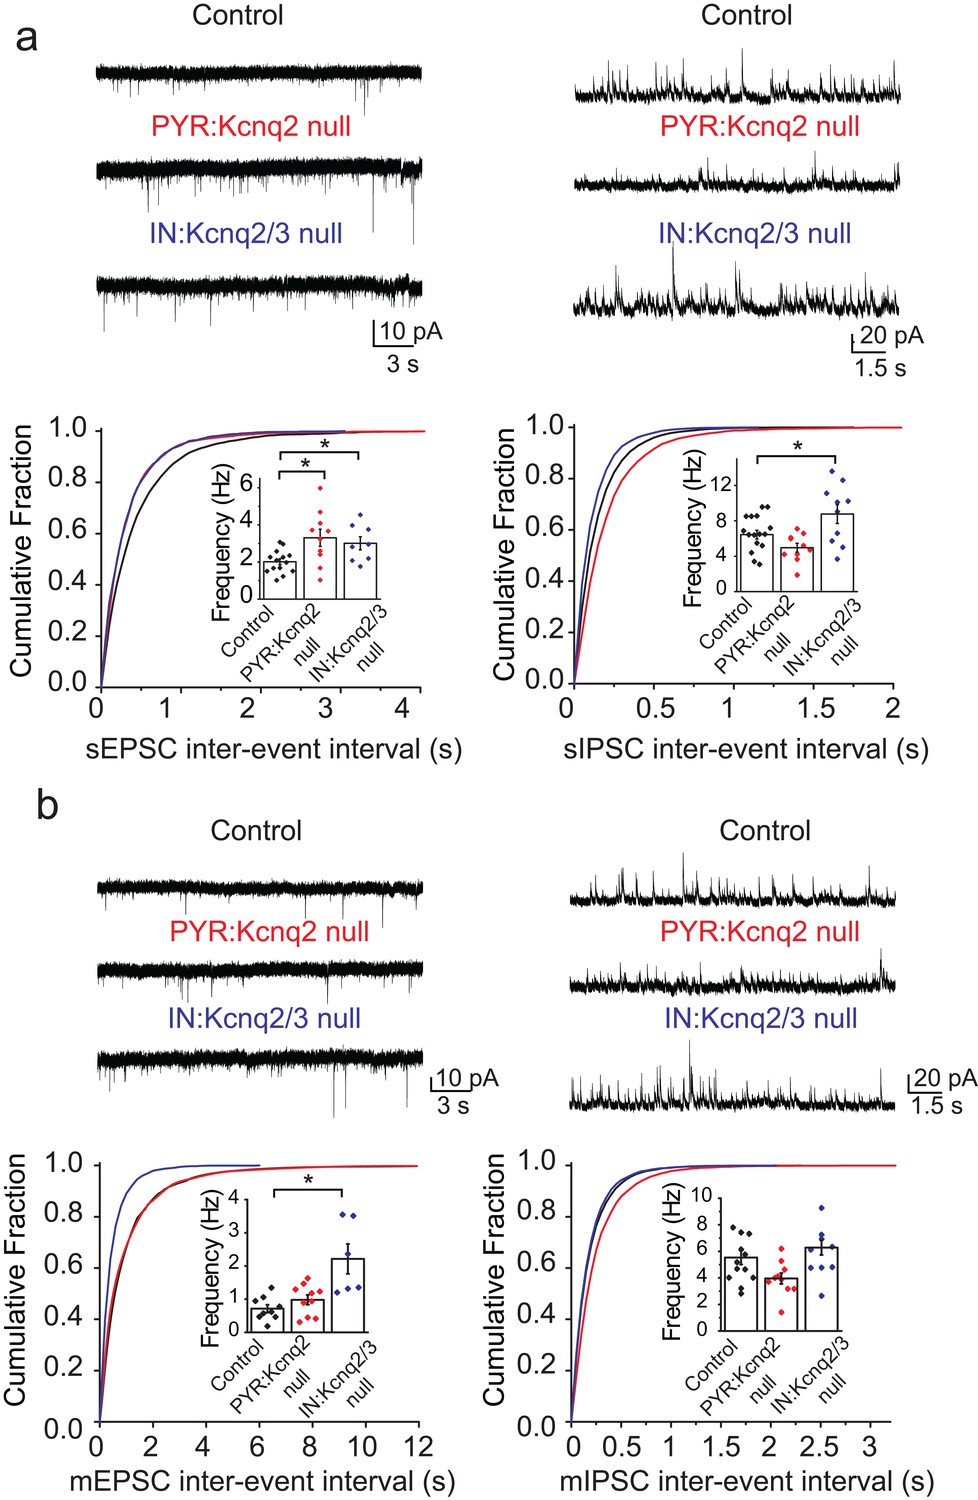
Ablation of Kcnq2/3 channels from PV+/SST+interneurons leads to increased excitatory transmission.
(a) Top, representative sEPSC and sIPSC traces recorded from mouse CA1 pyramidal neurons (P15–P19) in acute hippocampal slices from control (number of animals = 8) and either Kcnq2/3 interneuron (IN:Kcnq2/3 null; number of animals = 4) or Kcnq2 pyramidal neuron conditional knockout (PYR:Kcnq2 null; number of animals = 3) mice. Bottom, cumulative distribution plots of sIPSC and sEPSC inter-event intervals recorded in pyramidal neurons of IN:Kcnq2/3 null and PYR:Kcnq2 null mice. Insets: summary graphs of average inter-event frequency. Statistical comparisons were performed with a one-way analysis of variance (ANOVA; p<0.05) followed by a Fisher LSD post-hoc test (*: p<0.05, **: p<0.001). For comparing sEPSC frequency: ANOVA F(2,29) =5.168, p=0.012; for control vs. PYR:Kcnq2 null p=0.0051; for control vs. IN:Kcnq2/3 null p=0.038. (b) Top, representative mEPSC and mIPSC traces recorded from mouse CA1 pyramidal neurons from control (number of animals = 6), IN:Kcnq2/3 null (number of animals = 3) or PYR:Kcnq2 null (number of animals = 4) mice, respectively. Bottom, cumulative distribution plots of mIPSCs and mEPSCs inter-event intervals recorded in pyramidal neurons of IN:Kcnq2/3 null and PYR:Kcnq2 null mice. Insets: summary graphs of average inter-event frequency. Statistical comparisons were performed with one-way ANOVA followed by Fisher LSD post-hoc test (*: p<0.05, **: p<0.001). For comparing sEPSC frequency ANOVA F(2,22) =10.74, p=0.0006; for control vs. PYR:Kcnq2 null p=0.3764; for control vs. IN:Kcnq2/3 null p=0.0002. Each data point represents recording from one pyramidal neuron. Data in summary graphs are represented as mean and s.e.m.
-
Figure 1—source data 1
Source data for Figure 1.
- https://doi.org/10.7554/eLife.38617.003
Figure 2 with 3 supplements

Loss of KCNQ2/3 activity leads to increased excitability of PV+interneurons.
(a) Top, representative voltage responses from a +150 pA current injection step (1 s) in PV- and SST-like interneurons in either the CA1 region of the hippocampus (P12–P17) or L2/3 of the somatosensory cortex (P8–P11). For L2/3 recordings, cells were also confirmed by immunoreactivity against SST antibodies. Bottom, summary graphs showing the effect of deleting KCNQ2 and KCNQ3 channels on action potential number from CA1 PV-like (control n = 8/6; IN:Kcnq2/3 null n = 8/5), SST-like (control n = 19/8; IN:Kcnq2/3 null n = 8/4), and L2/3 (PV-like: control n = 10/7; IN:Kcnq2/3 null n = 8/4; SST-like: control n = 10/6; IN:Kcnq2/3 null n = 5/4) interneurons (Vh=-75 to −77 mV). For CA1 PV-like cells (P16–P25), F(9,126)=2.849, p=0.0043; for L2/3 PV-like cells, F(9,144)=3.845, p=0.0002); for CA1 SST-like cells (P15–P19), F(9,225)=0.601, p=0.7955; and for L2/3 SST-like cells, F(9,117)=0.326, p=0.965. Significance was determined using a two-factor mixed ANOVA. See Figure 2—figure supplement 1 showing that indeed SST cells express KCNQ2 and KCNQ3 mRNA. (b) Top, representative voltage responses to a series of current injection steps (1 s) in PV+ and SST+ interneurons in the CA1 region of the hippocampus (Vh=-75 to −77 mV). Bottom left, summary graph showing the effect of deleting KCNQ2 and KCNQ3 channels on action potential number from CA1 PV+ cells (control n = 15/8; PV:Kcnq2/3 null n = 14/7; F(9,243)=3.558 with p=0.0004). Middle left, summary graph showing that loss of KCNQ2/3 channels decreases PV+ input resistance (control, n = 15/8; PV:Kcnq2/3 null, n = 14/7; df = 27 t=−2.54 p=0.017 unpaired Student’s t-test). See also Figure 2—figure supplement 2 regarding PV+ Kcnq2/3 null neurons diversity of intrinsic properties. Middle right, summary graph showing the effect of deleting KCNQ2 and KCNQ3 channels on action potential number from CA1 SST+ cells (control n = 6/2; SST:Kcnq2/3 null n = 8/4; F(9,108)=0.729 with p=0.6814). Bottom right, summary graph showing loss of KCNQ2/3 channels did not decrease SST+ input resistance (control n = 6/2; SST:Kcnq2/3 null, n = 8/4; df = 12 t=−0.42 p=0.68 unpaired Student’s t-test). ‘n’ designates number of cells followed by number of animals. Each data point represents recording from one neuron. Data in summary graphs are represented as mean and s.e.m.
-
Figure 2—source data 1
Source data for Figure 2.
- https://doi.org/10.7554/eLife.38617.010
Figure 2—figure supplement 1
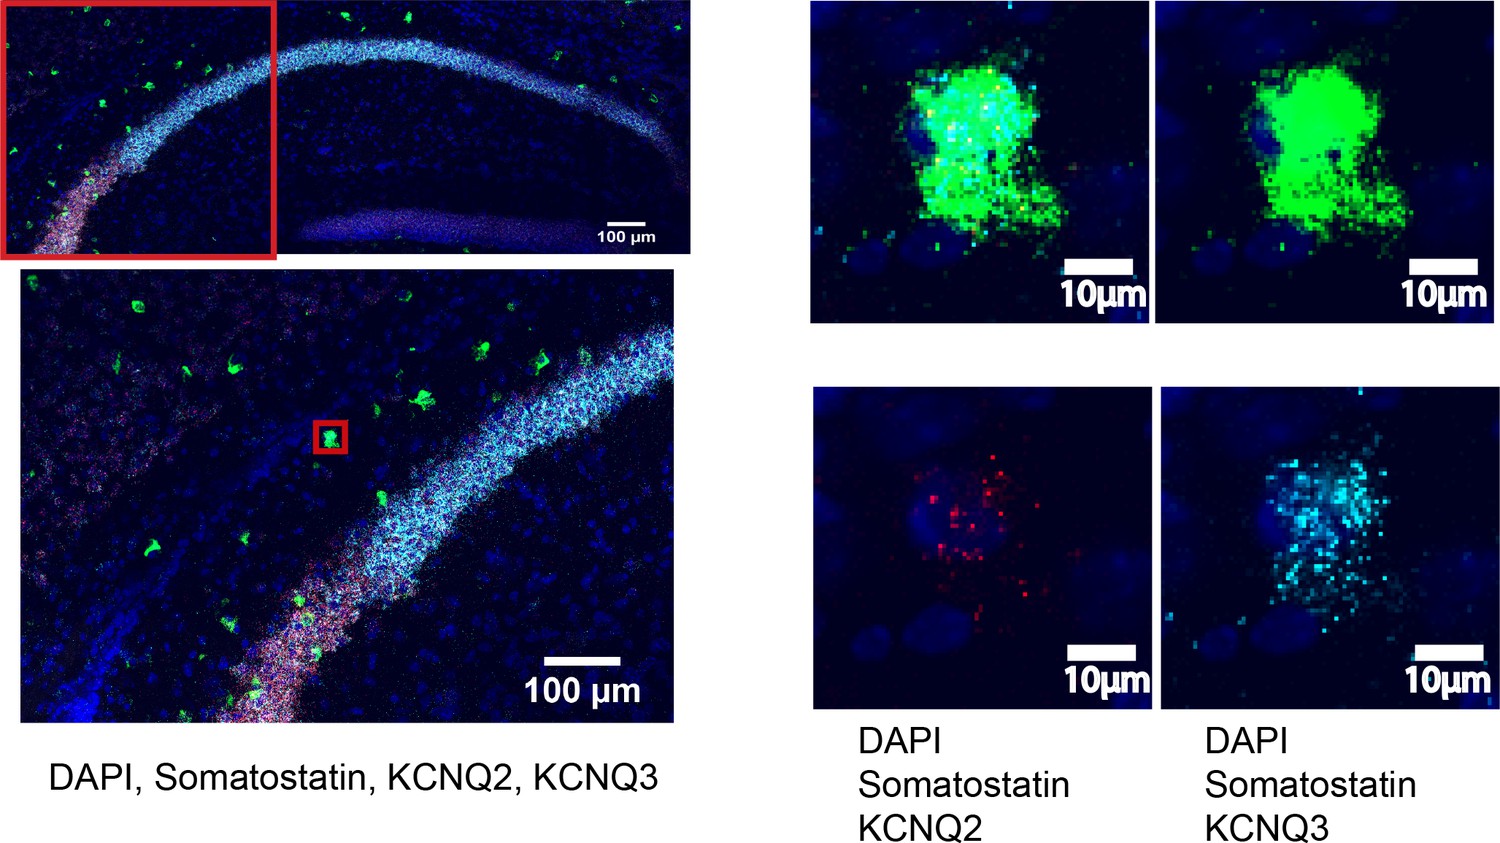
FISH shows presence of KCNQ2 and KCNQ3 in SST+interneurons.
Confocal micrographs of coronal sections of CA1 region of wild-type mice. Micrographs shows co-localization of mRNA for somatostatin, KCNQ2 and KCNQ3. All micrographs have been counterstained with DAPi (blue).
Figure 2—figure supplement 2

PV:Kcnq2/3 null interneurons could differ in their intrinsic excitability properties.
Top, representative voltage responses to a series of current injection steps (1 s) in PV+ interneurons in the CA1 region of the hippocampus (P16–P25). We found that Kcnq2/3 null PV+ interneurons could exhibit two intrinsic excitability behaviors. Type I that has a sag ratio of 0.9 and greater, similar to control neurons, and type II that has a sag ratio of 0.8 or less. Excluding type II cells (red; as in Figure 2b) or including all types of cells (blue) as shown here, it did not change the conclusions of this work. The lower sag ratio might indicate immature PV+ cells, however, other possibilities cannot be excluded at this point.
-
Figure 2—figure supplement 2—source data 1
Source data for Figure 2—figure supplement 2.
- https://doi.org/10.7554/eLife.38617.007
Figure 2—figure supplement 3
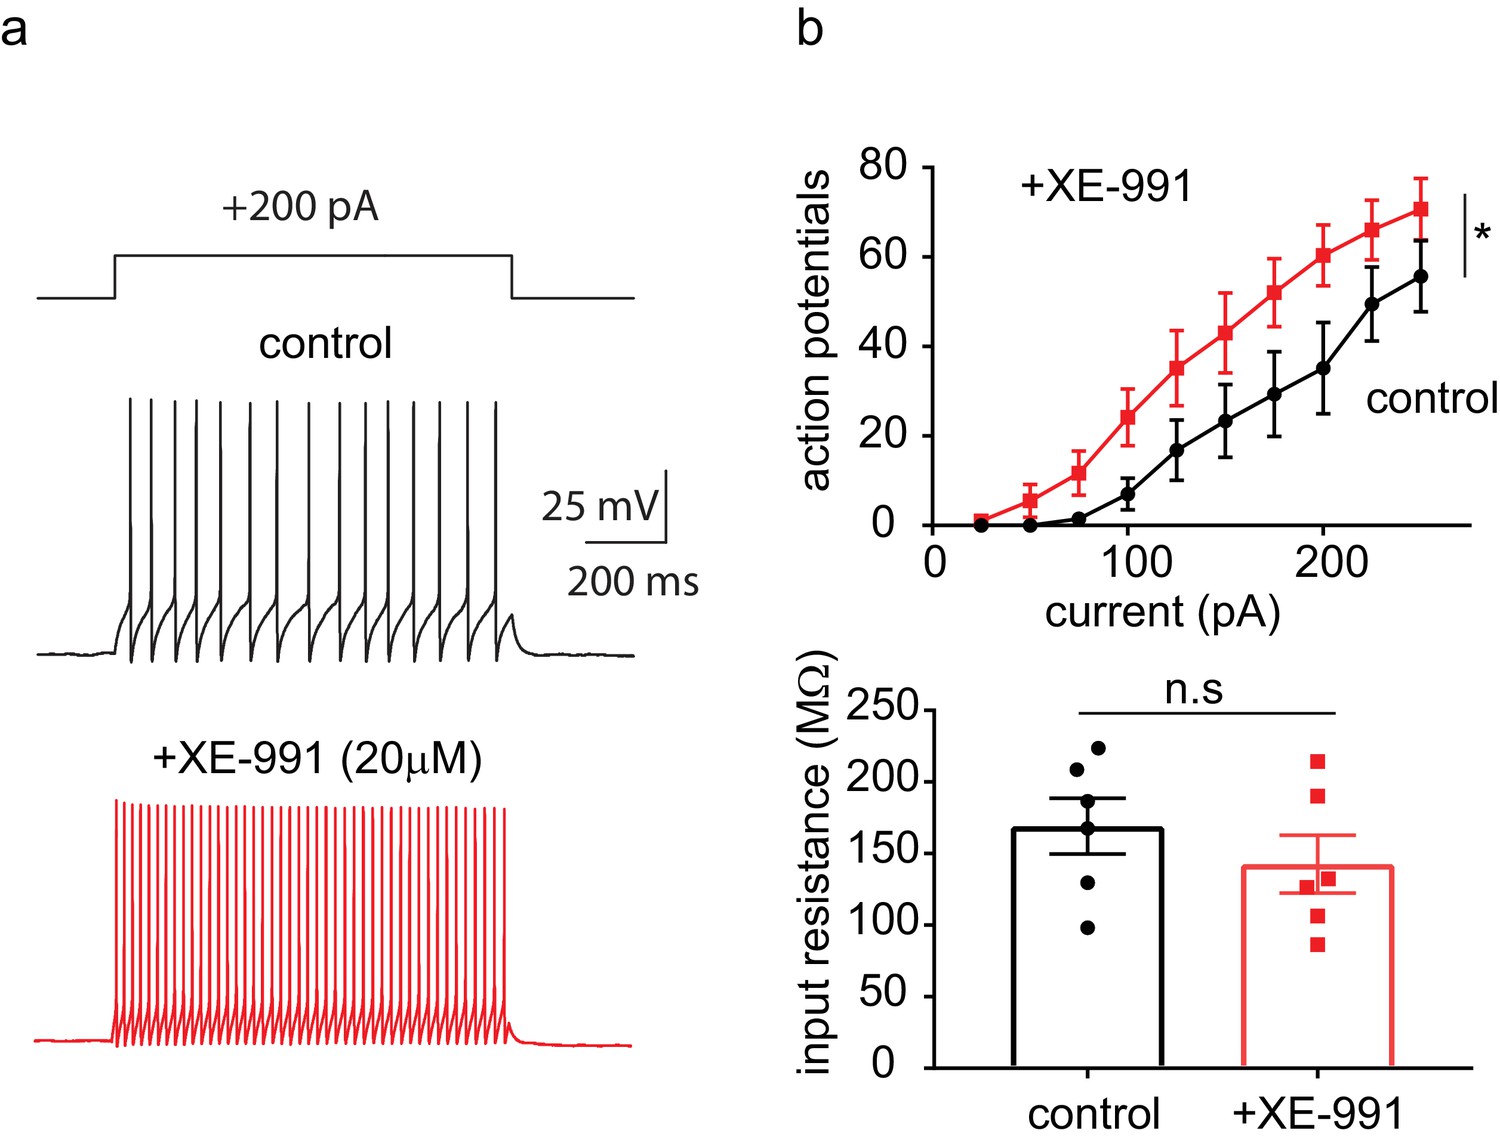
The pan-KCNQ blocker XE991 increases PV+interneuron excitability.
Left, representative voltage responses from a + 200 pA current injection step (1 s; Vh=-75 to −77 mV) in PV+ interneurons (Pvalb-Cre;Kcnq2+/+;Ai9) from the CA1 region of the hippocampus (P23–P25) before and after application of 20 μM XE-991 (15 min application). Right, summary graphs showing the of XE-991 on action potential number (n = 6/3; F(1,5)=38.379, p=0.0016) and input resistance (control 169 ± 20 MΩ,+XE-991 143 ± 20 MΩ, n = 6/3; t = 1.355 df = 5 p=0.2335). Significance was determined using two-way factor repeated measures ANOVA and two-tailed paired Student’s t-test for action potential number and input resistance, respectively.
-
Figure 2—figure supplement 3—source data 1
Source data for Figure 2—figure supplement 3.
- https://doi.org/10.7554/eLife.38617.009
Figure 3
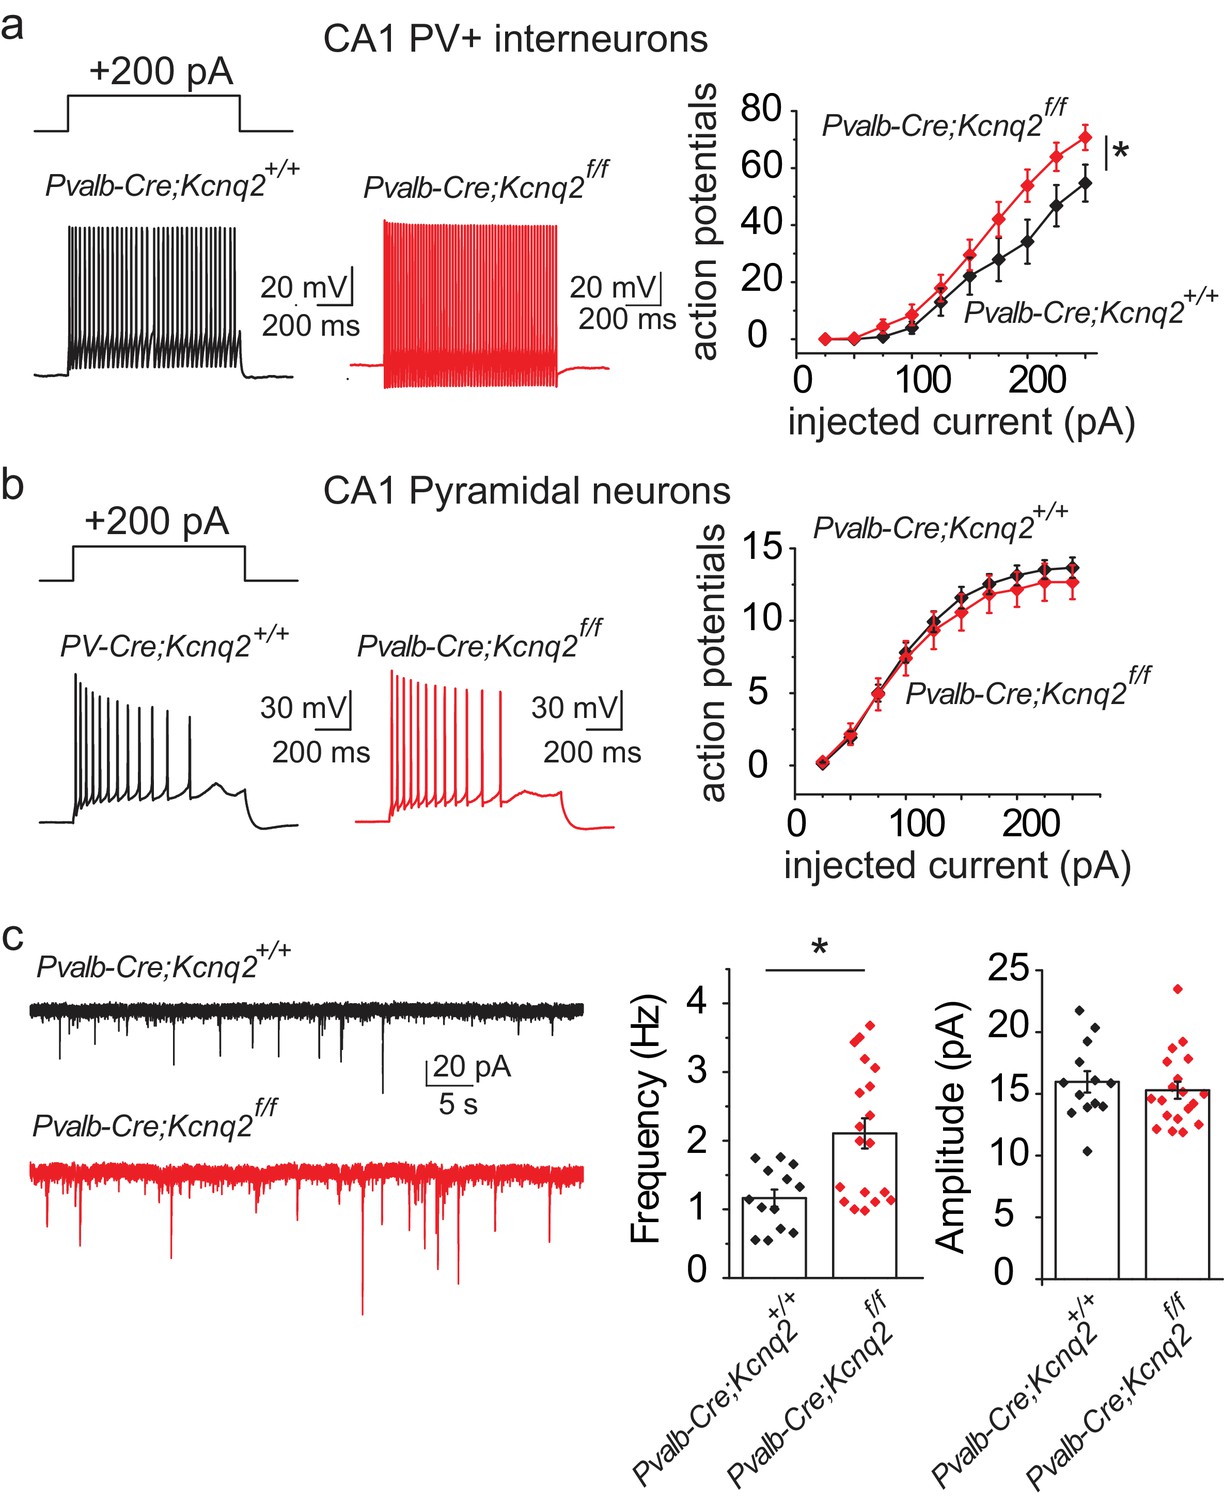
Ablation of Kcnq2 from PV+ interneurons leads to increased excitatory transmission in pyramidal neurons.
For simplicity we refer Pvalb-Cre;Kcnq2;Ai9 mice in the figure as Pvalb-Cre;Kcnq2f/f or Pvalb-Cre;Kcnq2+/+. (a) Left, representative voltage responses from a + 200 pA current injection step (1 s; Vh= −75 to −77 mV) in PV+ interneurons from the CA1 region of the hippocampus (P23–P25). Right, summary graph showing the effect of deleting Kcnq2 on action potential number from PV+ interneurons (Pvalb-Cre;Kcnq2+/+;Ai9 n = 15/4; Pvalb-Cre;Kcnq2f/f;Ai9 n = 14/3; F(9,243)=3.558, p=0.0004). Significance was determined using a two-factor mixed ANOVA. (b) Left, representative voltage responses from a + 200 pA current injection step (1 s; Vh=-75mV) in pyramidal neurons from the CA1 region of the hippocampus (P30–P32). Right, summary graph showing the effect of deleting Kcnq2 from pyramidal neurons in action potential number (Pvalb-Cre;Kcnq2+/+;Ai9 n = 15/3; Pvalb-Cre;Kcnq2f/f;Ai9 n = 12/2; F(9,225)=0.4891, p=0.88). Significance was determined using a two-factor mixed ANOVA. (c) Left, representative sEPSC traces recorded from CA1 pyramidal neurons (P32–P35) in acute hippocampal slices from control and Kcnq2 null PV+ interneurons. Right, summary bar graphs of sEPSC frequency (Pvalb-Cre;Kcnq2+/+;Ai9 1.165 ± 0.12 Hz, n = 13/4; Pvalb-Cre;Kcnq2f/f;Ai9: 2.108 ± 0.22 Hz, n = 19/3; p=0.0098 Mann-Whitney test) and amplitude (Pvalb-Cre;Kcnq2+/+;Ai9 15.9 ± 0.86 pA, n = 13/4; Pvalb-Cre;Kcnq2f/f;Ai9: 15.3 ± 0.68 pA, n = 19/3; DF = 30 t = 0.62 p=0.5394). Statistical comparisons were performed with two-tailed unpaired Student’s t-test or Mann-Whitney when the variance between the two groups was significantly different. ‘n’ designates number of cells followed by number of animals. Each data point represents recording from one neuron. Data in summary graphs are represented as mean and s.e.m.
-
Figure 3—source data 1
Source data for Figure 3.
- https://doi.org/10.7554/eLife.38617.012
Figure 4
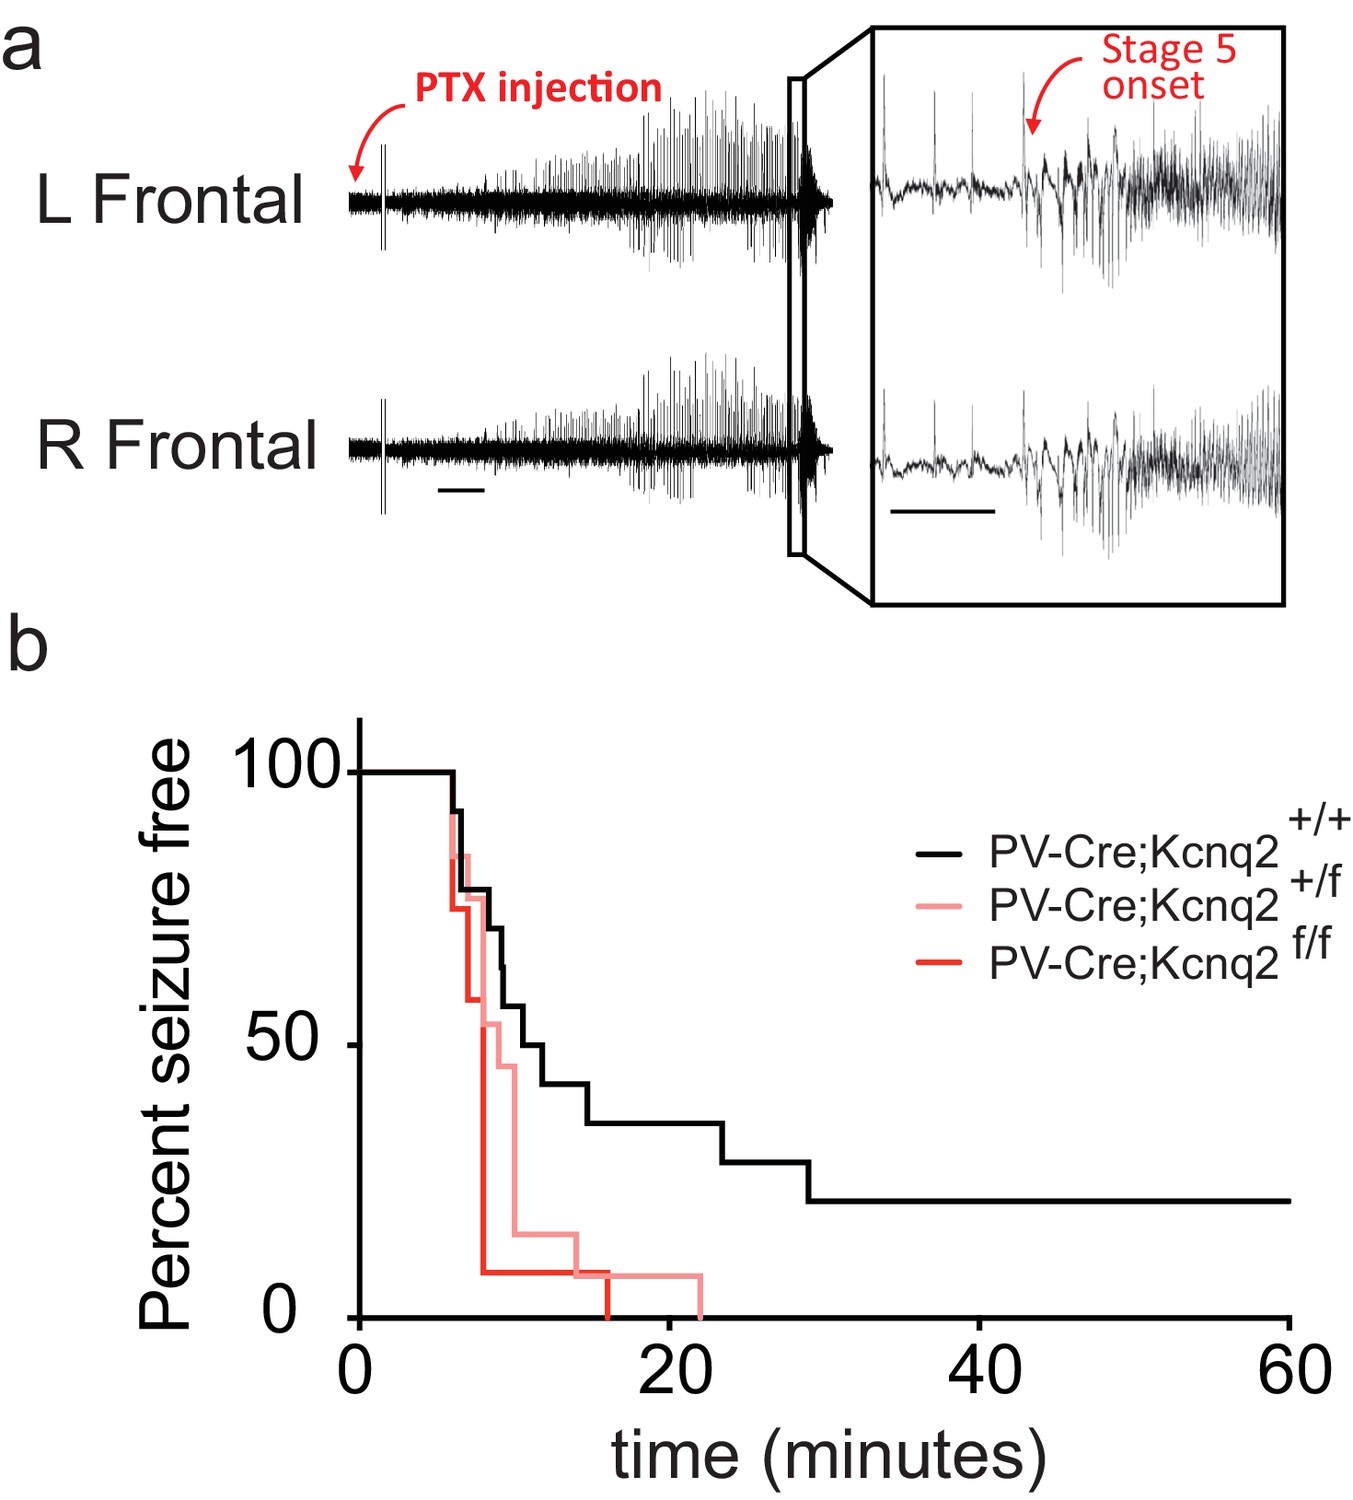
In vivo hyperexcitability with loss of Kcnq2 in PV-expressing interneurons.
(a) Using simultaneous video-EEG monitoring, Stage five onset was defined as the latency to rearing and falling with forelimb clonus, associated with bilateral epileptiform activity on EEG. (b) Loss of one or both Kcnq2 alleles in PV-expressing interneurons led to significantly reduced latency to seizure-onset (p=0.0370 and p=0.0047, respectively, Log-rank (Mantel-Cox) test; Pvalb-cre;Kcnq2+/+ n = 14; Pvalb-cre;Kcnq2f/+ n = 13; Pvalb-cre;Kcnq2f/f n = 12). ‘n’ designates number of animals. Bar = 1 min, inset, 5 s.
-
Figure 4—source data 1
Source data for Figure 4.
- https://doi.org/10.7554/eLife.38617.014
Tables
Key resources table
| Reagent type (species) or resource | Designation | Source or reference | Identifiers | Additional information |
|---|---|---|---|---|
| Gene (Mus musculus) | Kcnq2 | NA | NCBI_Gene:16536; MGI:1309503 | |
| Gene (Mus musculus) | Kcnq3 | NA | NCBI_Gene:110862; MGI:1336181 | |
| Strain, strain background (M. musculus, Emx1IRESCre, C57BL/6J background) | B6.129S2-Emx1tm1(cre)Krj /J | PMID: 12151506 | RRID:IMSR_JAX:005628 | |
| Strain, strain background (M. musculus, Nkx2.1-Cre, C57BL/6J background) | C57BL/6J-Tg (Nkx2-1-cre)2Sand/J | PMID: 17990269 | RRID:IMSR_JAX:008661 | |
| Strain, strain background (M. musculus, Sst-IRES-Cre, C57BL/6J background) | Ssttm2.1(cre)Zjh/J | PMID: 21943598 | RRID:IMSR_JAX:013044 | |
| Strain, strain background (M. musculus, Pvalb-Cre, C57BL/6J background) | B6;129P2-Pvalbtm1(cre)Arbr/J | PMID: 15836427 | RRID:IMSR_JAX:008069 | |
| Strain, strain background (M. musculus, tdTomato reporter Ai9, C57BL/6J background) | B6.Cg-Gt(ROSA) 26Sortm9(CAG-tdTomato)Hze/J | PMID: 20023653 | RRID:IMSR_JAX:007909 | |
| Strain, strain background (M. musculus, Kcnq2f/f, C57BL/6J background) | Kcnq2f/f | PMID: 24719109 | N-A | |
| Strain, strain background (M. musculus, Kcnq3f/f, C57BL/6J background) | Kcnq3f/f | PMID: 24719109 | N-A | |
| Antibody | Alexa fluor 488 streptavidin | Invitrogen | Invitrogen:S32354; RRID:AB_2315383 | (1:500) |
| Antibody | anti-Lucifer yellow (rabbit polyclonal) | Invitrogen | Invitrogen:A5750; RRID:AB_2536190 | (1:500) |
| Antibody | anti-Somatostatin (rat monoclonal) | Millipore | Millipore:MAB354; RRID:AB_2255365 | (1:250) |
| Antibody | Alexa fluor 488 anti-rabbit secondary (goat polyclonal) | Invitrogen | Invitrogen:A11034; RRID:AB_2576217 | (1:500) |
| Antibody | Alexa fluor 647 anti-rat secondary (goat polyclonal) | Invitrogen | Invitrogen:A21247; RRID:AB_141778 | (1:500) |
| Sequence-based reagent | somatostatin mRNA probe (mouse); Mm-Sst-C1 | ACDBio | Cat#:404631 | (1:50) |
| Sequence-based reagent | parvalbumin mRNA probe (mouse); Mm-Pvalb-C1 | ACDBio | Cat#:421931 | (1:50) |
| Sequence-based reagent | tdTomato mRNA probe (mouse); Mm-tdTomato-C3 | ACDBio | Cat#:317041-C3 | (1:50) |
| Sequence-based reagent | Kcnq2 mRNA probe (mouse); Mm-Kcnq2-O1 | ACDBio; this paper | Cat#:300031-C2 | (1:50); custom made probe that targets exons 2–5 of Kcnq2 |
| Sequence-based reagent | Kcnq3 mRNA probe (mouse); Mm-Kcnq3-O1 | ACDBio; this paper | Cat#:300031-C3 | (1:50); custom made probe that targets exons 2–5 of Kcnq2 |
| Commercial assay or kit | RNAscope Fresh Frozen Multiplex Fluorescent kit | ACDBio | Cat#:320851 | |
| Chemical compound, drug | CNQX | Abcam | ab120017 | |
| Chemical compound, drug | D-AP5 | Abcam | ab120003 | |
| Chemical compound, drug | Picrotoxin | Abcam | ab120315 | |
| Chemical compound, drug | Tetrodotoxin; TTX | Abcam | ab120054 | |
| Chemical compound, drug | XE-991 | Abcam | ab120089 | |
| Chemical compound, drug | Lucifer Yellow | Sigma | Cat#:B4261 | (0.1%) |
| Chemical compound, drug | Biocytin | Molecular Probes | Cat#:L1177 | (0.05%) |
| Software, algorithm | Prism 7 | GraphPad | RRID:SCR_002798 | Version 7.03 |
| Software, algorithm | Clampfit 10 | Molecular Devices | RRID:SCR_011323 | |
| Software, algorithm | Minianalysis | Synaptosoft | RRID:SCR_002184 | |
| Software, algorithm | Origin 8 Pro | OriginLab | RRID:SCR_014212 | Version 8.0951 |
| Software, algorithm | ImageJ | NIH | RRID:SCR_003070 | Version 2.0.0 |
Additional files
-
Transparent reporting form
- https://doi.org/10.7554/eLife.38617.015
Download links
A two-part list of links to download the article, or parts of the article, in various formats.
Downloads (link to download the article as PDF)
Open citations (links to open the citations from this article in various online reference manager services)
Cite this article (links to download the citations from this article in formats compatible with various reference manager tools)
Deletion of KCNQ2/3 potassium channels from PV+ interneurons leads to homeostatic potentiation of excitatory transmission
eLife 7:e38617.
https://doi.org/10.7554/eLife.38617


