Sensorimotor pathway controlling stopping behavior during chemotaxis in the Drosophila melanogaster larva
- Centre for Genomic Regulation, The Barcelona Institute of Science and Technology, Spain
- Universitat Pompeu Fabra, Spain
- Howard Hughes Medical Institute, United States
- University of Zurich, Switzerland
- University of California, United States
- University of Cambridge, United Kingdom
- University of California Santa Barbara, United States
Figures
Figure 1 with 3 supplements
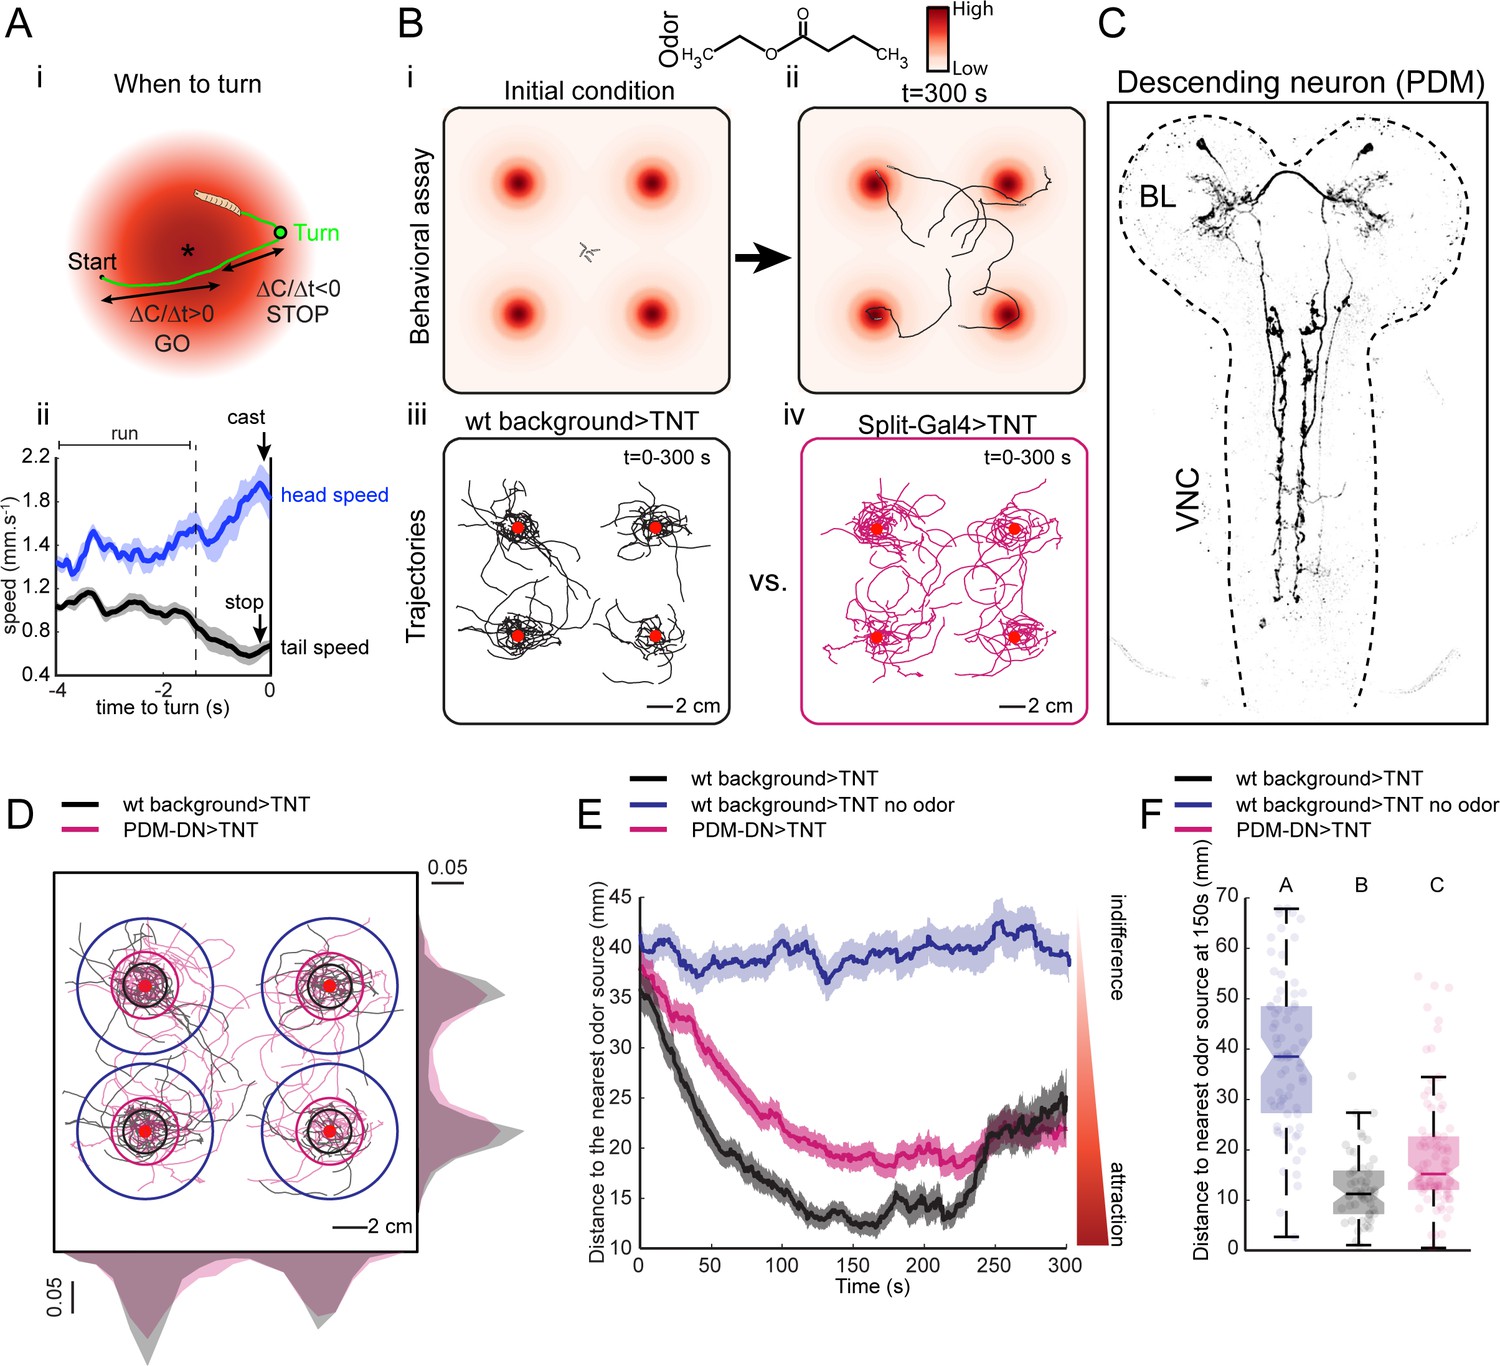
A loss-of-function behavioral screen using Split-Gal4 driver lines reveals a descending neuron that directs larval chemotaxis.
(A) Sensorimotor model for when-to-turn decision during larval chemotaxis. (Ai) During up-gradient runs (∆C/∆T > 0), stopping and turning maneuvers are suppressed. By contrast, stops and turns are promoted during down-gradient runs (∆C/∆T < 0). (Aii) Turn-triggered averages of the head and tail speeds (10 turning events). Prior to reorientation, larvae stop (indicated by a drop in average tail speed) and sample their environment through lateral head casts (reflected by an increase in average head speed). Shaded areas indicate SEM. (B) Behavioral assay used in the loss-of-function screen. (Bi-ii) Assay description: about 20 larvae at the third instar developmental stage are placed in the middle of a large square Petri dish covered with 4% agar. Four-odor droplets of 8 µl (concentration: 15 mM) are placed at equidistant positions inside the lid of the Petri dish (Figure 1—figure supplement 1). The assay is overlaid with a color map representing the numerically simulated odor gradient (see Materials and methods). Larvae are tracked for 300 s. (Biii-iv) Trajectories for the wild-type control (left, black traces) and a group of Split-Gal4 >TNT larvae (right, magenta traces). Red dots indicate the position of the odor droplets. (C) Anatomy of the olfactory descending neuron identified in the loss-of-function screen. This descending neuron is denoted PDM-DN in reference to the location of its cell body (see Figure 2). (D) Representative trajectories of PDM-DN-silenced larvae (magenta) superimposed onto the trajectories of wild-type control (black). Distributions of centroid positions along the x and y axes are displayed next to the corresponding axis. PDM-DN-silenced larvae disperse more widely around the odor source compared to the wild-type control. Circles with different colors indicate the average distances of larvae to the nearest odor source (black: wild-type background with odor; blue: wild-type background without odor; magenta: PDM-DN>TNT). Red dots indicate the positions of the four odor droplets. (E) Time course of the distances between the centroids of groups of larvae and their nearest odor source. On average, larvae with a loss-of-function of PDM-DN (magenta) are less efficient at locating the odor sources as reflected by the larger distance to the odor source. Shaded areas indicate SEM. (F) Distance to the nearest odor source quantified at 150 s (duration of time window: 1 s). Each point in the background of the boxplot represents an independent trajectory. Horizontal lines represent the median of each sample. Semi-transparent boxes represent the 25th and 75th percentiles. The whiskers extend to the most extreme data points excluding the outliers (default settings of the ‘boxplot’ function of Matlab_R2015b). Different letters indicate statistically significant difference (Wilcoxon rank-sum test, p<0.05 upon Bonferroni correction). Number of trajectories tested: n = 71 for wild-type control with no odor, n = 53 for wild-type control with odor and n = 85 for PDM-DN-silenced larvae. For more information about the statistics, see Supplementary file 1.
Figure 1—figure supplement 1
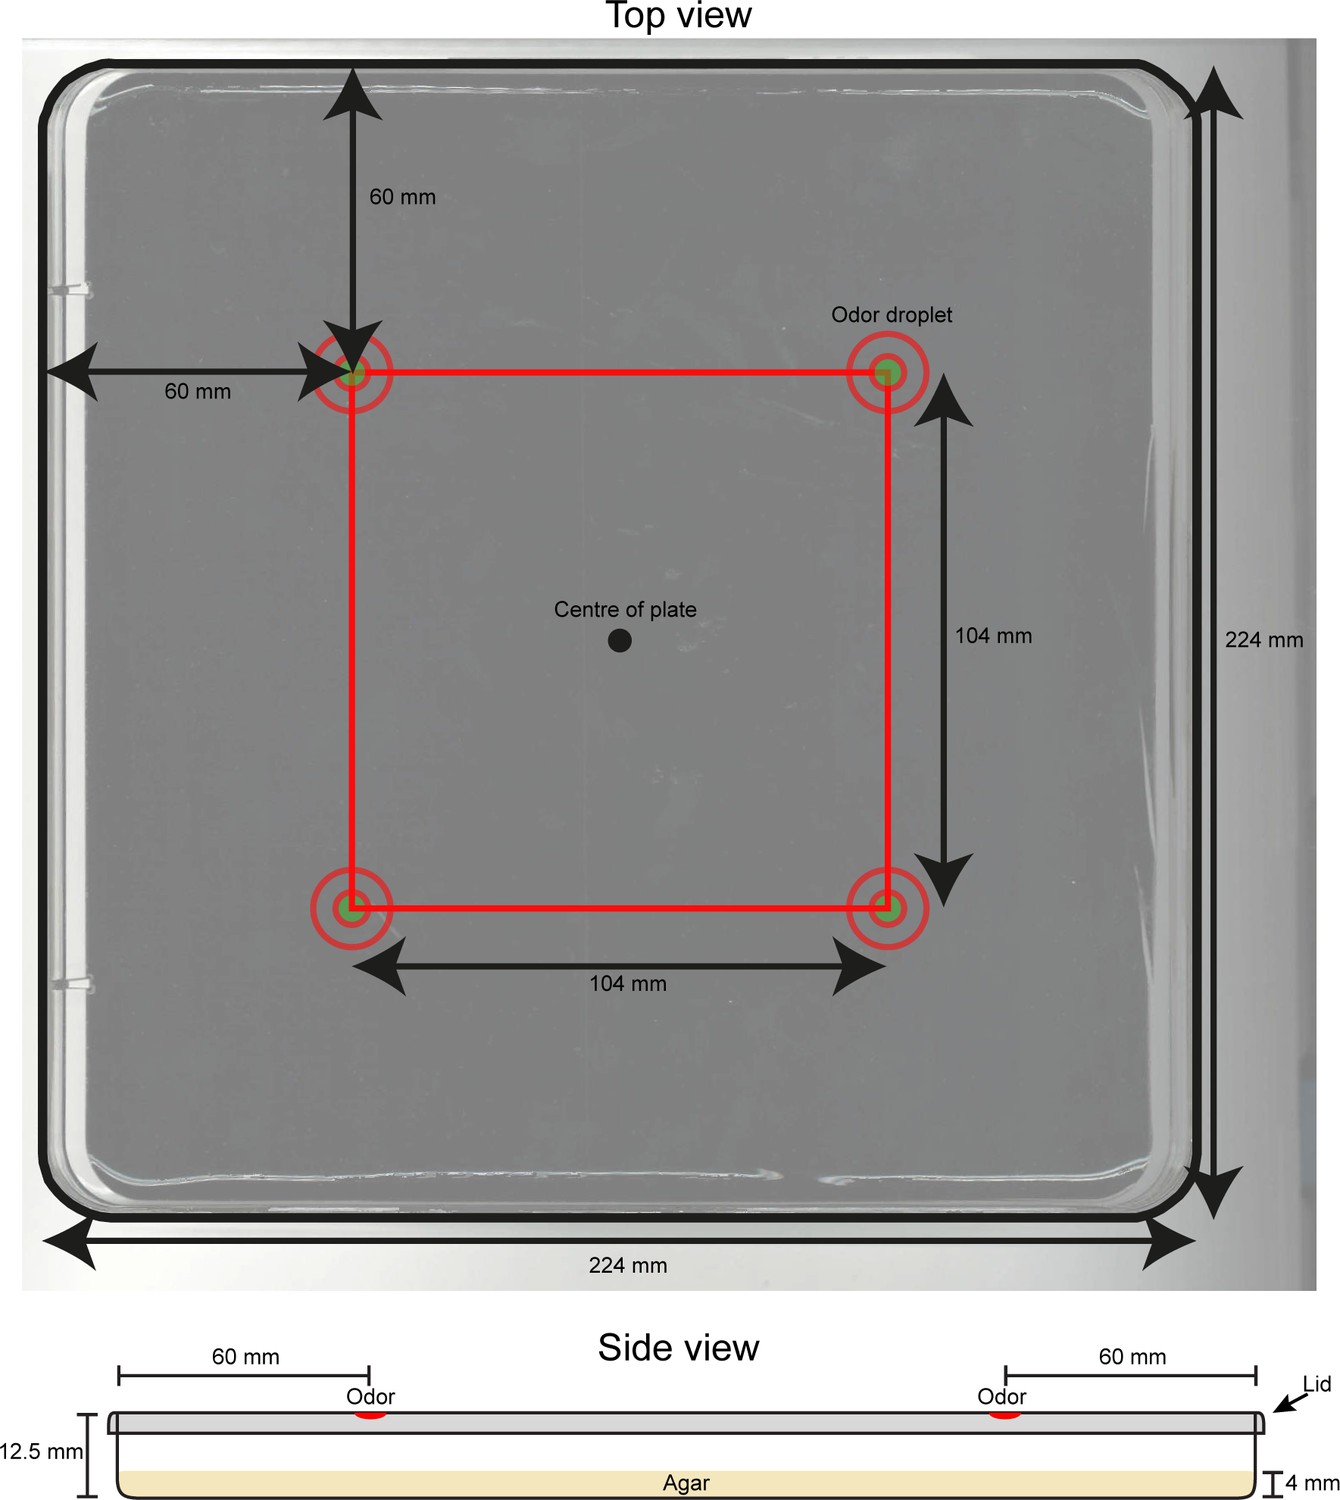
Technical drawing of the behavioral assay used for the loss-of-function behavioral screen.
(Top image) Dimensions and key features of the behavioral assay are reported in the annotated picture. At the beginning of each experiment, a group of ~20 larvae is placed near the center of the plate. (Bottom image) Schematic representation of the side view of the behavioral arena. Dimensions are indicated in mm. Odor droplets are placed 8.5 mm above the agar surface.
Figure 1—figure supplement 2
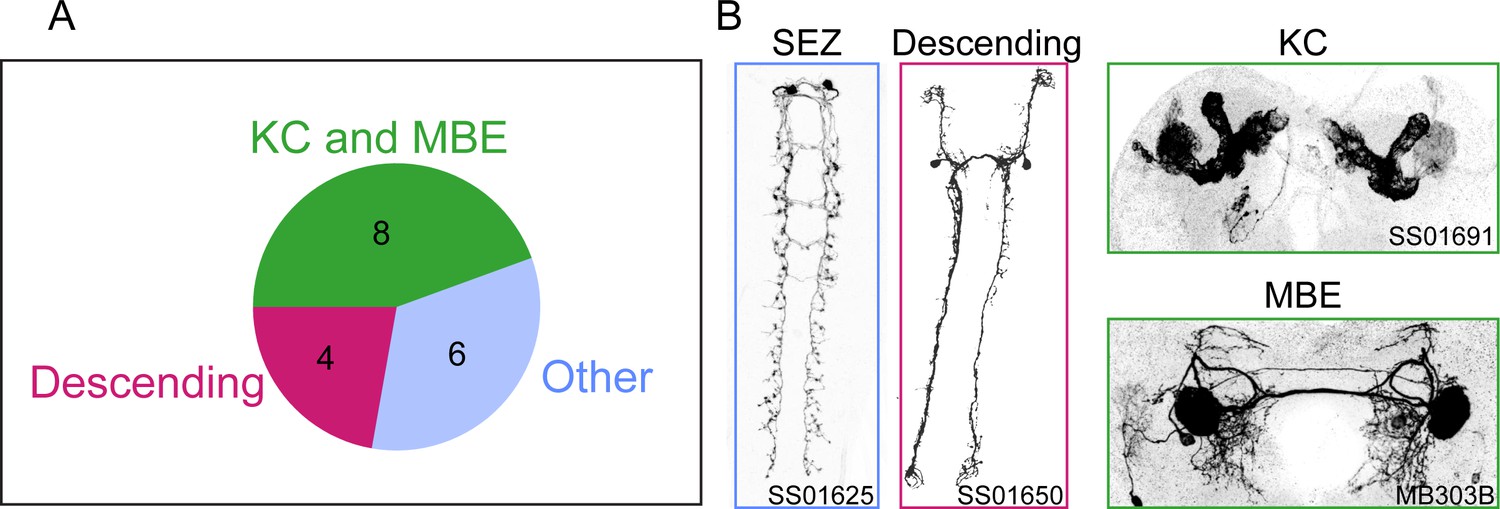
Overview of the results of the loss-of-function screen.
(A) Summary of the anatomical characterization of the 18 Split-Gal4 lines associated with a significant loss-of-function phenotype in the behavioral screen. The numbers of the driver lines corresponding to a given brain center are shown inside the pie chart. (B) Examples of neurons labeled by representative Split-Gal4 lines. SEZ: subesophageal zone, KC: Kenyon cells, MBE: mushroom body extrinsic neurons. Identity of split driver lines are: SEZ — SS01625: VT019845-AD, VT034795-DBD; Descending — SS01650: R56H09-AD, R65D05-DBD; KC — SS01691: R64E03-AD, R72G06-DBD; MBE — MB303B: R73F07-AD, R38E08-DBD.
Figure 1—figure supplement 3
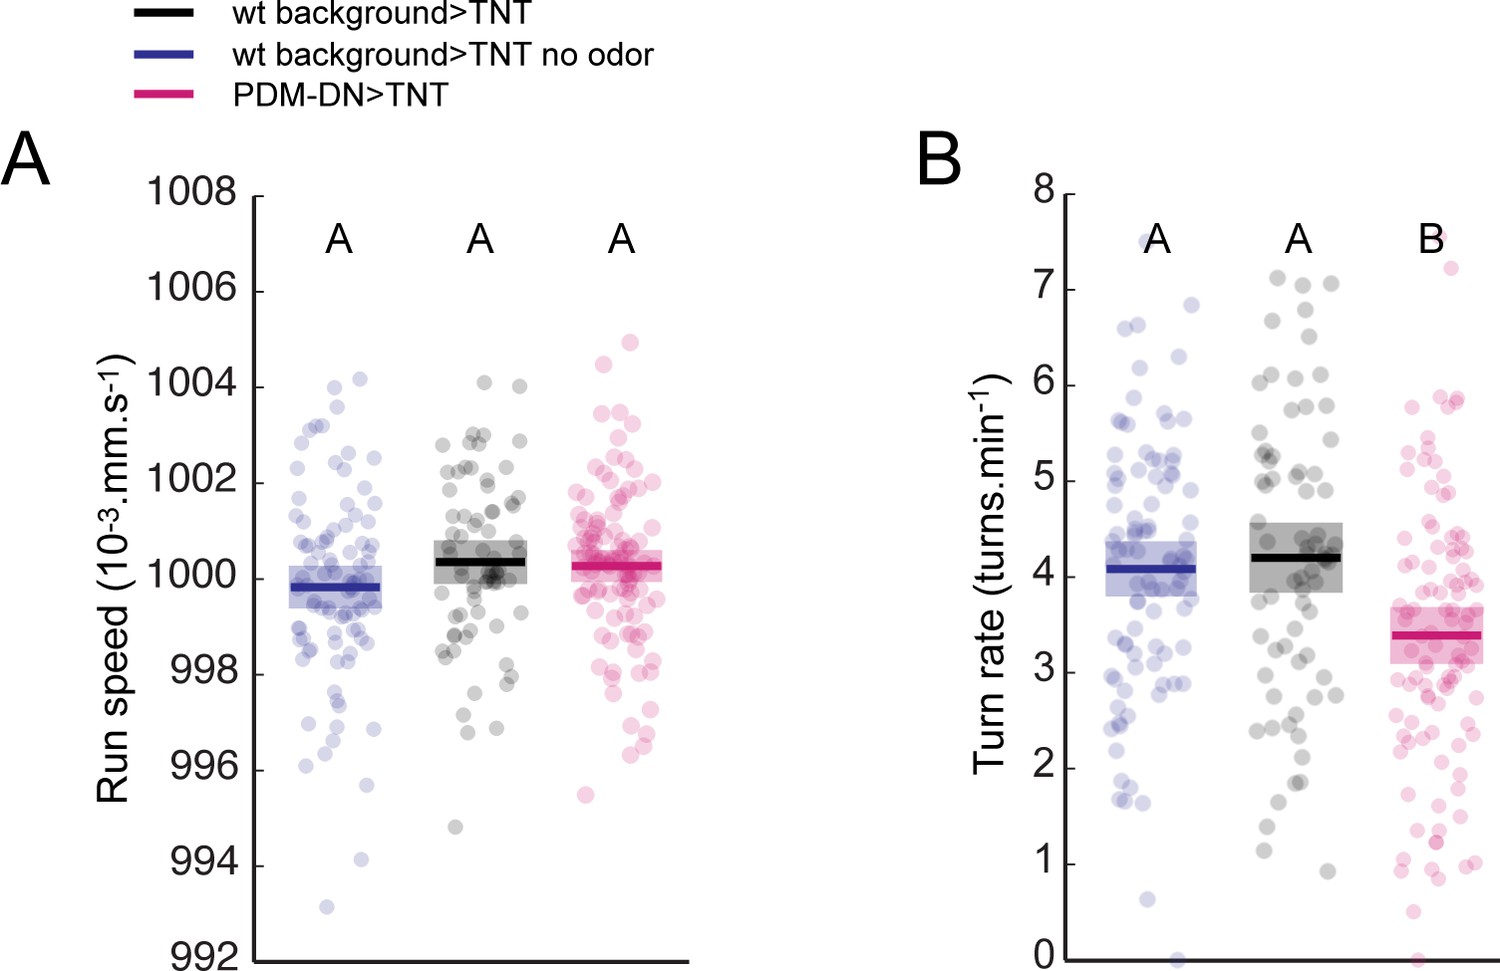
Impairing PDM-DN function affects run-to-turn transitions without inducing motor deficits.
(A) Analysis of the average run speed for independent trajectories. No difference is found between the run speeds of wild-type controls and the PDM-DN-silenced larvae. Blue: wild-type control, no-odor condition, black: wild-type control odor condition, magenta: PDM-DN-silenced larvae. Each point represents an independent trajectory. Thick lines represent the average for each condition. Semi-transparent boxes represent 95%-confidence intervals. No statistically significant difference is observed between any of the conditions tested (ANOVA test, p=0.2802). (B) Turning frequency is reduced in PDM-DN-silenced larvae. Blue: wild-type control, no-odor condition, black: wild-type control odor condition, magenta: PDM-DN-silenced larvae. Each point represents an independent trajectory. Thick lines represent the average for each condition. Semi-transparent boxes represent 95%-confidence intervals. Different letters indicate samples with mean values that are statistically significant different (ANOVA test, p<0.001). For more information about the statistics, see Supplementary file 1.
Figure 2 with 2 supplements
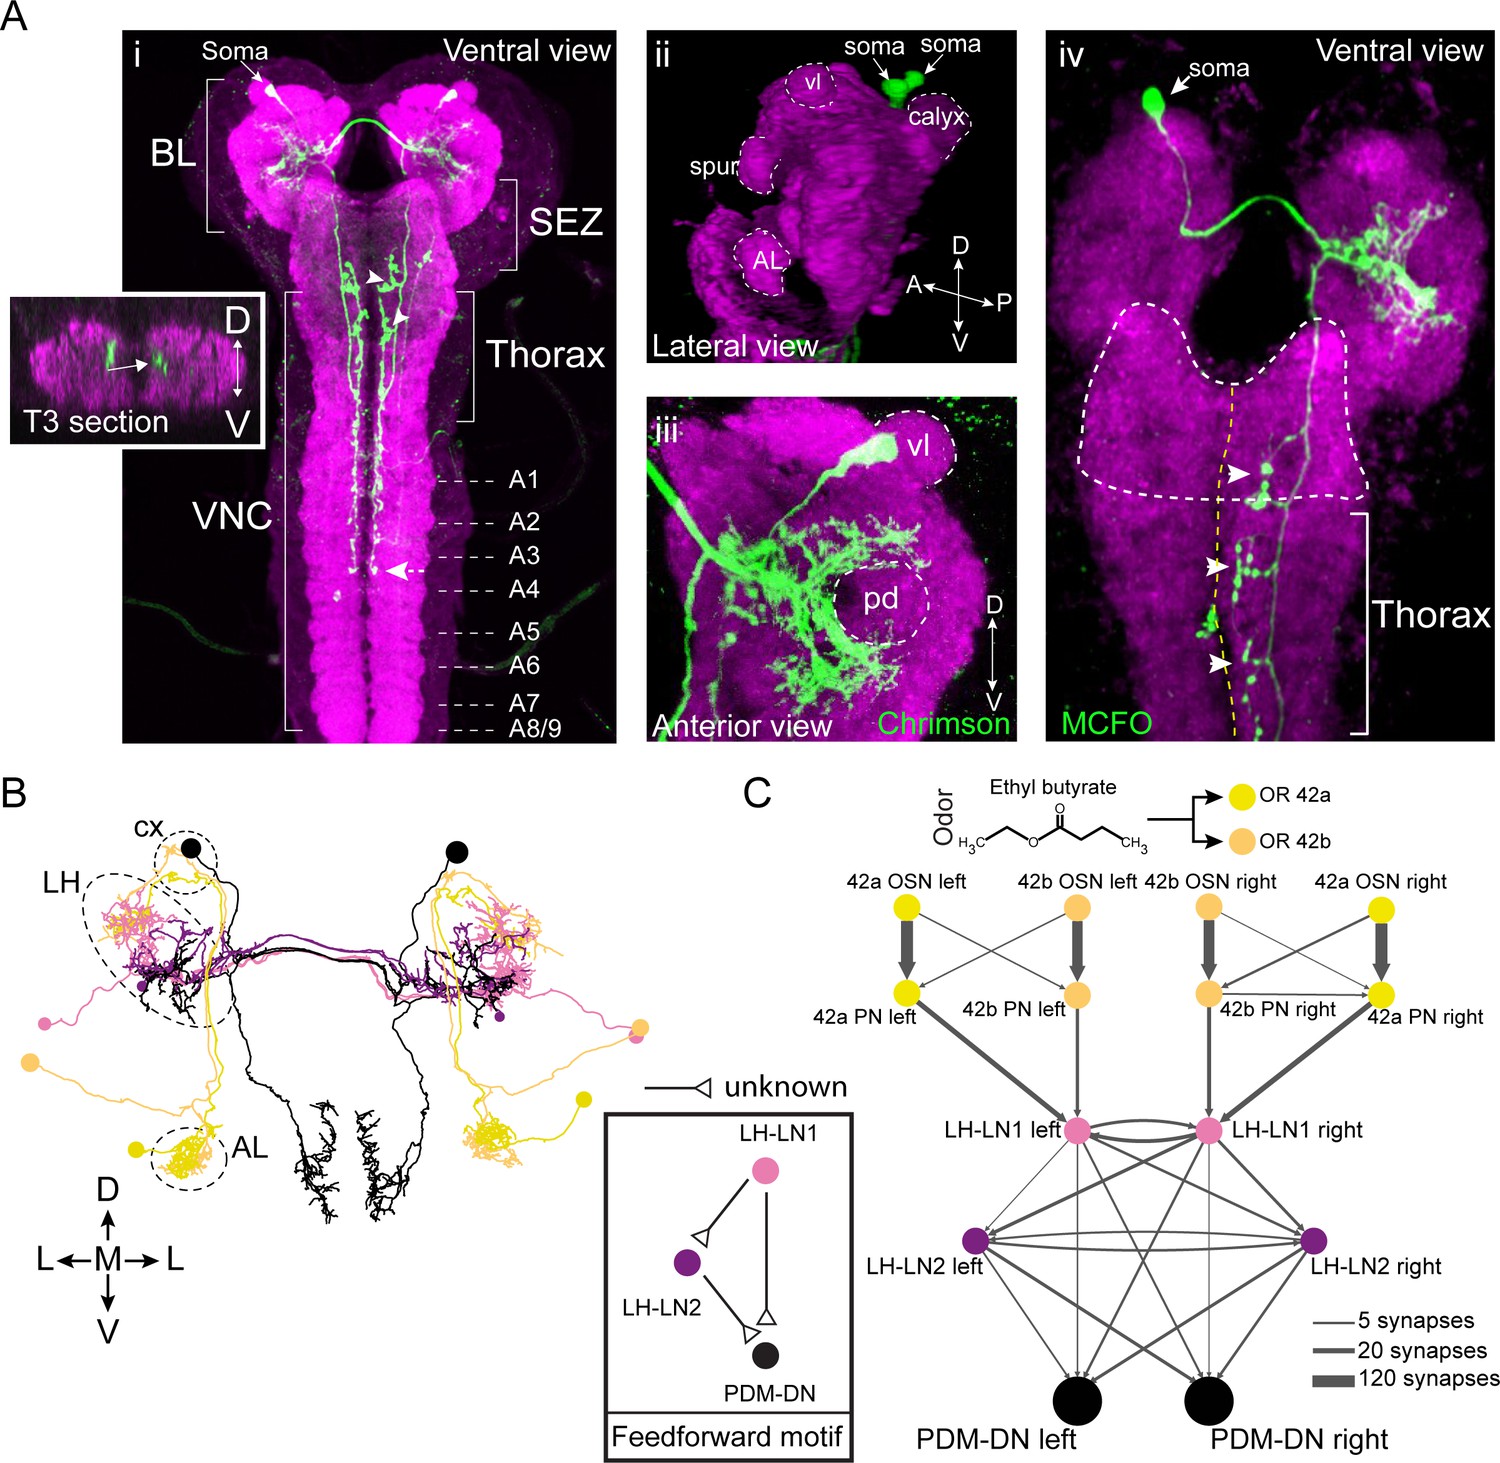
PDM-DN is a descending neuron that receives olfactory input.
(A) Anatomical characterization of the PDM-DN neuron using light microscopy. (Ai) Anatomy of the PDM-DN neuron revealed by maximum projection of confocal sections. The soma of the descending neuron (PDM-DN) is located in the brain lobes (BL, arrow). Arrowheads indicate large axonal varicosities in the subesophageal zone (SEZ) and thoracic regions. The axon of the descending neuron extends posteriorly to the fourth abdominal segment (dashed arrow). Cross section of the third thoracic segment is shown in the inset. Arrow in the inset indicates the dorso-medial location of the PDM-DN axon. D: dorsal, V: ventral. VNC: ventral nerve cord, A1-A9 abdominal segments 1–9 of the VNC. (Aii) 3D reconstruction of the PDM-DN neuron (green) and larval neuropil (magenta). Antibody staining against CsChrimson::mVenus expressed in PDM-DN neuron reveals that its soma is located in the posterior-dorsal-medial region of the brain lobes (arrows). The following brain regions are demarcated by dashed lines: antennal lobe (AL), tip of the ventral lobe (vl) of the mushroom body, spur and the mushroom body calyx. (Aiii) Dendritic arborizations of the PDM-DN neuron (green) are concentrated around the mushroom body peduncle (pd) and its surroundings. (Aiv) Use of the MCFO technique (Nern et al., 2015) to label a single PDM-DN neuron. The dendritic tree and the axon of the PDM-DN neuron are contralateral to its soma (arrow). Arrowheads indicate the large axonal varicosities in the anterior part of the PDM-DN axon. Green: PDM-DN neuron; magenta: neuropile. (B) EM reconstruction of the postsynaptic partners of PDM-DN. Anterior view of the Or42a and Or42b PNs (yellow and light pink); lateral-horn local interneurons (LH-LNs) upstream of PDM-DN (dark and light purple) and PDM-DN neuron (black). Antennal lobe (AL), lateral horn (LH) and mushroom body calyx (cx) are demarcated by dashed lines. Note that the PDM-DN neuron dendrites overlap with LH-LNs exclusively in the lateral horn region. (C) Reconstruction of the upstream partners of the PDM-DN neuron reveals that PDM-DN receives olfactory input via the lateral horn. The Or42a and Or42b OSNs are the main sensory neurons that are responsible for the attraction toward ETB, which is the odor used in the loss-of-function screen (Figure 1). PDM-DN receives input from the Or42a and Or42b projection neurons (PNs) via two local interneurons located in the lateral horn (LH-LN1 and LH-LN2), which form a feedforward motif (left inset). The signs of the interactions of the feedforward motif are unknown. Abbreviations used in the anatomical maps: A: anterior, D: dorsal, P: posterior, V: ventral.
Figure 2—figure supplement 1
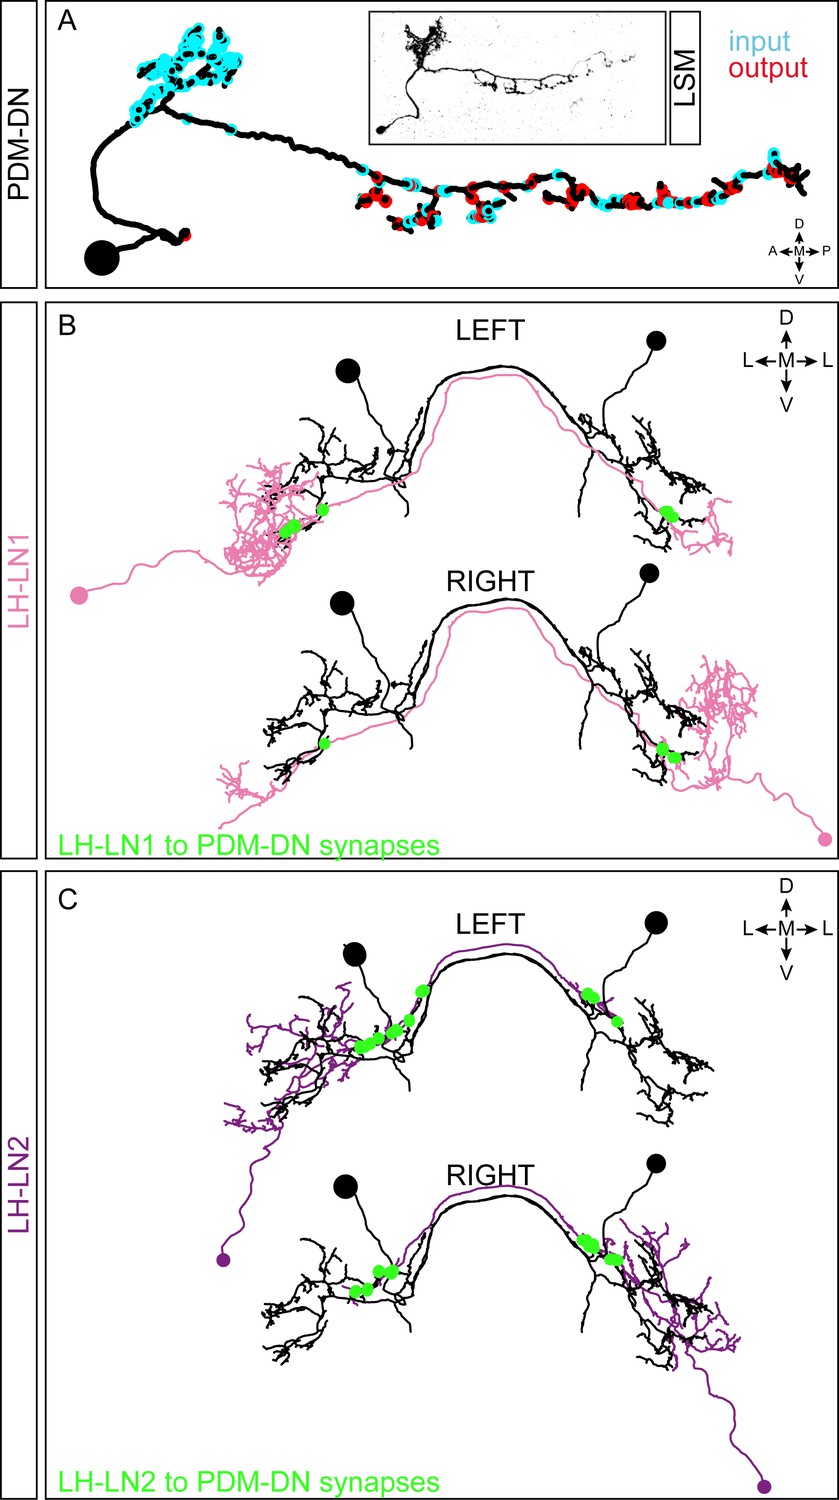
EM reconstruction of the PDM-DN neuron and its main upstream partners.
(A) Comparison of the EM-reconstructed PDM-DN to light microscopy (LSM). Representation of the input (cyan) and output (red) regions of the PDM-DN neuron. (B) EM reconstruction of the pair of LH-LN1 neurons. Both the left and the right LH-LN1 neurons are shown. The synapses between LH-LN1 and PDM-DN are shown in green. Each LH-LN1 neuron projects onto both the left and the right PDM. (C) EM reconstruction of the left and the right LH-LN2 neurons. The synapses between LH-LN2 and PDM-DN are shown in green. The LH-LN2 neurons give input to both the left and right PDM-DN neurons at a distinct, more proximal dendritic region compared to the LH-LN1 pair. Abbreviations used in the anatomical maps: A: anterior, D: dorsal, P: posterior, V: ventral, M: medial, L: lateral.
Figure 2—figure supplement 2
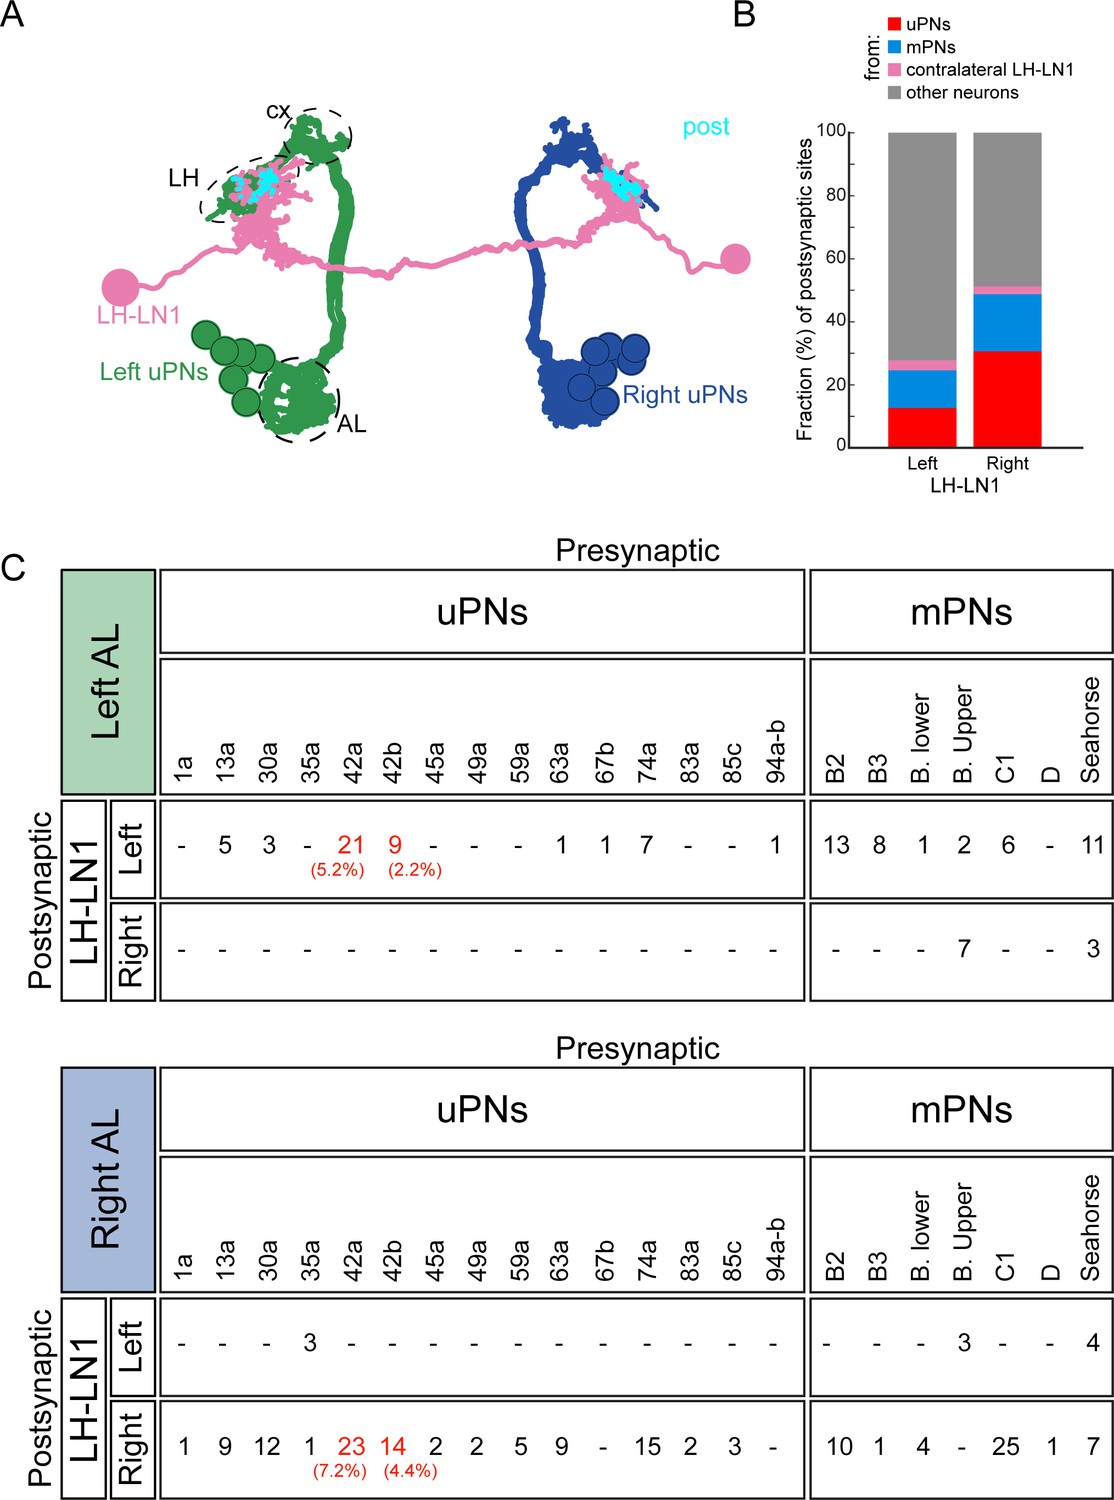
A subset of olfactory sensory neurons target PDM-DN through LH-LN1.
(A) EM reconstruction of uniglomerular PNs (uPNs, gray) and LH-LN1 neuronal pair (light purple). Synapses between uPNs and LH-LN1 are shown in cyan (post). Antennal lobe (AL), lateral horn (LH) and mushroom body calyx (cx) are demarcated by dashed lines. (B–C): LH-LN1 receives input from multiple OSNs via uniglomerular (uPNs, gray) and multiglomerular olfactory PNs (mPNs, blue). (B) Both left and right LH-LN1 neurons receive large fractions of their inputs from olfactory uPNs and mPNs. (C) Number of synapses between all uPNs and mPNs presynaptic to LH-LN1. Or42a and Or42b uPNs are two of the strongest presynaptic partners of LH-LN1 (highlighted in red are the fractions of synapses from the Or42a and Or42b PNs). None of the mPNs that are presynaptic to LH-LN1 receive significant input from Or42a and Or42b OSNs (Berck et al., 2016).
Figure 3 with 5 supplements

PDM-DN neuron plays a critical role in the sensorimotor control of reorientation behavior.
(A–C): High-resolution analysis of the loss-of-function phenotype of the PDM-DN neuron in single larvae tracked in controlled odor gradients (Tastekin et al., 2015). (A) Set of 8 representative trajectories for both wild-type controls (left and middle panels, black and gray) and PDM-DN-silenced larvae (right panel, magenta). Individual representative trajectories are shown in the insets. Red points indicate the odor source and red crosses indicate the starting points of individual larvae. (B) The distribution of centroid positions along the x and y axes of the behavioral arena. Trajectories for wild-type controls (black) and PDM-DN silencing are superimposed (magenta). (C) Time course of the average distance of the centroids to the odor source. Shaded areas indicate SEM. PDM-DN-silenced larvae overshoot the odor source during 120–180 s (green box) while both wild-type controls stay around the odor droplet during this time window. (D) Left panel: comparison of turn rates. Right panel: percentage of turns directed toward higher odor concentration. Sample sizes: n = 36 larvae for wild-type control >TNT, n = 28 larvae for PDM-DN>TNT and n = 29 larvae for PDM-DN>wild type control. Different letters indicate statistically significant differences (Wilcoxon ranksum test. p<0.05 upon Bonferroni correction). (E) Optogenetic activation of the PDM-DN neuron evokes stopping behavior. Either larvae expressing CsChrimson::mVenus in the PDM-DN neuron (n = 35 larvae, 280 flashes) or wild-type controls (n = 20 larvae, 160 flashes) were exposed to 6 s red light flashes in the absence of an odor gradient. Acute optogenetic activation of the PDM-DN neuron induced a sharp decrease in tail speed leading to cessation of forward locomotion (see Video 1). Horizontal bars indicate the average durations of stops for wild-type controls (black) and PDM-DN activation (magenta). The bars are positioned according to the median latency of stops with respect to the flash onset. The average duration of stops for PDM-DN activation is significantly higher than that of wild-type controls (Wilcoxon ranksum test). For pairwise comparisons, the stars indicate a statistically significant difference between stop durations (***p<0.001). Shaded areas indicate SEM. (F) PDM-activated larvae show higher probability of stopping compared to the controls. The error bars indicate 95%-confidence intervals computed from binomial distributions (Clopper-Pearson method, p<0.05). The star indicates a statistically significant difference (*p<0.05). (G) The stopping behavior induced by the optogenetic activation of PDM-DN is not correlated with tail speed prior to the light flash (R2 = 0.023, p=0.774). The low stopping probability due to the startle response in the wild-type controls is negatively correlated with the tail speed prior to the light flashes (R2 = 0.903, p=0.0037). (H) Optogenetic activation of the PDM-DN neuron (same protocol as E) elicits an increase in head-angle speed (see head sweeps in Video 1). The increase in head-angle speed observed in wild-type larvae is due to a startle response induced at the onset of light flashes. The arrow indicates the maximum average head-angle speed reached right after the flash offset. (I) The fraction of time spent in head casting/turning mode during the light flash is significantly larger for the PDM-DN activated larvae compared to the wild-type controls (Wilcoxon ranksum test). Stars indicate a significant differences (***p<0.001). (J) Effect of optogenetic activation of PDM-DN in odor gradients. Same protocol as E except that a droplet of odor (100 mM ethyl butyrate, 5 µl) was suspended from the ceiling of the assay. The effect of PDM-DN activation was quantified for up-gradient and down-gradient runs. Acute activation of PDM-DN led to a strong decrease in tail speed irrespective of the direction of the runs. (K) Optogenetic activation of PDM-DN leads to a drastic increase in the probability of stopping during up-gradient and down-gradient runs. The error bars indicate 95% confidence intervals for binomial distributions (Clopper-Pearson method). (L) In PDM-DN activated larvae, head casts/turns are more strongly induced when the larva engages in a down-gradient run as shown in the time course of the head-angle speed. (M) The fraction of time spent in head sweeps is larger upon acute gain-of-function of the PDM-DN neuron. Different letters indicate statistically significant differences at p<0.05 (Wilcoxon ranksum test). For wild-type control, n = 50 flashes (down-gradient runs) and 32 flashes (up-gradient runs). For PDM-DN activation, n = 118 flashes (down-gradient runs) and n = 78 flashes (up-gradient runs). For more information about the statistics, see Supplementary file 1.
Figure 3—figure supplement 1
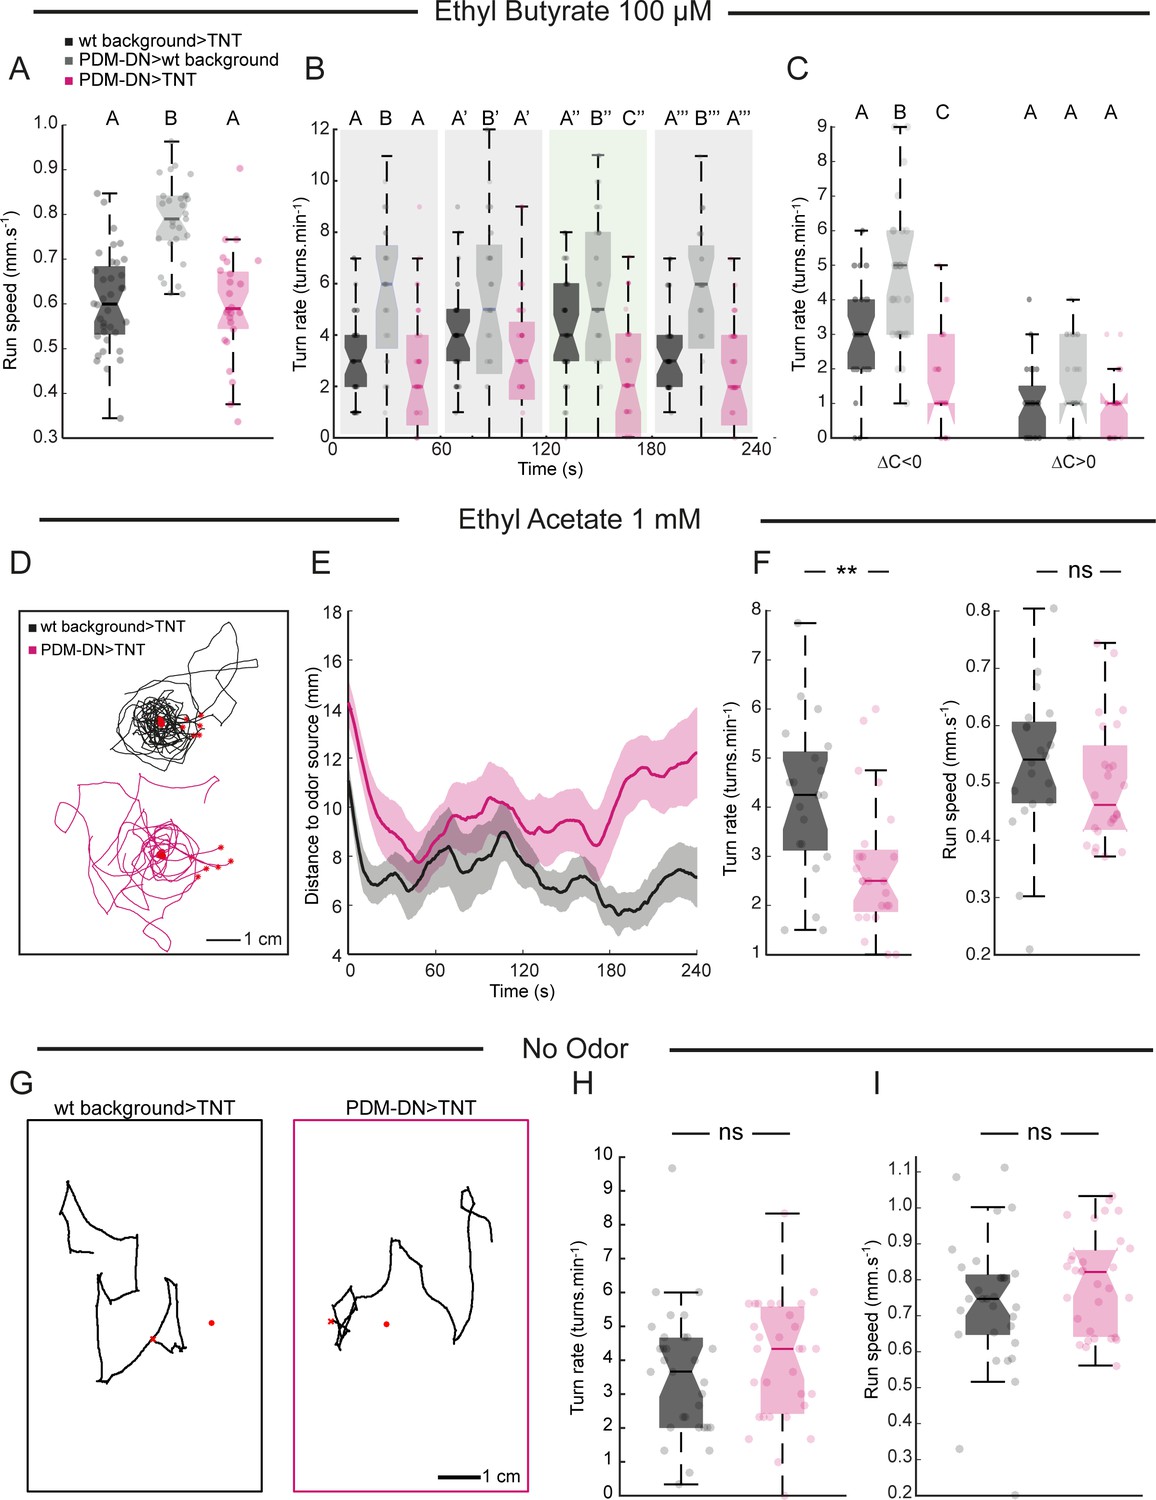
High-resolution analysis of the loss-of-function (LoF) phenotype of PDM-DN in two odor gradients.
(A) As in multiple-animal assay (Figure 1), run speed is not affected in PDM-DN-silenced larvae. One of the parental controls is significantly faster than the other control. This result is either due to genetic background effects. (B) In ethyl butyrate gradients, the effect of PDM-DN silencing on the turning frequency is significant only during a time window in which the larva should circle around the odor source. (C) The turning frequency is impaired during down-gradient runs (∆C/∆T < 0) but not during up-gradient runs. In panels (A–C), each point represents an individual larva. Horizontal lines represent the median for each condition. Semi-transparent boxes represent the 25th and 75th percentiles. The whiskers extend to the most extreme data points excluding the outliers (default settings of the ‘boxplot’ function of Matlab_R2015b). Different letters indicate statistically significant differences (Wilcoxon ranksum test, p<0.05 upon Bonferroni correction). Sample sizes: n = 36 larvae for wild-type background >TNT, n = 29 larvae for PDM-DN>wild type background and n = 28 for PDM-DN>TNT. (D) We tested the loss-of-function phenotype characterized in a gradient of ethyl acetate (EtA, concentration: 1 mM), another odor that activates Or42a/Or42b OSNs. eight representative trajectories for wild-type control (black) and PDM-DN-silenced larvae (magenta) in EtA gradient generated by using a droplet of EtA at a concentration of 1 mM. (E) Time course of the distance of larval centroids to the odor source. (F) Left panel: As observed in EtB gradients, the turning frequency is significantly lower for PDM-DN-silenced larvae compared to the wild-type control in EtA gradients (Wilcoxon ranksum test, **: p<0.01). Right panel: No statistically significant difference is observed in run speed (Wilcoxon ranksum test, ns: p>0.05). Sample sizes: n = 20 larvae for wild-type background >TNT and n = 24 larvae for PDM-DN>TNT. (G–I) Analysis of LoF behavior of PDM-DN in the absence of odor gradient. (G) Representative trajectories for wild-type controls and PDM-DN-silenced larvae are shown. (H) Turn rate and (I) run speed are not statistically different compared to the wild-type controls in the absence of odors (Wilcoxon ranksum test, p=0.2617 for turn rate and p=0.1857 for run speed). Sample sizes: n = 31 larvae for wild-type background >TNT and n = 31 larvae for PDM-DN>TNT. Each point represents an individual larva. Horizontal lines represent the median for each condition. Semi-transparent boxes represent the 25th and 75th percentiles. The whiskers extend to the most extreme data points excluding the outliers (default settings of the ‘boxplot’ function of Matlab_R2015b). For more information about the statistics, see Supplementary file 1.
Figure 3—figure supplement 2
Acute optogenetic activation of the PDM-DN neuron induces stopping behavior.
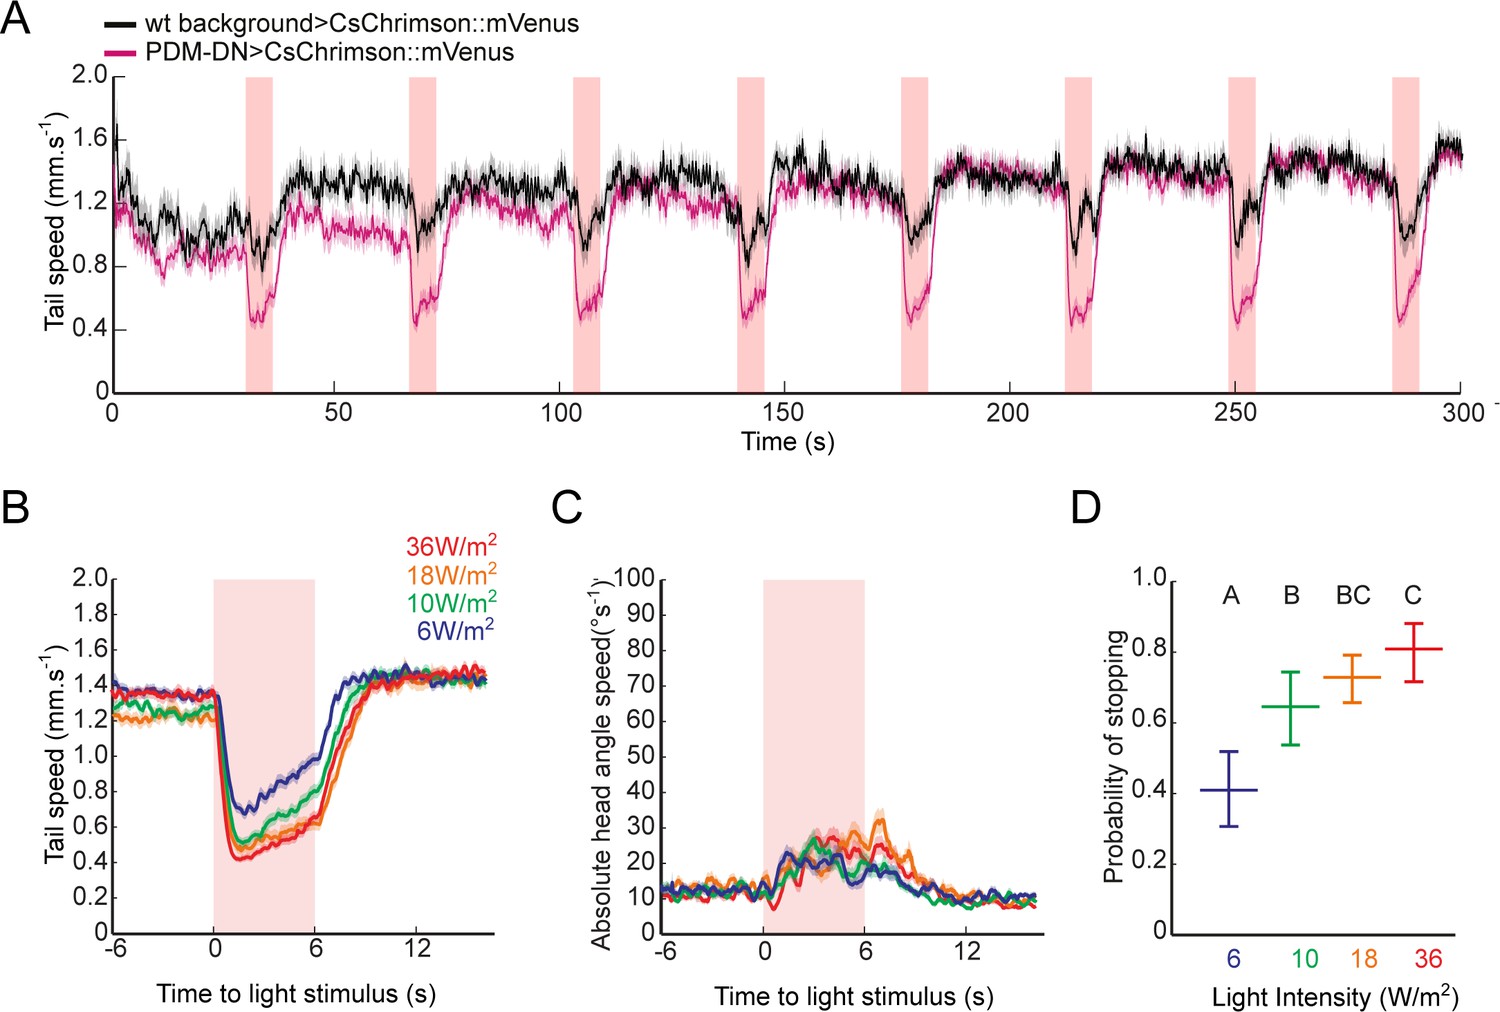
(A) Activation of the PDM-DN neuron leads to reproducible stopping behavior over several trials. Eight consecutive light flashes (18 W/m2) are used to optogenetically activate the PDM-DN neuron. Each flash evoked strong decrease in the tail speed in PDM-DN>CsChrimson::mVenus larvae (magenta) while they induced only a modest decrease in tail speed in wild-type controls (black) due to startle response. Shaded areas indicate SEM. Sample sizes: n = 20 larvae for wild-type control and n = 35 larvae for PDM-DN activation. (B–D) Acute optogenetic activation with different red-light intensities ranging between 6–36 W/m2. Time course of (B) the tail speed and (C) head-angle speed for flashes of different light intensities. (D) Probabilities of stopping for flashes of different light intensities. Intensity of 18 W/m2 was chosen for most experiments in this study: this intensity produced a robust gain-of-function phenotype while minimizing startle response in wild-type controls. Error bars indicate 95% confidence intervals (Clopper-Pearson method). Different letters indicate statistically significant differences at significance level of p<0.05. For more information about the statistics, see Supplementary file 1.
Figure 3—figure supplement 3
Acute optogenetic activation of the PDM-DN neuron induces stopping behavior.
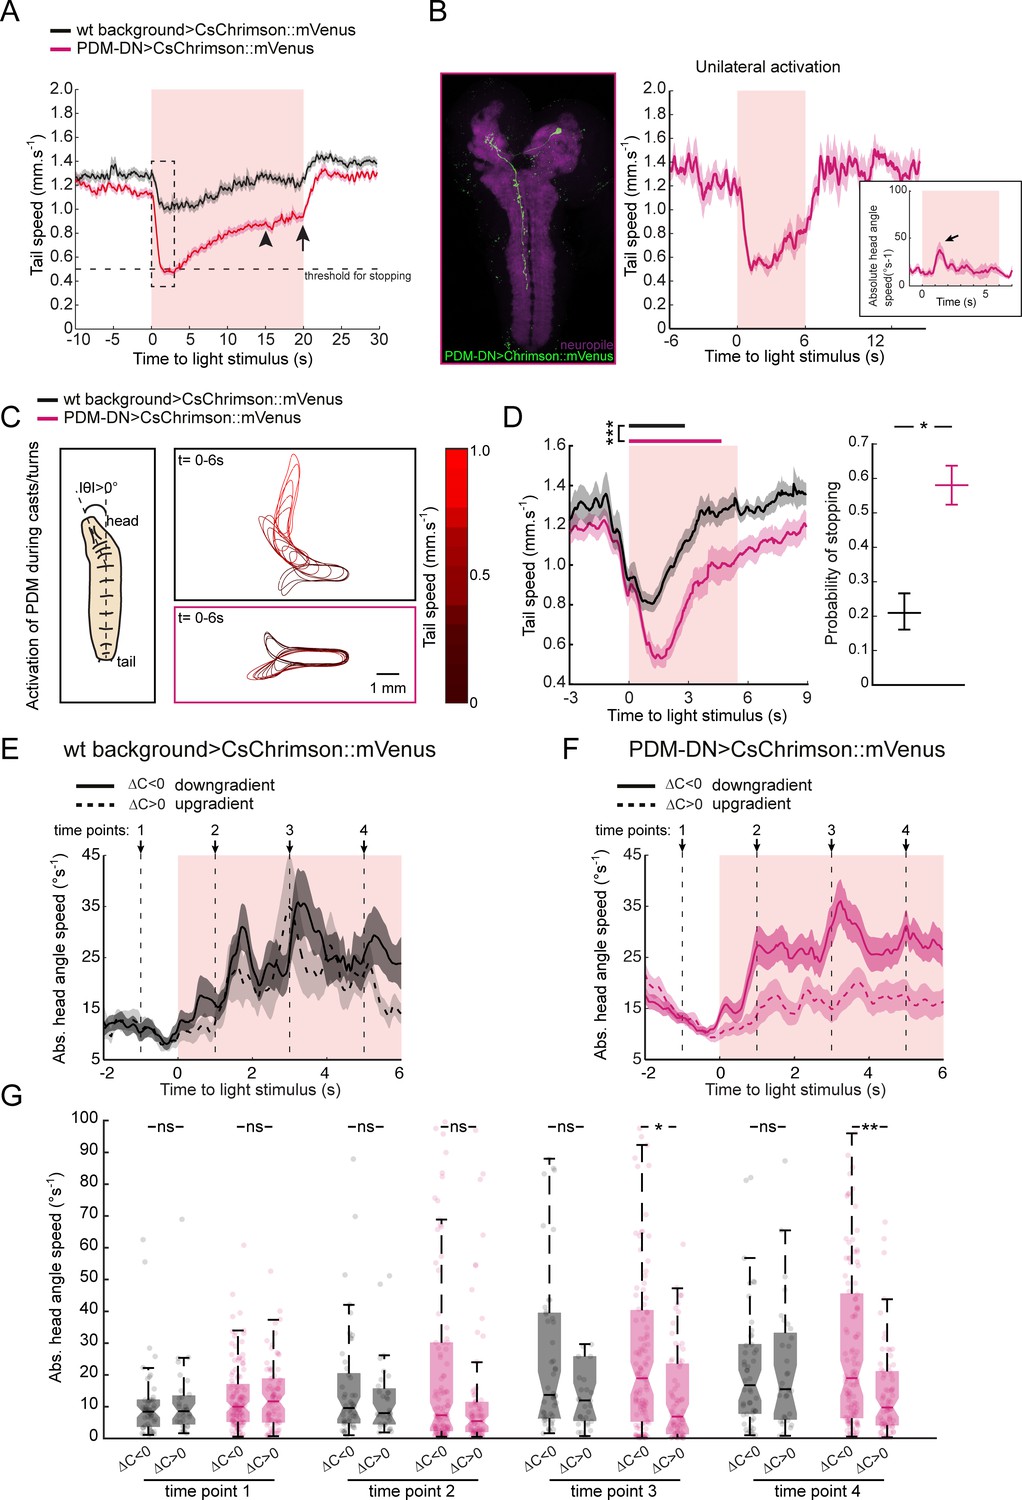
(A) Activation of the PDM-DN neuron for flashes of longer durations (20 s instead of 6 s). Although PDM-DN activation leads to a sharp decrease in tail speed at the onset of the light flash, it fails to sustain robust stopping behavior for more than ~3 s (dashed box, see Figure 3—figure supplement 4). After 3 s, the average tail speed increases steadily and reaches a plateau around 15 s after the flash onset (arrowhead). The value of this plateau is still lower than the average tail speed preceding the light onset. Upon light offset (arrow), the tail speed returns to its baseline value preceding PDM-DN activation. Sample size: n = 126 flashes (18 larvae). (B) Unilateral activation of PDM-DN. We expressed low-activity flippase under the control of the pan-neuronal R57C10 promoter (Nern et al., 2015) to stochastically excise a stop cassette located between the UAS and CsChrimson::mVenus sequences. This method allowed us to unilaterally express CsChrimson::mVenus in the PDM-DN neuron (left panel). Unilateral activation of the PDM-DN neuron is sufficient to induce stopping behavior (right panel). The inset shows the head-angle speed upon unilateral PDM-DN activation. The arrowhead indicates the increase in head-angle speed. Sample size: n = 16 flashes (two larvae). (C–D) Activation of the PDM-DN neuron during head casts/turns. (C) When PDM-DN is activated during head casts/turns, the larva freezes in a head-bent position while the wild-type control quickly reverts to run mode as shown in the contour plots. (D) Time course of the tail speed for the PDM-DN activation upon head casts/turns (left panel). Horizontal bars indicate the average duration of stopping behavior for wild-type controls (black) and PDM-DN activation (magenta). The bars are placed according to the median latency of stops with respect to the flash onset. The duration of stops for PDM-DN activation is significantly higher than of wild-type controls (Wilcoxon ranksum test). Star indicates statistically significant difference (***p<0.001). Probability of stopping is significantly higher for the PDM-DN-activated larvae compared to the wild-type control (right panel). Error bars indicate 95% confidence intervals for binomial distributions (p<0.05, Clopper-Pearson method). Star indicates statistically significant difference. Sample sizes: n = 225 flashes for the wild-type control and n = 289 flashes for the PDM-DN activation. (E–G) Effect of light flashes on wild-type controls (E) and PDM-DN>CsChrimson::mVenus larvae (F) in odor gradients. (E) Effect of light flashes on the absolute head angle speed of wild-type control larvae during down-gradient and up-gradient runs. Four time points (arrows and vertical dashed lines: −1,+1,+3 and+5 s with respect the onset of the light flashes) are selected to compare the absolute head angle speed in panel G. (F) PDM-DN activation during down-gradient and up-gradient runs. (G). Comparisons of absolute head angle speed for different time points. Each point indicates an individual trajectory. For clarity, a minority of data points above 100°/s (outliers) are not shown. Horizontal lines represent the median for each condition. Semi-transparent boxes represent the 25th and 75th percentiles. The whiskers extend to the most extreme data points excluding the outliers (default settings of the ‘boxplot’ function of Matlab_R2015b). For wild-type background controls n = 50 runs (down-gradient) and n = 32 runs (up-gradient). For PDM-DN activation n = 118 runs (down-gradient) and n = 78 runs (up-gradient). For panel G, Wilcoxon signed-rank test is used for statistical comparisons. p values for time point 1: 0.7708 (PDM-DN activation), 0.9851 (wild-type controls); time point 2: 0.2543 (PDM-DN activation), 0,8225 (wild-type controls); time point 3: 0.0267 (PDM-DN activation), 0.6136 (wild-type controls); time point 4: 8.70 × 10⁻³ (PDM-DN activation), 0.9851 (wild-type controls). For pairwise comparisons, stars indicate statistically significant differences (*p<0.05, **p<0.01); ns stands for not significant. For more information about the statistics, see Supplementary file 1.
Figure 3—figure supplement 4
Consistency of PDM-DN activation phenotype across individual larvae tested in absence of odor.
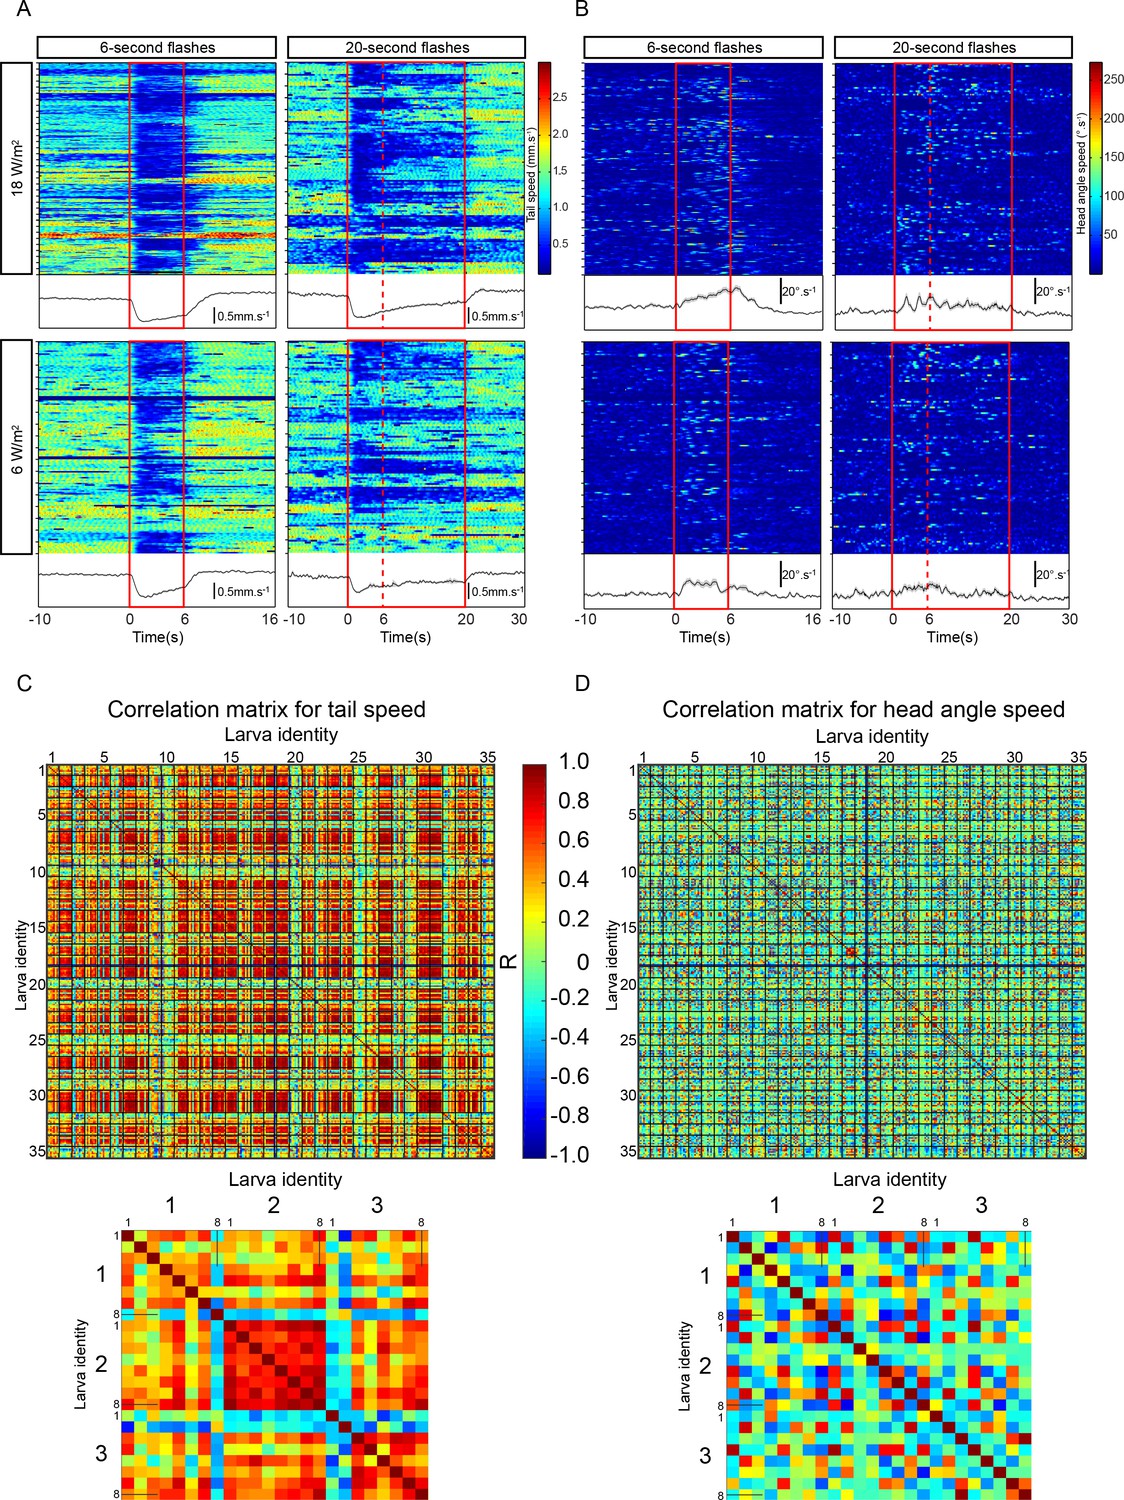
(A) Heat map representations of the tail speed upon PDM-DN activation. Blocks of repeated eight trials for each larva are separated by ticks on the vertical axis. The light flash is highlighted as a red rectangle. Averages over trials are shown in the boxes below the heat maps (shaded areas indicate SEM). (Top left panel) Six-second activation at 18 W/m2. (Top right panel) Twenty-second activation at 18 W/m2. The sixth second is indicated by a vertical dashed line. (Bottom panels) Activation at 6 W/m2. (B) Same as panel A for the head-angle speed. (C–D): Cross-correlation of tail speed and head-angular speed between trials, respectively. A cross-correlation analysis was performed for each trial pair. We performed 8 trials for 35 larvae in total. Each entry of the matrix represents a single trial. Each grid represents a single larva with eight trials. (C) Cross-correlation matrix for tail speed. Closed-up view of the correlation matrix for the first three tested larvae is shown in the bottom panel. Numbers in bigger fonts indicate larval identity; numbers in smaller fonts indicate trials. (D) Cross-correlation matrix for head-angle speed. Closed-up view on the correlation matrix of 8 trials tested in the first three larvae is shown in the bottom panel. Numbers in bigger fonts indicate larval identity and numbers in smaller fonts indicate trials.
Figure 3—figure supplement 5
Consistency of PDM-DN activation phenotype across individual larvae tested in an odor gradient.
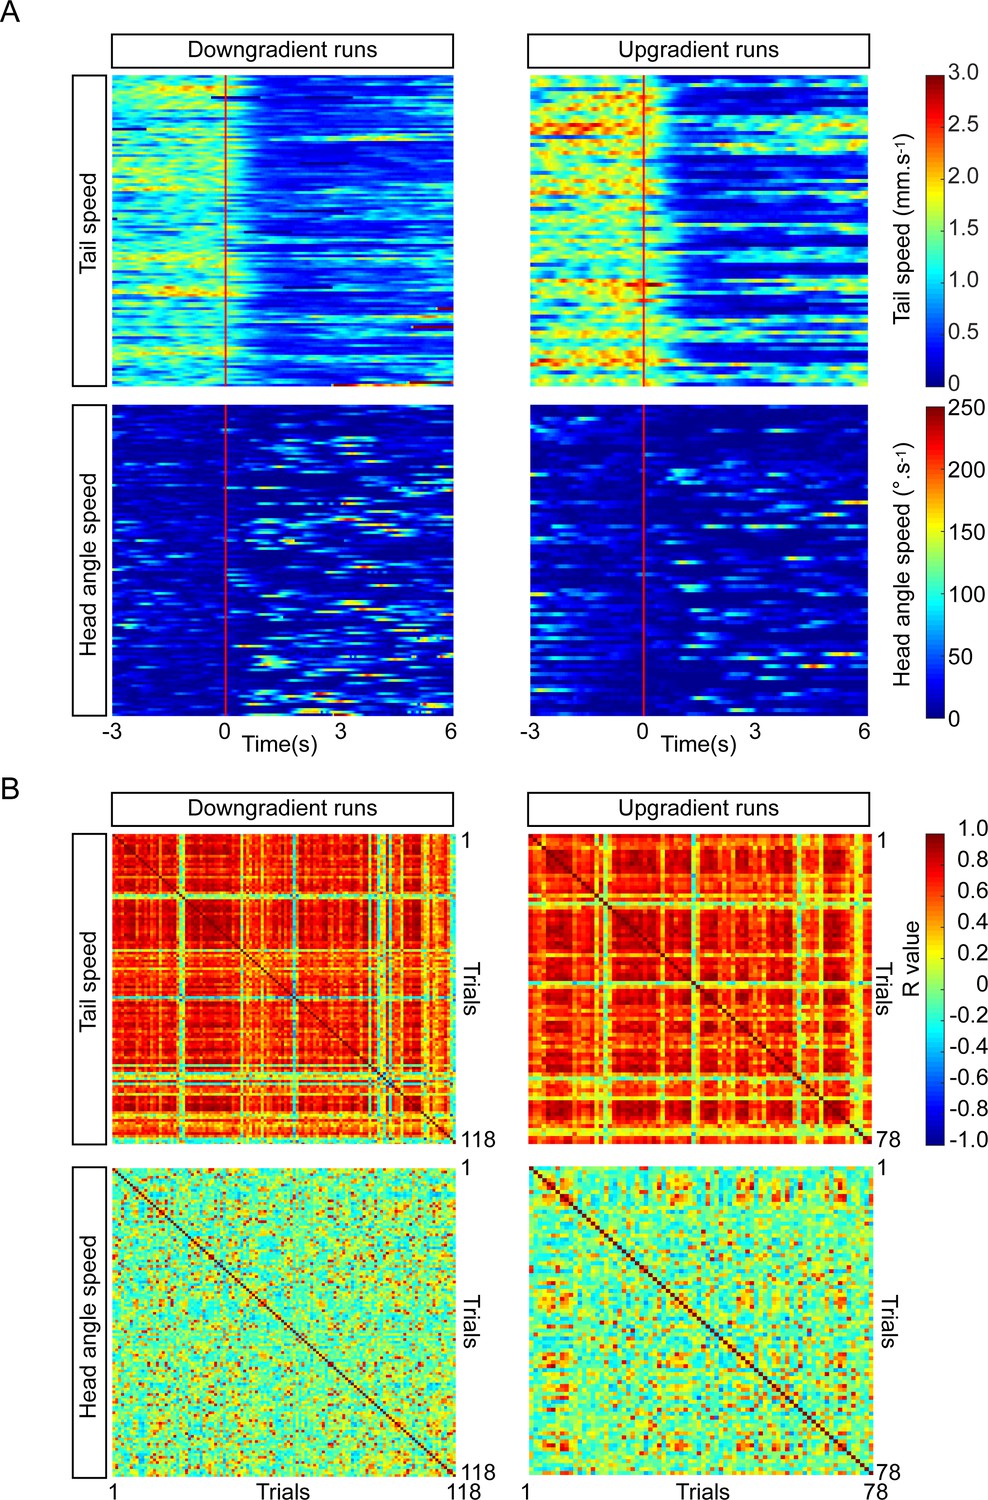
(A) Heat map representation of the tail speed and head-angle speed upon PDM-DN activation in an ethyl-butyrate odor gradient. Each row represents a single trial. Flash onset is represented as a vertical red line. Split of individual trials (runs) between down-gradient (left panels) and up-gradient runs (right-panels). (Top panels) Heat maps for tail speed. PDM-DN activation leads to a drastic decrease in tail speed during both up and down-gradient runs. (Bottom panels) Heat maps for the head-angle speed. PDM-DN activation has more pronounced effect on the head-angle speed during down-gradient runs (colored traces following the red line). (B) Cross-correlation between trials. (Top panels) Similar to the activation in the absence of odor gradients, the effect of PDM-DN optogenetic activation on the tail speed is highly correlated across trials for both up- and down-gradient runs. (Bottom panels). Although we observe a lower level of correlation between trials for head-angle speed compared to the tail speed, the effect of PDM-DN optogenetic activation in odor gradients is more correlated across trials for the head-angle speed compared to the PDM-DN activation in the absence of odor (results to be contrasted with Figure 3—figure supplement 3D).
Figure 4 with 1 supplement

Detailed analysis of the effects of PDM-DN activation on segmental contractions and motor neuron activity.
(A) Definition of forward-locomotion wave in freely moving larvae. During forward locomotion (run), tail speed and body length exhibit wave-like patterns. During the initiation of the forward wave, tail speed peaks due to the contraction of the most posterior segment (left panel, black arrow in tail speed). At the end of the wave of peristaltic contraction, larvae extend their body to its maximal length. This extension translates into a peak in the body length (left panel, black arrow in body length). (Left panel) We define the forward wave cycle as the time window between a peak in tail speed and the next peak in body length. (Right panel) Approximate mapping of phases of wave cycle on the abdominal segments (a full cycle spans 360 degrees). The initial phase of the wave corresponds to the contraction of the most posterior segments (initial phase, blue). As the wave is half-finished, segmental contractions reach the middle part of the body (green, hinge phase). The most anterior segments contract at the last phase of the wave (red, late phase). (B–C) Activation of the PDM-DN neuron at different phases of wave propagation. Optogenetic activation of the PDM-DN neuron during the initial, hinge and late phases. (B) PDM-DN activation evokes a drop in tail speed irrespective of the phase of the forward wave (left panel). The inset shows the mean tail speed throughout the flash. During the light flash (6 s), there is no significant difference in the minimum tail speed reached upon PDM-DN activation between the three phases considered in this analysis (right panel, Wilcoxon rank-sum test, p>0.05 upon Bonferroni correction). Each point in the background represents a single trial. Horizontal lines represent the median for each condition. Semi-transparent boxes represent the 25th and 75th percentiles. The whiskers extend to the most extreme data points excluding the outliers (default settings of the ‘boxplot’ function of Matlab_R2015b). Different letters indicate statistically significant differences. (C) Optogenetic activation of the PDM-DN neuron does not cease the wave propagation immediately. Upon light onset, the body length increases during the first second of the optogenetic activation of PDM-DN (dashed box to be compared to the dashed box of panel B). The inset shows the mean body length throughout the flash. During the light flash (6 s), there is no significant difference in the maximum body length reached upon PDM-DN activation between phases (Wilcoxon rank-sum test, p>0.05 upon Bonferroni correction). Each point represents a single trial. Horizontal lines represent the median for each condition. Semi-transparent boxes represent the 25th and 75th percentiles. The whiskers extend to the most extreme data points excluding the outliers (default settings of the ‘boxplot’ function of Matlab_R2015b). Different letters indicate statistically significant differences. Sample sizes: n = 45 trials for initial phase, n = 44 trials for hinge phase and n = 25 trial for the end phase. (D–E) Analysis of the PDM-DN activation phenotype at the level of segmental contractions using immobilized larvae. (D) To observe the effect of PDM-DN activation on the wave propagation at the level of segmental contractions, we immobilized the larva by pinning it down from both ends (tip of the head and the tail) on a transparent PDMS slab (left panel). Although the larva could generate forward peristaltic waves, it could not move forward, making it easier to track the segmental contractions (see Video 2). In this preparation, sequential contractions of the abdominal segments were clearly visible and quantified as displacement of each segment (∆x) along the anterior-posterior axis (right panel). (E) The effect of PDM-DN activity on the segmental contractions was observed by activating the PDM-DN neuron at different stages of the wave of peristaltic contraction. Prior to the light flash, larvae generated forward waves (tilted dashed lines) by sequentially contracting the abdominal segments starting at segment A7. The time course of segmental displacements is illustrated for conditions where the light onset coincides with contractions at segments A7 (Eiii), A4 (Eii) or A2 (Ei) (red arrows). (F) Different effects of PDM-DN activation on the ongoing peristaltic wave are reported as proportions of the total number of observations. For activation of PDM-DN while the wave was travelling through both the anterior and posterior segments, the ongoing wave reached and terminated at A1, but subsequent waves could not be initiated (gray). For posterior segments,~7% of the ongoing wave terminated immediately (purple) and a new wave could not be initiated throughout the flash. However no statistical difference is observed when compared to the anterior segments (Z-test, p=0.2076). About ~20% of the ongoing wave propagated up to the hinge point (segment A4) where they terminated (green color). In addition, new waves could not be initiated in this condition throughout the flash. This condition was never observed for the anterior segments (Z-test, p<0.05). The proportions of the failure to stop the wave is not significantly different for anterior and posterior segments (Z-test, p=0.6672). Sample size: 136 flashes (five preparations). Starts indicate statistically significant differences (**: p<0.01, ***p<0.001). (G) Calcium imaging of fictive locomotion patterns upon PDM-DN activation. We used isolated CNS preparations to analyze the effect of PDM-DN activation on fictive waves of forward locomotion. To record the motor neuron activity, we expressed the genetically-encoded calcium indicator GCamP6f in glutamate-expressing neurons using the VGlut-LexA driver line. (Left panel) The picture sequence corresponds to snapshots at different time points during forward wave propagation (time interval between pictures: 1 s). Note the sequential increase in fluorescence intensity from A7 to A1. (Right panel) Prior to the light flash, larvae generated fictive forward waves (tilted dashed lines) manifested by sequential increase in the fluorescence levels starting from the posterior-most segment A7. The increase in fluorescence was symmetrically coordinated between the left and the right segments (left in green, right in blue). Upon optogenetic activation of the PDM-DN neuron, a fictive wave of locomotion starting from the posterior segments (A7–A5) terminated before reaching A4 (truncated dashed line). (H) To quantify the effects of the light-driven activity on PDM, we computed the number of forward waves before and during the light flash. While PDM-DN activation (magenta) leads to a significant decrease in the number of waves that were initiated and completed (n = 19 trials, Wilcoxon signed-rank test, p<0.05), wild-type controls (black) do not display a significant change (n = 12 trials). Each dot represents an independent trial. Different letters indicate statistically significant differences. For more information about the statistics, see Supplementary file 1.
Figure 4—figure supplement 1
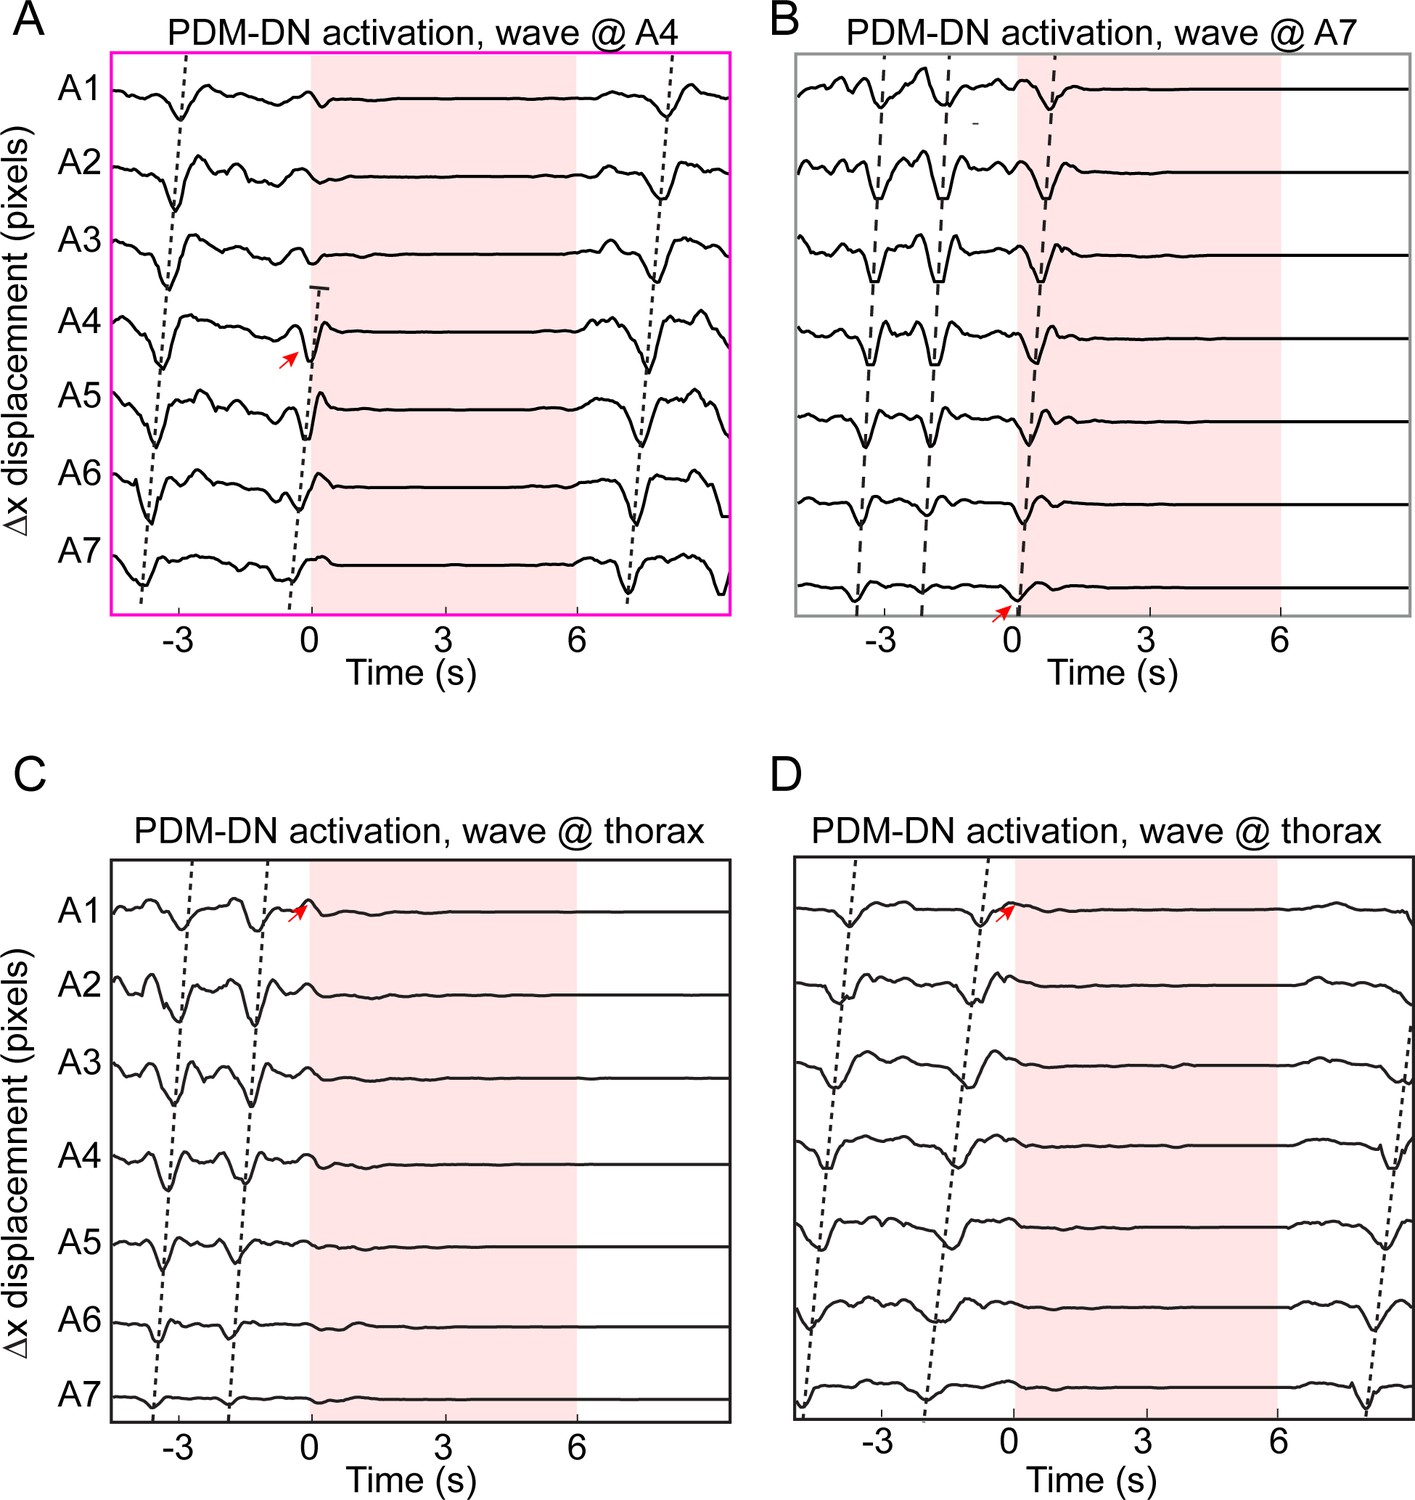
Illustration of different effects of PDM-DN activation on ongoing waves of peristaltic contraction.
(A) An example of PDM-DN activation coinciding with A4 contraction (red arrow), which led to an immediate cessation of the forward wave. (B) PDM-DN activation coinciding with A7 contraction (red arrow). In this trial, the ongoing wave terminated successfully, but a new wave cannot be initiated during the flash. (C–D) Two representative examples where PDM-DN was activated when the peristaltic wave was at the thoracic segments (red arrows indicate the onset of the flash after the wave terminated at A1). In both cases, a new wave could not be initiated during the light flash.
Figure 5 with 2 supplements
PDM-DN controls the premotor neurons involved in forward locomotion via a set of descending neurons located in the SEZ.
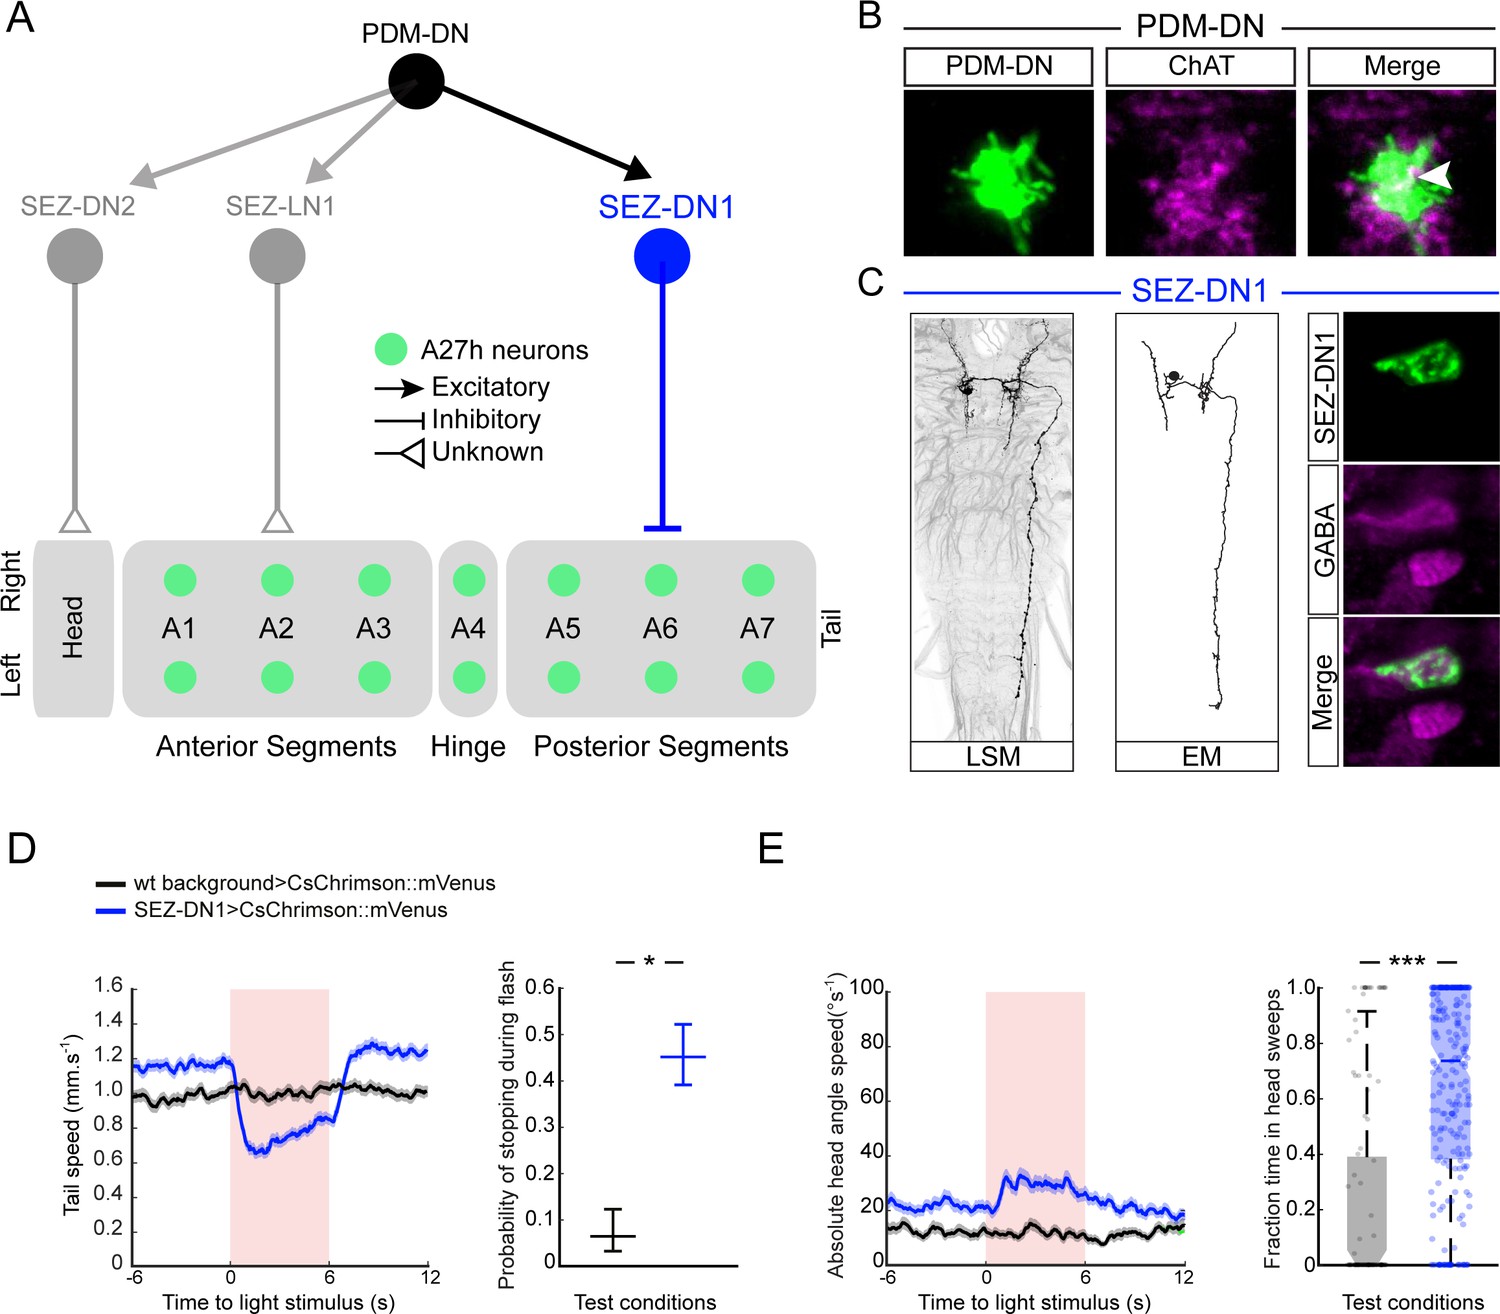
(A) A set of neurons in the SEZ connects PDM-DN to the premotor system. PDM-DN is presynaptic mainly to three neurons: SEZ-LN1, SEZ-DN1 and SEZ-DN2. The SEZ-DN1 neuron gives inputs to segmentally repeated excitatory premotor neurons called A27h (see Figure 5—figure supplement 1C). The A27h targets of PDM-DN are exclusively in the posterior segments. The SEZ-DN2 neuron controls the prothoracic-accessory-nerve motor neurons (PaN motor neurons), which control head tilting (see Figure 5—figure supplement 2C). The SEZ-LN1 neuron gives input to premotor neurons mainly at the anterior segments (see Figure 5—figure supplement 2D). The nature of individual connections is reported according to the symbol shown in the top right panel. (B) The axonal varicosities of the PDM-DN neuron (green, antibody staining against CsChrimson::mVenus) co-localize with the immunostaining against choline acetyltransferase (magenta) suggesting that PDM-DN is a cholinergic excitatory neuron. (C) Identification of a driver line specific to SEZ-DN1. Light microscopy (left) and EM reconstruction (middle) of the SEZ-DN1 neuron. (Right panel) The soma of SEZ-DN1 (green) co-localizes with the immunostaining against GABA (magenta) suggesting that SEZ-DN1 is an inhibitory neuron. (D) Optogenetic activation of SEZ-DN1 is sufficient to elicit stopping behavior (see Video 3). Time course of the tail-speed (left panel) and quantification of the probability of stopping upon SEZ-DN1 activation (right panel). Stopping is significantly more likely to take place upon SEZ-DN1 activation than in wild-type controls. The error bars show 95% confidence intervals for binomial distributions (Clopper-Pearson method, p<0.05). Sample sizes: n = 120 trials for wild-type background and n = 248 trials for SEZ-DN1 activation. Star indicates statistically significant difference. (E) SEZ-DN1 activation leads to head casting/turning behavior. Time course of the head-angle speed (left panel) and fraction of time spent in head sweeps during the light flashes (right panel). SEZ-DN1 activation evokes significant head casting/turning behavior compared to the wild-type control (Wilcoxon ranksum test). Sample sizes: n = 120 trials for wild-type background and n = 248 trials for SEZ-DN1 activation. Stars indicate a statistically significant difference (***, p<0.001).
Figure 5—figure supplement 1
PDM-DN is an excitatory descending neuron that is connected to the premotor neurons located in the posterior segments via SEZ-DN1.
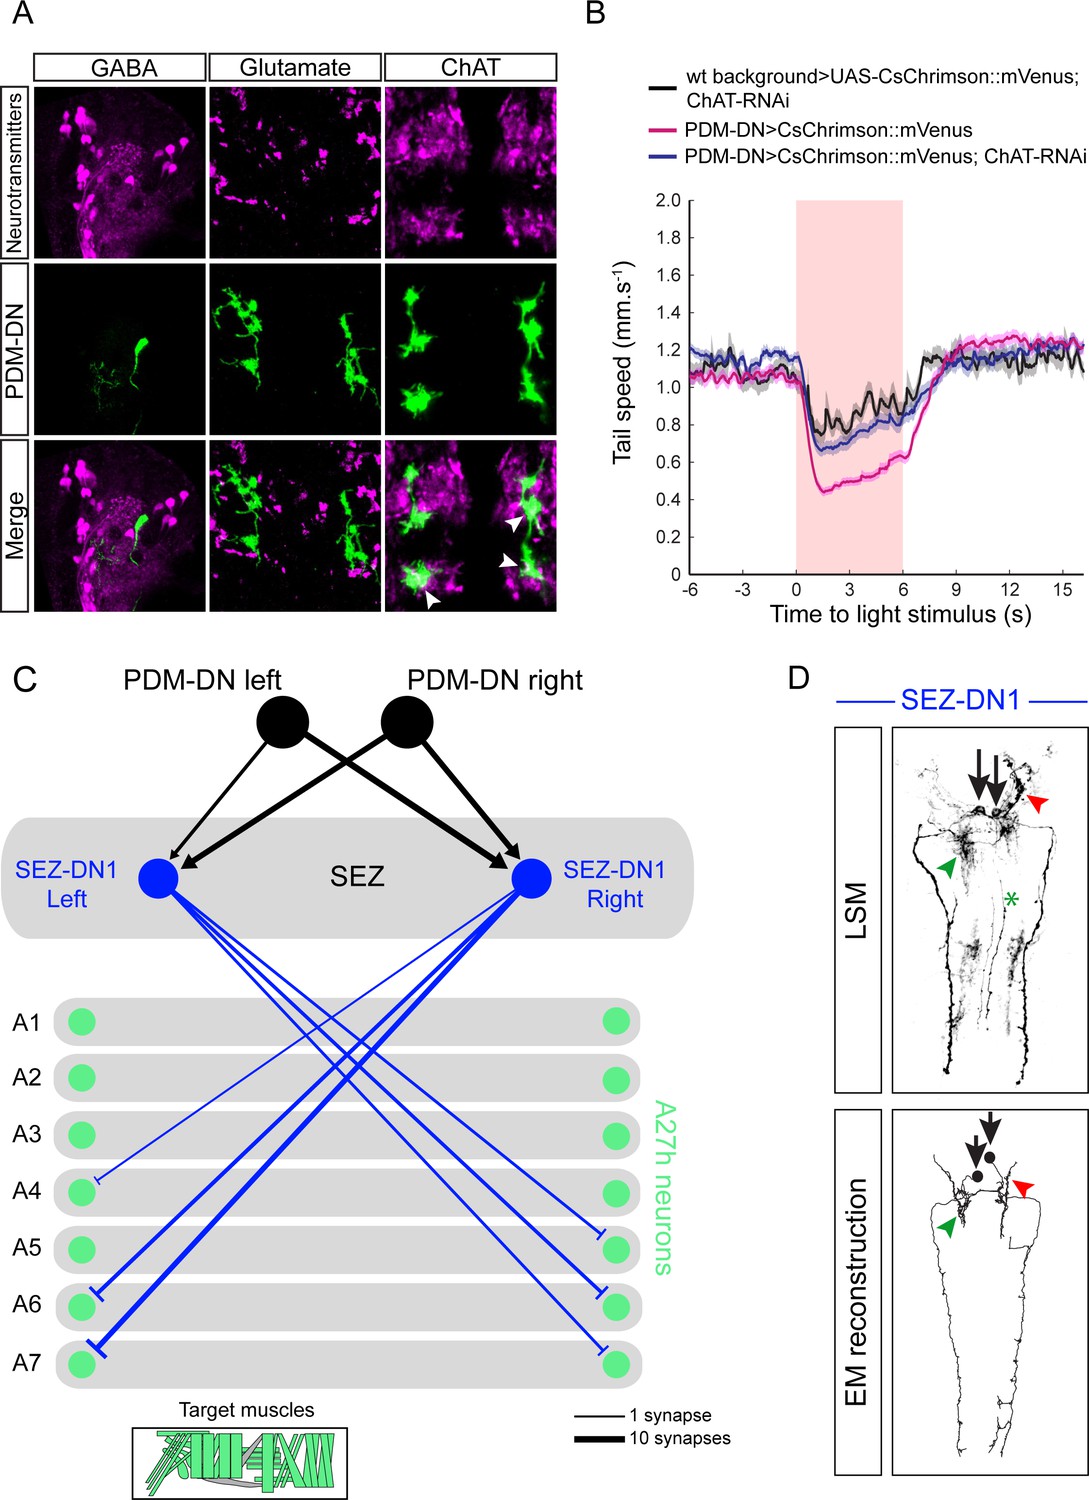
(A) Neurotransmitter profiling of the PDM-DN neuron. PDM-DN is GABA and glutamate negative. We observe a co-localization of the PDM-DN neuron with choline acetyltransferase suggesting that it is cholinergic. (B) To corroborate the possibility that PDM-DN is cholinergic, we optogenetically activated the PDM-DN neuron while abolishing acetylcholine release in the PDM-DN neuron by using RNAi knock-down of choline acetyltransferase. Expression of ChAT RNAi alleviates the effect of PDM-DN activation (C) Detailed downstream connectivity of the SEZ-DN1 neuron. PDM-DN gives bilateral inputs to SEZ DN1. SEZ DN1 exclusively projects to the posterior A27h premotor neurons. (Bottom panel) Muscle groups targeted by the A27h neurons. SEZ-DN1 targets both longitudinal and lateral muscles to induce stopping behavior. (D) Comparison of the light microscopy of the driver line identified for the SEZ-DN1 neuron (top panel) with the EM reconstruction of the SEZ-DN1 neuron (bottom panel). The soma (black arrows) and dendritic arbors (green and red arrowheads) of SEZ-DN1 are indicated. The green asterix highlights the stochastic labeling of the axon of an ascending neuron, which is occasionally labeled by this driver line.
Figure 5—figure supplement 2
PDM-DN is strongly connected to a set of three SEZ neurons.
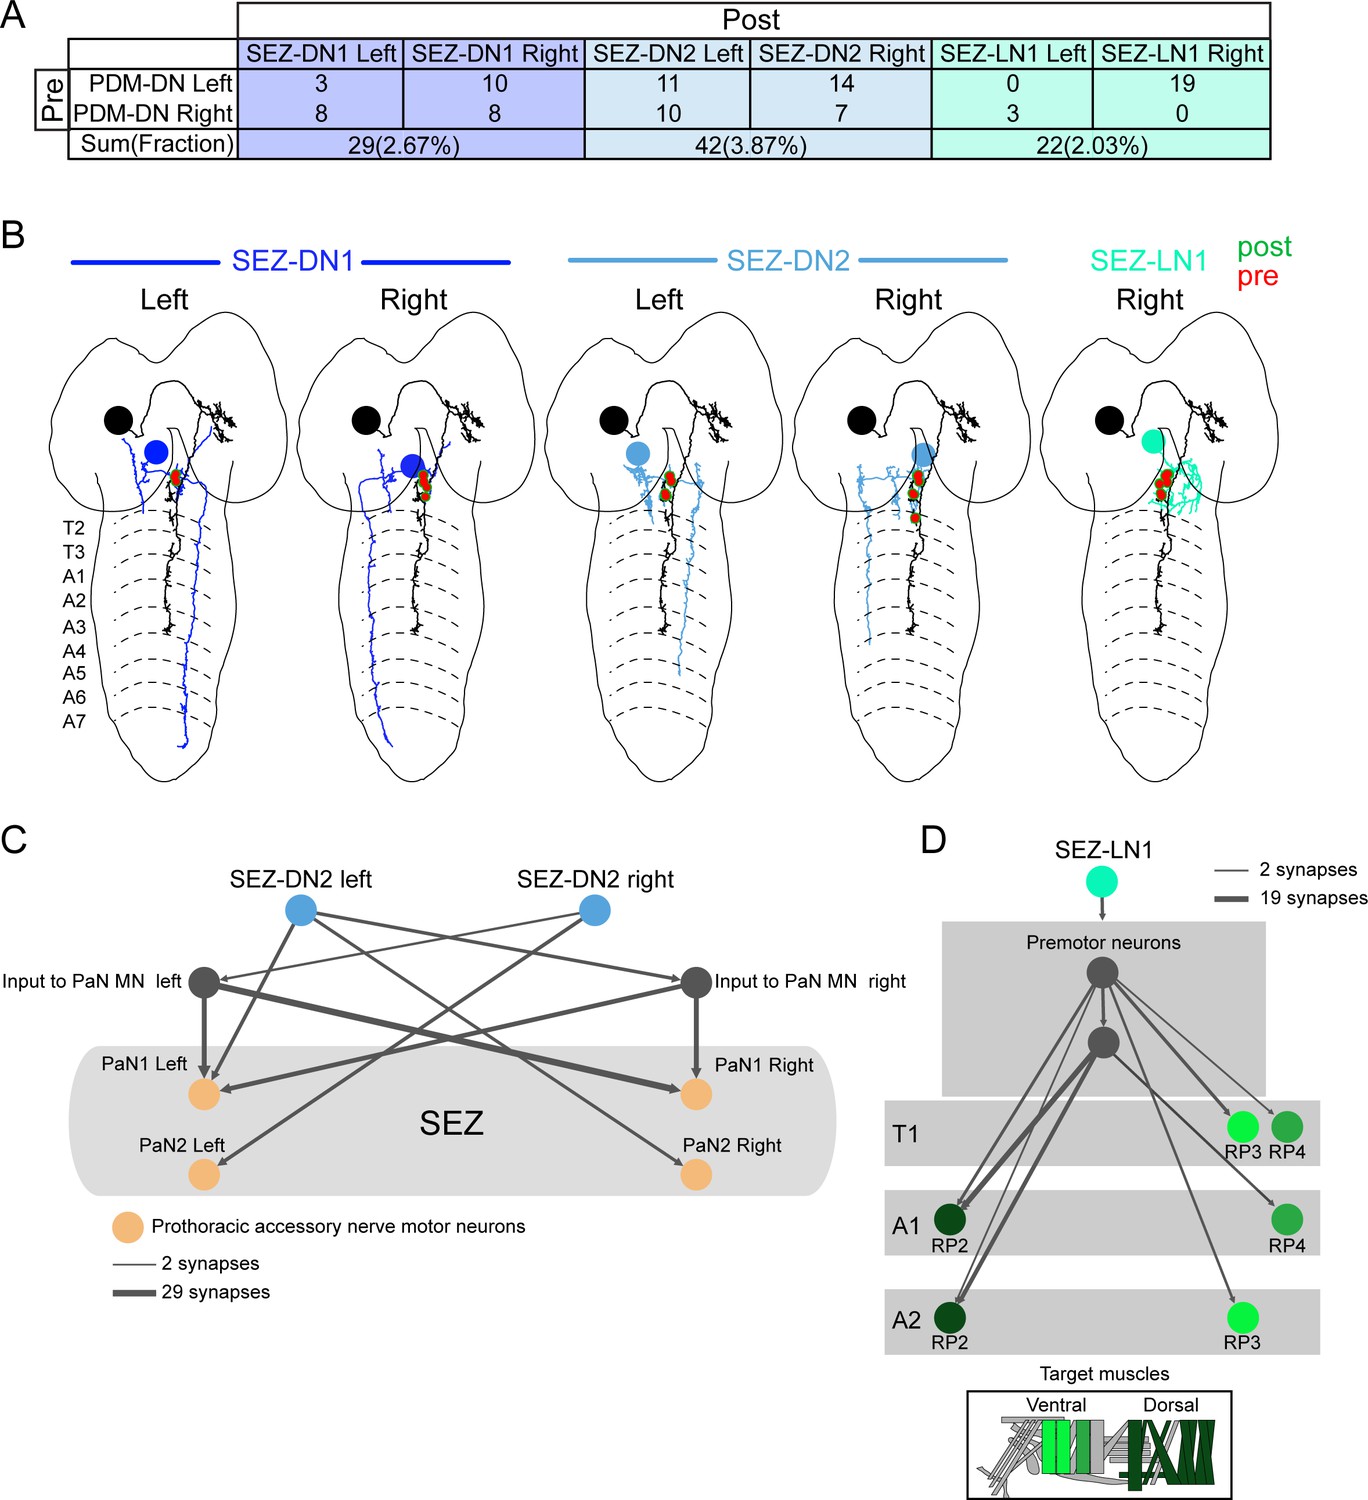
PDM-DN gives input to two descending neurons and one local interneuron located in the SEZ region (partial tracing). (A) Numbers of synapses observed between the PDM-DN neuron and its downstream partners in the SEZ regions. Corresponding fractions (number of synapses/total number of synaptic input to the PDM-DN neuron) are given in parentheses. (B) EM reconstruction of PDM-DN and its downstream partners in the SEZ. Presynaptic sites on the axon of the PDM-DN neuron (red) and postsynaptic sites on the dendritic arbor of the SEZ neurons (green). (C) SEZ-DN2 connects to prothoracic accessory nerve (PaN) motor neurons. (D) SEZ-LN1 connects to RP motor neurons at the anterior segments.
Figure 6

Detailed analysis of the gain-of-function phenotype of the SEZ-DN1 neuron at the level of segmental contractions and motor neuron activity.
Activation of SEZ-DN1 inhibits the forward wave propagation at the posterior segments of the VNC. (A) Decomposition of the SEZ-DN1 activation phenotype at the level of segmental contractions using immobilized larvae. The analysis results from the same protocol as Figure 4D. SEZ-DN1 was optogenetically activated when forward wave was at A2 (left), A3 (middle) or A6 (right). (Ai) When SEZ-DN1 activation coincided with wave propagation at A2 (red arrowhead), the current wave was likely to terminate but the initiation of a new wave was blocked for the duration of the light flash. (Aii) Occasionally a forward wave was initiated from segment A4 to segment A1 during the optogenetic activation of SEZ-DN1 (red dashed line, middle panel). However, no contractile activity was observed at the level of the posterior segments (dashed rectangle). (Aiii) SEZ-DN1 activation ceased ongoing forward wave immediately at the posterior segments. In this example, activation of SEZ-DN1 when the wave was at segment A6 (red arrowhead) led to an immediate termination of the wave (truncated dashed line). (B) Main effects of SEZ-DN1 activation on the propagation of the peristaltic wave reported as proportions. If SEZ-DN1 was activated when the forward wave was at the posterior segments, the wave often terminated immediately (magenta, see also panel Aiii). In ~20% of the cases, the next wave was inhibited during SEZ-DN1 activation (gray). Occasionally, a new forward wave started at A4 (green). We also observed a pull-push behavior in which the posterior segments engage in a loop of contraction-relaxation without wave propagating to more anterior segments (yellow, data not shown). Activation of SEZ-DN1 when the wave had reached the anterior segments led to a suppression of the initiation of new waves in ~40% of the cases (gray). Forward waves initiated at A4 were observed more frequently upon optogenetic activation of SEZ-DN1 when the ongoing wave was located in the anterior segments (~40%, green). For both the anterior and posterior segments, a small proportion of the optogenetic gain-of-function failed to affect the forward wave propagation (black). (C) Imaging of fictive locomotion patterns upon SEZ DN1 activation. Same protocol as Figure 4G (Ci) SEZ-DN1 optogenetic activation when the fictive wave was at A6 (first flash, red arrowhead) or at A7 (second flash, red arrowhead). Following the first flash, the ongoing wave terminated and a new wave could not be initiated during the duration of the flash. In subsequent flashes, the motor neuron activity was suppressed immediately at A6-7 and the wave stopped before reaching A5 (truncated dashed line). The entire course between the two flashes is not shown for clarity (dashes). (Cii) A wild-type control larva was exposed to the same flashes of light as the SEZ-DN1 >Chrimson. The light flashes had no impairing effects on forward wave initiation/propagation such that new forward waves could be initiated and completed during the light flashes. (D) Quantification of the effect of SEZ-DN1 activation on fictive forward locomotion. Same data-quantification protocol as Figure 4H. Optogenetic activation of the SEZ-DN1 neuron led to a decrease in number of forward waves (Wilcoxon signed-rank test, p<0.05) while wild-type controls were not affected by light flashes (Wilcoxon signed-rank test, p<0.05). Sample sizes: n = 23 trials for wild-type controls and n = 10 trials for SEZ-DN1 activation. Different letters indicate statistically significant differences. (E–F) Calcium imaging of SEZ-DN1 activity upon optogenetic activation of PDM-DN. (E-top panel) The approximate region of interest (ROI) for the quantification of SEZ-DN1 activity is highlighted with a rectangle. Axonal varicosities of PDM-DN (red) are faintly visible (arrows). A: anterior, P: posterior. (E-Bottom panel) Pseudo-colored illustration of the pattern of activity in the ROI shown in the top panel, before (left) and during PDM-DN activation (right). (F) Quantification of the SEZ-DN1 activity upon PDM-DN activation. (Left panel) Each CNS preparation was exposed to the same light-flash protocol five times. Quantification of the mean ∆F/F for each preparation. Upon PDM-DN activation (semitransparent red box), SEZ-DN1 activity increased drastically (orange). By contrast, SEZ-DN1 did not respond to the light flashes in the absence of CsChrimson::mVenus in the PDM-DN neuron (black). (Right panel) Boxplot of the peak responses measured on each trial. PDM-DN activation led to significant increase in the activity of SEZ-DN1 (Wilcoxon ranksum test). The line centered on the ‘waist’ represent the median of each experimental condition. Semi-transparent boxes represent the 25th and 75th percentiles. The whiskers extend to the most extreme data points excluding the outliers (default settings of the ‘boxplot’ function of Matlab). Starts indicate statistically a significant difference (***p<0.001). Sample sizes: n = 25 trials (five preparations) for SEZ-DN1 in the absence of PDM-DN activation and n = 35 trials (seven preparations) in the presence of PDM-DN activation. For more information about the statistics, see Supplementary file 1.
Figure 7

Sensorimotor circuit triggering the release of reorientation maneuvers during larval chemotaxis.
(A) Key partners of the sensorimotor pathway bridging the Or42a-expressing olfactory sensory neuron (OSN, yellow) to the descending neuron PDM-DN (black), down to the A27h premotor circuit (green) in the ventral nerve cord. (B) Putative sensorimotor transformation of positive changes in odor concentration (C(t)) during up-gradient runs. Positive gradients detected by the Or42a OSN promote the OSN activity, which is expected to strongly active its cognate uniglomerular projection neuron (uPN, orange). Due to the cholinergic nature of olfactory projection neurons, excitation of the Or42a uPN promotes the activity of the LH-LN1 neuron (pink) located in the lateral horn region. In turn, the activity of LH-LN1 controls both the LH-LN2 and PDM-DN neuron. We speculate that the 3-element feedforward motif formed by LH-LN1, LH-LN2 and PDM-DN converts the activity of Or42a uPN into an inhibition of PDM-DN. As PDM-DN is cholinergic, the lack of activity of PDM-DN is expected to leave its downstream GABAergic partner SEZ-DN1 (blue) inactive. As a result, the sensorimotor pathway mediated by PDM-DN has no inhibitory effect on the A27h premotor circuit (green), which promotes forward peristalsis (runs). As indicated in the legend, neurons with a contour in black are thought to be excited. Neurons with a contour in red are thought to be inhibited or inactive. (C) Same as B upon detection of negative odor changes during down-gradient runs. Negative odor gradients inhibit the activity of Or42a OSN, which is thought to leave the Or42a uPN inactive. As a result, we speculate that the 3-element feedforward motif formed by LH-LN1, LH-LN2 and PDM-DN converts the inactivity of Or42a uPN into an excitation of PDM-DN. In turn, the firing activity of the cholinergic PDM-DN is thought to excite SEZ-DN1. Due to the GABAergic nature of SEZ-DN1, excitation of PDM-DN and SEZ-DN1 represses the activity of the A27h premotor circuit (green) in the posterior segments of the ventral nerve cord (VNC), thereby triggering an interruption in forward peristalsis (stop). Videos.
Videos
Video 1
Optogenetic activation of the PDM-DN neuron.
Larva turns red when PDM-DN is activated. Head position is indicated by red dots and centroid position is indicated by a white line. The video sequence starts with the test condition (PDM-DN expressing CsChrimson) followed by the wild-type control (wild-type background crossed to UAS-CsChrimson).
Video 2
Peristaltic wave propagation in a restricted larva.
https://doi.org/10.7554/eLife.38740.018
Video 3
Optogenetic activation of the SEZ-DN1 neuron.
Larva turns red when SEZ-DN1 is activated. Head position is indicated by red dots and centroid position is indicated by a white line. The video sequence starts with the test condition (PDM-DN expressing CsChrimson) followed by the wild-type control (wild-type background crossed to UAS-CsChrimson).
Tables
Key resources table
| Reagent type | Designation | Source or reference | Identifiers | Additional information |
|---|---|---|---|---|
| Fly line | R23E07-p65.AD | Bloomington drosophila stock center | Rrid:BDSC_70131 | Landing site: attP40 |
| Fly line | VT002081-GAL4.DBD | Bloomington Drosophila Stock Center | RRID: BDSC_73398 | Landing site: attP2 |
| Fly line | UAS-TNTE | (Tastekin and Louis, 2017) | NA | Secondchromosome |
| Fly line | UAS-TNTG | Bloomington Drosophila Stock Center | RRID: BDSC_28838 | Second chromosome |
| Fly line | 20XUAS-IVS-CsChrimson.mVenus | Bloomington Drosophila Stock Center | RRID: BDSC_55136 | Landing site: attP2 |
| Fly line | 20XUAS-IVS-CsChrimson.mVenus | Bloomington Drosophila Stock Center | RRID: BDSC_55134 | Landing site: attP18 |
| Fly line | R57C10-FLP2::PEST | (Nern et al., 2015) | NA | Gift from Aljoscha Nern |
| Fly line | R57C10-FLPL attp8; 10xUAS(FRT.stop)myr ::smGdP-HA VK00005; 10xUAS(Frt.stop)myr::smGdP-V5-THS- 10XUAS(FRT.stop)myr::smGdP-FLAG su(Hw)attP1 | Bloomington Drosophila Stock Center | RRID: BDSC_64087 | Gift from Aljoscha Nern |
| Fly line | CG9887-LexA su(Hw)attP8 | NA | NA | Julie Simpson |
| Fly line | 20XUAS(Frt.stop)Chrimson::mVenus attP2 | NA | NA | Gift from Vivek Jayaraman |
| Fly line | 20XUAS-IVS-CsChrimson.mVenus attP18; CG9887-LexA su(Hw)attP8; 12XlexAop2- IVS-GCaMP6f-p10 su(Hw)attP5 | NA | NA | Gift from Stefan Pulver |
| Fly line | R75C02-GAL4 | (Li et al., 2014) available at Bloomington Drosophila Stock Center | RRID: BDSC_39886 | Landing site: attP2 |
| Fly line | R75C02-LexA/Cyo | (Li et al., 2014) available at Bloomington Drosophila Stock Center | RRID: BDSC_54365 | Landing site attP40 |
| Fly line | ChAT RNAi | Vienna Drosophila Resource Center | RRID: FlyBase_FBst0463844 | |
| Fly line | 13xLexAop2-IVS-GCaMP6f-p10 50.693 in VK00005, 20xUAS-CsChrimson-mCherry-trafficked in su(Hw)attp1 | NA | NA | Gift from Vivek Jayaraman |
| Odor | Ethyl butyrate | MilliporeSigma, MO, USA | Cat# 19230 | CAS#: 105-54-4 |
| Odor | Ethyl acetate | MilliporeSigma, MO, USA | Cat# 319902 | CAS#: 141-78-6 |
| Chemical | Paraffin oil | MilliporeSigma, MO, USA | Cat# 18512 | CAS#: 8012-95-1 |
| Chemical | PBS | MilliporeSigma, MO, USA | Cat# P4417 | |
| Chemical | Agarose | Lonza, Basel, Switzerland | Cat# 50001 | |
| Chemical | Bacto Agar | Thermo Fisher Scientific, MA, USA | Cat# DF0812-07-1 | |
| Chemical | Vectashield | Vector Laboratories, CA, USA | Cat# H1000 | |
| Chemical | Poly-L-lysine solution | MilliporeSigma, MO, USA | Cat# P8920 | CAS#: 25988-63-0 |
| Chemical | Formaldehyde | Thermo Fisher Scientific, MA, USA | Cat# NC9658705 | |
| Chemical | All trans-retinal | MilliporeSigma, MO, USA | Cat# R2500 | CAS#: 116-31-4 |
| Chemical | Sucrose | MilliporeSigma, MO, USA | Cat# S0389 | CAS#: 57-50-1 |
| Chemical | Sodium Chloride | MilliporeSigma, MO, USA | Cat# S7653 | CAS#: 7647-14-5 |
| Chemical | Calcium Chloride | MilliporeSigma, MO, USA | Cat# 21115 | CAS#: 10043-52-4 |
| Chemical | Magnesium Chloride Hexahydrate | MilliporeSigma, MO, USA | Cat# P2670 | CAS#: 7791-18-6 |
| Chemical | Potassium Chloride | MilliporeSigma, MO, USA | Cat# P9571 | CAS#: 7447-40-7 |
| Chemical | TES | MilliporeSigma, MO, USA | Cat# T1375 | CAS#: 7365-44-8 |
| Chemical | Sylgard 184 | Dow Corning, MI, USA | Cat# 4019862 | |
| Antibody | Mouse anti-brp (nc82) | Development Studies Hybridoma Bank (DSHB), IA, USA | RRID: AB_2314866 | 1:25 dilution |
| Antibody | Mouse anti-synorf1 (3C11) | Development Studies Hybridoma Bank (DSHB), IA, USA | RRID: AB_2313867 | 1:25 dilution |
| Antibody | Rabbit anti-GFP | Thermo Fisher Scientific, MA, USA | RRID: AB_221569 | 1:500 dilution |
| Antibody | Mouse anti-GFP | Thermo Fisher Scientific, MA, USA | RRID: AB_221568 | 1:500 dilution |
| Antibody | Mouse anti-ChAT (ChAT4B1) | Development Studies Hybridoma Bank (DSHB), IA, USA | RRID: AB_528122 | 1:100 dilution |
| Antibody | Rabbit anti-Glutamate | - | RRID: AB_2490070 | 1:1000 dilution Gift from Hermann Aberle |
| Antibody | Rabbit anti-GABA | MilliporeSigma, MO, USA | RRID: AB_472652 | 1:2000 dilution |
| Antibody | Rabbit anti-HA-Tag (C29F4) | Cell Signaling Technology, MA, USA | RRID: AB_1549585 | 1:500 dilution |
| Antibody | Goat anti-Rabbit Alexa Fluor 488 | Thermo Fisher Scientific, MA, USA | RRID: AB_143165 | 1:500 dilution |
| Antibody | Goat anti-Rabbit DyLight 549 | Vector Laboratories, CA, USA | RRID: AB_2336407 | 1:500 dilution |
| Antibody | Goat anti-Mouse Texas Red | Jackson ImmunoResearch Laboratories, PA, USA | Cat# 115-075-003 | Discontinued 1:500 dilution |
| Antibody | Goat anti-Mouse FITC | MilliporeSigma, MO, USA | RRID: AB_259804 | 1:500 dilution |
| Serum | Goat Serum | MilliporeSigma, MO, USA | Cat# G9023 | 3% dilution |
| Consumable | 96 well plate lids with condensation rings | MilliporeSigma, MO, USA | Cat# L3661 | |
| Consumable | 96 well plate lids without condensation rings | MilliporeSigma, MO, USA | Cat# L3536 | |
| Consumable | 245 mm x 245 mm Petri dish | MilliporeSigma, MO, USA | Cat# CLS431111 | |
| Software | MATLAB 2015b | Mathworks, MA, USA | RRID: SCR_001622 | |
| Software | LabView | National Instruments, TX, USA | RRID: SCR_0014325 | |
| Software | Fiji/ImageJ | Fiji | RRID: SCR_002285 |
Additional files
-
Supplementary file 1
Tables summarizing the conditions and results of the statistical tests conducted throughout the manuscript.
- https://doi.org/10.7554/eLife.38740.025
-
Transparent reporting form
- https://doi.org/10.7554/eLife.38740.026
Download links
A two-part list of links to download the article, or parts of the article, in various formats.
Downloads (link to download the article as PDF)
Open citations (links to open the citations from this article in various online reference manager services)
Cite this article (links to download the citations from this article in formats compatible with various reference manager tools)
Sensorimotor pathway controlling stopping behavior during chemotaxis in the Drosophila melanogaster larva
eLife 7:e38740.
https://doi.org/10.7554/eLife.38740


