Metformin reverses early cortical network dysfunction and behavior changes in Huntington’s disease
- University Medical Center, Germany
- German Center for Neurodegenerative Diseases (DZNE), Germany
- Ninewells Hospital and Medical School, United Kingdom
- Max-Delbrück-Center, Germany
Figures
Figure 1 with 5 supplements

In vivo two-photon Ca2+ imaging in layer 2/3 of visual cortex reveals a hyperactive neuronal activity pattern prior to disease onset.
(a,b) Top right, Illustrations indicating the visual cortex (blue area) in human (a) and mouse (b) brains. The brains are not drawn to scale. Bottom, timeline of Huntington’s disease progression in human and Hdh150 mouse model of Huntington’s disease. The Huntington’s disease onset was age 30–50 years in humans and ~70 weeks in Hdh150 mice. We conducted our experiments during a very early pre-symptomatic phase, far prior to mHtt aggregates and motor symptoms. VFDO: very far from disease onset. (c) Representative two-photon images of OGB-1 AM staining in layer 2/3 of the visual cortex of WT and Hdh150 mice. Scale bar: 70 µm. (d) Color-coded maps of silent (black) and spontaneously active (orange) neurons in WT (left) and Hdh150 (right) mice. Dashed lines represent the boundaries of blood vessels (original images in Figure 1c). Scale bar: 100 µm. (e) Density of stained cells in layer 2/3 of the visual cortex in WT and Hdh150 mice. Unpaired t-test, p=0.71. (f) Increased proportion of spontaneously active neurons in Hdh150 mice. Unpaired t-test, p<0.05. (g) Representative traces of spontaneous Ca2+ transients (red) of 10 neurons recorded in vivo in WT and Hdh150 mice. Vertical scale bars: 40% dF/F. (h) Increased frequency of Ca2+ transients in spontaneously active neurons of Hdh150 mice. Silent neurons were excluded, as in subsequent panels. Mann-Whitney test, p<0.01 (i) Quantification of area under the curve (AUC) of Ca2+ transients. Unpaired t-test, p=0.98 (j) Cumulative frequency distribution of Ca2+ transients in WT (dark grey) and Hdh150 (red) mice. Top, colored categorization of neurons according to their Ca2+ transient frequencies. Two-way ANOVA, group: p<0.0001, time: p<0.0001, Interaction: p<0.0001. (k) Color-coded categorization of neurons according to their Ca2+ transient frequency: ‘low’ (<0.3 trans/min, blue; silent neurons excluded), ‘medium’ (0.3–3 trans/min, orange) and ‘hyper’ (>3 trans/min, red). Each peak is marked by an asterisk. (l) Relative proportion of low, medium and hyperactive neurons in layer 2/3 of the visual cortex in WT (left) and Hdh150 (right) mice. Chi-square test, p<0.01.
-
Figure 1—source data 1
Numerical values of Figure 1 and associated supplement figures.
- https://doi.org/10.7554/eLife.38744.007
-
Figure 1—source data 2
Code used for the analysis of calcium imaging.
- https://doi.org/10.7554/eLife.38744.008
Figure 1—figure supplement 1
Ca2+ events from astrocytes and neurons show clearly distinct kinetics.
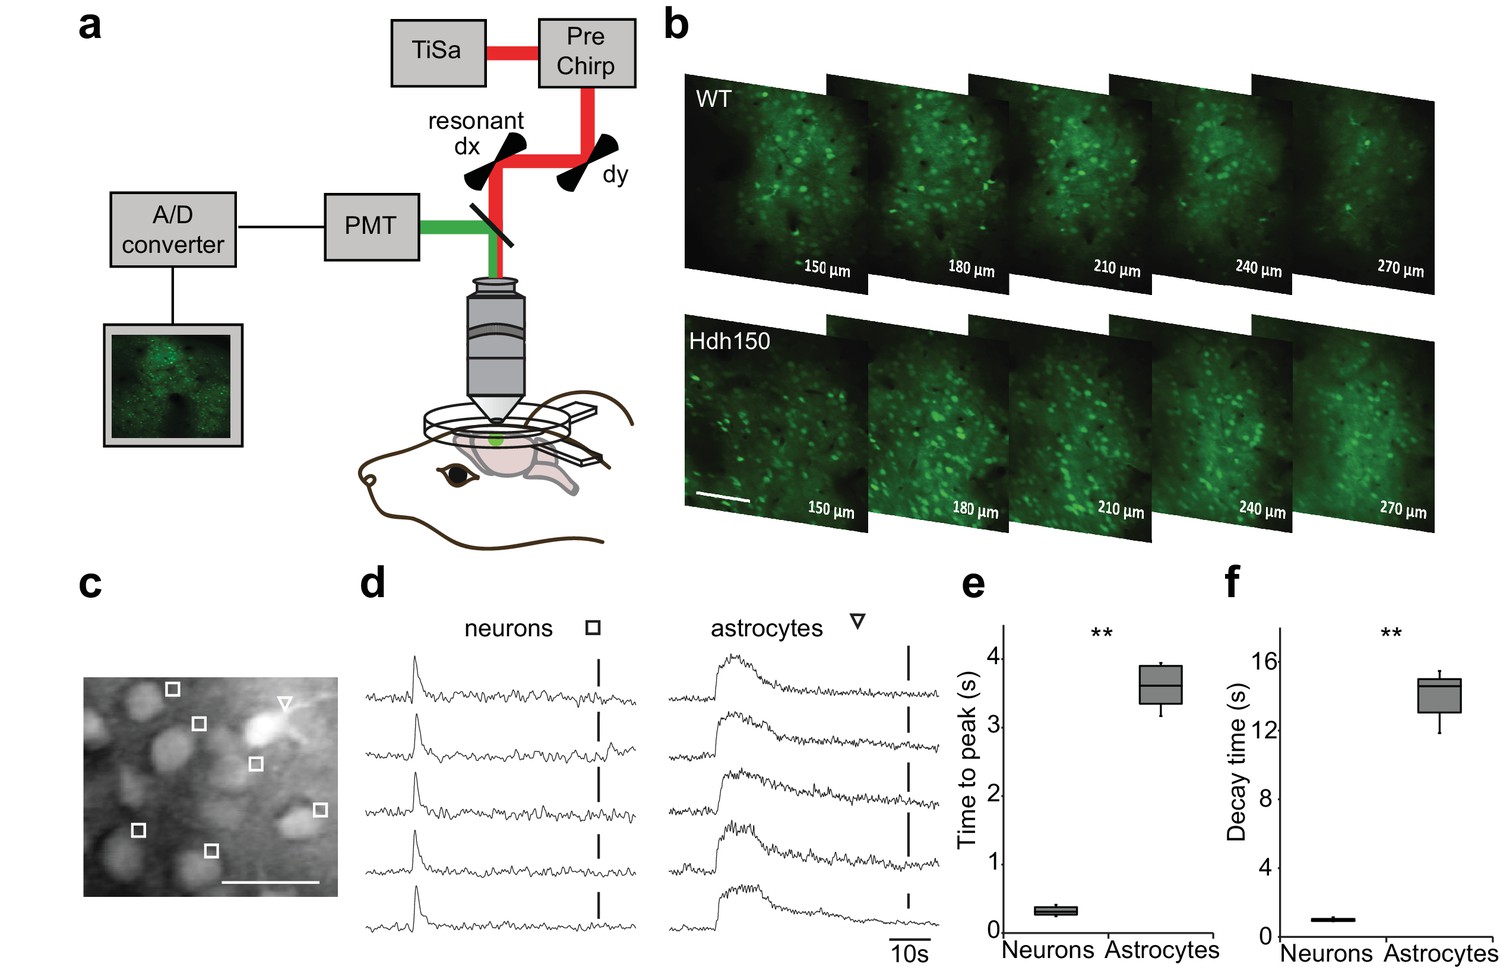
(a) Schematic diagram of the two-photon microscope used for high-speed Ca2+ imaging in vivo. The synthetic dye OGB-1 AM loaded in layer 2/3 of mouse visual cortex was excited by pulsed laser light generated by a Ti:sapphire laser (λ = 800 nm), a resonant scanner enabled video-rate imaging. Emitted light was collected by a photomultiplier tube (PMT). (b) Two-photon images of OGB-1 AM staining captured in vivo at depths between 150 and 270 µm from the pial surface in the visual cortex of WT (top) and Hdh150 (bottom) mice. Scale bar: 70 µm. (c) Two-photon image of OGB-1 AM staining in layer 2/3 of the visual cortex. Neurons (open squares) show round shapes with no processes. Astrocytes (inverted open triangle) in contrast, are more intensely stained; both the soma and processes can be visualized. Scale bar: 40 µm. (d) Five representative traces recorded for visually identified neurons (left) and astrocytes (right). Putative astrocytes show slower rise time, longer duration, and slower decay. The onset of events is aligned. Scale bars: 40% dF/F. (e, f) Box-and-whisker plots displaying the time to peak (e) and decay time (f) in neurons and astrocytes. Mann-Whitney test, p<0.01. .
Figure 1—figure supplement 2
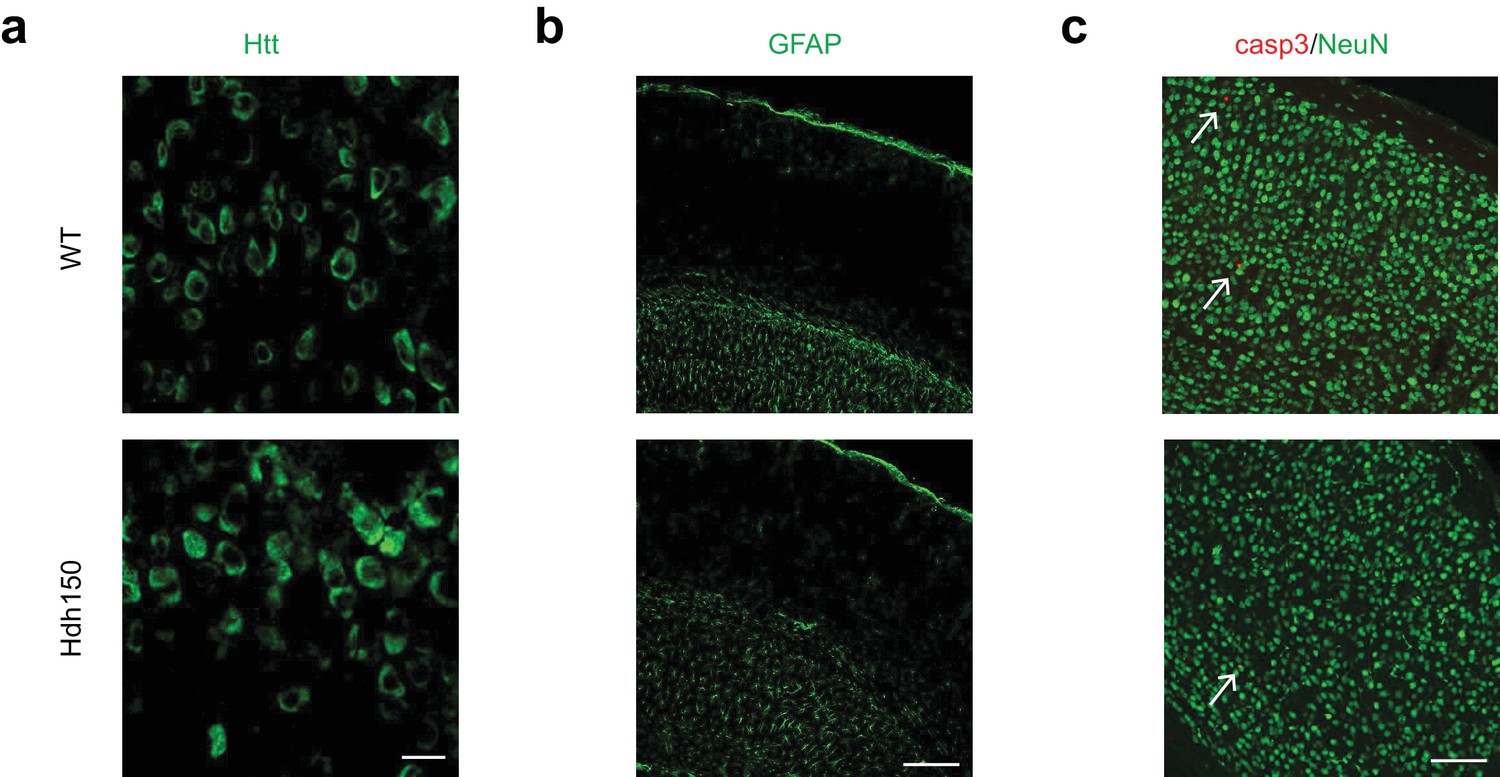
Cortical hyperactivity is independent of mHtt aggregation, astrogliosis or apoptotic cell death in presymptomatic VFDO Hdh150 mice.
(a, b, c) Confocal images of sagittal or coronal sections of 13 weeks old WT and Hdh150 mice stained for Htt proteins (a), glial fibrillary acidic protein (GFAP, (b)) and neuronal (NeuN, (c)) and apoptotic markers (cleaved-caspase 3, (c), arrows). Scale bars: 20 (a), 200 (b) and 100 (c) µm.
Figure 1—figure supplement 3
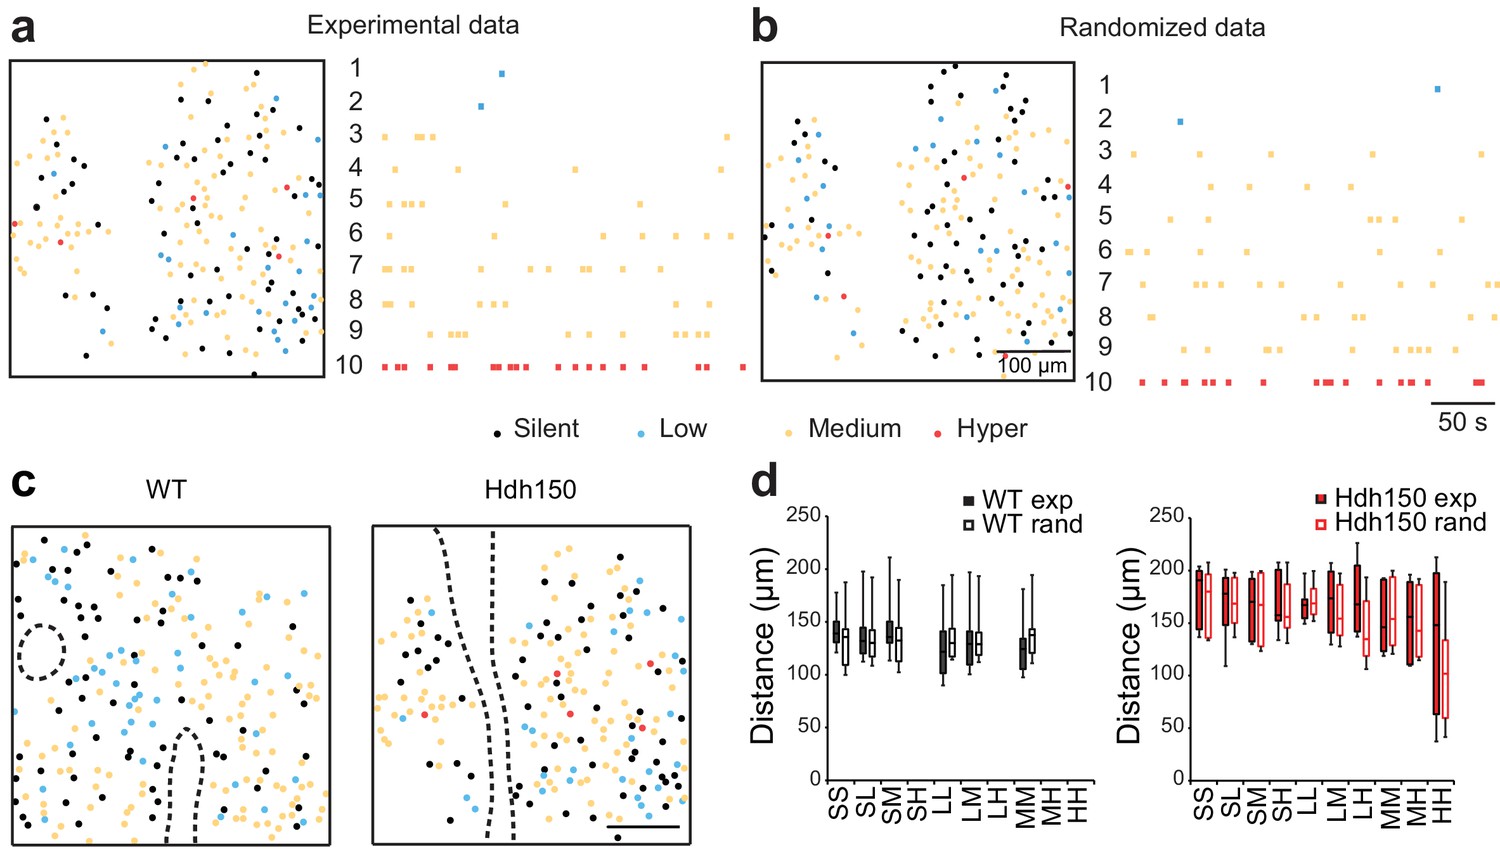
Randomization of experimental data to assess specific spatial clustering.
(a,b) Color-coded spatial distributions and raster plots of the peak of Ca2+ transients in low (blue), medium (orange) and hyperactive (red) neurons recorded in vivo in layer 2/3 of the visual cortex ((a), left) and after randomization of the data ((b), right). Silent cells are also displayed in the color-coded maps (black). (c) Color-coded spatial distribution of silent (black), low (blue), medium (orange) and hyperactive (red) neurons in WT (left) and Hdh150 (right) mice. The maps are equivalent to Figure 1d, but active neurons were subdivided into groups based on Ca2+ transient frequency. Dashed line outlines the boundary of blood vessels. Scale bar: 100 µm. (d) Box-and-whisker plot showing the mean pairwise distance for the different type of neuronal pairs (SS: silent-silent, SL: silent-low, SM: silent-medium, SH: silent-hyper, LL: low-low, LM: low-medium, LH: low-hyper, MM: medium-medium, MH: medium-hyper, HH: hyper-hyper) in WT (filled dark grey) and Hdh150 (filled red) mice. The experimental data were compared to randomized data (WT rand and Hdh150 rand, open dark grey and red, respectively). No significant difference was observed between groups in WT and Hdh150 mice. This indicated an absence of spatial clustering among any of the subgroups of active neurons. Mann-Whitney test, not significant, see Table 1 for p-values.
Figure 1—video 1
In vivo two-photon images of mouse visual cortex performed at different depths (indicated in the upper left corner) after multi-bolus loading with OGB-1 AM.
Scale bar: 50 µm.
Figure 1—video 2
Representative time-lapse of in vivo two-photon Ca2+ imaging acquired in layer 2/3 of mouse visual cortex showing single-cell Ca2+ transients.
Scale bar: 40 µm.
Figure 2 with 2 supplements
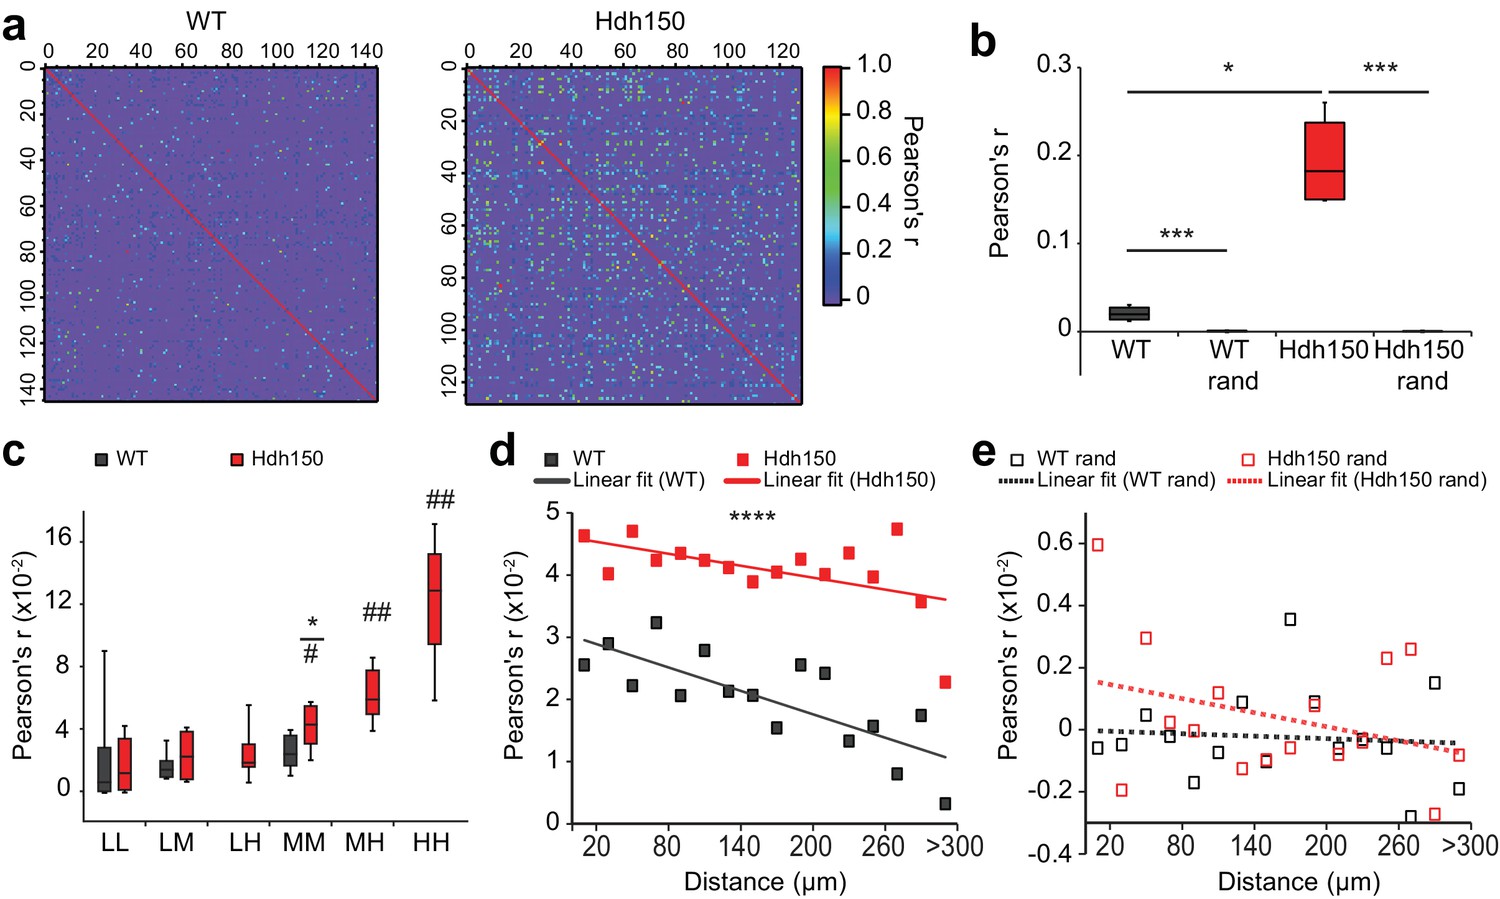
Presymptomatic Hdh150 mice exhibit an increased synchronicity of cortical microcircuits.
(a) Color-coded Pearson’s r matrices calculated from representative recordings of WT (left) and Hdh150 (right) mice. Silent cells were excluded from the analysis. Right, color-coded scale of Pearson’s r values. (b) Overall Pearson’s correlation coefficient (Pearson's r) in WT (dark grey) and Hdh150 (red) mice for experimental (filled) and randomized (open) raster data. Mann-Whitney test, WT vs. Hdh150 p<0.05; WT vs. WT rand p<0.0001; Hdh150 vs. Hdh150 rand p<0.0001 (c) Pearson’s r for combinations of neuronal pairs (LL: low-low, LM: low-medium, LH: low-hyper, MM: medium-medium, MH: medium-hyper, HH: hyper-hyper) in WT (dark grey) and Hdh150 (red) mice. * pairwise comparisons between a pair of WT and Hdh150 mice. # comparisons of functional subgroup pairs to the low-low pair within the same genotype. The pairs involving hyperactive neurons could only be analyzed in Hdh150 mice. Mann-Whitney test, WT vs. Hdh150 mice: MM p<0.05 in Hdh150 mice; compared to LL: MM p<0.05, MH p<0.01, HH p<0.01 (d,e) Relationship between Pearson’s r and distance between neuronal pairs in WT (black) and Hdh150 (red) mice (d) and randomized data (e). Lines represent the linear fit of WT and Hdh150 experimental data. Two-way ANOVA (d) Genotype: p<0.0001 Distance: p=0.97, Interaction: p=0.3, (e) Genotype = 0.35, p=0.3, Interaction: p=0.8.
-
Figure 2—source data 1
Numerical values of Figure 2 and associated supplement figures.
- https://doi.org/10.7554/eLife.38744.015
Figure 2—figure supplement 1
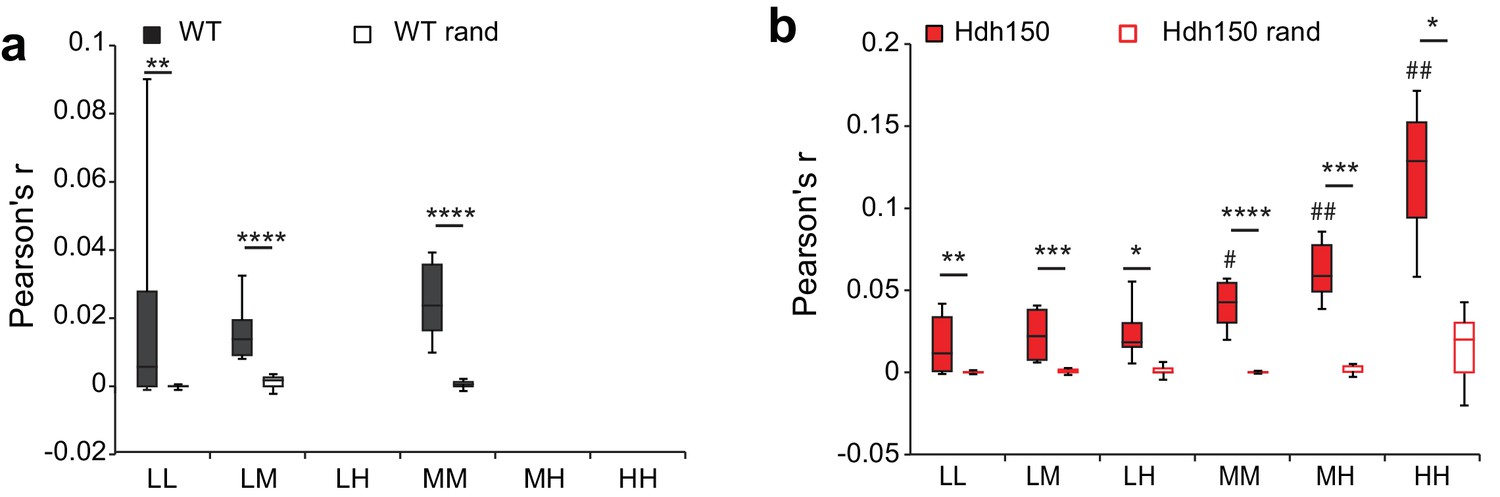
Randomization of experimental data to assess specific network synchronicity.
(a,b) Comparison of Pearson’s r for different functional subgroup pairs in WT experimental and randomized data (a) and Hdh150 data (b), *p<0.05, **p<0.01 and ***p<0.001, Mann-Whitney test. #p<0.05, ##p<0.01, in comparisons of functional subgroup pairs to the low-low pair within the same genotype.
Figure 2—figure supplement 2
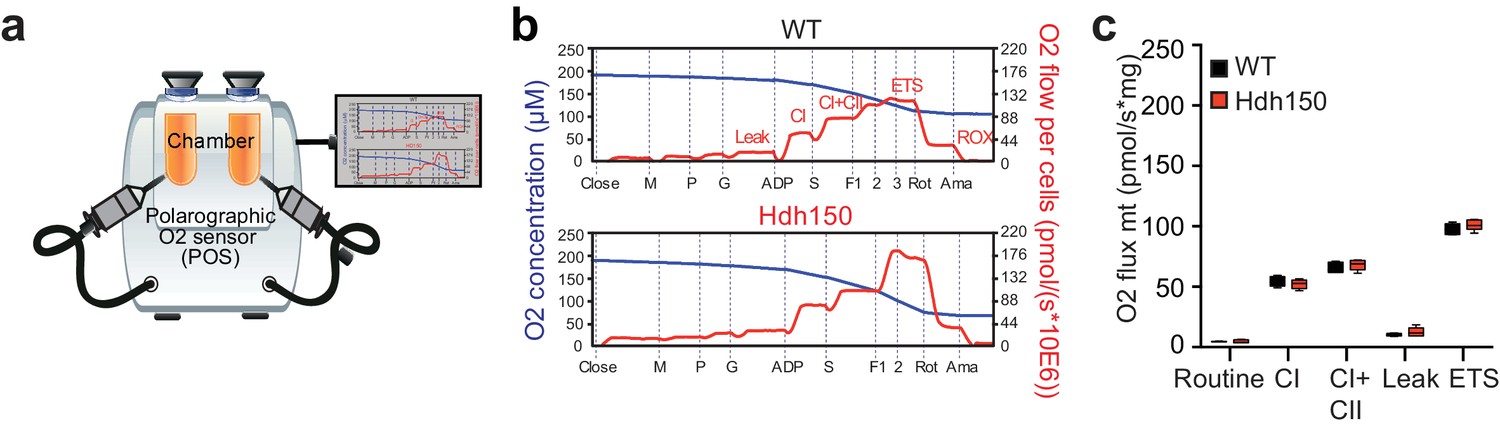
Presymptomatic Hdh150 mice did not exhibit alteration of mitochondria respiration.
(a,b) Scheme of the Oroboros O2K respirometer and typical traces obtained from high-resolution respirometry of microdissected cortical tissue from male WT or Hdh150 mice. (c) Box-and-whisker plot depicting the O2 flow in n = 6 mice per genotype. No difference was observed indicating that mitochondria respiration is similar in the two genotypes. Mann-Whitney test, not significant, see Table 1 for p-values.
Figure 3 with 2 supplements

Presymptomatic VFDO Hdh150 mice exhibit anxiolytic behavior.
(a) Representative travel pathways of WT (left) and presymptomatic Hdh150 (right) mice analyzed in a 5 min open field test. (b) Increased explorative behavior of Hdh150 animals compared to the WT mice. Mann-Whitney test, p<0.05.
-
Figure 3—source data 1
Numerical values of Figure 3 and associated supplement figures.
- https://doi.org/10.7554/eLife.38744.018
Figure 3—figure supplement 1
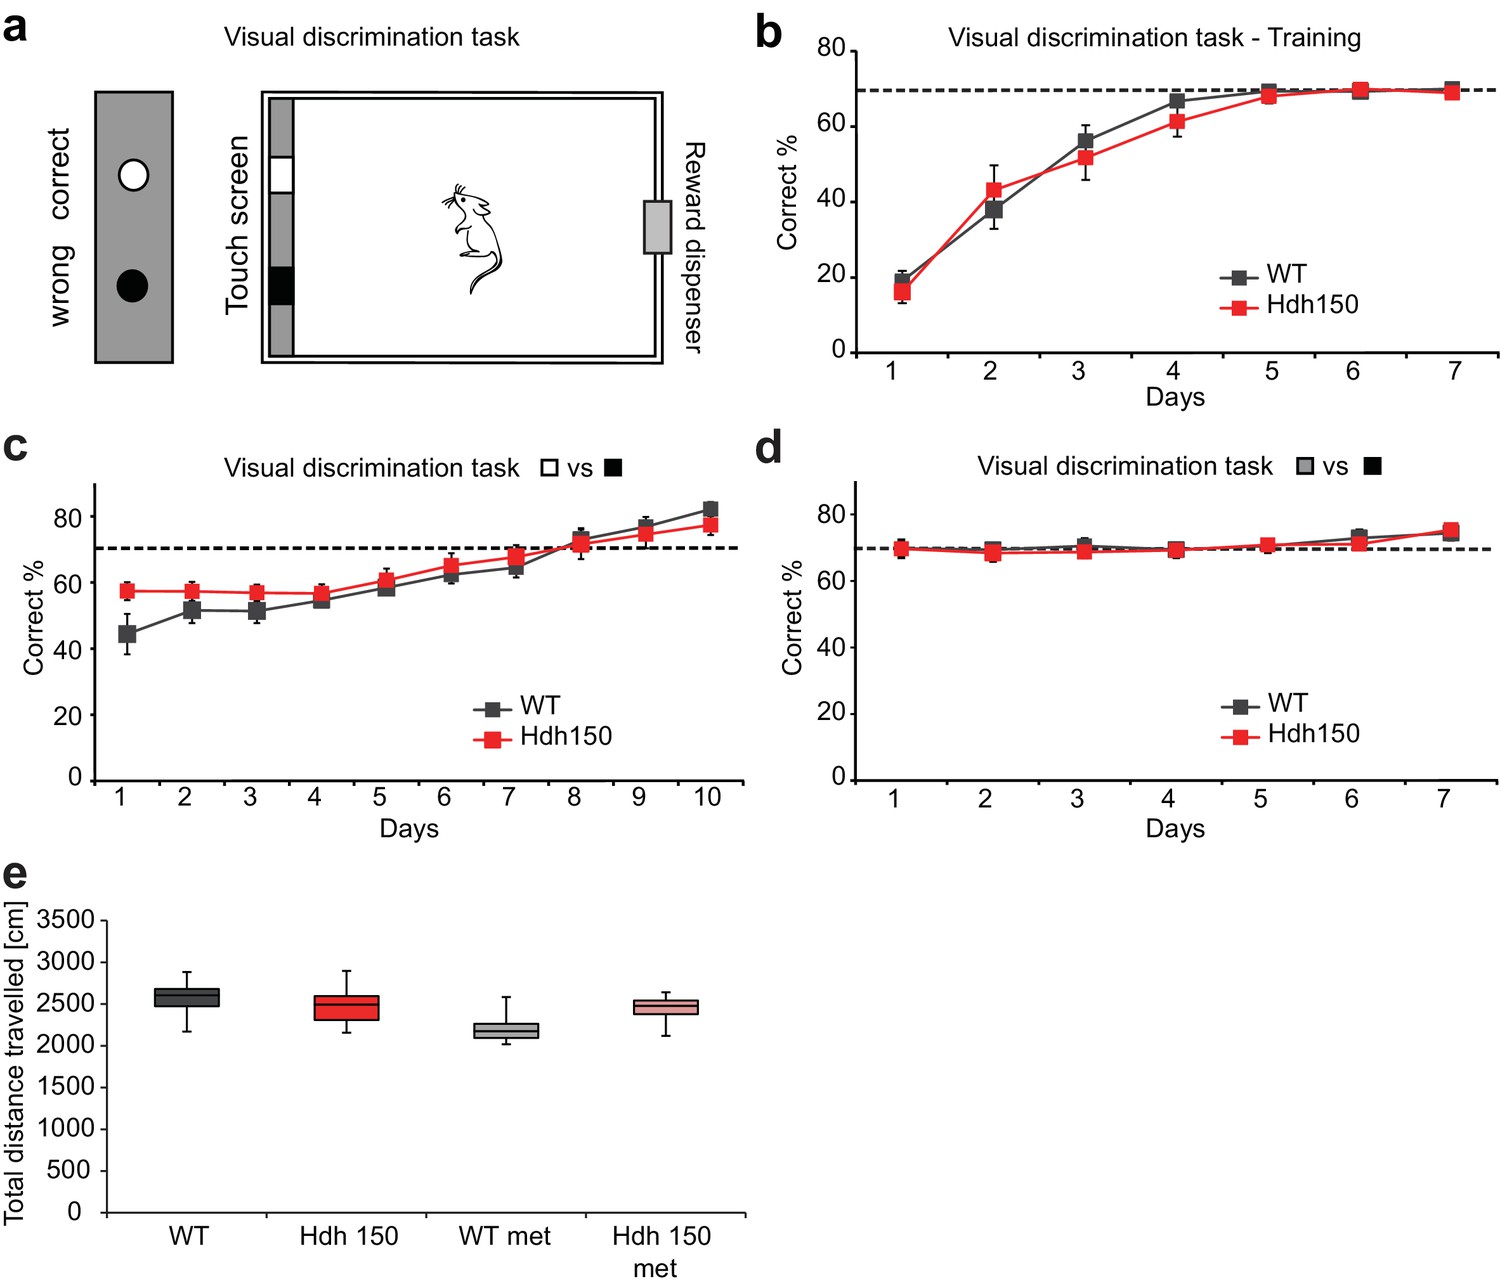
Presymptomatic VFDO Hdh150 mice did not exhibit deficit in visual discrimination test and explorative behavior in novel object recognition test.
(a) Schema of the visual discrimination task set-up. Left, front view of the touch screen panel. Right, top view of the complete test set-up. A monitor is placed at the end of the unit which simultaneously displays the correct and false choice. Both WT and presymptomatic VFDO Hdh150 mice were trained to choose the correct screen and for each correct choice made, a food pellet was released from a reward dispenser placed on the other end of the unit. (b) Graph representing time course of the training sessions of WT (dark grey) and presymptomatic Hdh150 (red) mice. Training sessions were carried out for both groups; mice that made at least 70% correct choice for 3 consecutive days were considered for discrimination analysis. After a training period of 7 days, mice were able to perform tasks successfully reaching the 70% criterion (dashed line). Note that no significant difference was observed between WT and Hdh150 mice during the training of visual discrimination task. Repeated measures two-way ANOVA, genotype p=0.6; time p<0.0001; interaction p=0.6. (c,d) Time course of visual performance in WT (dark grey) and Hdh150 (red) mice during visual discrimination first of black and white screens (c) and then of black and grey screens (d). c: Repeated measures two-way ANOVA, genotype p=0.5; time p<0.0001; interaction p=0.03. d: Repeated measures two-way ANOVA, genotype p=0.8; time p<0.01; interaction p=0.9. (e) 9-week-old transgenic Hdh150 mice and wildtype littermates received metformin containing (5 mg/ml, met) or pure water over a period of 3 weeks. Groups of WT, Hdh150, WT met and Hdh150 met were analyzed in an open-field test and total distance travelled was measured. Mann-Whitney test, p=0.3.
Figure 3—video 1
Example of visual discrimination task performed by a trained mouse, real time.
https://doi.org/10.7554/eLife.38744.019
Figure 4 with 2 supplements
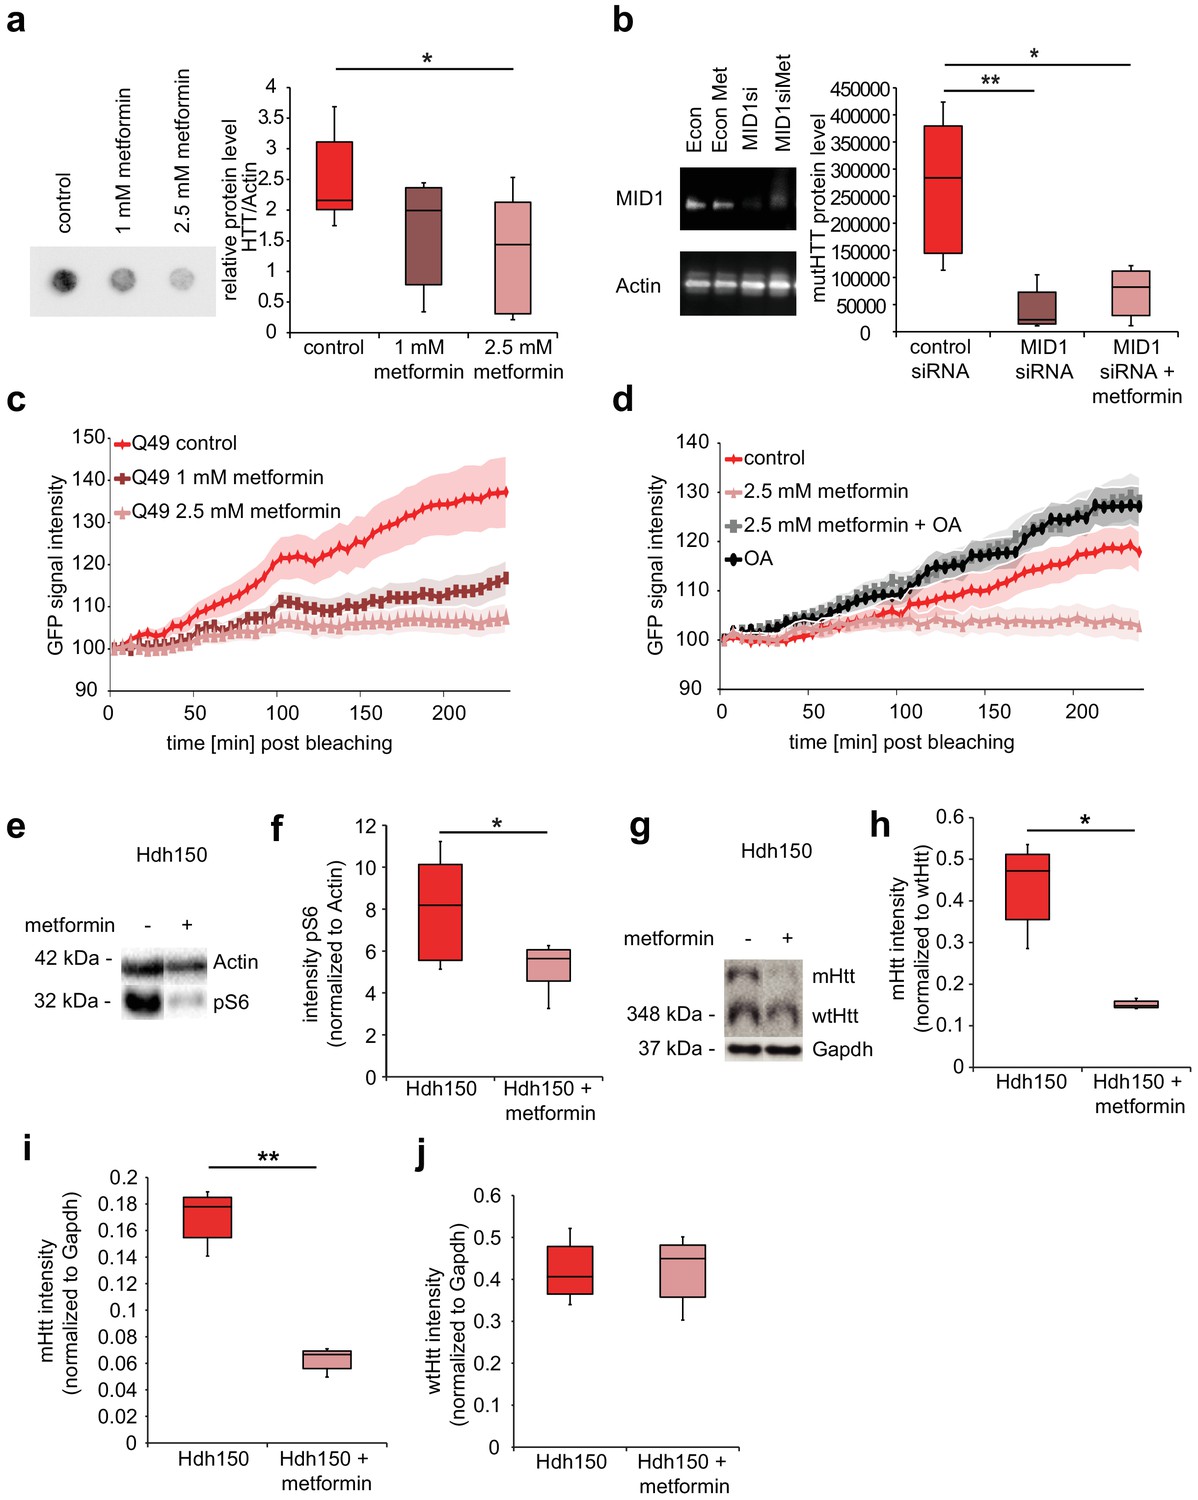
Metformin reduces translation rates of mutant HTT through MID1/PP2A protein complex in vitro and decreases both S6 phosphorylation and mutant Htt protein load in Hdh150 animals.
(a) FLAG-HTT detected on a filter retardation assay after treatment with and without 1 mM and 2.5 mM metformin. Quantification on right panel. Mann-Whitney test, control vs. 1 mM metformin p=0.08; control vs. 2.5 mM metformin, p<0.05. (b) Stable cell line expressing FLAG-HTT exon1 with 83 CAG repeats transfected with MID1-specific siRNAs or control siRNAs in the presence or absence of 2.5 mM metformin. FLAG-HTT detected on a filter retardation assay. Efficiency of the knock-down including Actin as a loading control is shown on a western blot (left panel). Quantification of filter retardation assay on right panel. Mann-Whitney test, control siRNA vs. MID1 siRNA p<0.01; control siRNA vs. MID1 siRNA + metformin p<0.05. (c) Protein translation rate of GFP-tagged mutant Htt exon1 (49 CAG repeats) in primary cortical neurons measured in a FRAP-based assay, over a time frame of 4 hr. Lines show the GFP-signal intensity over time in mock-treated (control) and metformin-treated (1 mM and 2.5 mM) cells. Lines represent means, shadowed areas standard deviations. Repeated measures two-way ANOVA, treatment p<0.01, time p<0.0001; interaction p<0.0001. (d) Protein translation rate measured in a FRAP-based assay (see c). Lines show the GFP-signal intensity over time in mock-treated (control), metformin-treated (2.5 mM), ocadaic acid (OA)-treated and metformin +OA-treated cells. Shadowed areas show SEM. Repeated measures two-way ANOVA, treatment p<0.01, time p<0.0001, interaction p<0.0001. (e) Transgenic Hdh150 mice received metformin-containing water (5 mg/ml, Hdh150 +metformin) or pure water (Hdh150) over a period of 3 weeks. Whole brain lysates were analyzed for the phosphorylation of S6, the expression of total S6, mHtt and wtHtt on western blots. Representative western blots are shown. (f) Quantification of pS6 relative to S6. Unpaired t-test, p<0.05. (g) mHtt and wt Htt proteins of prefrontal cortex lysates analyzed on western blots after 11 weeks of treatment with metformin (5 mg/ml, Hdh150 +metformin) or pure water (Hdh150). Representative western blots are shown. (h) Quantification of mHtt relative to wtHtt. Treatment of 5 mg/ml metformin in the drinking water showed a significant reduction of mHtt protein compared to water control treatment. Unpaired t-test p <<0.05 (i) Quantification of mHtt relative to Gapdh. Unpaired t-test, p<0.01. (j) Quantification of wtHtt relative to Gapdh. Unpaired t-test, p=0.88.
-
Figure 4—source data 1
Numerical values of Figure 4 and associated supplement figures.
- https://doi.org/10.7554/eLife.38744.023
Figure 4—figure supplement 1
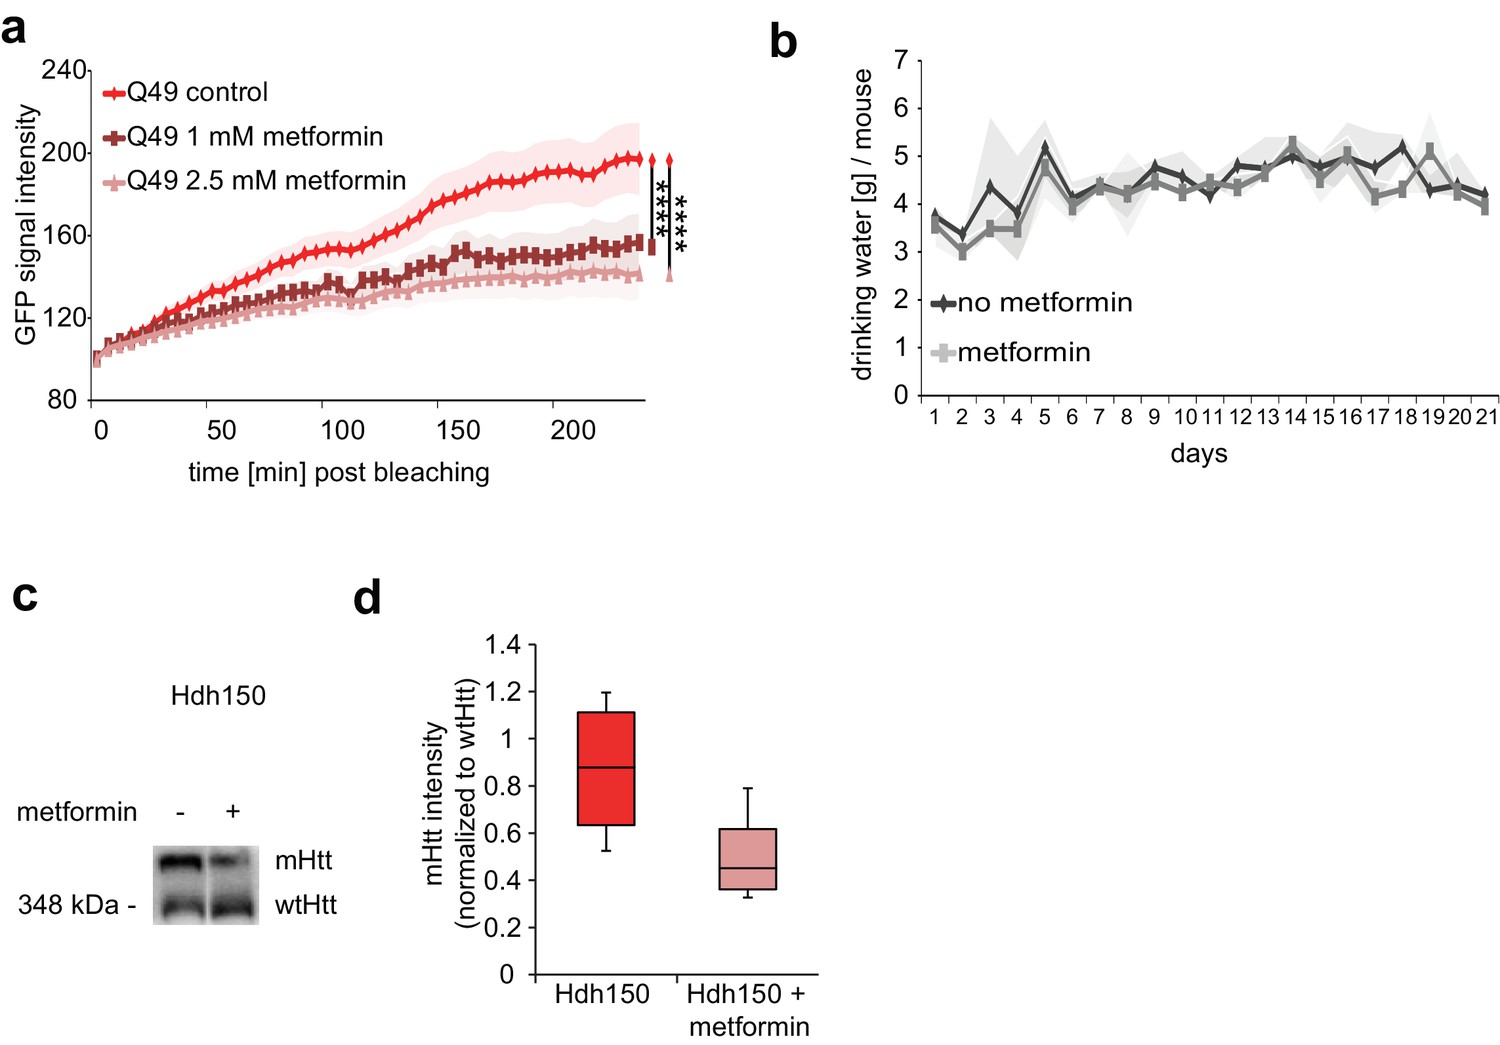
Metformin reduces mutant Htt protein translation and does not change drinking behavior of Hdh150CAG animals.
(a) GFP-tagged mutant (49 CAG repeats- Q49) Htt exon1 was expressed in N2A cells and protein translation rate were measured in a FRAP-based assay, in which the GFP signal of transfected cells is removed by photobleaching and the synthesis rate of freshly translated GFP-tagged protein is measured over a time frame of 4 hr. Lines show the GFP-signal intensity over time in mock-treated (control) and metformin (1 mM and 2.5 mM) treated cells. Shadowed areas show standard deviations. Repeated measures two-way ANOVA, treatment p=0.03; time p<0.0001; interaction p<0.0001. (b) Male, 9-week-old Hdh150CAG animals were fed with 5 mg/ml metformin in the drinking water (metformin) or with pure water (no metformin) and observed over 21 days. The water consumption was monitored every day. Lines represent means, shadowed areas show ±SEM. Repeated measures two-way ANOVA, treatment p=0.3; time p=0.06; interaction p=1. (c) Transgenic Hdh150 mice received metformin-containing water (5 mg/ml, Hdh150 +metformin) or pure water (Hdh150) over a period of 3 weeks. Whole brain lysates were analyzed for the expression of mHtt and wtHtt on western blots. Representative western blots are shown. (d) Quantification of mHtt relative to wtHtt. Unpaired t-test, p=0.18.
Figure 4—figure supplement 2
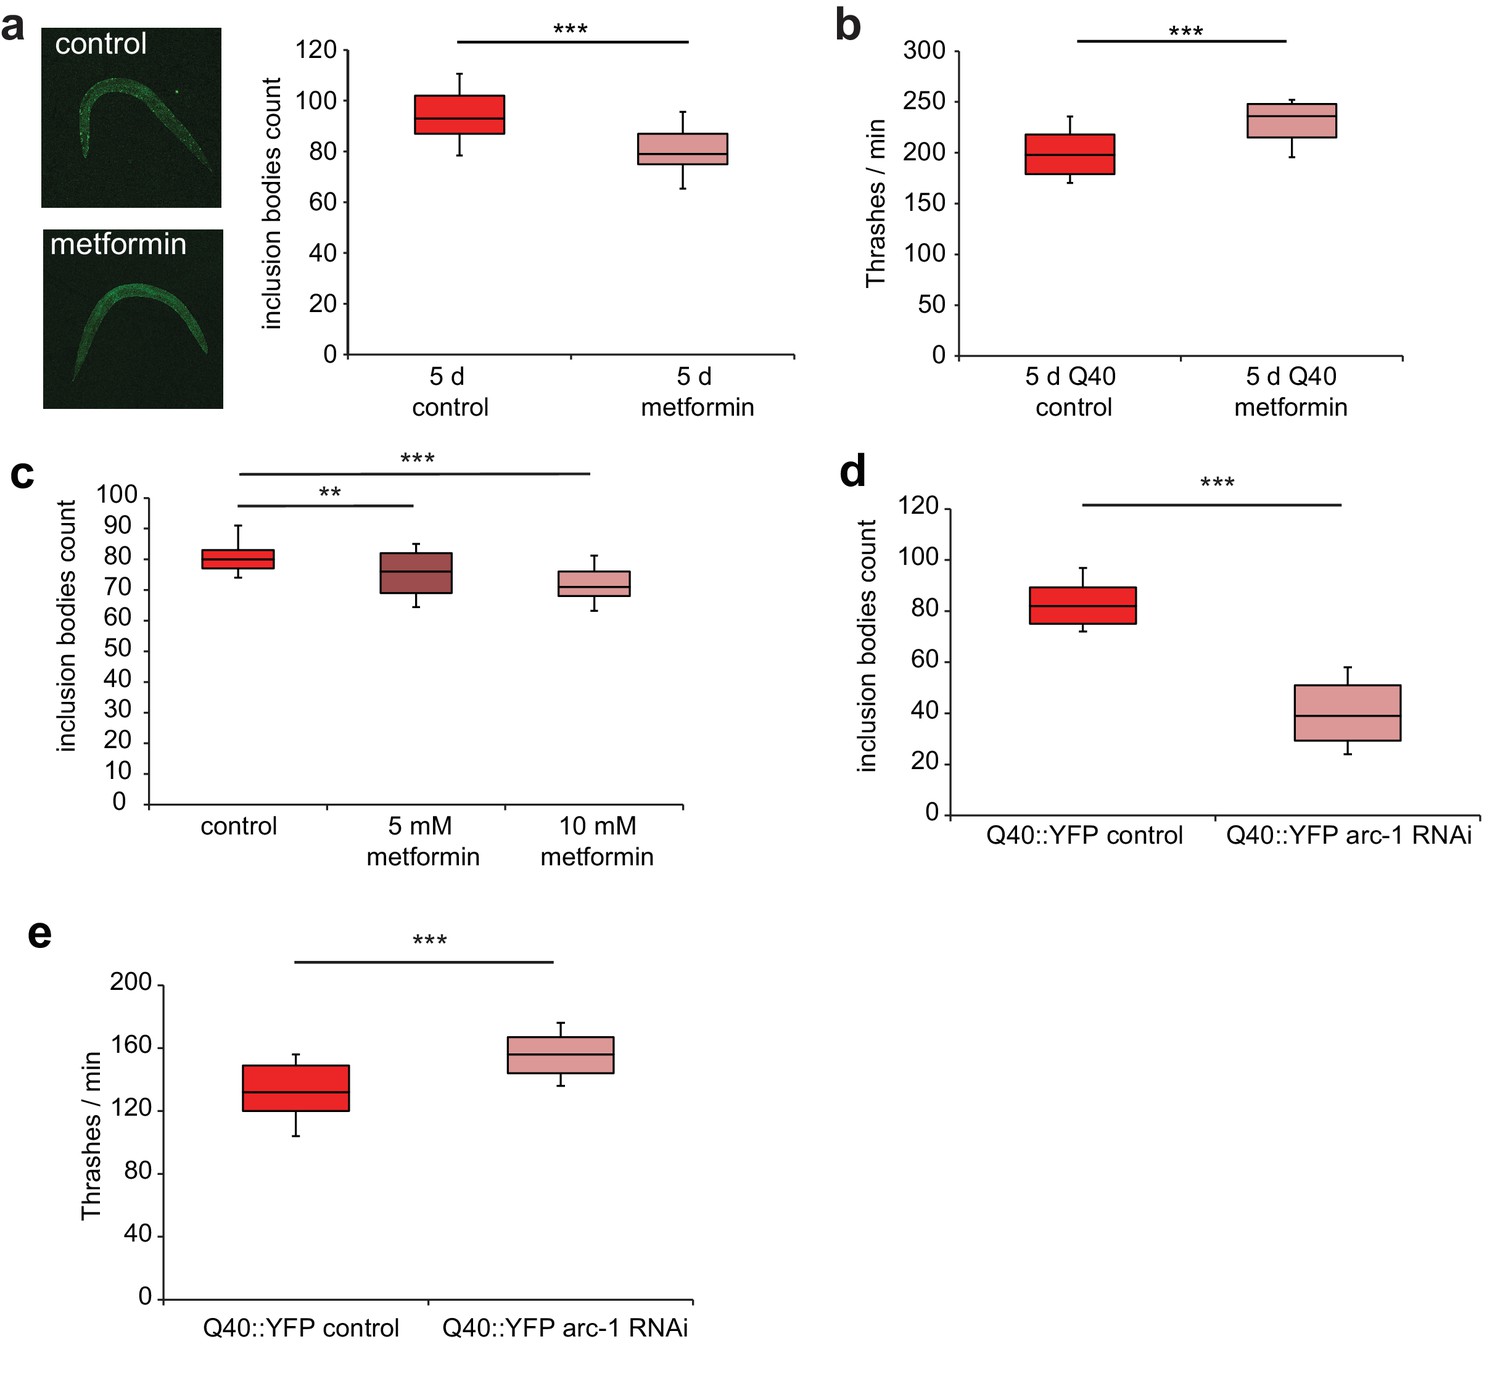
Metformin treatment rescues motility impairment in a C.elegans model.
(a) Q40::YFP nematodes were treated with 500 mM of metformin or pure water (control): Images of nematodes with and without metformin treatment for 5 days (left panel): After 5 days of metformin treatment, the number of aggregates was significantly reduced (right panel): Mann-Whitney test, p<0.0001. (c) Q40::YFP worms were grown on heat-inactivated bacteria on plates pre-treated with either 5 mM or 10 mM of metformin or with pure water (control). After 5 days of metformin treatment, the number of inclusion bodies was analyzed. Mann-Whitney test, control vs 5 mM metformin, p=0.008; control vs 10 mM metformin, p<0.0001. (d,e) RNAi knockdown of the MID1-ortholog arc-1 was performed in Q40::YFP C. elegans. After 5 days, the number of inclusion bodies (d) and liquid thrashing events (e) were analyzed. Mann-Whitney test, p<0.0001.
Figure 5 with 1 supplement

Metformin treatment reverses pathological neuronal network activity and behavioral abnormalities in presymptomatic VFDO Hdh150 mice.
(a) Representative traces of spontaneous Ca2+ transients of 10 neurons recorded in vivo in WT and Hdh150 mice after metformin treatment. Vertical scale bar: 40% dF/F. (b) Relative proportion of spontaneously active neurons in WT (dark grey), Hdh150 (red), WT metformin-treated (light grey) and Hdh150 metformin-treated (light red) mice. Mann-Whitney test, WT vs. Hdh150, p<0.05; Hdh150 vs. Hdh150 met, p<0.05; Hdh150 vs. WT met, p<0.05. (c) Significant reduction in the spontaneous Ca2+ transient frequency to WT levels in Hdh150 mice after metformin treatment (red vs. light red). Mann-Whitney test, WT vs. Hdh150, p<0.01; Hdh150 vs. Hdh150 met, p<0.01; Hdh150 vs. WT met, p<0.01. (d) Cumulative frequency distributions of Ca2+ transients in WT (dark grey), Hdh150 (red), metformin-treated WT (light grey) and metformin-treated Hdh150 (light red) mice. Top, color-coding of active neurons by frequency. Two-way ANOVA test, Group: p<0.0001; Time: p<0.0001; Interaction: p<0.0001. (e) Pie charts showing the relative proportion of low (blue), medium (orange) and hyperactive (red) neurons in layer 2/3 of the visual cortex in WT (top) and Hdh150 (bottom) mice after metformin treatment. Chi-square test, p=0.62, Chi-square = 0.24. (f) Comparison of Pearson’s r between a pair of neurons in WT (dark grey), Hdh150 (red), metformin-treated WT (light grey) and metformin-treated Hdh150 (light red) mice. Mann-Whitney test, WT vs. Hdh150, p<0.05, Hdh150 vs. Hdh150 met, p<0.01, Hdh150 vs. WT met, p<0.01. (g) Relationship between pairwise Pearson’s r and pairwise distance in metformin-treated WT (light grey) and Hdh150 (light red) mice. Two-way ANOVA test, group p<0.0001; Distance p=0.09; Interaction p<0.001. (h) Representative travel pathways of a metformin-treated WT (left) and pre-symptomatic Hdh150 (right) mice analyzed in a 5 min open-field test. (i) Decrease in the explorative behavior of metformin-treated Hdh150 animals. Mann-Whitney test, WT vs. Hdh150, p<0.01; Hdh150 vs. Hdh150 met, p<0.001; Hdh150 vs. WT met, p<0.05; WT vs. Hdh150 met, p=0.8.
-
Figure 5—source data 1
Numerical values of Figure 5 and associated supplement figures.
- https://doi.org/10.7554/eLife.38744.026
Figure 5—figure supplement 1
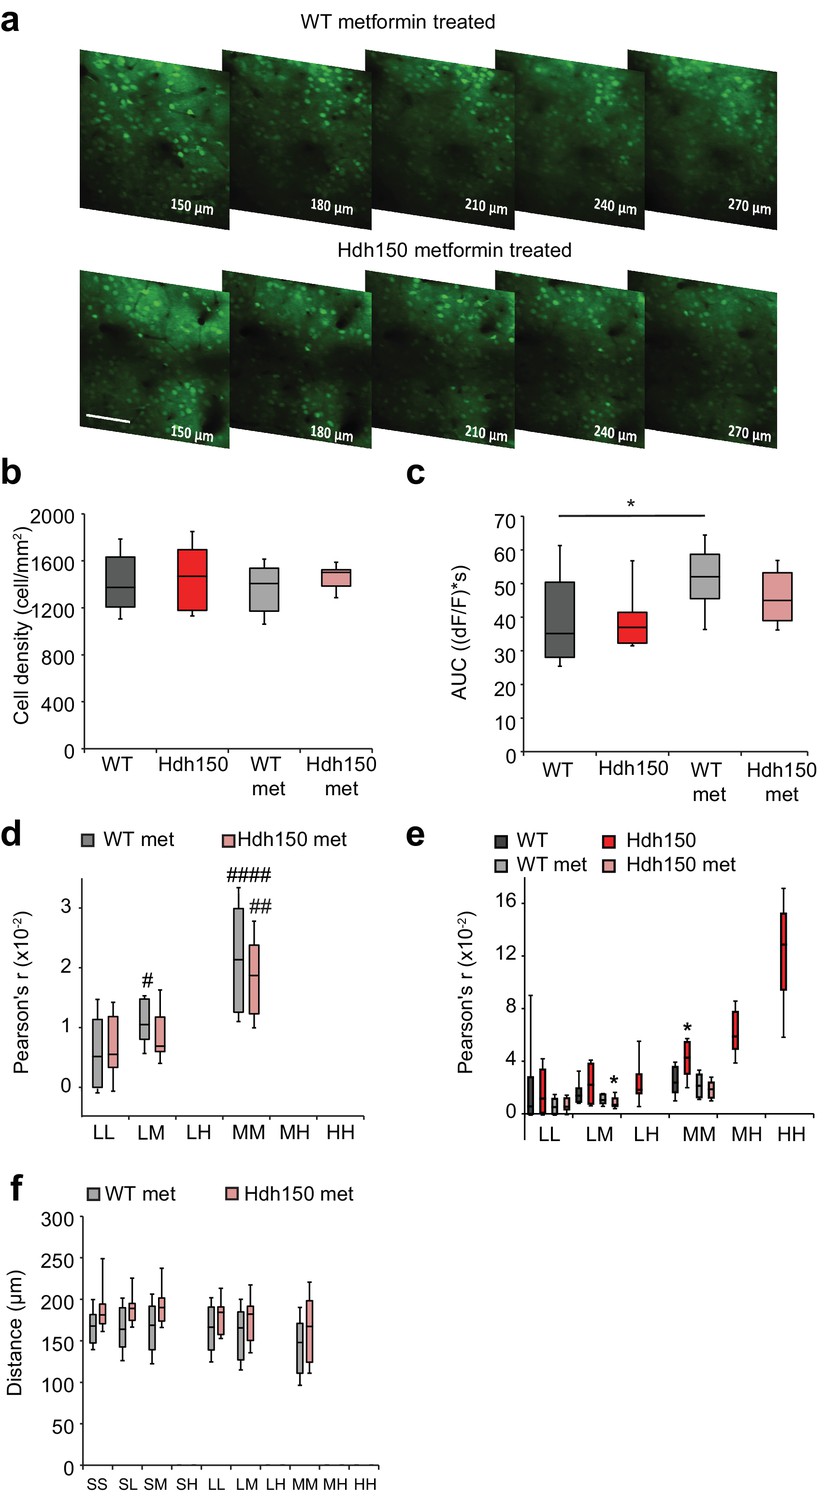
Metformin treatment does not affect cell density or Ca2+ transient dynamics
(a) Two-photon images of OGB-1 AM staining collected in vivo at different depths (from 150 to 270 µm from pial surface) in the visual cortex of WT and Hdh150 mice after metformin treatment. Scale bar: 70 µm. (b) Quantification of the density of stained cells in layer 2/3 of the visual cortex in WT (black), Hdh150 (red, n = 10 animals), metformin-treated WT (light grey) and metformin-treated Hdh150 (light red) mice. No significant difference was found in the cell density across genotypes. Unpaired t-test, p=0.7. (c) Area under the curve (AUC) of Ca2+ transients in WT (black), Hdh150 (red), metformin-treated WT (light grey) and metformin-treated Hdh150 (light red) mice. Unpaired t-test, WT vs. WT met, p<0.05. (d) Box-and-whisker plot showing Pearson’s r between different combinations of neuron pairs (LL: low-low, LM: low-medium, LH: low-hyper, MM: medium-medium, MH: medium-hyper, HH: hyper-hyper) in metformin-treated WT (light grey) and metformin-treated Hdh150 (light red) mice. There was no statistical difference between WT and Hdh150 mice after metformin treatment. # a statistical difference between a pair vs. LL within the same genotype. Unpaired t-test, WT met: LL vs. LM, p<0.05; LL vs. MM, p<0.0001; Hdh150 met: LL vs. MM, p<0.01. (e) Comparison of Pearson’s r between different combinations of neuron pairs in WT (dark grey), Hdh150 (red), metformin-treated WT (light grey) and metformin-treated Hdh150 (light red) mice. * a statistical difference between WT within the same functional subgroup. LM WT vs LM Hdh150 and MM WT vs MM Hdh150 p<0.05. (f) Pairwise distance for the different neuronal pairs (SS: silent-silent, SL: silent-low, SM: silent-medium, SH: silent-hyper, LL: low-low, LM: low-medium, LH: low-hyper, MM: medium-medium, MH: medium-hyper, HH: hyper-hyper) in metformin-treated WT (light grey) and metformin-treated Hdh150 (light red) mice. No significant difference between metformin-treated WT and metformin-treated Hdh150 mice could be found. Mann-Whitney test, not significant, see Table 1 for p-values.
Tables
Table 1
Statistics
https://doi.org/10.7554/eLife.38744.011| Figure | Test | Values | N |
|---|---|---|---|
| Figure 1e | Unpaired t test, two-tailed | NS, p=0.71 | WT n = 11 mice; Hdh150 n = 10 mice |
| Figure 1f | Unpaired t test, two-tailed | p=0.023 | WT n = 1204 cells in eight mice; Hdh150 n = 933 cells in six mice |
| Figure 1h | Mann-Whitney test | p=0.006 | WT n = 765 cells in eight mice; Hdh150 n = 695 cells in six mice |
| Figure 1i | Unpaired t test, two-tailed | NS, p=0.98 | WT n = 765 cells in eight mice; Hdh150 n = 695 cells in six mice |
| Figure 1j | Two-way ANOVA test | Group: p<0.0001, Df = 1, F = 85.96, time: p<0.0001, Df = 16, F = 147, Interaction: p<0.0001, F = 4.9, Df = 16 | WT n = 765 cells in eight mice; Hdh150 n = 695 cells in six mice |
| Figure 1l | Chi-square test | p=0.002, df = 1, Chi-square = 9.127 | WT n = 765 cells in eight mice; Hdh150 n = 695 cells in six mice |
| Figure 2b | Mann-Whitney test | WT vs Hdh150 p=0.03; WT vs WT rand p<0.0001; Hdh150 vs Hdh150 rand p<0.0001 | WT n = 26126 Pearson's r in eight mice; Hdh150 n = 58050 Pearson's r in six mice |
| Figure 2c | Mann-Whitney test | WT vs Hdh150 mice: MM p=0.041 in Hdh150 mice; compared to LL: MM p=0.0496, MH p=0.005, HH p=0.009 | WT n = 26126 Pearson's r in eight mice; Hdh150 n = 58050 Pearson's r in six mice |
| Figure 2d | Two-way ANOVA test | Group: p<0.0001, Df = 1, F = 58.20 Distance: p=0.97, Df = 15, F = 0.44 Interaction: p=0.33, df = 15, F = 1.13 | WT n = 26126 distances in eight mice; Hdh150 n = 58050 distances in six mice |
| Figure 2e | Two-way ANOVA test | p=0.35, Df = 1, F = 0.86 | WT rand n = 26126 distances in eight mice; Hdh150 rand n = 58050 distances in six mice |
| Figure 3b | Mann-Whitney test | p=0.031119 | WT n = 10 mice; Hdh150 n = 13 mice |
| Figure 4a | Mann-Whitney test | control vs 1 mM metformin p=0.084521, control vs 2.5 mM metformin p=0.023231 | Control n = 10, 1 mM metformin n = 11, 2.5 mM metformin n = 10. |
| Figure 4b | Mann-Whitney test | control siRNA vs MID1 siRNA p=0.008, control siRNA vs MID1 siRNA + metformin p=0.015 | Control siRNA n = 6, MID1 siRNAn = 6, MID1 siRNA + metformin n=6. |
| Figure 4c | RM two-way ANOVA | Treatment: p=0.0082, Df = 2, F = 5 Time: p<0.0001, Df = 47, F = 27.5 Interaction: p<0.0001, Df = 94, F = 5.9 | ncontrol = 47, nmetformin 1mM = 44, nmetformin 2.5mM = 35 |
| Figure 4d | RM two-way ANOVA | Treatment: p=0.0021, Df = 3, F = 5.1 Time: p<0.0001, Df = 47, F = 64.1 Interaction: p<0.0001, Df = 141, F = 6.1 p<0.0001 | ncontrol = 46, nmetformin = 49, nmetformin+OA = 51, nOA = 43 |
| Figure 4f | Unpaired t-test | p=0.0473 | Hdh150 n = 6; Hdh150 metformin n = 6 |
| Figure 4h | Unpaired t-test | p=0.0467 | Hdh150 n = 3; Hdh150 metformin n = 3 |
| Figure 4i | Unpaired t-test | p=0.0062 | Hdh150 n = 3; Hdh150 metformin n = 3 |
| Figure 4j | Unpaired t-test | p=0.8766 | Hdh150 n = 3; Hdh150 metformin n = 3 |
| Figure 5b | Mann-Whitney test | WT vs Hdh150 p=0.023, Hdh150 vs Hdh150 met p=0.03, Hdh150 vs WT met p=0.012 | WT n = 1204 cells in eight mice; Hdh150 n = 933 cells in six mice; WT met n = 1915 cells in nine mice; Hdh150 met n = 1585 cells in six mice |
| Figure 5c | Mann-Whitney test | WT vs Hdh150 p=0.006; Hdh150 vs Hdh150 met p=0.007; Hdh150 vs WT met p=0.008 | WT n = 765 cells in eight mice; Hdh150 n = 695 cells in six mice; WT met n = 1199 in nine mice; Hdh150 met n = 1014 cells in six mice |
| Figure 5d | Two-way ANOVA test | Group: p<0.0001, Df = 3, F = 61.80 Time: p<0.0001, Df = 16, F = 345.9 Interaction: p<0.0001, Df = 48, F = 3.64 | WT n = 765 cells eight mice; Hdh150 n = 695 cells six mice; WT met n = 1199 cells nine mice; Hdh150 met n = 1012 cells six mice |
| Figure 5e | Chi-square test | p=0.62, df = 1; Chi-square = 0.24 | WT n = 765 cells eight mice; Hdh150 n = 695 cells six mice; WT met n = 1199 cells nine mice; Hdh150 met n = 1012 cells six mice |
| Figure 5f | Mann-Whitney test | WT vs Hdh150 p=0.03; Hdh150 vs Hdh150 met p=0.002; Hdh150 vs WT met p=0.003 | WT n = 765 cells eight mice; Hdh150 n = 695 cells six mice; WT met n = 1199 cells nine mice; Hdh150 met n = 1012 cells six mice |
| Figure 5g | Two-way ANOVA test | Group: p<0.0001, Df = 3, F = 85.96 Distance: p=0.99, Df = 45, F = 0.58 Interaction: p=0.0007, Df = 15, F = 2.63 | WT n = 765 cells eight mice; Hdh150 n = 695 cells six mice; WT met n = 1199 cells nine mice; Hdh150 met n = 1012 cells six mice |
| Figure 5i | Mann-Whitney test | WT vs Hdh150 p=0.002, Hdh150 vs Hdh150 Met p=0.002, Hdh150 vs. WT met p=0.02, WT vs Hdh150 Met p=0.82 | WT n = 10; Hdh150 n = 13; WT met n = 6; Hdh150 met n = 8 mice |
| Figures supplements | Test | values | n |
| Figure 1—figure supplement 1e | Mann-Whitney test | p=0.002 | n = 6 neurons, n = 6 astrocytes |
| Figure 1—figure supplement 1f | Mann-Whitney test | p=0.002 | n = 6 neurons, n = 6 astrocytes |
| Figure 1—figure supplement 3d | Mann-Whitney test | In WT mice: SS vs SL p=0.5, SS vs SM p=0.9, SS vs LL p=0.1, SS vs LM p=0.2, SS vs MM p=0.1, SL vs SM p=0.4, SM vs LL p=0.1, SM vs MM p=0.1, LL vs MM p=0.9, LM vs MM p=0.4, LM vs SM, p=0.2. In Hdh150 mice: SS vs SL p=0.8, SS vs SM p=0.5, SS vs SH p=0.9, SS vs SH p=0.9, SS vs LL p=0.9, SS vs LM p=0.9, SS vs LH p=1, SS vs MM p=0.1, SS vs MH p=0.1, SS vs HH p=0.4, SL vs SM p=0.8, SL vs SH p=0.9, SL vs LL p=0.9, SL vs LM p=0.9, SL vs LH p=0.8, SL vs MM p=0.5, SL vs MH p=0.6, SL vs HH p=0.7, SN vs SH p=0.6, SM vs LL p=0.7, SM vs LM p=0.6, SN vs LH p=0.4, SM vs MM p=0.3, SN vs MH p=0.4, SN vs HH p 0 0.6, SH vs LL p=0.7, SH vs LM p=1, SH vs LH p=1, SH vs MM p=0.4, SH vs MH p=0.3, SH vs HH p=0.6, LL vs LM p=0.9, LL vs LH p=1, LL vs MM p=0.5, LL vs MH p=0.7, LL vs HH p=0.8, LM vs LH p=0.6, LM vs MM p=0.3, LM vs MH p=0.3, LM vs HH p=0.5, LH vs MM p=0.3, LH vs MH p=0.3, LH vs HH p=0.5, MM vs MH p=0.7, NN vs HH p=0.8, MH vs HH p=0.9 In WT vs WT rand: WT mice: SS p=0.5, SL p=0.7, SM p=0.3, LL p=0.3, LM p=0.8, MM p=0.1. In Hdh150 vs Hdh150 rand: SS p=0.6, SL p=1, SM p=1, SH p=0.6, LL p=0.7, LM p=0.6, LH p=0.2, MM p=0.6, MH p=0.8, HH p=0.7 NS | WT n = 72595 distances eight mice; Hdh150 n = 132009 distances six mice |
| Figure 2—figure supplement 1a | Mann-Whitney test | LL p=0.005; LM p<0.0001; MM p<0.0001 | WT n = 26126 Pearson's r in eight mice |
| Figure 2—figure supplement 1b | Mann-Whitney test | LL p=0.004; LM p=0.0006; LH p=0.041; MM p<0.0001; MH p=0.0002; HH p=0.01. In Hdh150 mice, compared to LL: MM p=0.049; MH p=0.005; HH p=0.009 | Hdh150 n = 58050 Pearson's r in six mice |
| Figure 2—figure supplement 2c | Mann-Whitney test | routine p=0.4, leak p=0.5, CI p=0.6, CI + CII p=0.5, ETS p=0.2 | WT n = 6 mice; Hdh150 n = 6 mice |
| Figure 3—figure supplement 1b | RM two-way ANOVA | Genotype: p=0.6, Df = 1, F = 0.3 Time: p<0.0001, Df = 6, F = 86.1 Interaction: p=0.6, Df = 6, F = 0.7 | WT n = 16 mice; Hdh150 n = 13 mice |
| Figure 3—figure supplement 1c | RM two-way ANOVA | Genotype: p=0.5, Df = 1, F = 0.5 Time: p<0.0001, Df = 9, F = 35.4 Interaction: p=0.03, Df = 9, F = 2.2 | WT n = 16 mice; Hdh150 n = 13 mice |
| Figure 3—figure supplement 1d | RM two-way ANOVA | Genotype: p=0.8, Df = 1, F = 3.4 Time: p<0.01, Df = 6, F = 3.4 Interaction: p=0.97, Df = 6, F = 0.2 | WT n = 16 mice; Hdh150 n = 13 mice |
| Figure 3—figure supplement 1e | Mann-Whitney test | p=0.3 | WT n = 10; Hdh150 n = 13; WT met n = 6; Hdh150 met n = 8 mice |
| Figure 4—figure supplement 1a | RM two-way ANOVA | Treatment p=0.0342, Df = 2, F = 3.5; Time p<0.0001, Df = 47, F = 45.3; Interaction p<0.0001, Df = 94, F = 3.5 | ncontrol = 36, nmetformin 1mM = 42, nmetformin 2.5mM = 44 |
| Figure 4—figure supplement 1b | RM two-way ANOVA | Treatment p=0.2986, Df = 1, F = 1.9; Time p=0.0654, Df = 20, F = 1.8; Interaction p=0.9988, Df = 20, F = 0.3. | control n = 7, metformin n = 8 |
| Figure 4—figure supplement 1dc | Unpaired t-test | p=0,1826 | Hdh150 n = 4; Hdh150 metformin n = 4 |
| Figure 4—figure supplement 2a | Mann-Whitney test | p<0.0001 | control n = 65, metformin n = 65 |
| Figure 4—figure supplement 2b | Mann-Whitney test | Q40 vs. Q40 Met p<0.0001 | Q40n = 43, Q40 Met n = 43 |
| Figure 4—figure supplement 2c | Mann-Whitney test | Ctrl vs. 5 mM p=0.0078, Ctrl vs. 10 mM p<0.0001 | n = 45 |
| Figure 4—figure supplement 2d | Mann-Whitney test | p<0.0001 | Control n = 72, arc-1 RNAi n = 74 |
| Figure 4—figure supplement 2e | Mann-Whitney test | p<0.0001 | Control n = 60, arc-1 RNAi n = 62 |
| Figure 5—figure supplement 1b | Unpaired t test, two-tailed | WT met vs. Hdh150 met p=0.39, WT vs. WT met p=0.7, Hdh150 vs. Hdh150 met p=0.9 | WT n = 11; Hdh150 n = 10; WT met n = 9; Hdh150 met n = 6 mice |
| Figure 5—figure supplement 1c | Unpaired t test, two-tailed | WT vs WT met p=0.024 | WT n = 765 cells eight mice; Hdh150 n = 695 cells six mice; WT met n = 1199 cells nine mice; Hdh150 met n = 1012 cells six mice |
| Figure 5—figure supplement 1d | Unpaired t test, two-tailed | WT met: LL vs LM p=0.04 and LL vs MM p<0.0001; Hdh150 met: LL vs LM p=0.4, LL vs MM p=0.004 | WT met n = 57140 Pearson's r in nine mice; Hdh150 met n = 49535 Pearson's r in six mice |
| Figure 5—figure supplement 1e | Mann-Whitney test | LM WT vs LM Hdh150; MM WT vs MM Hdh150 p=0.04 | WT n = 26126 Pearson's r in eight mice; Hdh150 n = 58050 Pearson's r in six mice; WT met n = 57140 Pearson's r in nine mice; Hdh150 met n = 49535 Pearson's r in six mice |
| Figure 5—figure supplement 1f | Mann-Whitney test | SS p=0.1, SL p=0.1, SM p=0.1, LL p=0.4, LM p=0.3, MM p=0.2 | WT met n = 140467 distances in nine mice; Hdh150 met n = 117485 distances in six mice |
Key resources table
| Reagent type (species) or resource | Designation | Source or reference | Identifiers | Additional information |
|---|---|---|---|---|
| Genetic reagent (C.elegans) | C.elegans strain AM141, genotype rmIs133 | University of Minnesota | AM141 (WormBase ID) RRID:WB-STRAIN:AM141 | |
| Genetic reagent (M. Musculus) | Hdh150 | Jackson Laboratory | #004595 RRID:IMSR_JAX:004595 | Only males were used |
| Cell line (H. sapiens) | HEK 293T/17 | Scherzinger et al. (1997) | CRL-11268 RRID:CVCL_1926 | |
| Cell line (M. Musculus) | Neuro-2A | ATCC | ATCC CCL131 RRID:CVCL_0470 | |
| Cell line (M. Musculus) | primary cortical neurons | isolated from NMRI (Janvier) | ||
| Transfected construct | pEGFP-C1- Httex1 | Krauss et al., 2013 | Self-cloned | |
| Antibody | rabbit anti- activated-caspase-3 | Cell signaling | 9661 RRID:AB_2341188 | 1 to 500 |
| Antibody | mouse anti-NeuN | Millipore | MAB377 RRID:AB_2298772 | 1 to 500 |
| Antibody | rabbit anti-GFAP | Dako | Z0334 RRID:AB_10013382 | 1 to 1500 |
| Antibody | rabbit anti-Htt | Abcam | ab109115 RRID:AB_10863082 | WB: 1:850, IHC: 1:200 |
| Antibody | Alexa 546 goat anti-rabbit | Invitrogen | A11035 RRID:AB_143051 | 1 to 300 |
| Antibody | Alexa 647 goat anti-mouse | Invitrogen | A21235 RRID:AB_141693 | 1 to 300 |
| Antibody | Cy2 donkey anti-rabbit | Jackson Immuno Research | 711-225-152 RRID:AB_2340612 | 1 to 300 |
| Antibody | Alexa 488 goat anti-rabbit | Life technologies | A11008 RRID:AB_143165 | 1 to 200 |
| Antibody | anti-FLAG M2-Peroxidase | Sigma-Aldrich | A8592 RRID:AB_439702 | 1 to 3000 |
| Antibody | rabbit anti-actin | Sigma-Aldrich | A2066 RRID:AB_476693 | 1 to 2000 |
| Antibody | rabbit anti-pS6 | Cell signaling | 2215 RRID:AB_2630325 | 1 to 2000 |
| Antibody | mouse anti-GAPDH | Abcam | ab8245 RRID:AB_2107448 | 1 to 2000 |
| Antibody | HRP-anti-mouse | Dianova | 115-035-072 RRID:AB_2338507 | 1 to 6000 |
| Antibody | HRP-anti-rabbit | Dianova | 305-036-003 RRID:AB_2337936 | 1 to 6000 |
| Antibody | goat anti-rabbit IgG, AlexaFluor 488 conjugate | Life technologies | A11008 RRID:AB_143165 | 1 to 200 |
| Sequence- based reagent | primers 5’-CCC ATT CAT TGC CTT GCT GCT AGG-3’ and 5’-CCT CTG GAC AGG GAA CAG | Sigma-Aldrich | custom | |
| Sequence- based reagent | siRNA AATTGACAGAGGAGTGTGATC | Qiagen | custom | |
| Sequence- based reagent | siRNA CACCGCAUCCUAGUAUCACACTT | Qiagen | custom | |
| Sequence-based reagent | siRNA CAGGAUUACAACUUUUAGGAATT | Qiagen | custom | |
| Sequence-based reagent | siRNA TTGAGTGAG CGCTATGACAAA | Qiagen | custom | |
| Sequence-based reagent | siRNA AAGGTGAT GAGGCTTCGCAAA | Qiagen | custom | |
| Sequence-based reagent | siRNA TAGAACGTGATGAGTCATCAT | Qiagen | custom | |
| Sequence-based reagent | non siRNA AATTCTCCGAACGTGTCACGT | Qiagen | custom | |
| Chemical compound, drug | Hoechst33342 | Sigma-Aldrich | B2261 CHEBI:51232 | 1 to 1000 |
| Chemical compound, drug | Fluoromount | Sigma-Aldrich | F4680 | |
| Chemical compound, drug | Fluoroshield Mounting Medium | Abcam | ab104135 | |
| Chemical compound, drug | PBS tabletts | gibco | 18912–014 | |
| Chemical compound, drug | Triton-X | Roth | 6683.1 CHEBI:9750 | 0.3% |
| Chemical compound, drug | Tween20 | Roth | 9127.1 | 0.1% |
| Chemical compound, drug | Triton X-100 | Sigma-Aldrich | T8787 CHEBI:9750 | 1 – 0.1% |
| Chemical compound, drug | natural donkey serum | Abcam | ab7475 RRID: AB_2337258 | 4 – 2% |
| Chemical compound, drug | natural goat serum | Abcam | ab7481 RRID:2532945 | 4 – 2% |
| Chemical compound, drug | natural sheep serum | Abcam | ab7489 RRID: AB_2335034 | 20% |
| Chemical compound, drug | xylocaine | AstraZeneca | PUN080440 | 2% |
| Chemical compound, drug | isoflurane | AbbVie | 8506 CHEBI:6015 | 1–1.55% |
| Chemical compound, drug | PBS | Life technologies | 18912–014 | 1 M |
| Chemical compound, drug | paraformaldehyde | Life technologies | 15710 CHEBI:31962 | diluted to 4% |
| Chemical compound, drug | Oregon-Green BAPTA1 AM | Molecular probes | O6807 | 1 mM |
| Chemical compound, drug | EGTA | Sigma-Aldrich | E4378 CHEBI:30740 | 0.5 mM |
| Chemical compound, drug | MgCl2 | Sigma-Aldrich | M2670 CHEBI:86345 | 3 mM |
| Chemical compound, drug | K-lactobionate | Sigma-Aldrich | L2398 CHEBI:55481 | 60 mM |
| Chemical compound, drug | Taurine | Sigma-Aldrich | T0625 CHEBI:15891 | 20 mM |
| Chemical compound, drug | KH2PO4 | Sigma-Aldrich | P5655 CHEBI:63036 | 10 mM |
| Chemical compound, drug | HEPES | Sigma-Aldrich | H3375 CHEBI:42334 | 20 mM |
| Chemical compound, drug | Sucrose | Sigma-Aldrich | S0389 CHEBI:17992 | 110 mM |
| Chemical compound, drug | BSA | Sigma-Aldrich | A6003 | 1 g/L |
| Chemical compound, drug | Malate | Sigma-Aldrich | M1000 CHEBI:6650 | 2 mM |
| Chemical compound, drug | Pyruvate | Sigma-Aldrich | P2256 CHEBI: 50144 | 10 mM |
| Chemical compound, drug | Glutamate | Sigma-Aldrich | G1626 CHEBI:64243 | 20 mM |
| Chemical compound, drug | ADP | Sigma-Aldrich | A2754 CHEBI:16761 | 5 mM |
| Chemical compound, drug | Succinate | Sigma-Aldrich | S2378 CHEBI:63686 | 10 mM |
| Chemical compound, drug | FCCP | Sigma-Aldrich | C2920 CHEBI:75458 | 0.2 µM |
| Chemical compound, drug | Rotenone | Sigma-Aldrich | R8875 CHEBI:28201 | 0.1 µM |
| Chemical compound, drug | Antimycin A | Sigma-Aldrich | A8674 CHEBI:22584 | 2 µM |
| Chemical compound, drug | MgSO4 | Sigma-Aldrich | 203726 CHEBI:32599 | |
| Chemical compound, drug | NaCl | Sigma-Aldrich | S3014 CHEBI:26710 | |
| Chemical compound, drug | Na2HPO4 | Sigma-Aldrich | S3264 CHEBI:34683 | |
| Chemical compound, drug | oligofectamine | Thermo-Fisher | 12252–011 | 0.2% |
| Chemical compound, drug | metformin | MP Biomedicals | 157805 CHEBI:6802 | 5 mg/ml |
| Chemical compound, drug | urea | Roth | 2317.3 CHEBI:16199 | 48% |
| Chemical compound, drug | Tris | Roth | 4855.2 CHEBI:9754 | 15 mM |
| Chemical compound, drug | Glycerin | Roth | 3783.1 CHEBI:17754 | 8.7% |
| Chemical compound, drug | SDS | Roth | 2326.1 CHEBI:8984 | 1% |
| Chemical compound, drug | mercaptoehanol | Roth | 4227.3 CHEBI:41218 | 1% |
| Chemical compound, drug | protease inhibitors | Roche | 04 693 116 001 | 1 tablet per 50 ml |
| Chemical compound, drug | Phosstop | Roche | 04 906 837 001 | 2 tablets per 10 ml |
| Software, algorithm | GraphPad Prism | GraphPad Prism | RRID:SCR_002798 | http://www.graphpad.com/ |
| Software, algorithm | Igor Pro 6.22 – 6.37 | Wavemetrics | RRID:SCR_000325 | http://www.wave metrics.com/products/igorpro/igorpro.htm |
| Software, algorithm | MATLAB R2011a | Mathworks | RRID:SCR_001622 | https://www.mathworks.com |
| Software, algorithm | Code use for Calcium transient analysis | this paper | the code is enclosed as a source file | |
| Software, algorithm | LaVision BioTec ImSpector microscopy software | LaVision BioTec | RRID:SCR_015249 | https://www.lav isionbiotec.com/ |
| Software, algorithm | Fiji | Fiji | RRID:SCR_002285 | http://fiji.sc |
| Software, algorithm | Image J | Image J - NIH | RRID:SCR_003070 | https://imagej .nih.gov/ij/ |
| Software, algorithm | EthoVision XT 8.5 | Noldus | RRID:SCR_000441 | https://www. noldus.com/EthoVision-XT/New |
| Software, algorithm | Image lab | Biorad | RRID:SCR_014210 | http://www.bio-rad.com/en-us/sku/1709690-image-lab-software |
| Software, algorithm | Oroboros DatLab | Oroboros, Innsbruck, Austria | http://www. oroboros.at/index.php?id =datlab |
Additional files
-
Transparent reporting form
- https://doi.org/10.7554/eLife.38744.027
Download links
A two-part list of links to download the article, or parts of the article, in various formats.
Downloads (link to download the article as PDF)
Open citations (links to open the citations from this article in various online reference manager services)
Cite this article (links to download the citations from this article in formats compatible with various reference manager tools)
Metformin reverses early cortical network dysfunction and behavior changes in Huntington’s disease
eLife 7:e38744.
https://doi.org/10.7554/eLife.38744


