The cargo receptor SURF4 promotes the efficient cellular secretion of PCSK9
- University of Michigan, Michigan
- Lunenfeld-Tanenbaum Research Institute, Sinai Health System, Canada
- University of Toronto, Canada
- Peking University, China
Figures
Figure 1
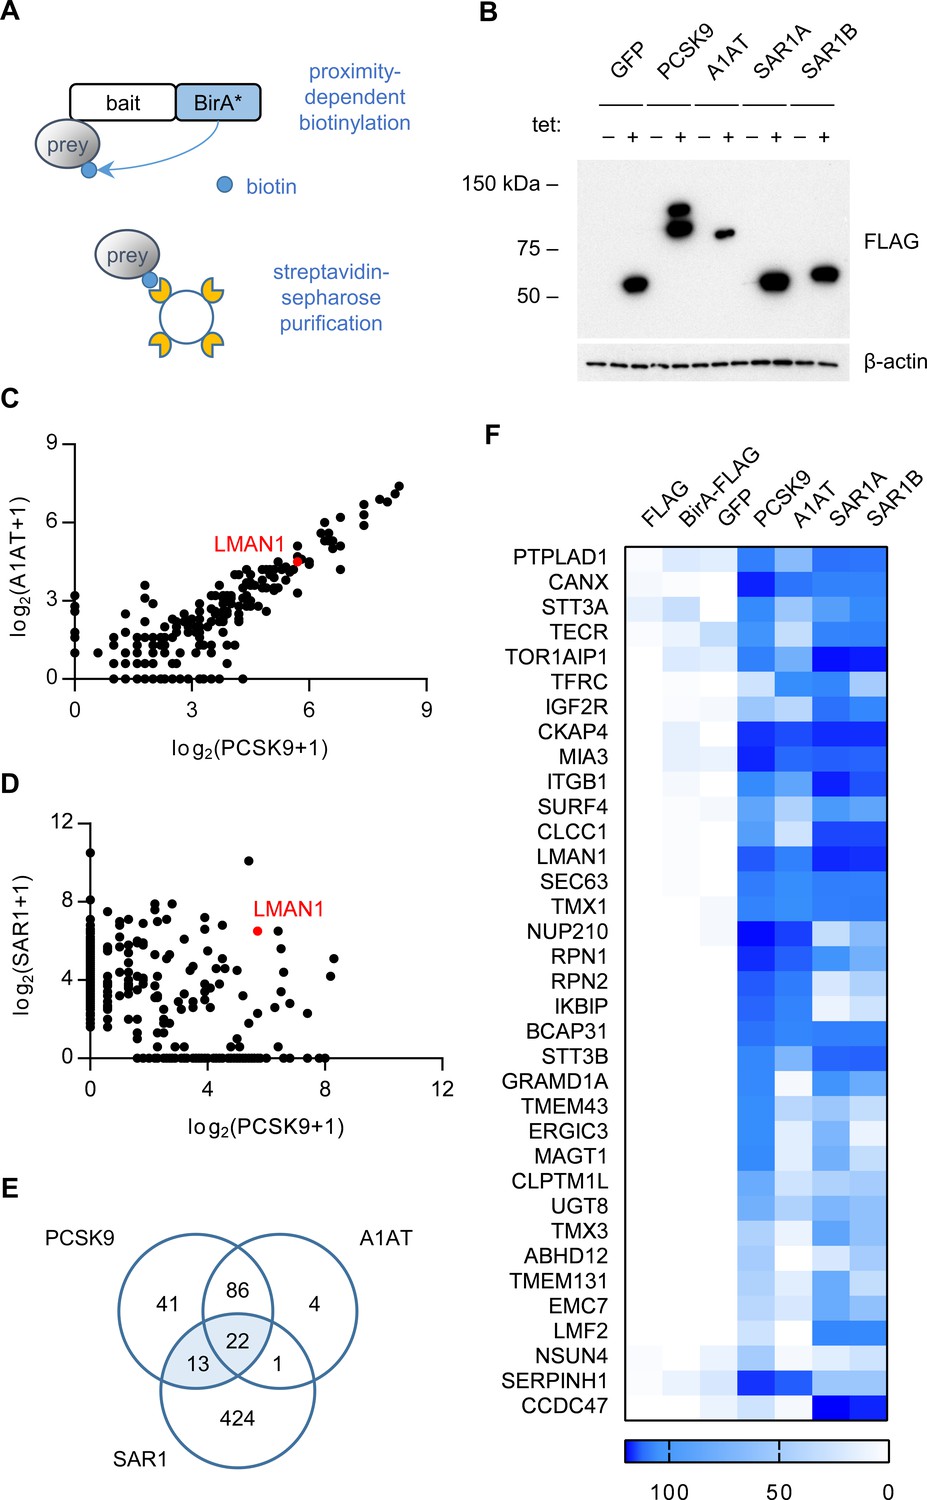
Proximity-dependent biotinylation with a PCSK9-BirA* fusion.
(A) Proximity detection by mass spectrometry of streptavidin-purified prey proteins biotinylated by a fusion of BirA* to a bait protein of interest. (B) Immunoblotting of lysates of cells expressing various BirA*-fusion proteins. (C) Spectral counts of prey proteins identified from lysates of cells expressing PCSK9-BirA* relative to A1AT-BirA*. (D) Spectral counts of prey proteins purified from lysates of cells expressing PCSK9-BirA* relative to the maximum spectral count from lysates of cells expressing either SAR1A-BirA* or SAR1B-BirA*. (E) Venn diagram of identified prey proteins from lysates of cells expressing BirA* fusions with PCSK9, A1AT, or the maximum for either Sar1A or Sar1B. (F) Heat map of spectral counts for candidate proteins demonstrating interaction with both PCSK9-BirA* and either SAR1A-BirA* or SAR1B-BirA*. Spectral count values represent averages of 2 biologic replicates. Only prey proteins that exhibit BFDR ≤0.01 for one or more bait proteins are displayed. Source data is provided in Supplementary file 1.
Figure 2 with 3 supplements
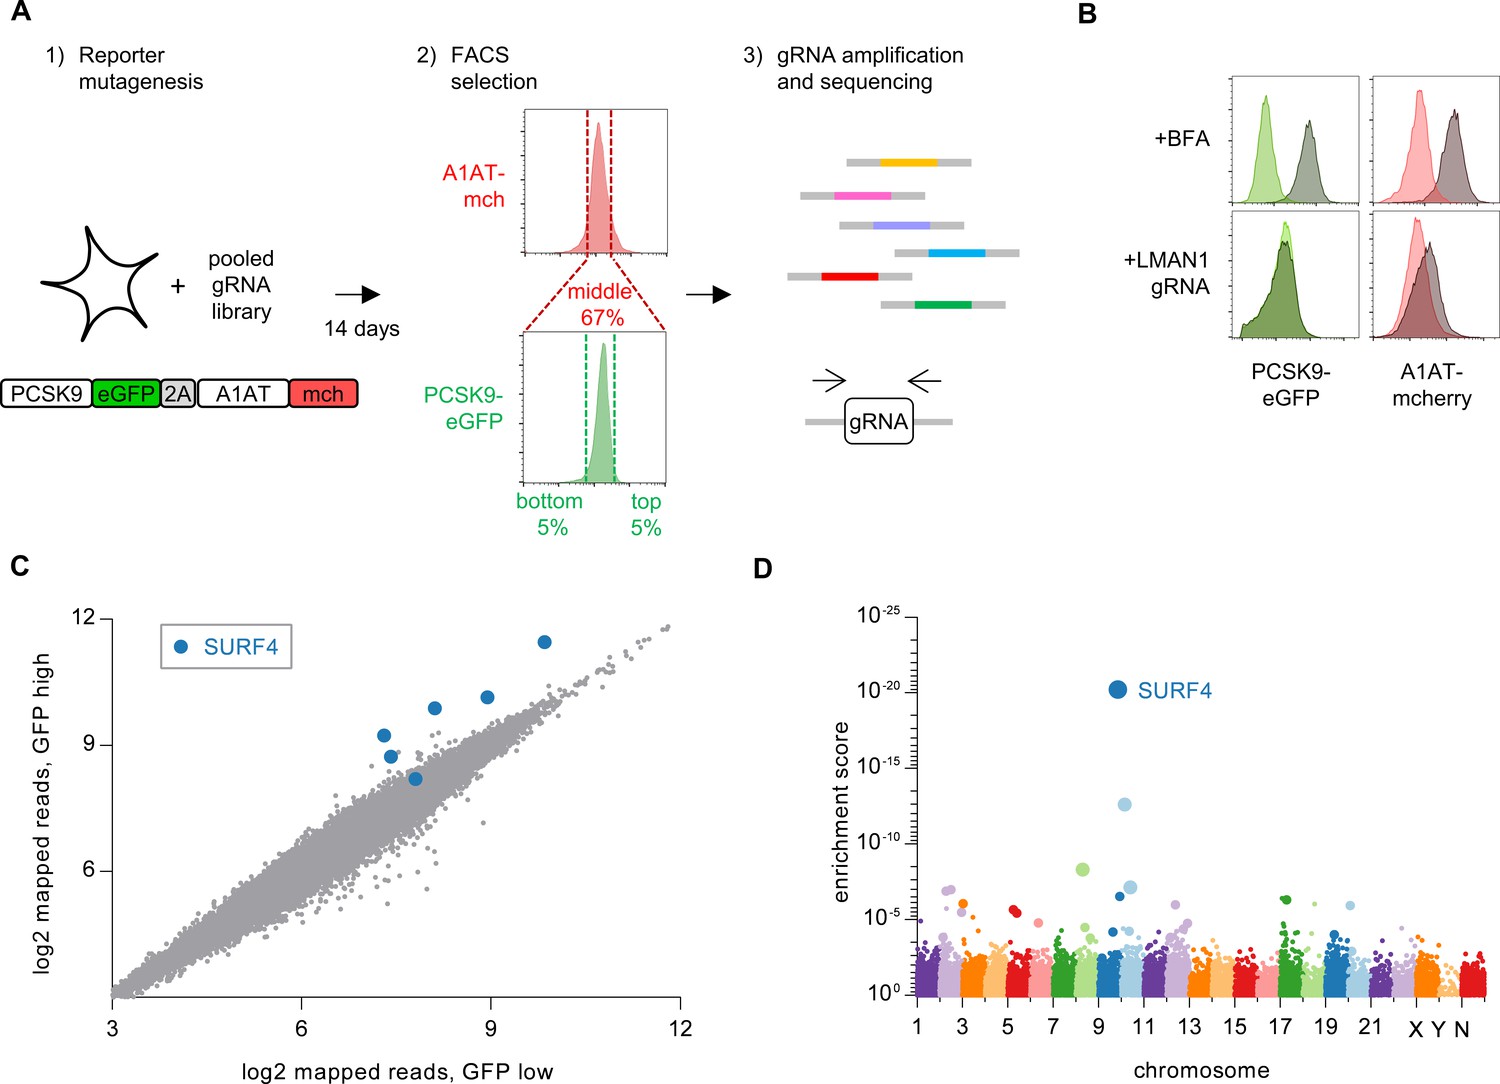
Whole genome CRISPR mutagenesis screen for PCSK9 secretion modifiers.
(A) Strategy for whole genome screen. (B) Flow cytometry of reporter cells stably expressing PCSK9-eGFP-2A-A1AT-mCherry, treated with 1 µg/mL brefeldin A or a sgRNA targeting LMAN1. (C) Normalized abundance of each sgRNA in the library in eGFP high and eGFP low populations. (D) MAGeCK gene-level enrichment scores for each gene targeted by the library arranged by chromosome number and transcription start site. The diameter of the bubble is proportional to the number of unique sgRNAs targeting each gene that demonstrate significant enrichment in GFP high cells. Source data is provided in Supplementary files 2 and 3.
Figure 2—figure supplement 1
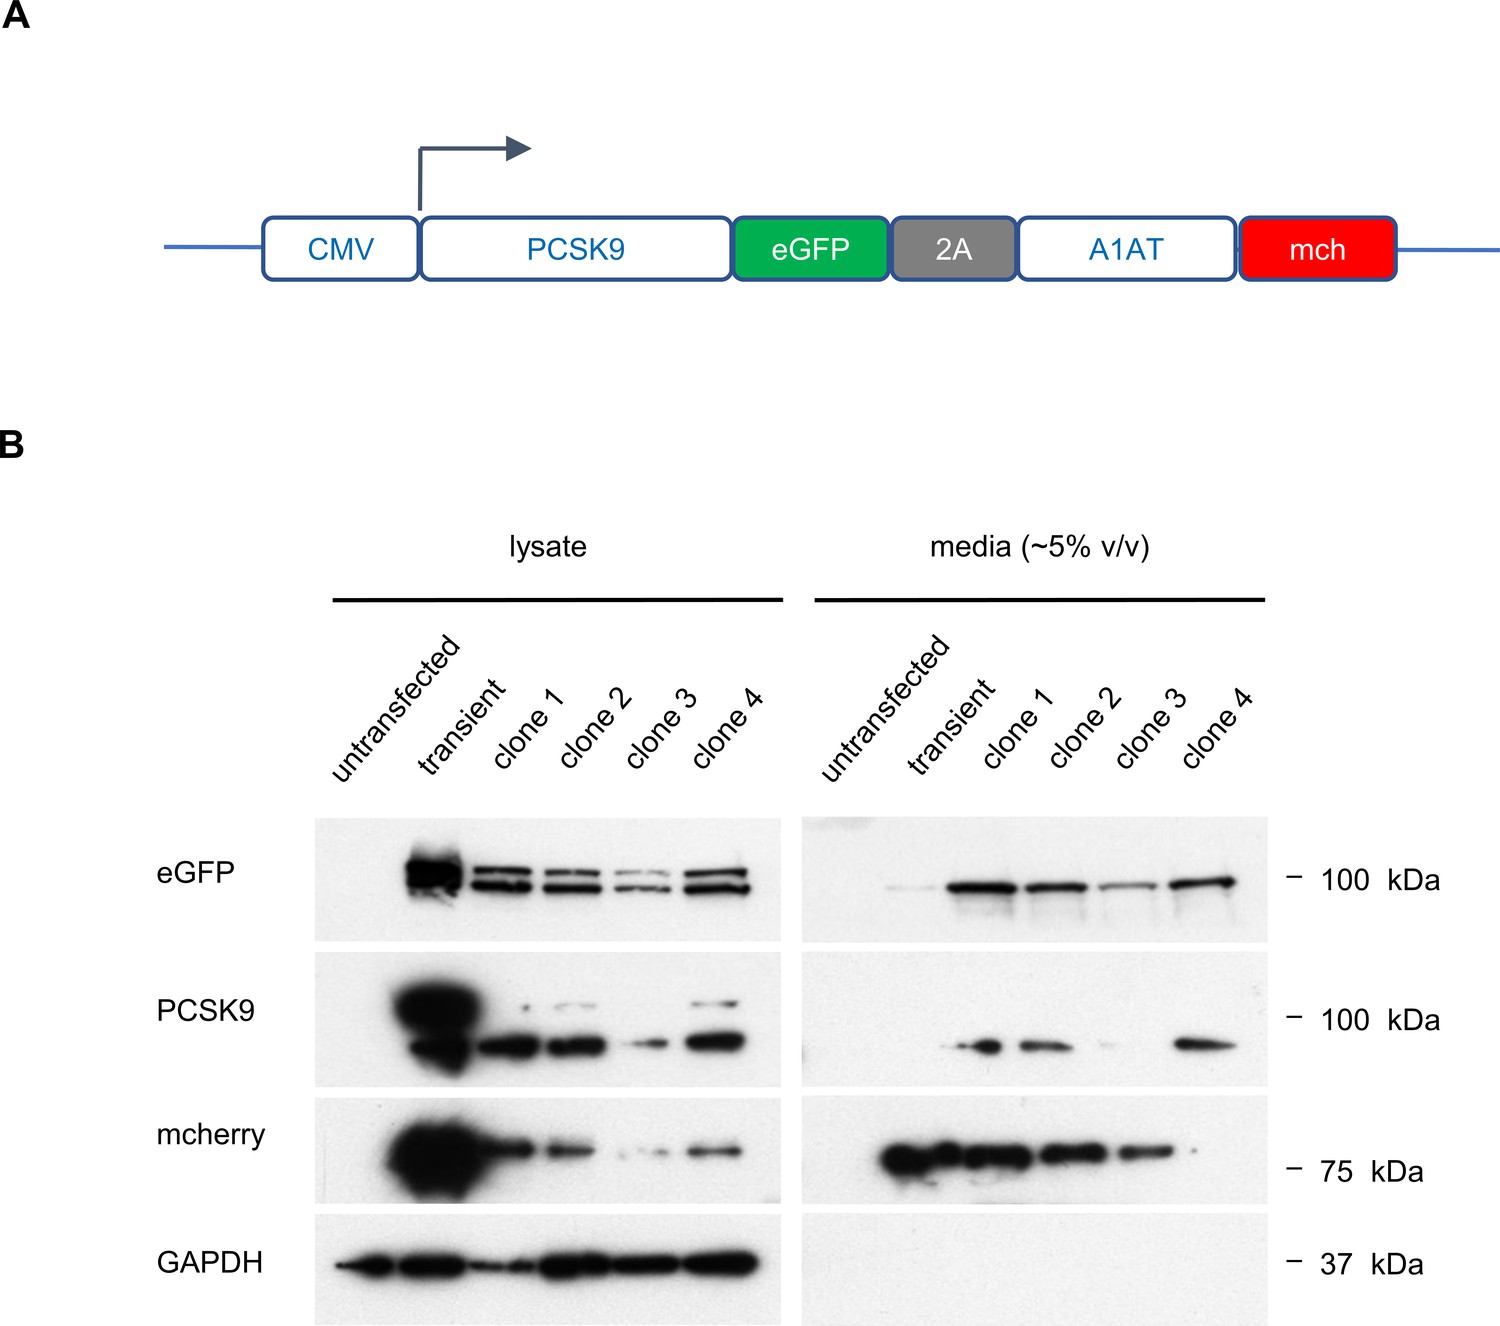
Analysis of PCSK9-eGFP-2A-A1AT-mCherry reporter cell clones.
(A) Construct for CMV-promoter-driven expression of PCSK9-eGFP-2A-A1AT-mCherry expression. (B) Immunoblotting of HEK293T cells transfected with the PCSK9-eGFP-2A-A1AT-mCherry vector, and four individual drug-resistant clonal cell lines, relative to parental untransfected cells.
Figure 2—figure supplement 2
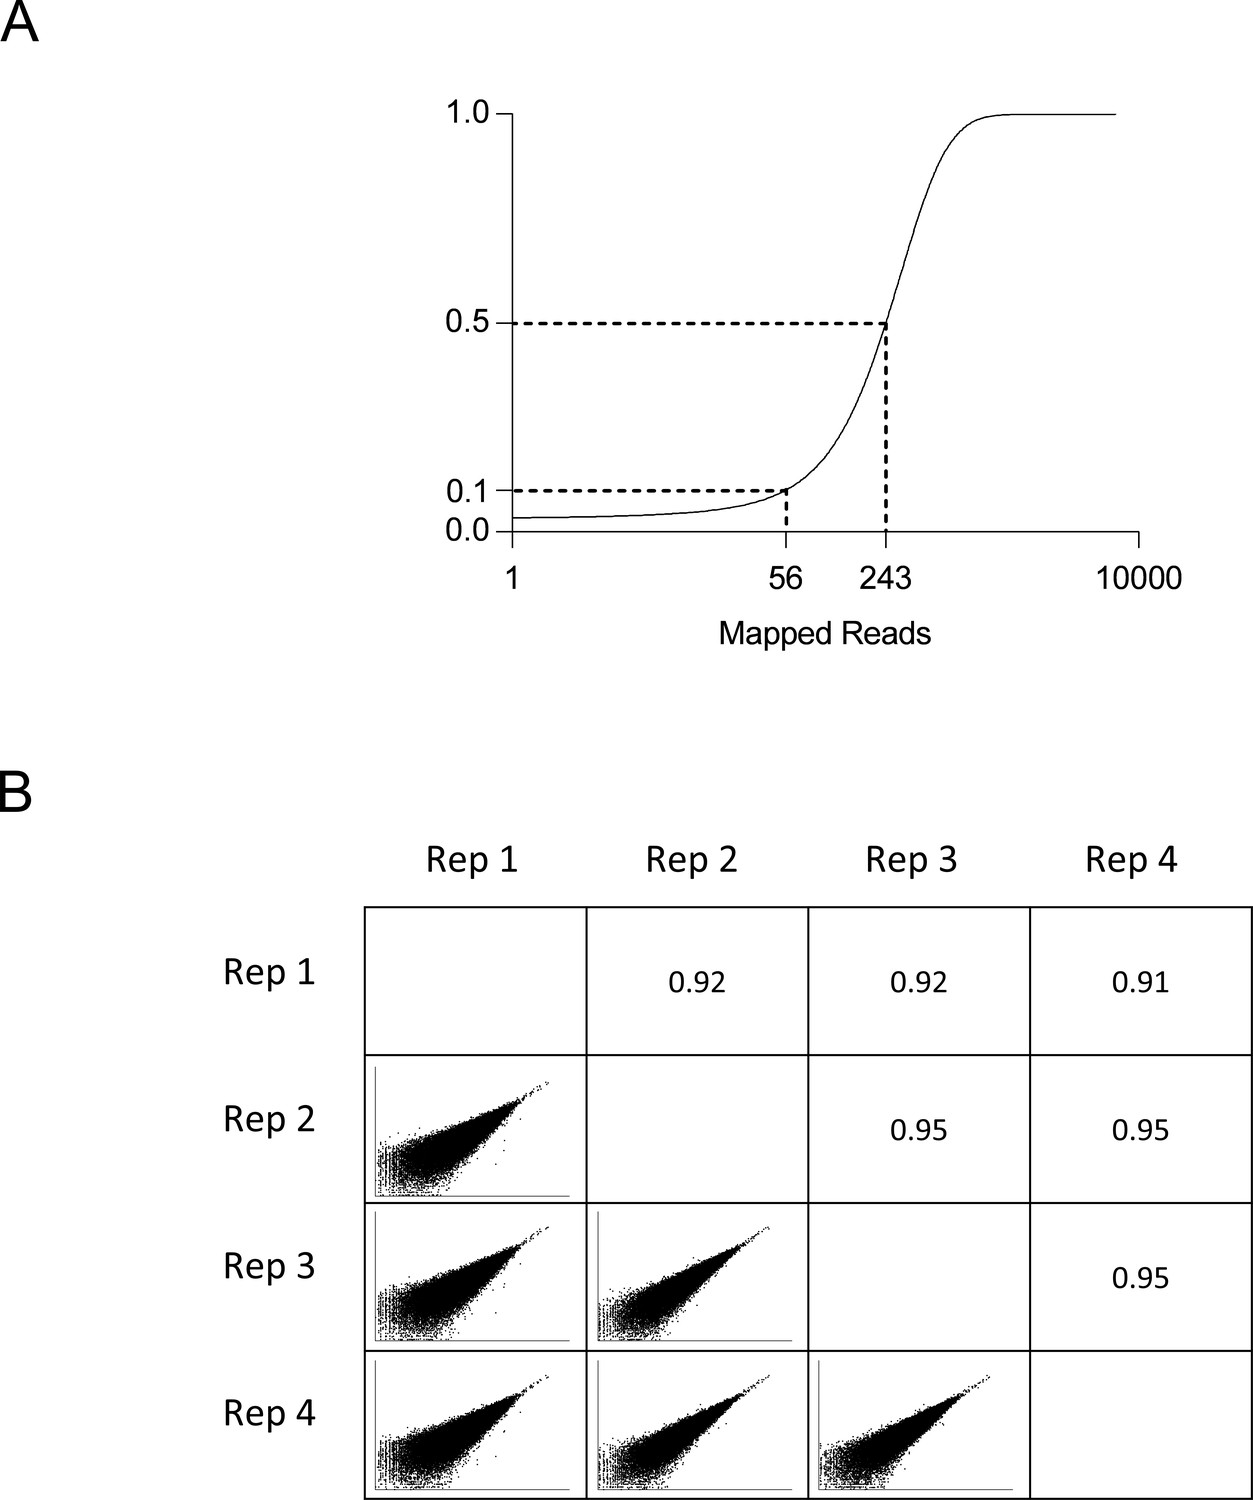
Whole genome screen analysis.
(A) Cumulative distribution function of mapped reads for each sgRNA in the whole genome library. (B) Comparison of read counts for every pairwise combination of 4 biologic replicates with Pearson correlation coefficient.
Figure 2—figure supplement 3
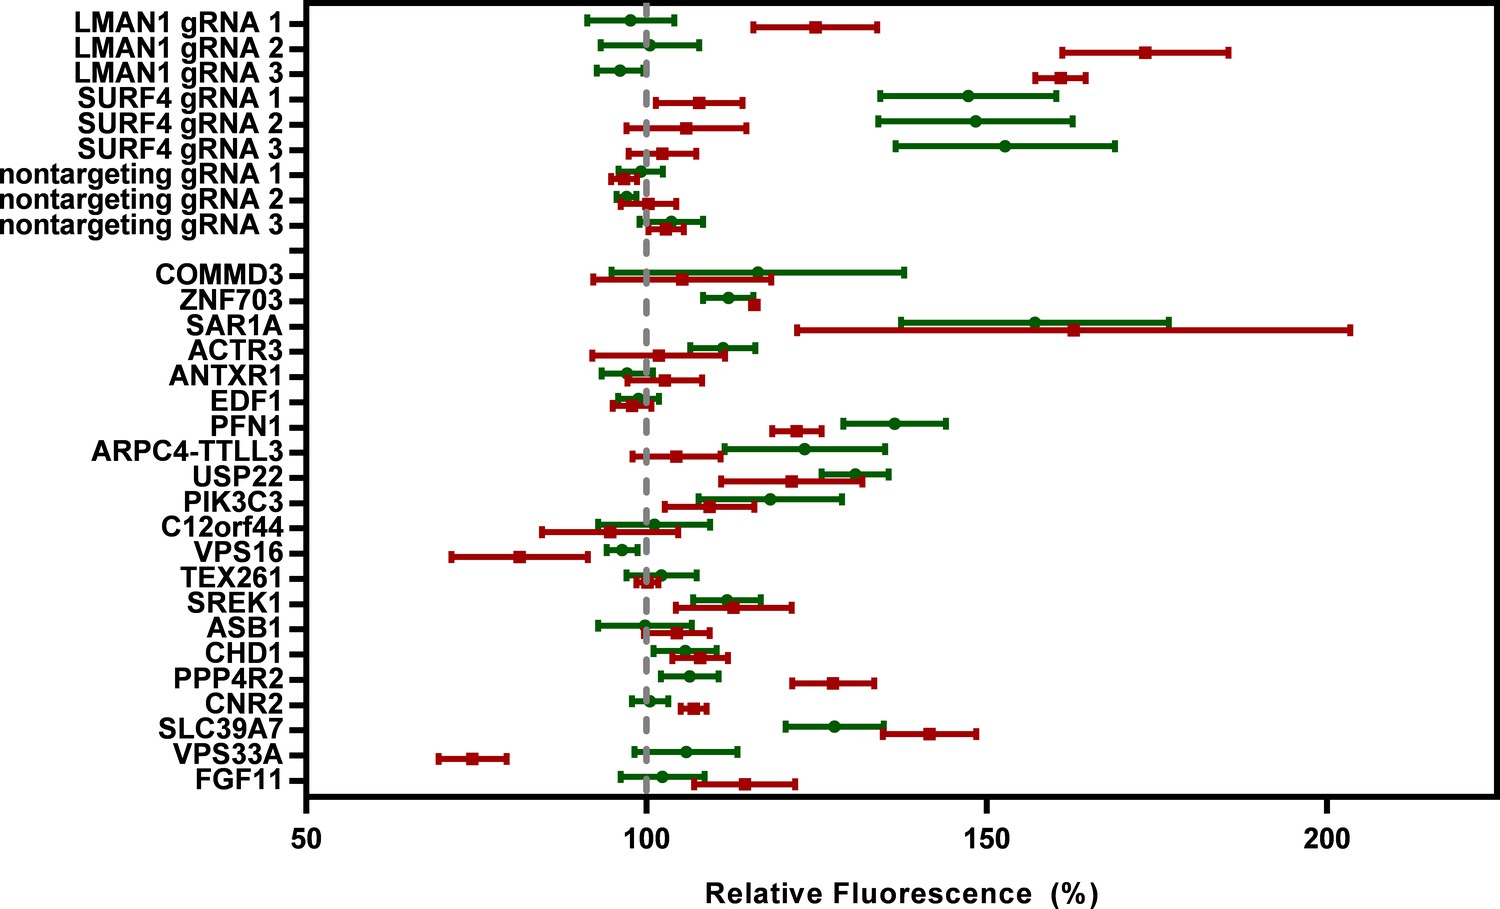
Validation experiments for additional candidate genes.
The top-scoring sgRNA for each of the next 21 most enriched genes after SURF4 was individually cloned into lentiCRISPRv2 and tested in PCSK9-eGFP-2A-A1AT-mCherry reporter cells. Flow cytometry was performed for each of 3 biologic replicates. The mean fluorescent intensity of PCSK9-eGFP and A1AT-mCherry for sgRNA against each candidate gene relative to nontargeting sgRNA controls is shown. Error bars represent standard deviations.
Figure 3 with 2 supplements
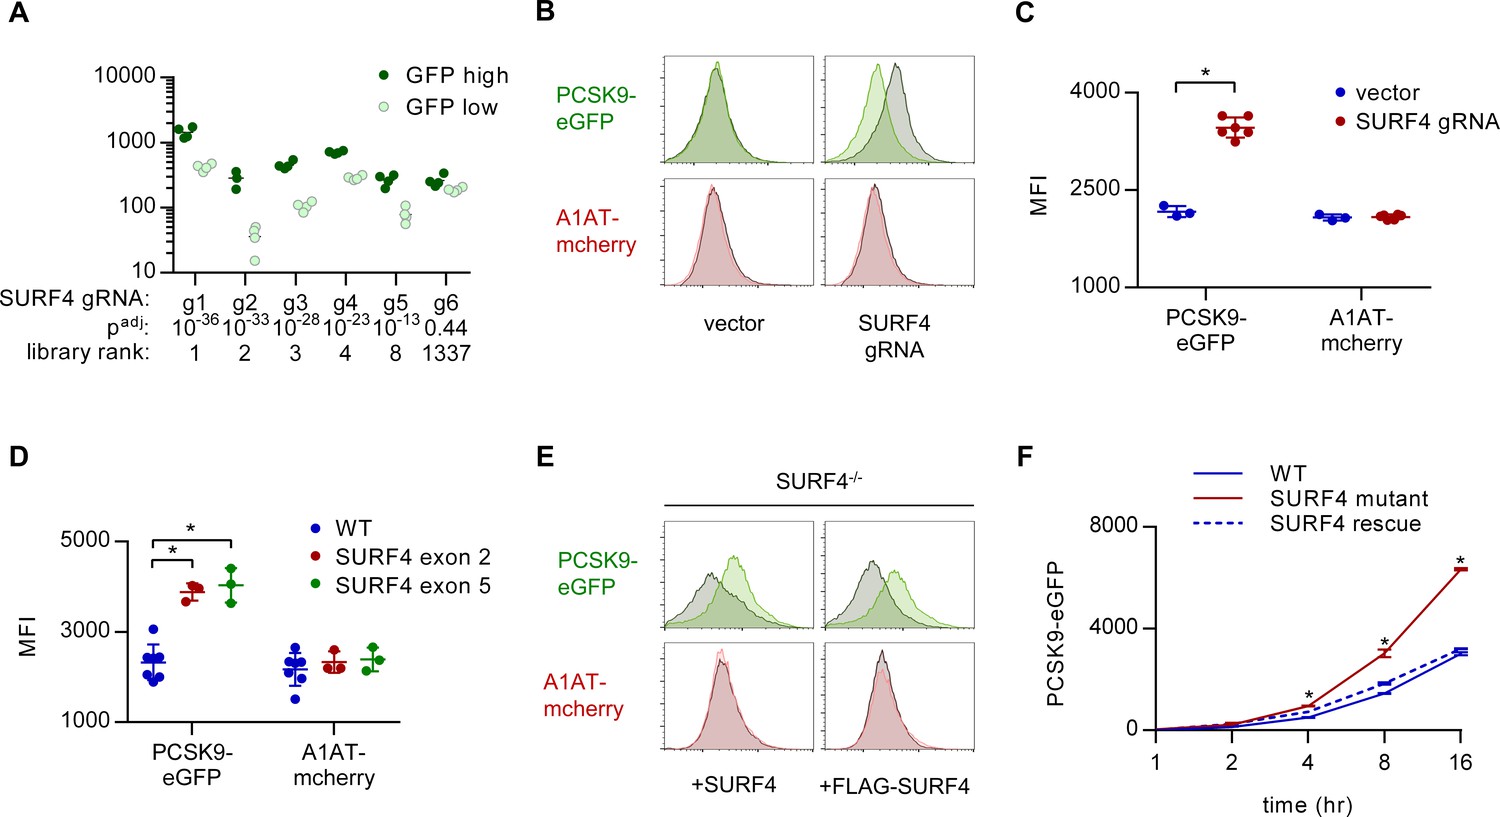
SURF4 mutagenesis causes an accumulation of intracellular PCSK9-eGFP.
(A) Individual sgRNA sequencing counts for SURF4-targeting sgRNA in eGFP high and eGFP low populations for each of 4 biologic replicates. Adjusted p values were calculated using DESeq2. (B) Flow cytometry histograms of PCSK9-eGFP and A1AT-mCherry fluorescence in reporter cells transfected with plasmids delivering Cas9 and SURF4-targeting sgRNA or empty vector. (C) Quantification of intracellular fluorescence for cells treated with empty vector (n = 3) or unique SURF4-targeting sgRNAs (n = 6). (D) Quantification of intracellular fluorescence for clonal cell lines each containing frameshift-causing indels at two different SURF4 target sites (n = 7 wild-type clones, n = 3 clones generated from each SURF4-targeting sgRNA). (E) Flow cytometry histograms for cells expressing PCSK9-eGFP-2A-A1AT-mCherry and deleted for SURF4 with or without stable expression of a wild-type or FLAG-tagged SURF4 cDNA. (F) Time course of intracellular accumulation of tetracycline-inducible PCSK9-eGFP on WT, SURF4-deficient, or SURF4 rescue background (n = 3 biologic replicates for each cell line at each time point). *p<0.05 by Student’s t-test. Error bars represent standard deviations.
Figure 3—figure supplement 1
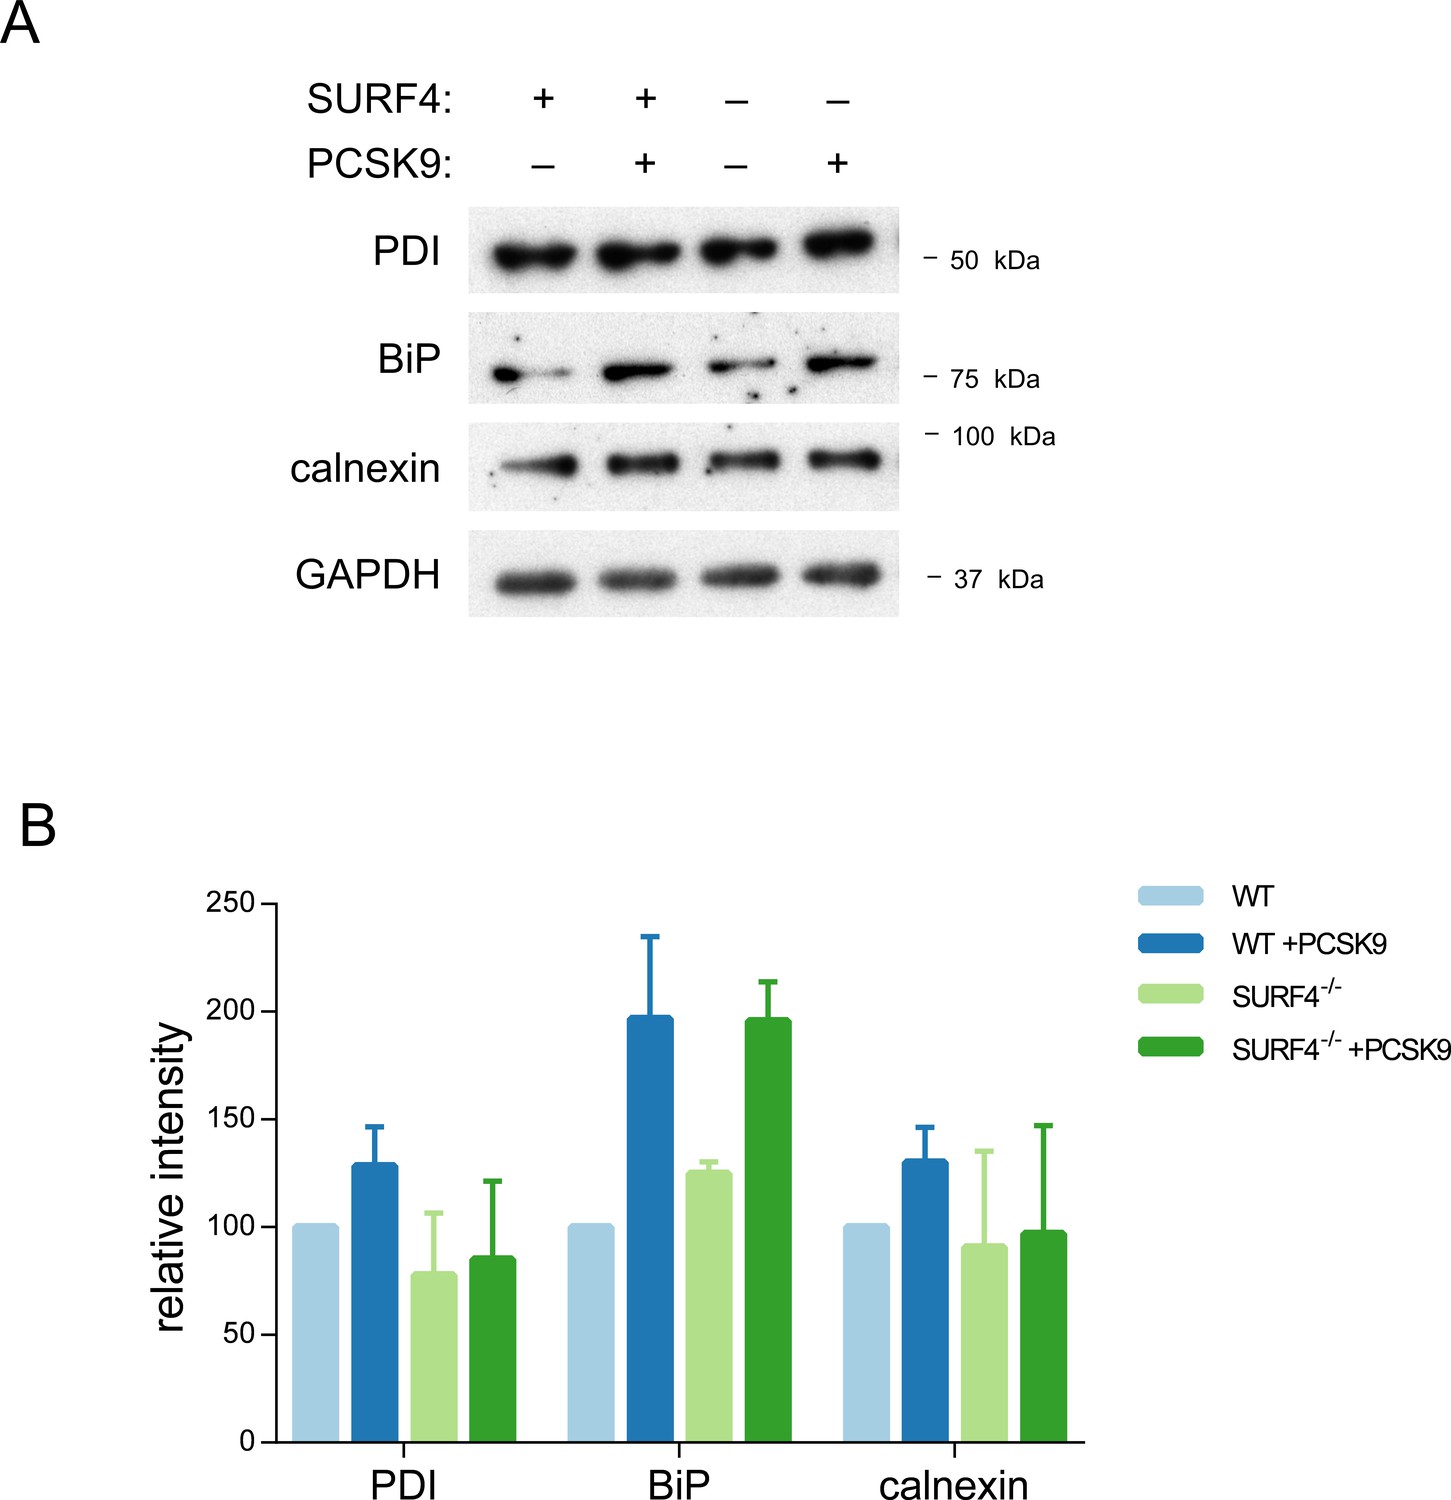
ER stress markers.
Clonal cell lines with a stably integrated tetracycline-inducible PCSK9 cDNA on either WT or SURF4 mutant background were treated with tetracycline or vehicle control and analyzed by immunoblotting for various markers of ER stress (A), quantified by densitometry (B). Error bars represent standard deviations.
Figure 3—figure supplement 2
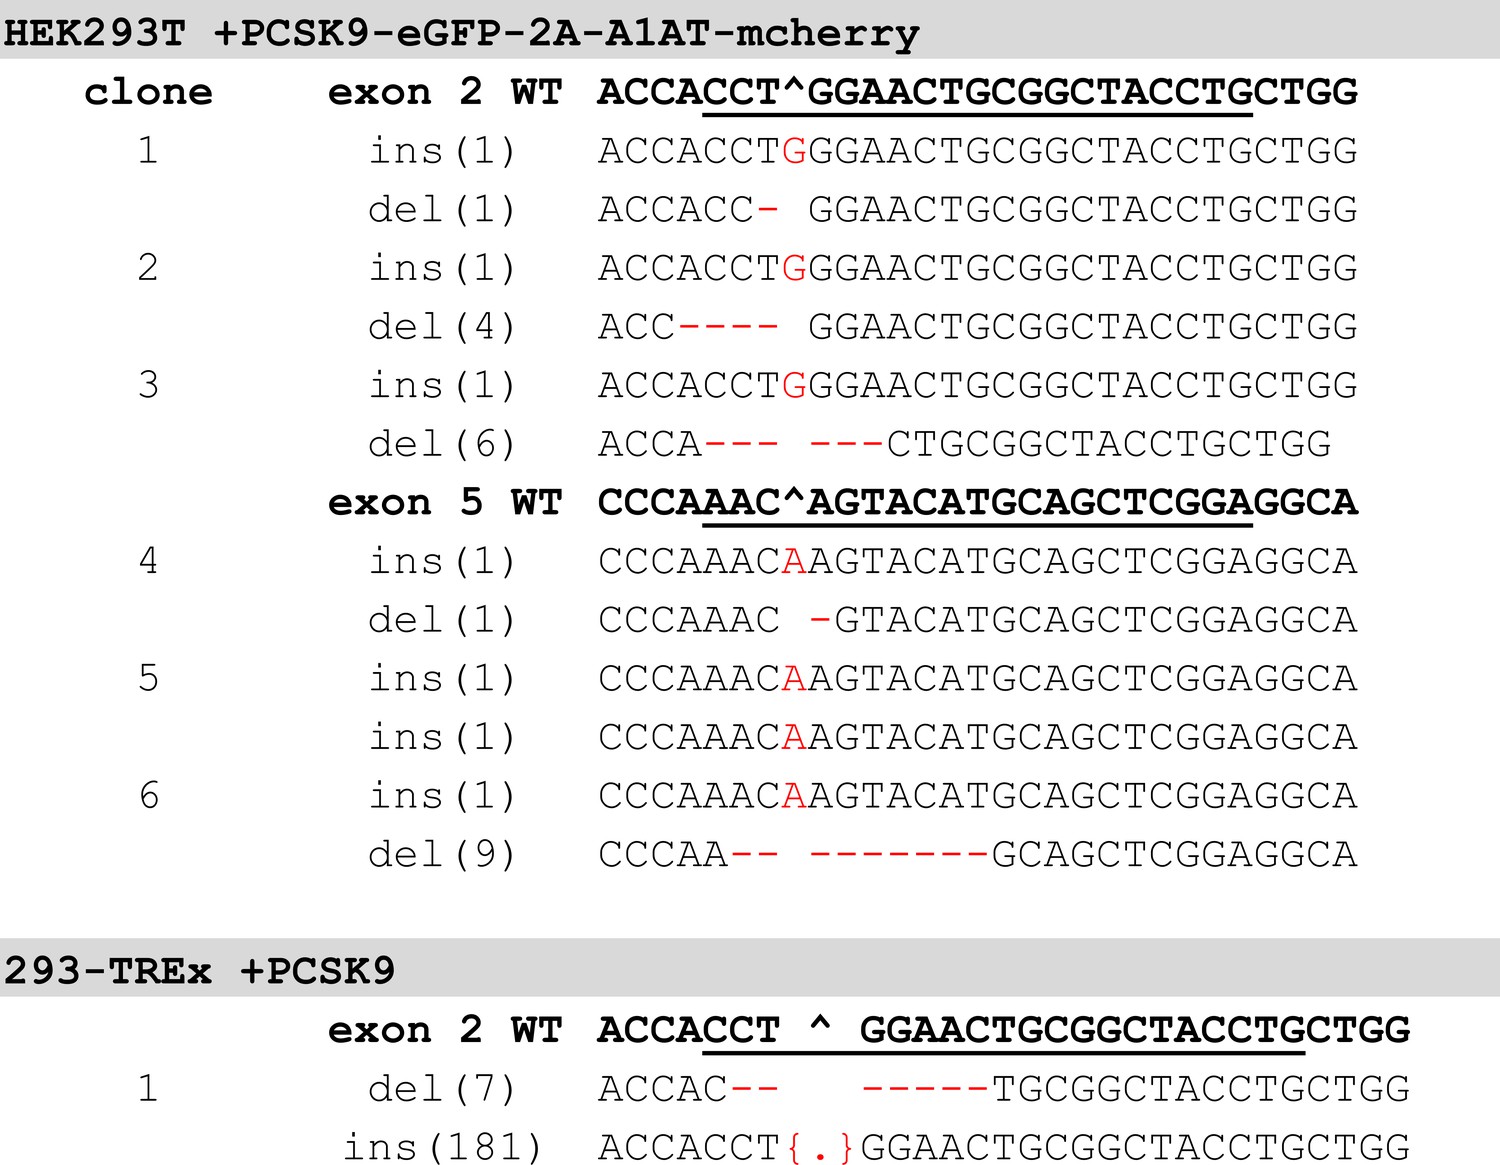
SURF4-deficient genotypes.
Clonal cell lines were genotyped by PCR amplification of sgRNA target site and Sanger sequencing of the amplicon with either TIDE decomposition of individual alleles from the amplicon, or ligation of the amplicon into cloning plasmids and Sanger sequencing of multiple individual clones. Sequence corresponding to sgRNA is underlined and expected double-strand break site is indicated (^).
Figure 4
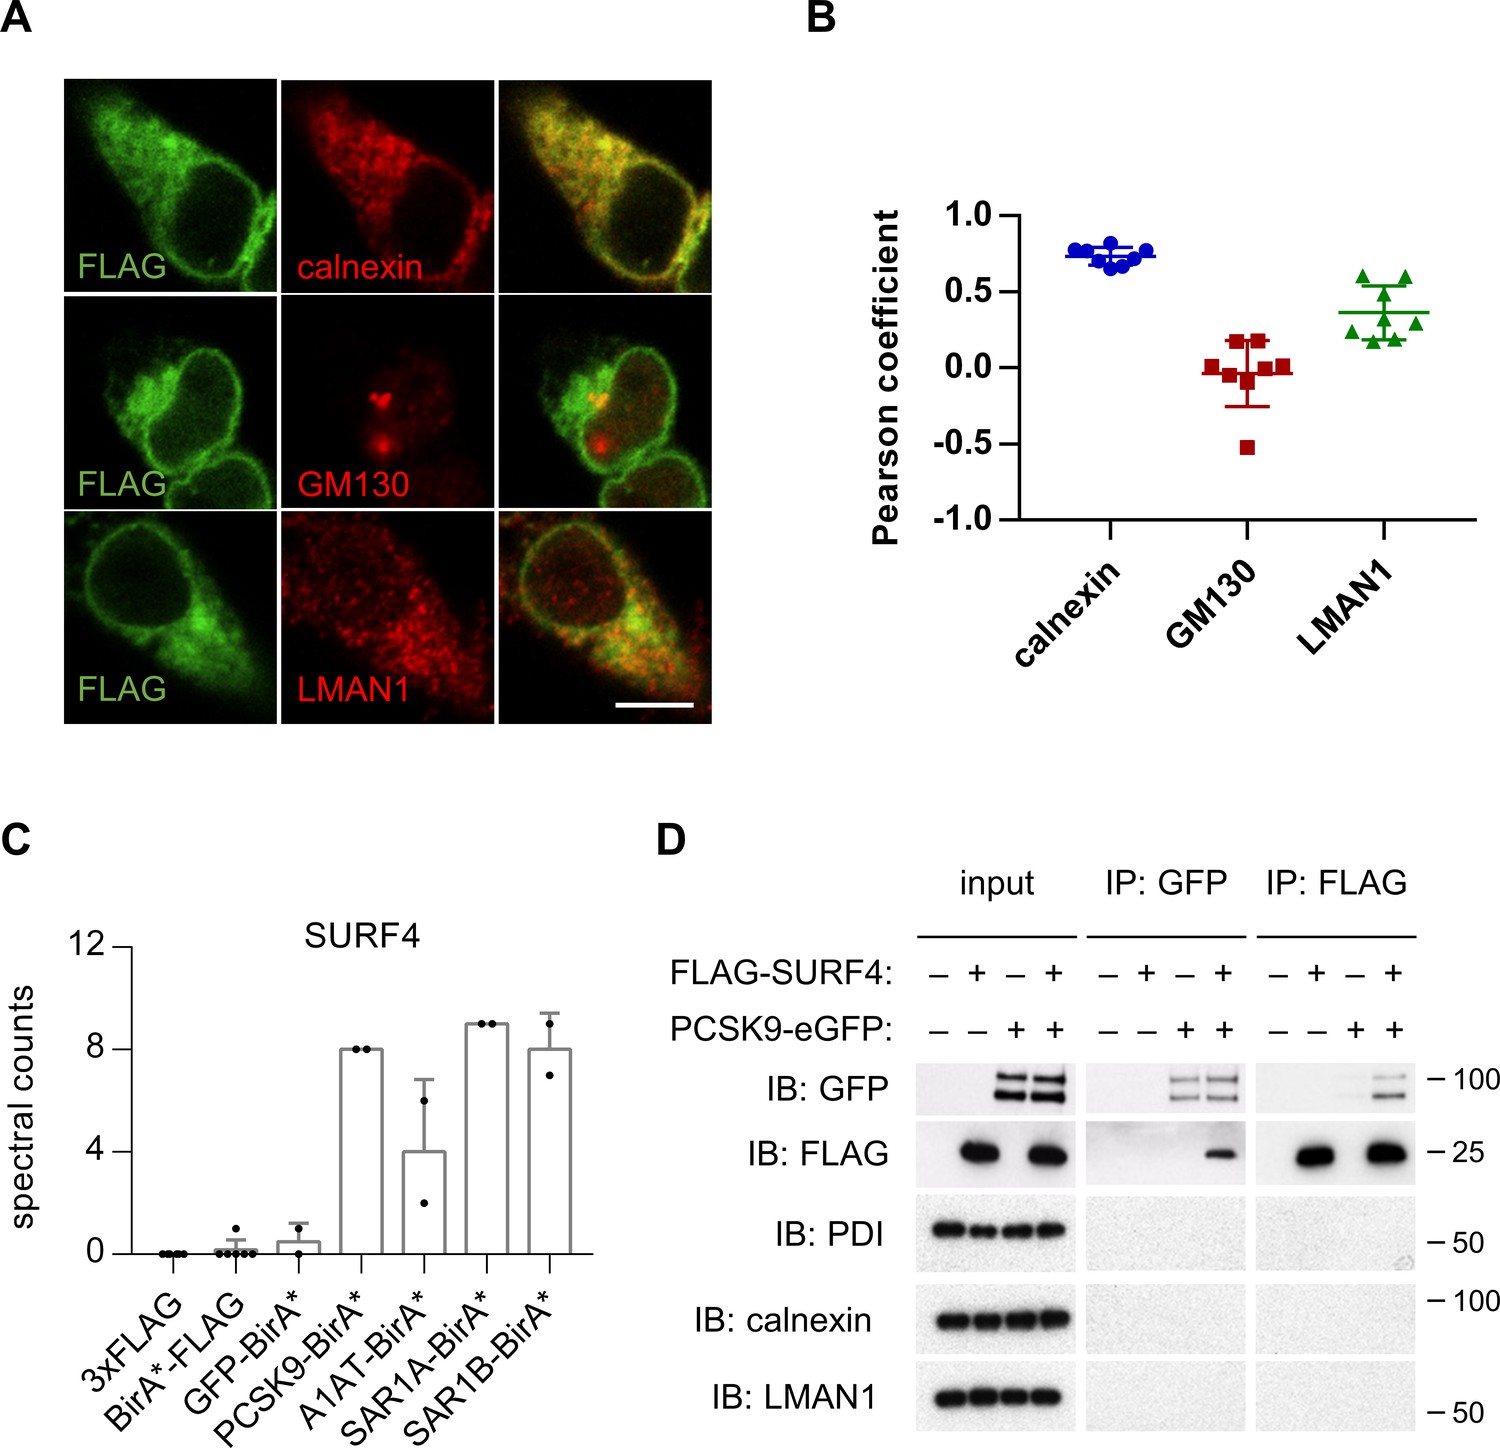
SURF4 localizes to the early secretory pathway where it physically interacts with PCSK9.
(A) Immunofluorescence of FLAG-SURF4 together with markers of the ER (calnexin), ERGIC (LMAN1), and Golgi (GM130). Scale bar = 10 µm. (B) Quantification of colocalization (n = 8 cells analyzed for each combination of antibody staining). (C) Spectral counts for SURF4 in streptavidin-purified eluates from cells expressing various BirA* fusion proteins. (D) Immunoprecipitations were performed using antibodies directed against FLAG or GFP from lysates of cells expressing FLAG-SURF4, PCSK9-eGFP, both, or neither. Error bars represent standard deviations.
Figure 5 with 2 supplements
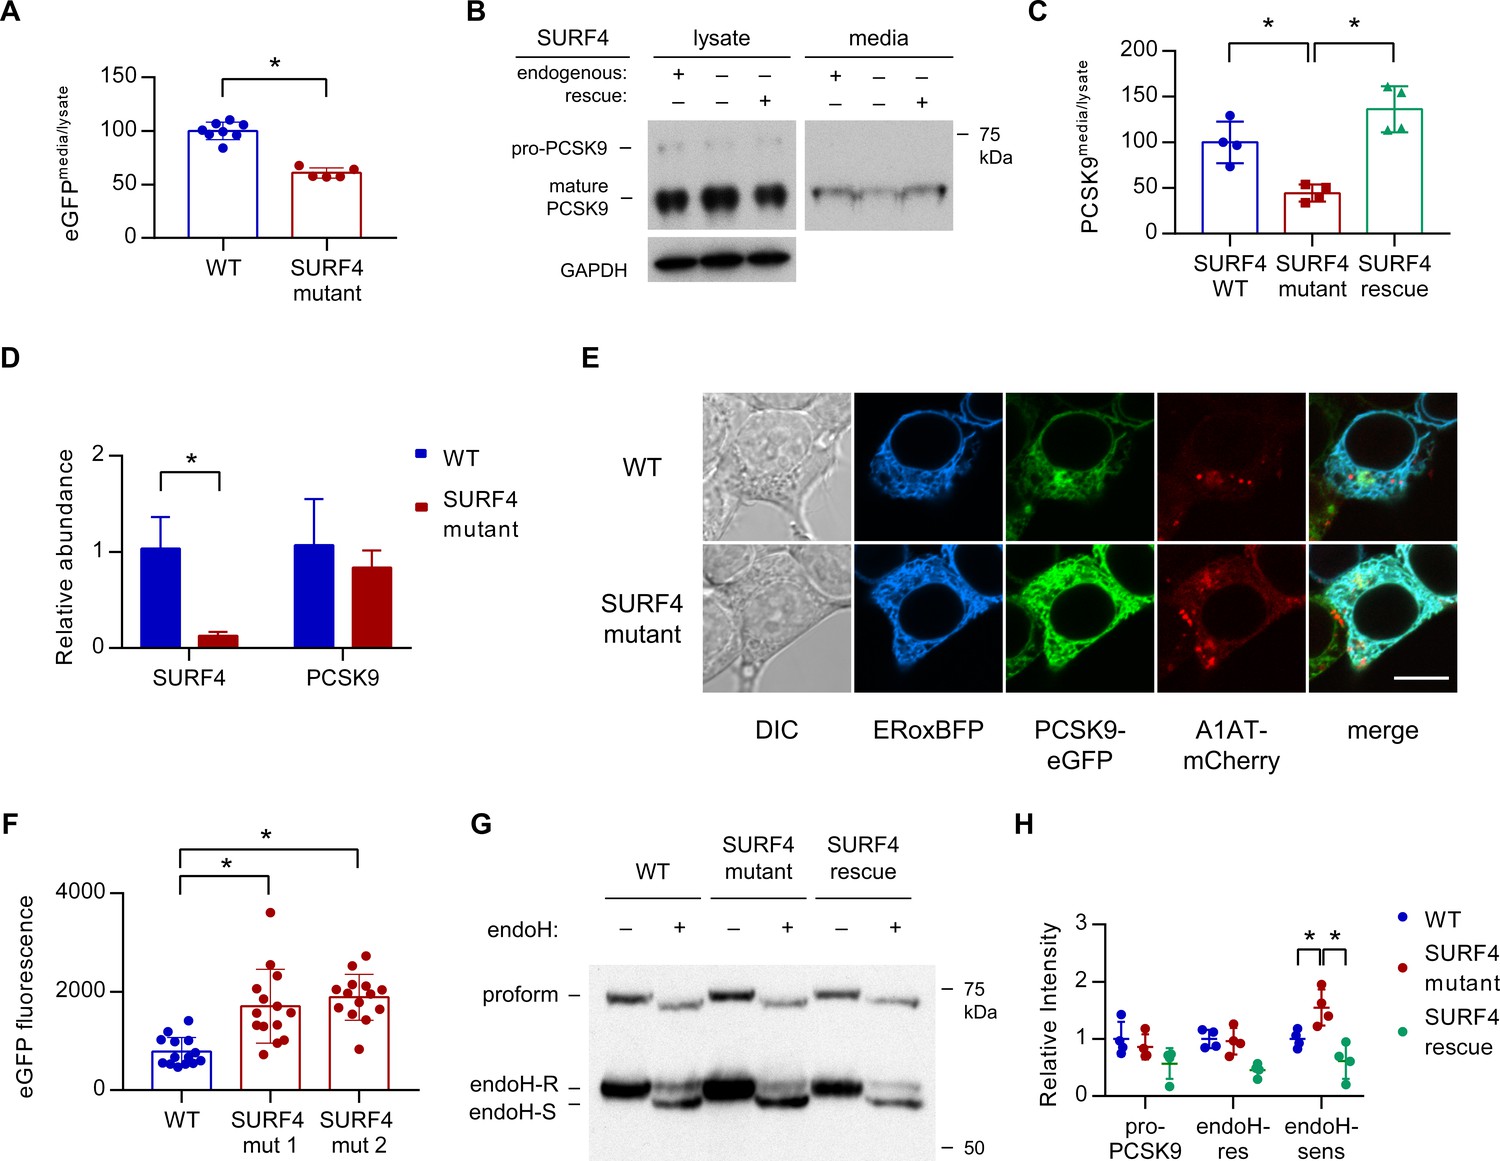
SURF4 mutagenesis causes a decrease in PCSK9 extracellular secretion and an accumulation of PCSK9 in the ER.
(A) Fluorescence detection of PCSK9-eGFP in extracellular conditioned media relative to cellular lysate in WT (n = 7) and clonal SURF4-deficient (n = 5) fluorescent reporter cell lines. (B) Immunoblotting of tetracycline-inducible PCSK9 in extracellular conditioned media and cellular lysates from WT, SURF4-deficient, or SURF4 rescued cells. (C) Quantification of densitometry of native PCSK9 relative in conditioned media and cellular lysates, normalized to GAPDH, for WT, SURF4-deficient, or SURF4 rescued cells (n = 4 biologic replicates for each cell line). (D) Quantitative PCR of SURF4 and PCSK9 transcript levels from RNA isolated from a SURF4 WT or mutant fluorescent reporter cell line (n = 3 measurement replicates). (E) Live cell fluorescence microscopy of fluorescent reporter cells, either WT or SURF4-deficient, transfected with the ER marker ERoxBFP. Scale bar = 10 µm. (F) Quantification of PCSK9-eGFP signal intensity in pixels positive for ERoxBFP fluorescence (n = 14 for each cell line). (G) EndoH-sensitivity of PCSK9 expressed in WT, SURF4-deficient, or SURF4 rescued cells. (H) Quantification of endoH-sensitivity, normalized to average intensity of average WT band intensity (n = 4 biologic replicates for each cell line). *p<0.05 by Student’s t-test. Error bars represent standard deviations.
Figure 5—figure supplement 1
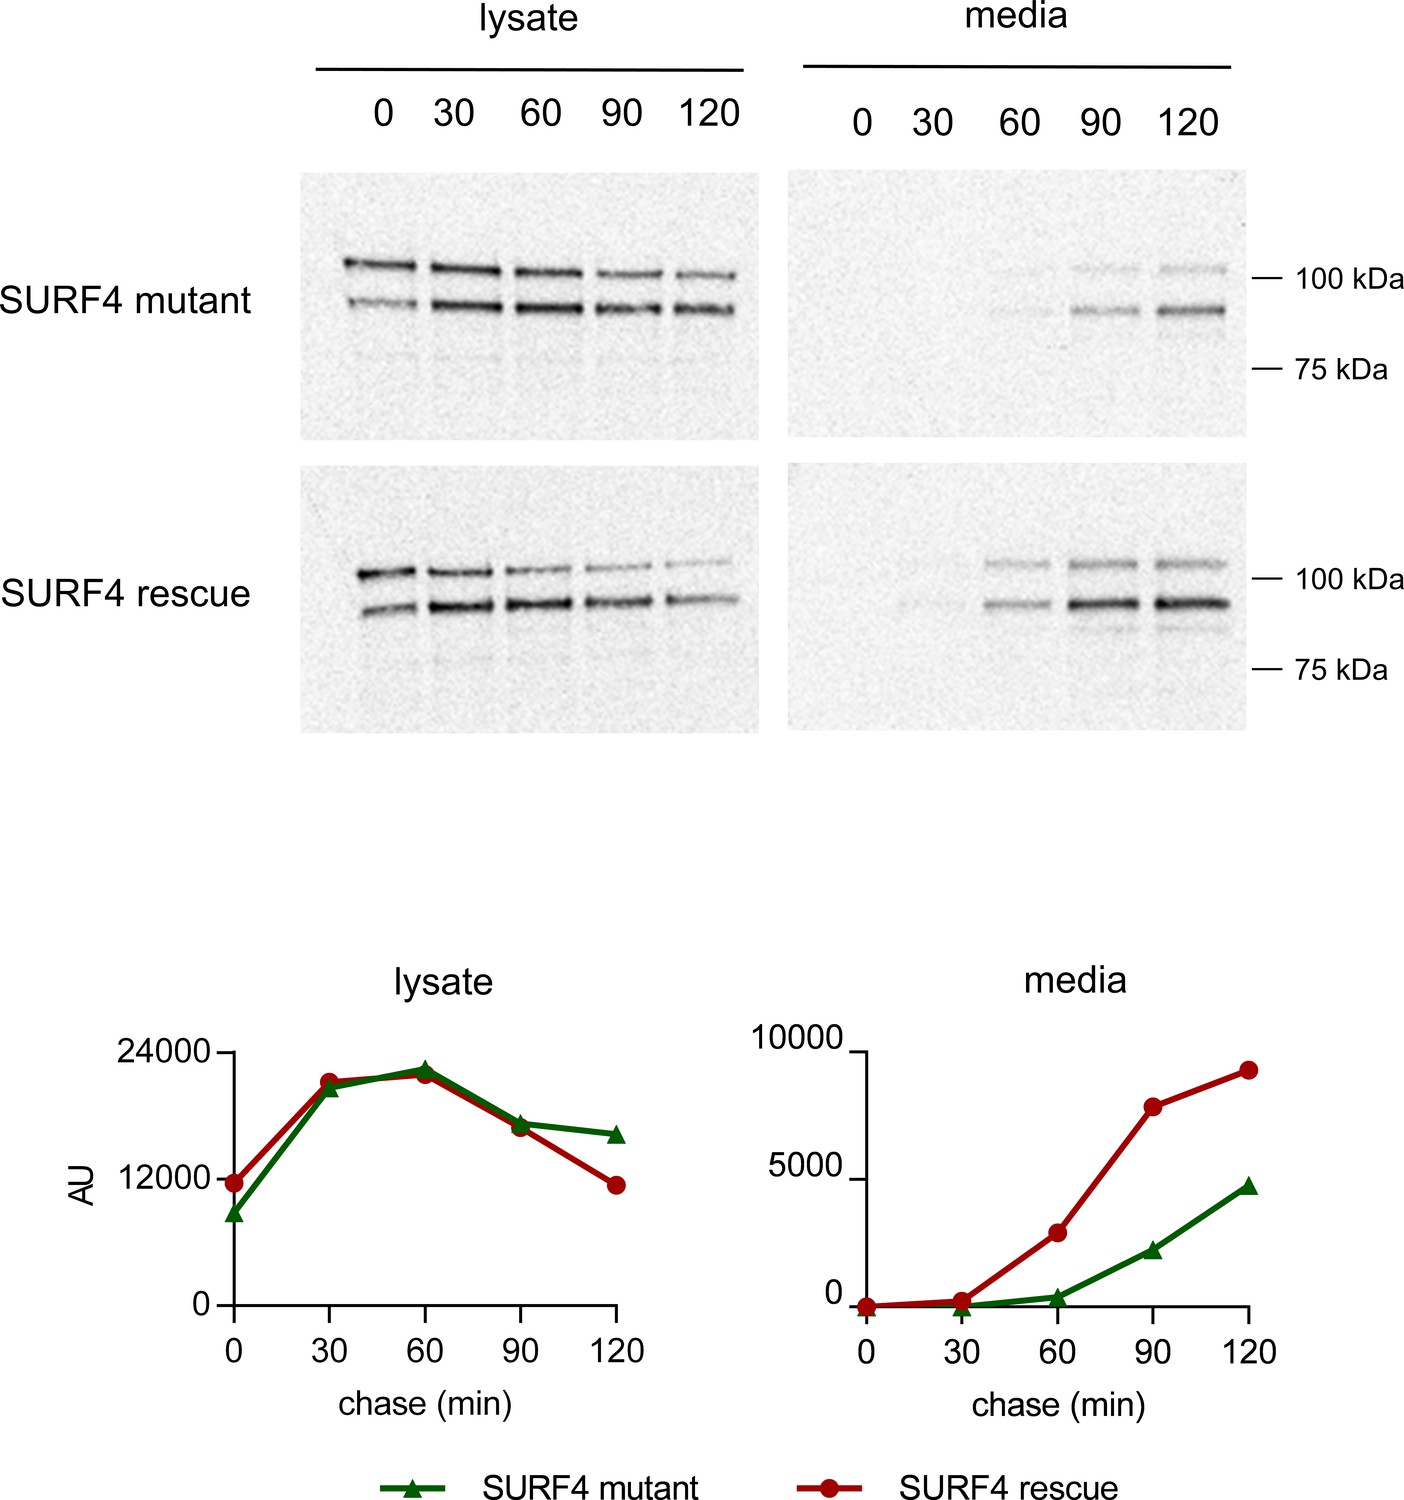
Pulse-chase labeling of PCSK9-eGFP secretion.
A SURF4 mutant cell line with a tetracycline-inducible PCSK9-eGFP construct and with (SURF4 rescue) or without (SURF4 mutant) a stably integrated SURF4 cDNA were radiolabeled with tracer containing 35S-Met and 35S-Cys. Conditioned media and cellular lysates were harvested at the indicated time points and PCSK9-eGFP immunoprecipitated and analyzed by SDS-PAGE electrophoresis and autoradiography.
Figure 5—figure supplement 2
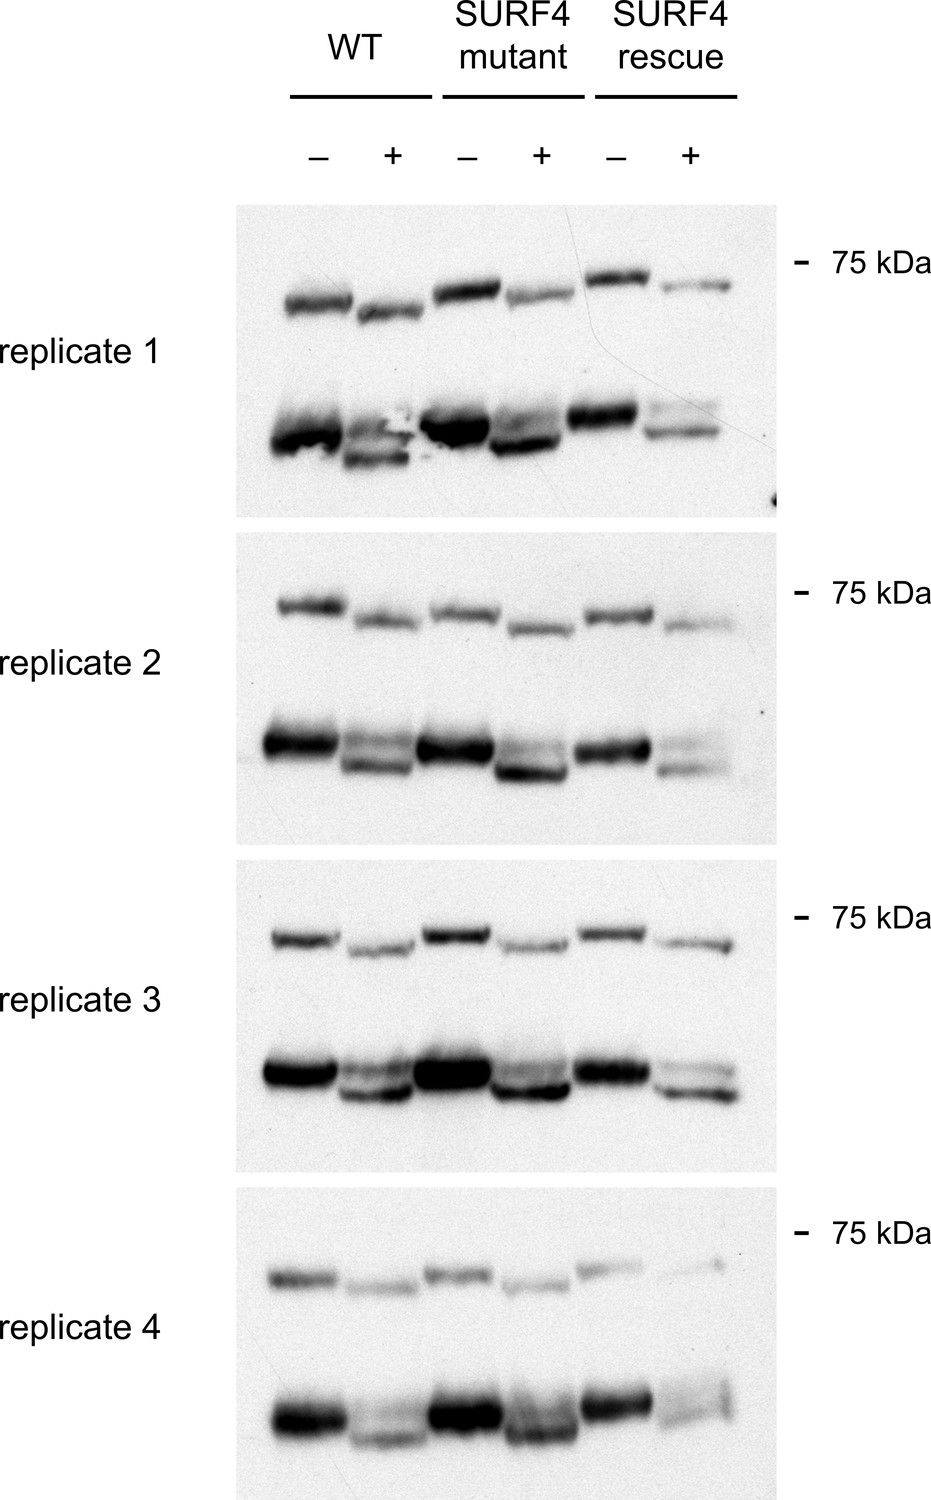
EndoH-sensitivity of PCSK9 expressed in WT, SURF4-deficient, or SURF4 rescued cells for each of 4 independent biologic replicates.
https://doi.org/10.7554/eLife.38839.013Tables
Key resources table
| Reagent type (species) or resource | Designation | Source or reference | Identifiers | Additional information |
|---|---|---|---|---|
| Gene (Homo sapiens) | PCSK9 | NA | Uniprot Q8NBP7 | |
| Gene (Homo sapiens) | A1AT | NA | Uniprot P01009 | |
| Gene (Homo sapiens) | SURF4 | NA | Uniprot O15260 | |
| Cell line (Homo sapiens) | HEK293T | ATCC | RRID:CVCL_1926 | |
| Cell line (Homo sapiens) | T-Rex-293 | Invitrogen | RRID:CVCL_D585 | |
| Antibody | anti-PCSK9 (rabbit polyclonal) | Cayman Chemical | RRID:AB_569536 | (1:1000) |
| Antibody | anti-GFP (rabbit monoclonal) | Abcam | RRID:AB_303395 | (1:5000) |
| Antibody | anti-mCherry (rabbit polyclonal) | Abcam | RRID:AB_2571870 | (1:1000) |
| Antibody | anti-GAPDH (rabbit monoclonal) | Abcam | RRID:AB_2630358 | (1:10,000) |
| Antibody | anti-β-actin (mouse monoclonal) | Santa Cruz | RRID:AB_2714189 | (1:10,000) |
| Antibody | anti-LMAN1 (rabbit monoclonal) | Abcam | RRID:AB_10973984 | (1:5000) |
| Antibody | anti-calnexin (rabbit monoclonal) | Cell Signaling | RRID:AB_2228381 | (1:2000) |
| Antibody | anti-GM130 (rabbit monoclonal) | Abcam | RRID:AB_880266 | (1:1000) |
| Antibody | anti-BiP (rabbit monoclonal) | Abcam | RRID:AB_10859806 | (1:5000) |
| Antibody | anti-PDI (rabbit monoclonal) | Cell Signaling | RRID:AB_2156433 | (1:1000) |
| Antibody | HRP-conjugated anti- FLAG (goat polyclonal) | Abcam | RRID:AB_299061 | (1:10,000) |
| Antibody | HRP-conjugated anti- mouse secondary (goat polyclonal) | BioRad | RRID:AB_11125547 | (1:5000) |
| Antibody | HRP-conjugated anti- rabbit IgG (goat polyclonal) | BioRad | RRID:AB_11125142 | (1:5000) |
| Antibody | FITC-conjugated anti- FLAG (mouse monoclonal) | Sigma | RRID:AB_439701 | (1:500) |
| Antibody | Alexa647-conjugated anti-rabbit secondary (donkey polyclonal) | Abcam | ab150075 | (1:500) |
| Recombinant DNA reagent | pLentiCRISPRv2 | Addgene | 52961 | |
| Recombinant DNA reagent | pX459 | Addgene | 62988 | |
| Recombinant DNA reagent | pNLF-C1 | Promega | E1361 | |
| Recombinant DNA reagent | pDEST-pcDNA5-BirA-FLAG-C-term | PMID 24255178 | ||
| Recombinant DNA reagent | pENTR/D-TOPO | Invitrogen | K2400-20 | |
| Chemical compound, drug | brefeldin A | BioLegend | 420601 | |
| Chemical compound, drug | dithiobis(succinimidyl propionate) | Pierce | 22586 |
Additional files
-
Supplementary file 1
BioID of PCSK9-interacting proteins.
Spectral counts are listed for prey proteins identified from streptavidin-purified lysates of cells expressing fusions of BirA* with GFP, PCSK9, A1AT, SAR1A, and SAR1B. Gene Ontology enrichment analysis (Ashburner et al., 2000; The Gene Ontology Consortium, 2017) is displayed for candidate PCSK9 cargo receptors.
- https://doi.org/10.7554/eLife.38839.014
-
Supplementary file 2
CRISPR screen sgRNA-level analysis.
DESeq2 output for each sgRNA showing normalized mapped reads in control (GFP-low) populations and log2 fold-change in experiment (GFP-high) populations with significance testing for enrichment or depletion. A copy of the reference library showing the corresponding gene target and target sequence and gene for each sgRNA is included.
- https://doi.org/10.7554/eLife.38839.015
-
Supplementary file 3
CRISPR screen gene-level analysis.
Enrichment for each sgRNA targeting the same gene was combined to generate a gene-level enrichment score using MAGeCK (Li et al., 2014), which is displayed in the column corresponding to the number of unique sgRNA targeting that same that demonstrated enrichment (p<0.05) by analysis with DESeq2 (Supplementary file 2).
- https://doi.org/10.7554/eLife.38839.016
-
Supplementary file 4
Oligonucleotide sequences.
Primers used for CRISPR/Cas9 targeting and genotyping are displayed.
- https://doi.org/10.7554/eLife.38839.017
-
Source code 1
gRNA_mapping.zip
- https://doi.org/10.7554/eLife.38839.018
-
Transparent reporting form
- https://doi.org/10.7554/eLife.38839.019
Download links
A two-part list of links to download the article, or parts of the article, in various formats.
Downloads (link to download the article as PDF)
Open citations (links to open the citations from this article in various online reference manager services)
Cite this article (links to download the citations from this article in formats compatible with various reference manager tools)
The cargo receptor SURF4 promotes the efficient cellular secretion of PCSK9
eLife 7:e38839.
https://doi.org/10.7554/eLife.38839


